Recently, when expected to choose a wildlife species for behavioral observation for one of my Oregon State University graduate courses, I immediately chose harbor seals as my focus. Harbor seals (Fig 1) are an abundant species and in proximity to the Hatfield Marine Science Center (HMSC) (Steingass et al., 2019) where I will be spending much of my time this summer, making logistics easy. Studying pinnipeds (marine mammals with a finned foot, seals, walrus, and sea lions) is appealing due to their undeniably cute physique, floppy nature on land, and super agile nature in the water. I am working to iron out my methods for this study, which I hope to work through in this initial phase of my research project.
Figure 1. Harbor seal hauling out to rest on rocks off Oregon Coast near HMSC.
Behaviors:
At times it can appear that the most interesting harbor seal behaviors occur under water, and the haul out time is simply time for resting. During mating season, most adult seal behaviors take place in the water, such as the incredible vocal acoustics displayed by the males to attract the females (Matthews et al., 2018). However, I hypothesize that young pups can capitalize on haul out time by practicing becoming adults (while the adults are taking that time to rest) and therefore I plan to observe their haul out behaviors in their first summer of life. Specifically, I will document seal pup vocal behavior to evaluate how they are learning to use sound. I am beginning this study in late July, which is just after pupping season (Granquist et al., 2016). This should give me the opportunity to find pups along the Oregon coast near HMSC, so I intend to visit several locations where harbor seals are known to frequently haul out. Knowing that field work and animal behavior is unpredictable, there is no telling what behaviors I will observe on a given day, or if I will see seals at all. Some days I could come home with lots of seal data and great photos, and other days I could come home with little to report. This will be my first hurdle combined with my time limit (strictly completing this observation in the next five weeks). I intend to schedule at least eight hours of field observation at haul-out sites over the next two weeks and will adjust my schedule based on my success in data collection at that point.
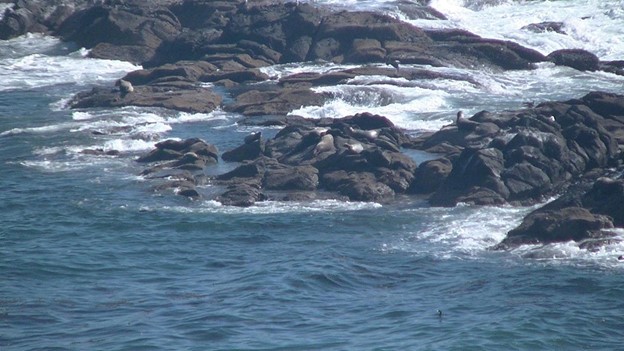
Figure 2. Harbor Seals hauling out on rocks not too far from HMSC.
Timing:
Prior knowledge on harbor seal haul-out sites along the Oregon coast is clearly important for this project’s success, but I must also pay close attention to the tide cycles. During low tides, haul out locations are exposed and occupied by seals. When the tide is high, the seals are less likely to haul-out (Patterson et al., 2008). Furthermore, according to a recent study conducted on harbor seals residing on the Oregon coast, these seals spend on average 71% of their time in the water and will haul-out for the remainder of their time (Steingass et al., 2019). Therefore, it is crucial to maximize my observation time of hauled out pups wisely.
Concerning timing, I also need to observe locations and periods without too many tourists who can get near the haul-out site. As I learned recently, when children show up and start throwing rocks into the water near where harbor seals are swimming, the seals will recede from the area and no longer be available for observation. As an experiment, I waited for the noisy crowds with unchecked children to leave and only myself, my trusty sidekick (my daughter), and one quiet photographer were left on the beach. Once that happened, we noticed more and more seal heads popping up out of the water. Then they came closer and closer to the beach, splashing around doing somersaults visibly on the surface of the water. It was quite a show. I will either need to account for the presence of humans when evaluating seal behavior or assess only periods without disturbance. Seal pups are easily disturbed by humans, so I will keep a non-invasive distance while positioning myself to hear the vocals.
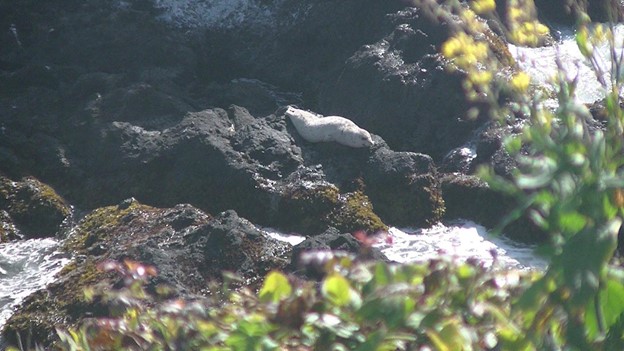
Figure 3. Hauled-out adult harbor seal on the Oregon coast near HMSC.
Data Collection and Analysis Approach:
The aspect of this project I am still working out is how to quantify pup vocalizations and their associated behaviors. As I mentioned, I will go out each week for eight hours and record each time I notice a pup exhibiting vocal behavior. I will categorize and describe the sound produced by the pup, and document any associated behavior of the pup or behavioral responses from nearby adult seals. Prior research has found that harbor seals are much attuned to vocal behavior. Mother harbor seals learn to quickly distinguish their own pup’s call within a few days of their birth (Sauve et al. 2015). I hypothesize that pups themselves can discern and use vocalizations, and I am excited to watch them develop over the course of my field observations.
Figure 4. Seal pup on the far-left rock, watching the adults as they appear to rest.
References
Granquist, S.M., & Hauksson, E. (2016). Seasonal, meteorological, tidal, and diurnal effects on haul-out patterns of harbour seals (Phoca vitulina) in Iceland. Polar Biology, 39 (12), 2347-2359.
Matthews, L.P., Blades, B., Parks, S. (2018). Female harbor seal (Phoca vitulina) behavioral response to playbacks of underwater male acoustic advertisement displays. PeerJ, 6, e4547.
Patterson, J., Acevedo-Gutierrez, A. (2008). Tidal influence on the haul-out behavior of harbor seals (Phoca vitulina) At all time levels. Northwestern Naturalist, 89 (1), 17-23.
Sauve, C., Beauplet, G., Hammil, M., Charrier, I. (2015). Mother-pup vocal recognition in harbour seals: influence of maternal behavior, pup voice and habitat sound properties. Animal Behavior, 105 (July 2015), 109-120
Steingass, S., Horning, M., Bishop, A. (2019). Space use of Pacific harbor seals (Phoca vitulina richardii) from two haulout locations along the Oregon coast. PloS one. 14 (7), e0219484.
Allison Dawn, new GEMM Lab Master’s student, OSU Department of Fisheries, Wildlife and Conservation Sciences, Geospatial Ecology of Marine Megafauna Lab
While standing at the Stone Shelter at the Saint Perpetua Overlook in 2016, I took in the beauty of one of the many scenic gems along the Pacific Coast Highway. Despite being an East Coast native, I felt an unmistakable draw to Oregon. Everything I saw during that morning’s hike, from the misty fog that enshrouded evergreens and the ocean with mystery, to the giant banana slugs, felt at once foreign and a place I could call home. Out of all the places I visited along that Pacific Coast road trip, Oregon left the biggest impression on me.
Figure 1. View from the Stone Shelter at the Cape Perpetua Overlook, Yachats, OR. June 2016.
For my undergraduate thesis, which I recently defended in May 2021, I researched blue whale surface interval behavior. Surface interval events for oxygen replenishment and rest are a vital part of baleen whale feeding ecology, as it provides a recovery period before they perform their next foraging dive (Hazen et al., 2015; Roos et al., 2016). Despite spending so much time studying the importance of resting periods for mammals, that 2016 road trip was my last true extended resting period/vacation until, several years later in 2021, I took another road trip. This time it was across the country to move to the place that had enraptured me.
Now that I am settled in Corvallis, I have reflected on my journey to grad school and my recent road trip; both prepared me for a challenging and exciting new chapter as an incoming MSc student within the Marine Mammal Institute (MMI).
Part 1: Journey to Grad School
When I took that photo at the Cape Perpetua Overlook in 2016, I had just finished the first two semesters of my undergraduate degree at UNC Chapel Hill. As a first-generation, non-traditional student those were intense semesters as I made the transition from a working professional to full-time undergrad.
By the end of my freshman year I was debating exactly what to declare as my major, when one of my marine science TA’s, Colleen, (who is now Dr. Bove!), advised that I “collect experiences, not degrees.” I wrote this advice down in my day planner and have never forgotten it. Of course, obtaining a degree is important, but it is the experiences you have that help lead you in the right direction.
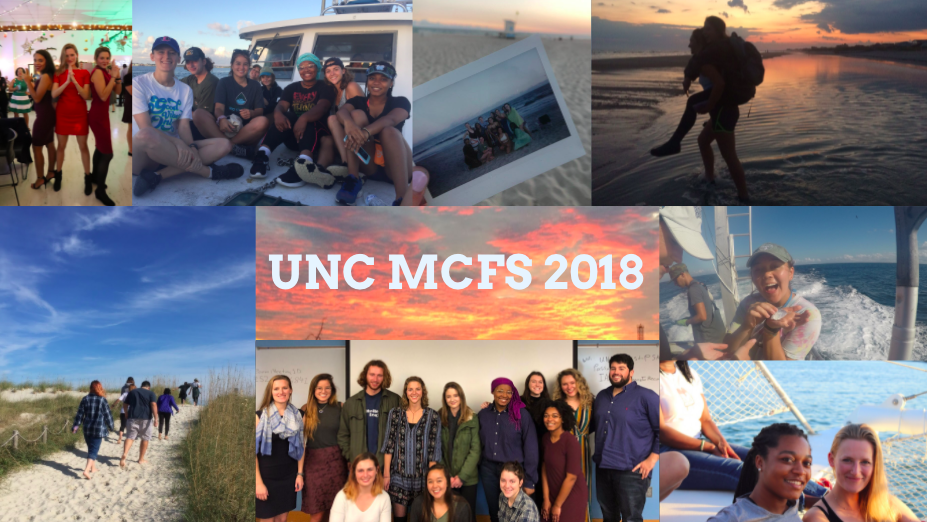
That advice was one of the many reasons I decided to participate in the Morehead City Field Site program, where UNC undergraduates spend a semester at the coast, living on the Duke Marine Lab’s campus in Beaufort, NC. During that semester, students take classes to fulfill a marine science minor while participating in hands-on research, including an honors thesis project. The experience of designing, carrying out, and defending my own project affirmed that graduate school in the marine sciences was right for me. As I move into my first graduate TA position this fall, I hope to pay forward that encouragement to other undergraduates who are making decisions about their own future path.
Figure 2. Final slide from my honors thesis defense. UNC undergraduates, and now fellow alumni, who participated in the Morehead City Field Site program in Fall 2018.
Part 2: Taking a Breather
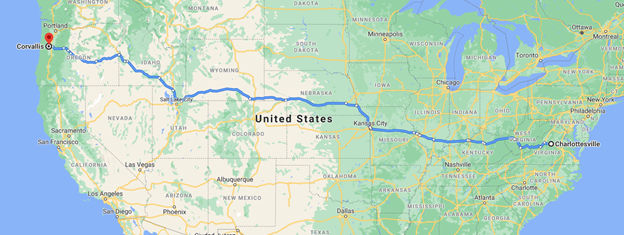
Like the GEMM Lab’s other new master’s student Miranda, my road trip covered approximately 2,900 miles. I was solo for much of the drive, which meant there was no one to argue when I decided to binge listen to podcasts. My new favorite is How To Save A Planet, hosted by marine biologist Dr. Ayana Elizabeth Johnson and Alex Blumberg. At the end of each episode they provide a call to action & resources for listeners – I highly recommend this show to anyone interested in what you can do right now about climate change.
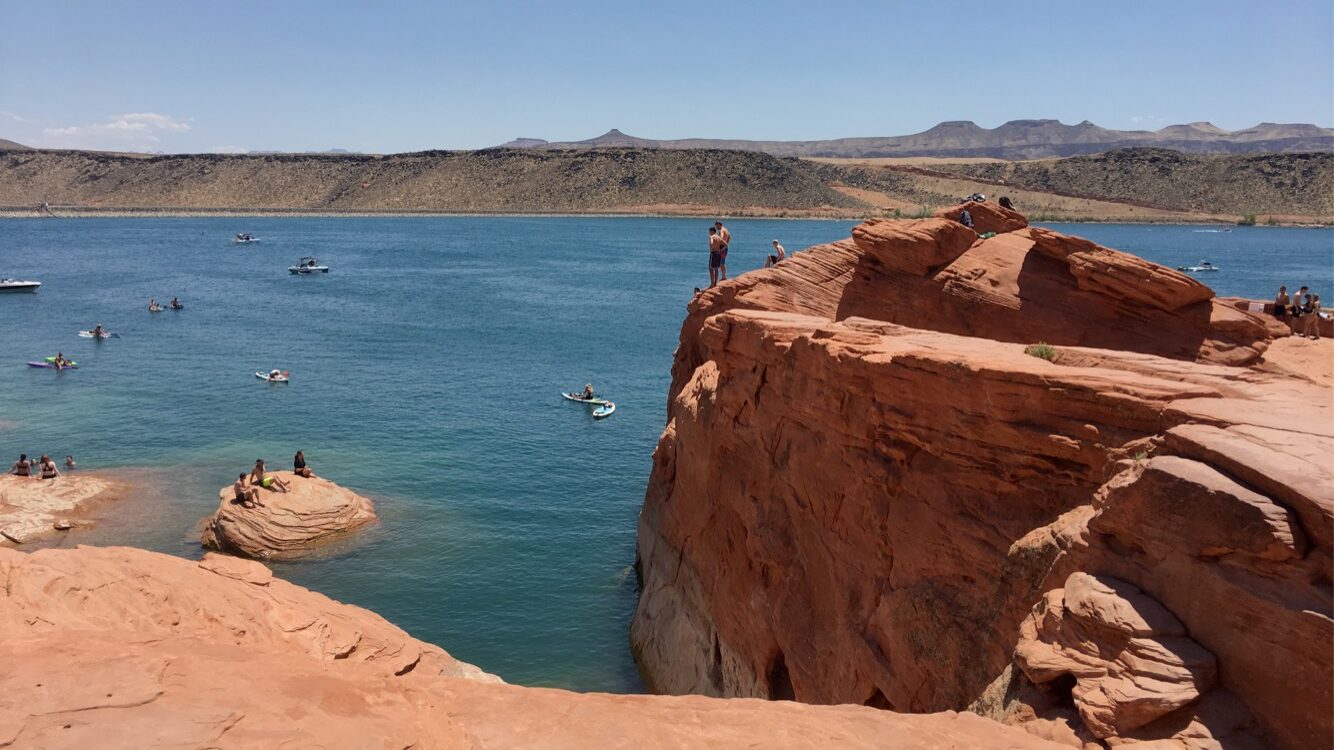
Along my trip I took a stop in Utah to visit my parents. I had never been to a desert basin before and engaged in many desert-related activities: visiting Zion National Park, hiking in 116-degree heat, and facing my fear of heights via cliff jumping.
Figure 3. Sandstone Rocks at Sand Hollow National Park, Hurricane, Utah. June 2021.
My parents wanted to help me settle into my new home, as parents do, so we drove the rest of the way to Oregon together. As this would be their first visit to the state, we strategically planned a trip to Crater Lake as our final scenic stop before heading into Corvallis.
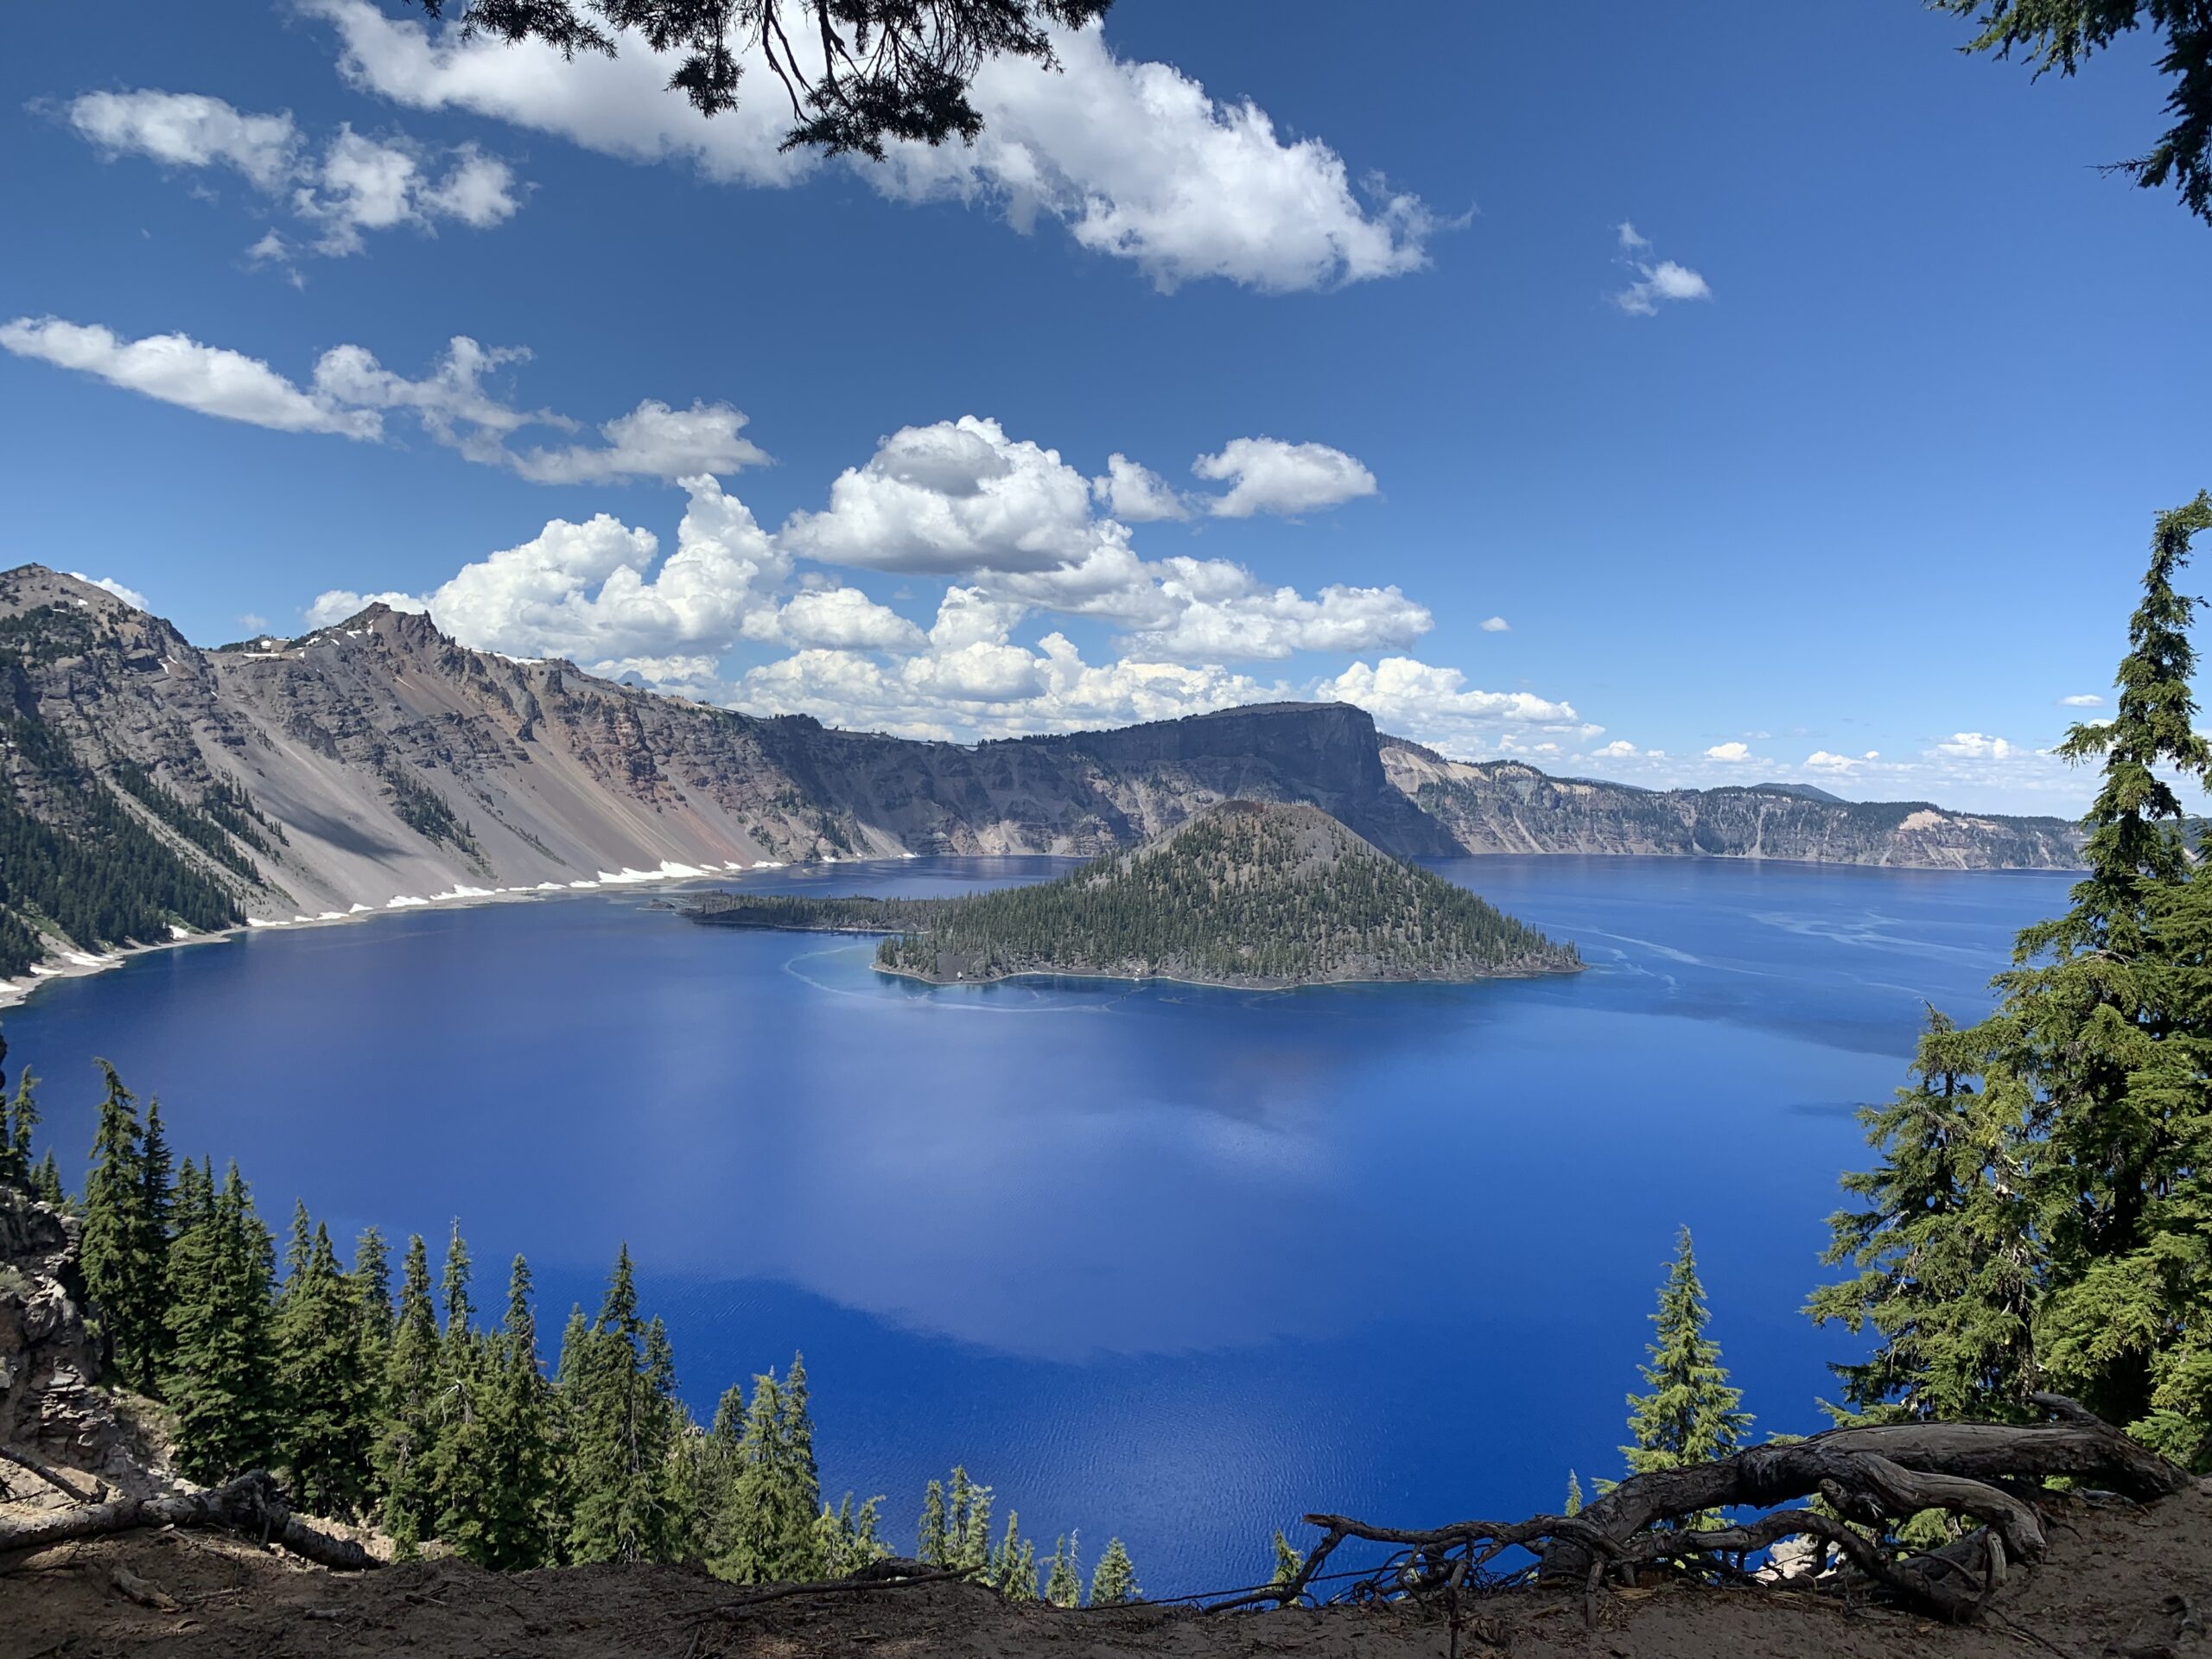
Figure 4. Wizard Island in Crater Lake National Park, Klamath County, OR. June 2021.
This time off was filled with adventure, yet was restorative, and reminded me the importance of taking a break. I feel ready and refreshed for an intense summer of field work.
Part 3: Rested and Ready
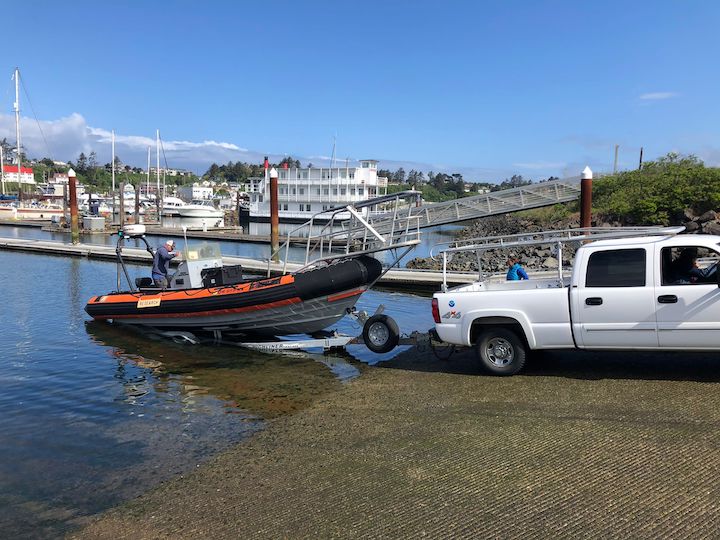
Despite accumulating skills to do research in the field over the years, I have yet to do marine mammal field work (or even see a whale in person for that matter.) My mammal research experience included analyzing drone imagery, behind a computer, that had already been captured. As you can imagine, I am extremely excited to join the Port Orford team as part of the TOPAZ/JASPER projects this summer, collecting ecological data on gray whales and their prey. I will be learning the ropes from Lisa Hildebrand and soaking up as much information as possible as I will be taking over as lead for this project next year.
It will take some time before my master’s thesis is fully developed, but it will likely focus on assessing the environmental factors that influence gray whale zooplankton prey availability, and the subsequent impacts on whale movements and health. For five years, the Port Orford project has conducted GoPro drops at 12 sampling stations to collect data on zooplankton relative abundance.
Figures 5 & 6. GEMM GoPro drop stick assembly and footage demonstrating mysid data collection. July 2021.
Paired with this GoPro is a Time-Depth Recorder (TDR) that provides temperature and depth data. The 2021 addition to this GoPro system is a new dissolved oxygen (DO) sensor the GEMM Lab has just acquired. This new piece of equipment will add to the set of parameters we can analyze to describe what and how oceanographic factors drive prey variability and gray whale presence in our study site.My first task as a GEMM Lab student is to get to know this DO sensor, figure out how it works, set it up, test it, attach it to the GoPro device, and prepare it for data collection during the upcoming Port Orford project starting in 1 week!
Figure 7. The GEMM lab’s new RBR solo3 getting ready for Port Orford. July 2021.
Dissolved oxygen plays a vital role in the ocean; however, climate change and increased nutrient loading has caused the ocean to undergo deoxygenation. According to the IUCN’s 2019 Issues Brief, these factors have resulted in an oxygen decline of 2% since the middle of the 20th century, with most of this loss occurring within the first 1000 meters of the ocean. Two percent may not seem like much, but many species have a narrow oxygen threshold and, like pH changes in coral reef systems, even slight changes in DO can have an impact. Additionally, the first 1000 meters of the ocean contains the greatest amount of species richness and biodiversity.
Previous research done in a variety of systems (i.e., estuarine, marine, and freshwater lakes) shows that dissolved oxygen concentrations can have an impact on predator-prey interactions, where low dissolved oxygen results in decreased predation (Abrahams et al., 2007; Breitburg et al., 1997; Domenici et al., 2007; Kramer et al., 1987); and changes in DO also change prey vertical distributions (Decker et al., 2004). In Port Orford, we are interested in understanding the interplay of factors driving zooplankton community distribution and abundance while investigating the trophic interaction between gray whales and their prey.
I have spent some time with our new DO sensor and am looking forward to its first deployments in Port Orford! Stay tuned for updates from the field!
References
Abrahams, M. V., Mangel, M., & Hedges, K. (2007). Predator–prey interactions and changing environments: who benefits?. Philosophical Transactions of the Royal Society B: Biological Sciences, 362(1487), 2095-2104.
Breitburg, D. L., Loher, T., Pacey, C. A., & Gerstein, A. (1997). Varying effects of low dissolved oxygen on trophic interactions in an estuarine food web. Ecological Monographs, 67(4), 489-507.
Decker, M. B., Breitburg, D. L., & Purcell, J. E. (2004). Effects of low dissolved oxygen on zooplankton predation by the ctenophore Mnemiopsis leidyi. Marine Ecology Progress Series, 280, 163-172.
Domenici, P., Claireaux, G., & McKenzie, D. J. (2007). Environmental constraints upon locomotion and predator–prey interactions in aquatic organisms: an introduction.
Hazen, E. L., Friedlaender, A. S., & Goldbogen, J. A. (2015). Blue whales (Balaenoptera musculus) optimize foraging efficiency by balancing oxygen use and energy gain as a function of prey density. Science Advances, 1(9), e1500469.
Kramer, D. L. (1987). Dissolved oxygen and fish behavior. Environmental biology of fishes, 18(2), 81-92.
Roos, M. M., Wu, G. M., & Miller, P. J. (2016). The significance of respiration timing in the energetics estimates of free-ranging killer whales (Orcinus orca). Journal of Experimental Biology, 219(13), 2066-2077.
By Marc Donnelly, Carleton College, GEMM Lab REU Intern
My name is Marc Donnelly (He/Him) and this summer I have the pleasure of working with Clara Bird and Dr. Leigh Torres on a project, within the GRANITE project, that maps the habitat use of Pacific Coast Feeding Group (PCFG) gray whales. This summer, as a National Science Foundation (NSF) Research Experience for Undergraduates (REU) intern, I have the opportunity to learn about the scientific process in action, build relationships with researchers, and pursue my own research project. I am relatively new to the world of research and even more green in the field of marine science. In September, I will start my fourth and last year as an Environmental Studies major at Carleton College in Minnesota, but for the next seven weeks my bread and butter is whales. I could not be more excited about the road ahead. I have read about gray whales, examined pictures of them, and even studied videos of the oblong beauties (Video 1). But the one thing I have not done, and probably will not do this summer, is see one… or a boat for that matter, or a single piece of field equipment. Not in person anyway. This is because I am a remote intern. And before I continue, let me clarify that I am not lamenting unfortunate circumstances. These past three weeks have already been enjoyable, fulfilling and exciting and I expect the summer will only get better. Yet, like with so many people in the past 16 months, my expected role has undergone some changes, so I want to take this opportunity to share my experience so far.
Video 1. Examples of gray whale behaviors observed from the drone
Especially when thinking about engaging with hands-on work, a fundamental aspect of any research program is place. REUs are competitive and sought after positions because they supply undergrads, who have to balance coursework with the desire to fully immerse themselves in a research community, with the opportunity to pursue a genuine research experience. Just being in a room surrounded by peers, grad students, and seasoned scientists who are all bubbling over with excitement and ideas is a fundamentally different (and might I add more motivating) experience than classroom lectures. Location is enough by itself to facilitate the connection between a burgeoning scientist and their research community as well as their work itself. Conducting hands-on fieldwork is also a common, highly sought-after aspect of an REU. However, visiting study sites, collecting data, and experiencing your study organism first hand, are all activities that become impossible when working remotely. So what do you do when you lack the benefits of location?
Well, if you had any sense, you would start by furnishing your apartment, finding a mattress that you can sleep on and a table and a chair that you can work at. But if you are like me, 21 and excited to be living away from home in a new city, you might be so overcome with the idea of adventure that you forget sleeping is important. Beyond furniture, the course of my summer has primarily been in the hands of my new mentors at Oregon State University (OSU), the institution funding my position in the GEMM lab, and thankfully they had a much more robust plan for my summer than I did. Data analysis and an in depth literature review have filled the void where my marine mammal companions could have been. This situation does not mean that analyzing data and diving into the literature are not part of in-person internships as well, or that I am not able to build any sort of connection with the gray whales I study, but my computer screen has certainly taken a more central role in my work. This summer, Geographic Information Systems (GIS) software is my weapon of choice. My goal is to create habitat maps of the coastal waters off Newport where gray whales feed that includes characteristics ranging from the type of surface on the bottom of the ocean (i.e., sand, reef, rock, etc) to more ephemeral features like kelp and prey density. This list of features I will map is dynamic based on the purpose and time scale of the map (month, year, static); so suffice it to say I will be making a lot of maps this summer. Once I have produced these habitat maps, the team and I can compare them with our whale sightings to better understand if and how gray whales use certain areas. This work will help us develop a baseline for gray whale ecology, which will ultimately be used to inform disturbance models and conservation efforts.
Figure 1: Me finally getting a table and chair for work.
After finding a way to move work online, the next step is to somehow engineer a social environment that provides people with a sense of community. As explained to the interns during our first professional development workshop, forming these connections are not just important for combating feelings of isolation, but they may also serve as fruitful professional relationships in the near or distant future. After three terms of online classes and vain attempts at forming meaningful connections via awkward breakout rooms and forced group projects, I was preemptively lowering my expectations for how this summer might unfold. I should not have worried; both the GEMM lab and the greater REU cohort have been extraordinary. It has been such a privilege and joy to meet so many compassionate and involved people. Every week there are numerous opportunities for interns to engage with various groups associated with OSU. From one-on-one meetings with my mentors to laid back “coffee breaks” with folks from Oregon Sea Grant, engrossing interactions abound. I even had the chance to attend the Marine Mammal Institute Monthly Meeting, or MMIMM, which for a newcomer to the world of marine science is both a fascinating and intimidating thing to watch unfold.
One of my favorite virtual gatherings of all was our monthly GEMM lab meeting, this month our activity involved brief presentations introducing ourselves and our research. If you are a fan of this blog and have had the opportunity to explore the happenings of the GEMM lab through this page, then you probably have some context to understand the excitement and curiosity I felt while listening about the current GEMM projects through my zoom screen. I was simultaneously humbled and comforted by the impressiveness of the work being undertaken by this group of researchers. Even though I was just being exposed to five-minute overviews of people’s work, it was daunting to compare my own limited knowledge to that of the other people on the call. Most of them have been studying marine megafauna for five years or more and their passion coupled with their grasp on their work was remarkable. I was also comforted by the descriptions of all these wonderful and intriguing projects because it gave me a sense of achievement. This feeling may sound silly, but just by virtue of being on a zoom call with such passionate scientists I felt relieved. Relieved because it seemed as though this community is what I had been working towards for the last few years. Not necessarily the GEMM lab in particular, but a community of inspiring people who care about each other, their work, and improving the world.
Despite the fact that they do not know what I look like from the shoulders down, my GEMM lab cohort has welcomed me into their midst and provided me with the tools and environment I need to connect and learn. I am grateful.
Dr. KC Bierlich, Postdoctoral Scholar, OSU Department of Fisheries, Wildlife, & Conservation Sciences, Geospatial Ecology of Marine Megafauna Lab
The morphology and body size of an animal is one of the most fundamental factors for understanding a species ecology. For instance, fish body size and fin shape can influence its habitat use, foraging behavior, prey type, physiological performance, and predator avoidance strategies (Fig 1). Morphology and body size can thus reflect details of an individual’s current health, likelihood of survival, and potential reproductive success, which directly influences a species life history patterns, such as reproductive status, growth rate, and energetic requirements. Collecting accurate morphological measurements of individuals is often essential for monitoring populations, and recent studies have demonstrated how animal morphology has profound implications for conservation and management decisions, especially for populations inhabiting anthropogenically-altered environments (Miles 2020) (Fig. 1). For example, in a study on the critically endangered European eel, De Meyer et al. (2020) found that different skulls sizes were associated with different ecomorphs (a local variety of a species whose appearance is determined by its ecological environment), which predicted different diet types and resulted with some ecomorphs having a greater exposure to pollutants and toxins than others. However, obtaining manual measurements of wild animal populations can be logistically challenging, limited by accessibility, cost, danger, and animal disturbance. These challenges are especially true for large elusive animals, such as whales that are often in remote locations, spend little time at the surface of the water, and their large size can preclude safe capture and live handling.
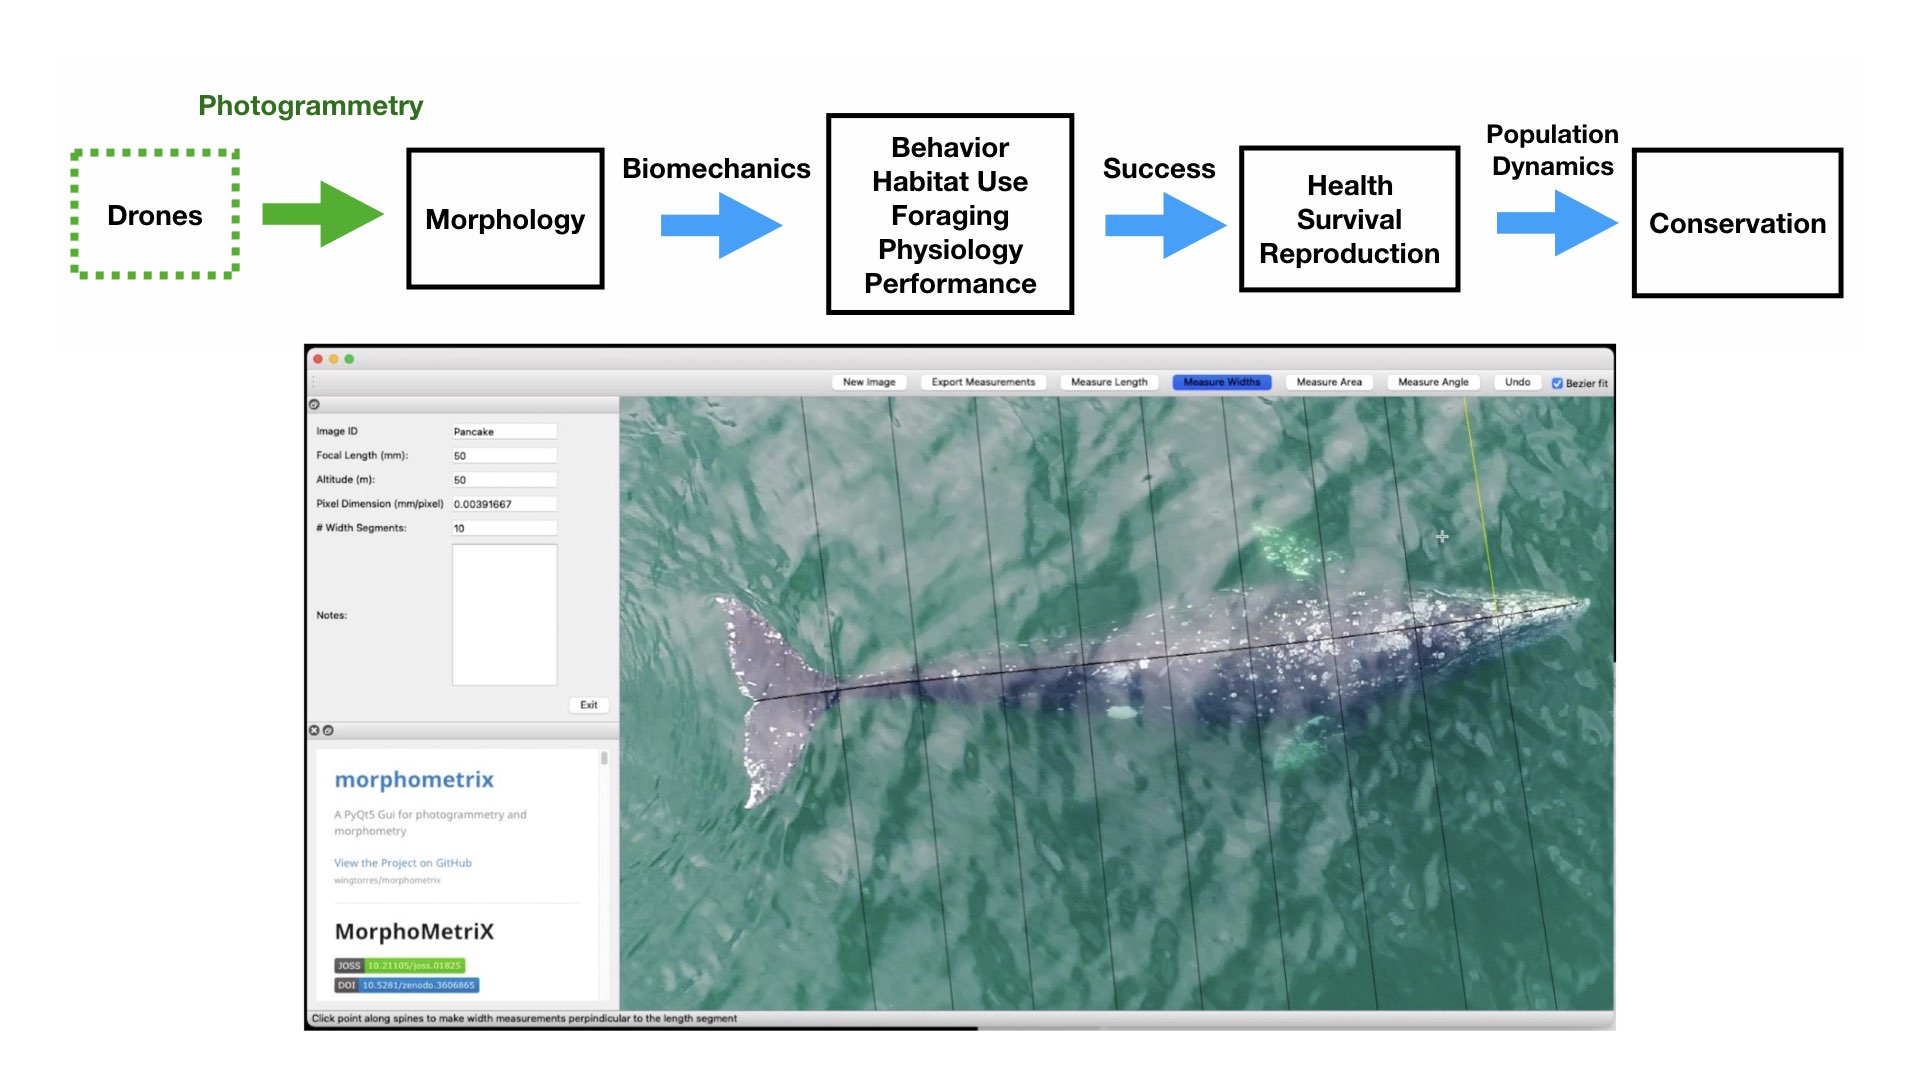
Figure 1. Top) A pathway framework depicting how the morphology of an animal influences its habitat use, behavior, foraging, physiology, and performance. These traits all affect how successful an animal is in its environment and can reflect an individual’s current health, likelihood of survival, and potential reproductive success. This individual success can then be scaled up to assess overall population health, which in turn can have direct implications for conservation. Bottom) an example of morphological differences in fish body size and fin shape from Walker et al. (2013). Fineness ratio (f) = length of body ÷ max body width.
Photogrammetry is a non-invasive method for obtaining accurate morphological measurements of animals from photographs. The two main types of photogrammetry methods used in wildlife biology are 1) single camera photogrammetry, where a known scale factor is applied to a single image to measure 2D distances and angles and 2) stereo-photogrammetry, where two or more images (from a single or multiple cameras) are used to recreate 3D models. These techniques have been used on domestic animals to measure body condition and estimate weight of dairy cows and lactating Mediterranean buffaloes (Negretti et al., 2008; Gaudioso et al., 2014) and on wild animals to measure sexual dimorphism in Western gorillas (Breuer et al., 2007), shoulder heights of elephants (Schrader et al., 2006), nutritional status of Japanese macaques (Kurita et al., 2012), and the body condition of brown bears (Shirane et al., 2020). Over 70 years ago, Leedy (1948) encouraged wildlife biologists to use aerial photogrammetry from aircraft for censusing wild animal populations and their habitats, where photographs can be collected at nadir (straight down) or an oblique angle, and the scale can be calculated by dividing the focal length of the camera by the altitude or by using a ratio of selected points in an image of a known size. Indeed, aerial photogrammetry has been wildly adopted by wildlife biologists and has proven useful in obtaining measurements in large vertebrates, such as elephants and whales.
Whitehead & Payne (1978) first demonstrated the utility of using aerial photogrammetry from airplanes and helicopters as a non-invasive technique for estimating the body length of southern right whales. Prior to this technique, measurements of whales were traditionally limited to assessing carcasses collected from scientific whaling operations, or opportunistically from commercial whaling, subsistence hunting, stranding events, and bycatch. Importantly, aerial photogrammetry provides a method to collect measurements of whales without killing them. This approach has been widely adopted to obtain body length measurements on a variety of whale and dolphin species, including bowhead whales (Cubbage & Calambokidis, 1987), southern right whales (Best & Rüther, 1992), fin whales (Ratnaswamy and Wynn, 1993), common dolphins (Perryman and Lynn, 1993), spinner dolphins (Perryman & Westlake 1998), and killer whales (Fearnbach et al. 2012). Aerial photogrammetry has also been used to measure body widths to estimate nutritive condition related to reproduction in gray whales (Perryman and Lynn, 2002) and northern and southern right whales (Miller et al., 2012). However, these studies collected photographs from airplanes and helicopters, which can be costly, limited by weather and infrastructure to support aircraft research efforts and, importantly, presents a potential risk to wildlife biologists (Sasse 2003).
The recent advancement and commercialization of unoccupied aircraft systems (UAS, or drones) has revolutionized the ability to obtain morphological measurements from high resolution aerial photogrammetry across a variety of ecosystems (Fig. 2). Drones ultimately bring five transformative qualities to conservation science compared to airplanes and helicopters: affordability, immediacy, quality, efficiency, and safety of data collection. Durban et al. (2015) first demonstrated the utility of using drones for non-invasively obtaining morphological measurements of killer whales in remote environments. Since then, drone-based morphological measurements have been applied to a wide range of studies that have increased our understanding on different whale populations. For example, Leslie et al. (2020) used drone-based measurements of the skull to distinguish a unique sub-species of blue whales off the coast of Chile. Groskreutz et al. (2019) demonstrated how long-term nutritional stress has limited body growth in northern resident killer whales, while Stewart et al. (2021) found a decrease in body length of North Atlantic Right whales since 1981 that was associated with entanglements from fishing gear and may be a contributing factor to the decrease in reproductive success for this endangered population.
Drone imagery is commonly used to estimate the body condition of baleen whales by measuring the body length and width of individuals. Recently, the GEMM Lab used body length and width measurements to quantify intra- and inter-seasonal changes in body condition across individual gray whales (Lemos et al., 2020). Drones have also been used to measure body condition loss in humpback whales during the breeding season (Christiansen et al., 2016) and to compare the healthy southern right whales to the skinnier, endangered North Atlantic right whales (Christiansen et al., 2020). Drone-based assessments of body condition have even been used to measure how calf growth rate is directly related to maternal loss during suckling (Christiansen et al., 2018), and even estimate body mass (Christiansen et al., 2019).
Drone-based morphological measurements can also be combined with whale-borne inertial sensing tag data to study the functional morphology across several different baleen whale species. Kahane-Rapport et al. (2020) used drone measurements of tagged whales to analyze the biomechanics of how larger whales require longer times for filtering the water through their baleen when feeding. Gough et al. (2019) used size measurements from drones and swimming speeds from tags to determine that a whale’s “walking speed” is 2 meters per second – whether the largest of the whales, a blue whale, or the smallest of the baleen whales, an Antarctic minke whale. Size measurements and tag data were combined by Segre et al. (2019) to quantify the energetic costs of different sized whales when breaching.
Taken together, drones have revolutionized our ability to obtain morphological measurements of whales, greatly increasing our capacity to better understand how these animals function and perform in their environments. These advancements in marine science are particularly important as these methods provide greater opportunity to monitor the health of populations, especially as they face increased threats from anthropogenic stressors (such as vessel traffic, ocean noise, pollution, fishing entanglement, etc.) and climate change.
Drone-based photogrammetry is one of the main focuses of the GEMM Lab’s project on Gray whale Response to Ambient Noise Informed by Technology and Ecology (GRANITE). This summer we have been collecting drone videos to measure the body condition of gray whales feeding off the coast of Newport, Oregon (Fig. 2). As we try to understand the physiological stress response of gray whales to noise and other potential stressors, we have to account for the impacts of overall nutritional state of each individual whale’s physiology, which we infer from these body condition estimates.
Figure 2. Drones can help collect images of whales to obtain morphological measurements using photogrammetry and help us fill knowledge gaps for how these animals interact in their environment and to assess their current health. Bottom photo is an image collected by the GEMM Lab of a gray whale being measured in MorphoMetriX software to estimate its body condition.
References
Best, P. B., & Rüther, H. (1992). Aerial photogrammetry of southern right whales, Eubalaena australis. Journal of Zoology, 228(4), 595-614.
Breuer, T., Robbins, M. M., & Boesch, C. (2007). Using photogrammetry and color scoring to assess sexual dimorphism in wild western gorillas (Gorilla gorilla). American Journal of Physical Anthropology, 134(3), 369–382. https://doi.org/10.1002/ajpa.20678
Christiansen, F., Vivier, F., Charlton, C., Ward, R., Amerson, A., Burnell, S., & Bejder, L. (2018). Maternal body size and condition determine calf growth rates in southern right whales. Marine Ecology Progress Series, 592, 267–281.
Christiansen, F. (2020). A population comparison of right whale body condition reveals poor state of North Atlantic right whale, 1–43.
Christiansen, F., Dujon, A. M., Sprogis, K. R., Arnould, J. P. Y., & Bejder, L. (2016). Noninvasive unmanned aerial vehicle provides estimates of the energetic cost of reproduction in humpback whales. Ecosphere, 7(10), e01468–18.
Christiansen, F., Sironi, M., Moore, M. J., Di Martino, M., Ricciardi, M., Warick, H. A., … Uhart, M. M. (2019). Estimating body mass of free-living whales using aerial photogrammetry and 3D volumetrics. Methods in Ecology and Evolution, 10(12), 2034–2044.
Cubbage, J. C., & Calambokidis, J. (1987). Size-class segregation of bowhead whales discerned through aerial stereo-photogrammetry. Marine Mammal Science, 3(2), 179–185.
De Meyer, J., Verhelst, P., & Adriaens, D. (2020). Saving the European Eel: How Morphological Research Can Help in Effective Conservation Management. Integrative and Comparative Biology, 23, 347–349.
Gaudioso, V., Sanz-Ablanedo, E., Lomillos, J. M., Alonso, M. E., Javares-Morillo, L., & Rodr\’\iguez, P. (2014). “Photozoometer”: A new photogrammetric system for obtaining morphometric measurements of elusive animals, 1–10.
Gough, W. T., Segre, P. S., Bierlich, K. C., Cade, D. E., Potvin, J., Fish, F. E., … Goldbogen, J. A. (2019). Scaling of swimming performance in baleen whales. Journal of Experimental Biology, 222(20), jeb204172–11.
Groskreutz, M. J., Durban, J. W., Fearnbach, H., Barrett-Lennard, L. G., Towers, J. R., & Ford, J. K. B. (2019). Decadal changes in adult size of salmon-eating killer whales in the eastern North Pacific. Endangered Species Research, 40, 1
Kahane-Rapport, S. R., Savoca, M. S., Cade, D. E., Segre, P. S., Bierlich, K. C., Calambokidis, J., … Goldbogen, J. A. (2020). Lunge filter feeding biomechanics constrain rorqual foraging ecology across scale. Journal of Experimental Biology, 223(20), jeb224196–8.
Leedy, D. L. (1948). Aerial Photographs, Their Interpretation and Suggested Uses in Wildlife Management. The Journal of Wildlife Management, 12(2), 191.
Lemos, L. S., Burnett, J. D., Chandler, T. E., Sumich, J. L., and Torres, L. G. (2020). Intra- and inter-annual variation in gray whale body condition on a foraging ground. Ecosphere 11.
Leslie, M. S., Perkins-Taylor, C. M., Durban, J. W., Moore, M. J., Miller, C. A., Chanarat, P., … Apprill, A. (2020). Body size data collected non-invasively from drone images indicate a morphologically distinct Chilean blue whale (Balaenoptera musculus) taxon. Endangered Species Research, 43, 291–304.
Miles, D. B. (2020). Can Morphology Predict the Conservation Status of Iguanian Lizards? Integrative and Comparative Biology.
Miller, C. A., Best, P. B., Perryman, W. L., Baumgartner, M. F., & Moore, M. J. (2012). Body shape changes associated with reproductive status, nutritive condition and growth in right whales Eubalaena glacialis and E. australis. Marine Ecology Progress Series, 459, 135–156.
Negretti, P., Bianconi, G., Bartocci, S., Terramoccia, S., & Verna, M. (2008). Determination of live weight and body condition score in lactating Mediterranean buffalo by Visual Image Analysis. Livestock Science, 113(1), 1–7. https://doi.org/10.1016/j.livsci.2007.05.018
Ratnaswamy, M. J., & Winn, H. E. (1993). Photogrammetric Estimates of Allometry and Calf Production in Fin Whales, \emph{Balaenoptera physalus}. American Society of Mammalogists, 74, 323–330.
Perryman, W. L., & Lynn, M. S. (1993). Idendification of geographic forms of common dolphin(\emph{Delphinus Delphis}) from aerial photogrammetry. Marine Mammal Science, 9(2), 119–137.
Perryman, W. L., & Lynn, M. S. (2002). Evaluation of nutritive condition and reproductive status of migrating gray whales (\emph{Eschrichtius robustus}) based on analysisof photogrammetric data. Journal Cetacean Research and Management, 4(2), 155–164.
Perryman, W. L., & Westlake, R. L. (1998). A new geographic form of the spinner dolphin, stenella longirostris, detected with aerial photogrammetry. Marine Mammal Science, 14(1), 38–50.
Sasse, B. (2003). Job-Related Mortality of Wildlife Workers in the United States, 1937- 2000, 1015–1020.
Segre, P. S., Potvin, J., Cade, D. E., Calambokidis, J., Di Clemente, J., Fish, F. E., … & Goldbogen, J. A. (2020). Energetic and physical limitations on the breaching performance of large whales. Elife, 9, e51760.
Shirane, Y., Mori, F., Yamanaka, M., Nakanishi, M., Ishinazaka, T., Mano, T., … Shimozuru, M. (2020). Development of a noninvasive photograph-based method for the evaluation of body condition in free-ranging brown bears. PeerJ, 8, e9982. https://doi.org/10.7717/peerj.9982
Shrader, A. M., M, F. S., & Van Aarde, R. J. (2006). Digital photogrammetry and laser rangefinder techniques to measure African elephants, 1–7.
Stewart, J. D., Durban, J. W., Knowlton, A. R., Lynn, M. S., Fearnbach, H., Barbaro, J., … & Moore, M. J. (2021). Decreasing body lengths in North Atlantic right whales. Current Biology.
Walker, J. A., Alfaro, M. E., Noble, M. M., & Fulton, C. J. (2013). Body fineness ratio as a predictor of maximum prolonged-swimming speed in coral reef fishes. PloS one, 8(10), e75422.
About 10 months have passed since I started working on OPAL, a project that aims to identify the co-occurrence between whales and fishing effort in Oregon to reduce entanglement risk. During this period, you would be surprised to know how little ecology I have actually done and how much time has been devoted to data processing! I compiled several million GPS trackline positions, processed hundreds of marine mammal observations, wrote several thousand lines of R code, downloaded and extracted a couple Gb of environmental data… before finally reaching the modeling phase of the OPAL project. And with it, finally comes the time to look more closely at the ecology and behavior of my species of interest. While the previous steps of the project were pretty much devoid of ecological reasoning, the literature homework now comes in handy to guide my choices regarding habitat use models, such as selecting environmental predictors of whale occurrence, deciding on what seasons should be modeled, and choosing the spatio-temporal scale at which the data should be aggregated.
Whale diversity on the US west coast
The productive waters off the US west coast host a great diversity of cetaceans. Eight species of baleen whales are reported to occur there by NOAA fisheries: blue whales, Bryde’s whales, fin whales, gray whales, humpback whales, minke whales, North Pacific right whales and sei whales. Among them, no less than five are listed as Endangered under the Endangered Species Act. Whether they are only passing by or spending months feeding in the region, the timing and location where these animals are observed varies greatly by species and by population.
During the 113 hours of aerial survey effort and 264 hours of boat-based search conducted for the OPAL project, 563 groups of baleen whales have been observed to-date (up to mid-May 2021 to be exact… more data coming soon!). Among the observations where animals could be identified to the species level, humpback whales are preponderant, as they represent about half of the whale groups observed (n = 293). Blue (n = 41) and gray whales (n = 46) come next, the latter being observed in more nearshore waters. Finally, a few fin whale groups were observed (n = 28). The other baleen whale species reported by NOAA in the US west coast species list were very rarely or not observed at all during OPAL surveys.
The OPAL aerial surveys conducted in partnership with the United States Coast Guard (USCG) were specifically designed to study whales occurring on the continental shelf along the coast of Oregon. Hence, most of this survey effort is located in waters from 800 m to 30 m deep, which may explain the relatively low number of gray whales detected. Indeed, gray whales observed in Oregon may either be migrating along the coast to and from their breeding grounds in Baja California, or be part of the small Pacific Coast Feeding Group that forage in Oregon nearshore and shallow waters during the summer. This group of whales is one the main GEMM lab’s research focus, being at the core of no less than three ongoing research projects: AMBER, GRANITE, and TOPAZ.
So today, let’s turn our eyes to the sea horizon and talk about some other members of the baleen whale community: rorquals. Conveniently, the three species of baleen whales (gray whales aside) most commonly observed during OPAL surveys are all part of the rorqual family, a.k.a Balaenopteridae: humpback whales, blue whales and fin whales (Figure 1). They are morphologically characterized by the pleated throat grooves that allow them to engulf large quantities of food and water, for instance when lunge-feeding. Known cases of hybridization between these three species demonstrate their close relatedness (Jefferson et al., 2021). They all have worldwide distributions and display unequally understood migratory behaviors, seasonally traveling between warm tropical breeding grounds and temperate-polar feeding grounds. They occur in great numbers in productive waters such as the upwelling system of the California Current.
The three accomplices
Figure 1: Aerial view of three rorquals species: a humpback whale (left), a fin whale (center), and a blue whale (right). Photo credit: Leigh Torres and Craig Hayslip. Photos taken off the Oregon coast under NOAA/NMFS permit during USCG helicopter flights conducted as part of the OPAL project
Humpback whales (Megaptera novaeangliae) are easily differentiated from other rorquals because of their long pectoral fins (up to one third of their body length!), which inspired their scientific name, Megaptera, « big-winged » (Figure 1). Individuals observed in Oregon mostly belong to a mix of two Distinct Population Segments (DPS): the threatened Mexico and endangered Central American DPS. Although humpback whales from different DPS do not show any morphological differences, they are genetically distinct because they have been mating separately in distinct breeding grounds for generations and generations. This genetic differentiation has great implications in terms of conservation since the Central American DPS is recovering at a lesser rate than the Mexican and is therefore subject to different management measures (recovery plan, monitoring plan, designated critical habitats). Humpback whales migrate and feed off the US west coast, with a peak in abundance in the mid to late summer. Compared to other rorquals that are found in the open ocean, humpback whales are mostly observed on the continental shelf (Becker et al., 2019). They are considered to have a relatively generalist diet, as they feed on a mix of krill (Euphausiids) and fishes (e.g. anchovy, sardines) and are capable of switching their feeding behavior depending on relative prey availability (Fleming, Clark, Calambokidis, & Barlow, 2016; Fossette et al., 2017).
Blue whales (Balaenoptera musculus) are the largest animals ever known (max length 33 m, Jefferson et al., 2008), and sadly the most at risk of global extinction among our three species of interest (listed as « endangered » in the IUCN red list). They have a distinctive mottled blue and light gray skin, a slender body and a broad U-shaped head (or as some say « like a gothic arch », Figure 1). Blue whales tend to be open ocean animals, but they regroup seasonally to feed in highly productive nearshore areas such as the Southern California Bight (Becker et al. 2019, Abrahms et al. 2019). Blue whales migrating or feeding along the US west coast belong to the Eastern North Pacific stock and are subject to great research and conservation efforts. Contrary to their other rorqual counterparts, blue whales are quite picky eaters, as they exclusively feed on krill. This difference in diet leads to resource partitioning facilitating rorqual coexistence in the California Current (Fossette et al., 2017). These differences in feeding strategies have important implications for designing predictive models of habitat use.
Fin whales (Balaenoptera physalus) are nicknamed « greyhounds of the sea » due to their exceptional swim speed (max 46 km/h). They are a little smaller than blue whales (max length 27 m, Jefferson, Webber, & Pitman, 2008) but share a similar sleek and streamlined shape. Their coloration is their most distinctive feature: the left lower jaw being mostly dark while the right is white. V-shaped light-gray « chevrons » color their back, behind the head (Figure 1). The California/Oregon/Washington is one of the three stocks recognized in the North Pacific (NOAA Fisheries, 2018). Within this region, there is genetic evidence for a geographic separation north and south of Point Conception, CA (Archer et al., 2013). Like other rorquals, they are migratory, but their seasonal distribution is relatively less well understood as they appear to spend a lot of time in open oceans. For instance, a meta-analysis for the North Pacific found little evidence for fin whales using distinct calving areas (Mizroch, Rice, Zwiefelhofer, Waite, & Perryman, 2009). In the California Current System, satellite tracking has provided great insights into their space-use patterns. In the Southern California Bight, fin whales show year-round residency and seasonal shifts in habitat use as they move further offshore and north during the spring/summer (Scales et al., 2017). The Northern California Current offshore waters appeared to be used during the summer months by the whales tagged in the Southern California Bight. Yet, fin whales are observed year-round in Oregon (NOAA Fisheries, 2018).
Towards predictive models of rorqual distribution
Enough observations have now been collected as part of the OPAL project to be able to model the habitat use of some of these rorqual species. Based on 12 topographic (i.e., depth, slope, distance to canyons) and physical variables (temperature, chlorophyll-a, water column stratification, etc.), I have made my first attempt at predicting seasonal distribution patterns of humpback whales and blue whales in Oregon. These models will be improved in the coming months, with more data pouring in and refined parametrizations, but they already bring insights into the shared habitat use patterns of these species, as well as their specificities.
Across multiple cross-validations of the species-specific models, sea surface temperature, sea surface height and depth were recurrently selected among the most important variables influencing both humpback and blue whale distributions. Predicted densities of blue whales were relatively higher at less than 40 fathoms compared to humpback whales, although both species’ hotspots were located outside this newly implemented seasonal fishing limit (Figure 2). Higher densities were generally predicted off Newport and Port Orford, and north of North Bend.
Figure 2: Predicted densities of humpback and blue whales during the month of September 2018, 2019, and 2020 in Oregon waters (OPAL project). Core areas of use (predicted densities in the top 25%) are represented, with darker shades of blue and orange showing higher predicted densities. Dashed lines represent the tracklines followed by USCG monthly aerial surveys. The black line represents the 40 fathom isobath. Grey boxes overlayed on predictions delineate the areas of extrapolation where environmental conditions are non-analogous to the conditions in which the models were trained. Disclaimer: these model outputs are preliminary and should be interpreted with caution.
Once our rorqual models are finalized, we will work with our partners at the Oregon Department of Fisheries and Wildlife to overlay predicted whale hotspots with areas of high crab pot densities. This overlap analysis will help us understand the times and places where co-occurrence of suitable whale habitat and fishing activities put whales at risk of entanglement.
Becker, E. A., Forney, K. A., Redfern, J. V, Barlow, J., Jacox, M. G., Roberts, J. J., & Palacios, D. M. (2019). Predicting cetacean abundance and distribution in a changing climate. Diversity and Distributions, 25(4), 626–643. https://doi.org/10.1111/ddi.12867
Fleming, A. H., Clark, C. T., Calambokidis, J., & Barlow, J. (2016). Humpback whale diets respond to variance in ocean climate and ecosystem conditions in the California Current. Global Change Biology, 22, 1214–1224. https://doi.org/10.1111/gcb.13171
Fossette, S., Abrahms, B., Hazen, E. L., Bograd, S. J., Zilliacus, K. M., Calambokidis, J., … Croll, D. A. (2017). Resource partitioning facilitates coexistence in sympatric cetaceans in the California Current. Ecology and Evolution, 7, 9085–9097. https://doi.org/10.1002/ece3.3409
Jefferson, T. A., Palacios, D. M., Clambokidis, J., Baker, S. C., Hayslip, C. E., Jones, P. A., … Schulman-Janiger, A. (2021). Sightings and Satellite Tracking of a Blue / Fin Whale Hybrid in its Wintering and Summering Ranges in the Eastern North Pacific. Advances in Oceanography & Marine Biology, 2(4), 1–9. https://doi.org/10.33552/AOMB.2021.02.000545
Jefferson, T. A., Webber, M. A., & Pitman, R. L. (2008). Marine Mammals of the World. A comprehensive guide to their identification. Elsevier, London, UK.
Mizroch, S. A., Rice, D. W., Zwiefelhofer, D., Waite, J., & Perryman, W. L. (2009). Distribution and movements of fin whales in the North Pacific Ocean. Mammal Review, 39(3), 193–227. https://doi.org/10.1111/j.1365-2907.2009.00147.x
NOAA Fisheries. (2018). Fin whale stock assessment report ( Balaenoptera physalus physalus ): California / Oregon / Washington Stock.
Scales, K. L., Schorr, G. S., Hazen, E. L., Bograd, S. J., Miller, P. I., Andrews, R. D., … Falcone, E. A. (2017). Should I stay or should I go? Modelling year-round habitat suitability and drivers of residency for fin whales in the California Current. Diversity and Distributions, 23(10), 1204–1215. https://doi.org/10.1111/ddi.12611
Large whale conservation is challenged by our limited understanding of the impacts of natural and anthropogenic disturbances on the whale´s health and its population level consequences. To better mitigate human-wildlife conflicts, we need to improve our ability to predict multi-scale responses of whales to disturbances, describe and identify disease dynamics, and understand the reproductive biology of whales (Madliger, 2020; McCormick and Romero, 2017). Conservation physiology and conservation endocrinology can provide tools to illuminate the underlying physiological mechanisms whales use to cope with changing environments and different stressors, thus filling information gaps to guide management and conservation actions.
In brief, conservation physiology is a multidisciplinary field wherein a broad suite of tools and concepts are used to understand how organisms and ecosystems respond to both environmental and anthropogenic change and stressors (Madliger et al., 2020). Conservation endocrinology is a subdiscipline within conservation physiology, which relies on endocrine measurements (hormone quantifications). However, monitoring the physiology of free ranging animals in wild populations presents many technical challenges and it is particularly difficult when studying whales. Traditionally, conservation endocrinology relied on laboratory analyses of plasma samples (derived from blood). Yet implementing this techniques for monitoring the physiology of mysticetes (baleen whales) is currently impossible, as there are no feasible, non- (or minimally) invasive, methods to obtain a blood sample from living large whales (Hunt et al., 2013).
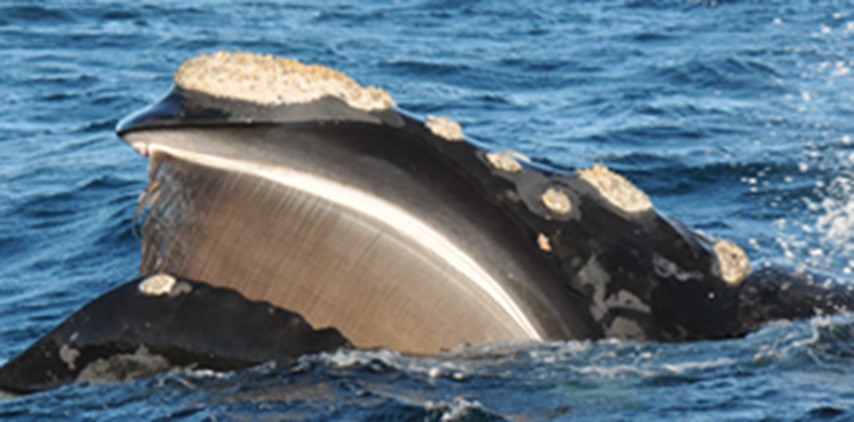
Therefore, we are interested in the development and further validation of alternative sample types from whales to obtain endocrine data. During my Ph.D. dissertation I worked to develop and ground truth the endocrine analyses of whale baleen as a novel sample type that can be used for retrospective assessments of the whale´s physiology. Baleen, the filter-feeding apparatus of the mysticete whales (Figure 1), consists of long fringed plates of stratified, keratinized tissue that grow continuously and slowly downward from the whale´s upper jaw (Hunt et al., 2014). Baleen plates are readily accessible at necropsy and routinely collected from carcasses of stranded whales.
Figure 1: Southern Right Whale skim feeding at the surface. Baleen plates hanging downwards are visible in the image. Photo: Alejandro Fernández Ajó / Instituto de Conservación de Ballenas de Argentina.
Like hair, nails, feathers, spines, or horns of other animals, baleen is a keratinized tissue that can store steroid and thyroid hormones in detectable and relevant concentrations to provide an integrated measure of hormonal plasma levels over the period that the structure was growing. Thus, baleen contains a progressive time-series that captures months and often years of an individual’s endocrine history with sufficient temporal resolution to determine seasonal endocrine patterns allowing to explore questions that have historically been difficult to address in large whales, including pregnancy and inter-calving interval, age of sexual maturation, timing and duration of seasonal reproductive cycles, adrenal physiology, and metabolic rate. Additionally, their robust and stable keratin matrix allows baleen samples to be stored for years to decades, enabling the analysis and comparison of endocrine patterns from past and modern populations. Therefore, keratinized sample matrices are valuable tools to investigate reproductive and stress physiology in whales and other vertebrates.
However, due to its novelty, the extraction and analysis of hormones from baleen and other keratinized tissues requires both biological and analytical validations to ensure the method fulfills the requirements for its intended use. Baleen hormone analyses has already passed several essential assay validations, including parallelism and accuracy of immunoassays (Hunt et al., 2017b), and numerous biological validations, such as the study of animals with known physiological status (i.e., pregnancy, and known stress events such as entanglement in fishing gear or presence of lesions) to assess the degree to which the endocrine data reflect the physiology of the individual (Fernández Ajó et al., 2020, 2018; Hunt et al., 2018, 2017a; Lysiak et al., 2018; Palme, 2019). Yet, other questions essential for technical validation remain unknown, including choice and volume of extraction solvent, the effect of solvent-to-sample ratio (solvent:sample) on extraction yield, and the amount of sample (e.g., mg) needed for analysis to obtain reliable hormonal data.
In our recent contribution,Optimizing hormone extraction protocols for whale baleen: Tackling questions of solvent:sample ratio and variation, we aimed to tackle two of these important questions: “1) what is the minimum sample mass of baleen powder required to reliably quantify hormone content of baleen samples analyzed using commercially available enzyme immune assays (EIAs); and 2) what is the optimal ratio of solvent volume to sample mass for steroids extracted from baleen, i.e., the ratio that yields the maximum amount of hormone with high accuracy and low variability between replicates.”
We performed the extraction with methanol and tested a variety of sample masses with the objective to provide methodological guidance regarding optimizing sample mass and solvent volume for steroid hormone extraction from powdered baleen. Our results suggest that the optimal sample mass for methanol extraction of steroid hormones from baleen samples is 20 mg, and that larger sample masses did not produce either better yield or less variation in the apparent hormone per g of baleen sample (Figure 2). In addition, when the extraction was performed keeping the volume of solvent proportional to the sample mass (namely, a solvent:sample ratio of 80:1), masses as small as 10 mg yielded reliable hormone measurement (Figure 2).
Figure 2. Extraction experiment results for variable (solid circles) or constant (open circles) solvent:sample ratio (mean progesterone concentration ± standard error of the mean). Extractions for 5, 10, 20, 50, and 75 mg of baleen powder were performed in triplicate for each sample mass. Letters indicate significant differences between groups after Tukey’s post hoc test. The right-side panel presents a plot for 100 mg of baleen powder extracted with 8 mL of solvent performed in triplicate; error bars are too small to show in the figure. Source: Fernández Ajó et al., 2021.
Our results indicate how baleen hormone analytic techniques can be more widely employed on small sample masses from rare specimens (i.e., less sample than is currently employed, which is typically 75 mg or 100 mg in most studies to date), such as from natural history museums and stranding archives. Thus, we demonstrate that greater use of this valuable technique to reconstruct the endocrine and physiological history of individual whales over time can be achieved with reduced sample size (so reduced damage to the sample). I hope these findings encourage researchers to apply these methods more broadly to analyze historical archives of baleen plates that can date back to the era of commercial whaling, and modern archives of baleen collected from stranded animals to help continue further developing techniques that can make headway in gaining conservation-relevant physiological knowledge of this particularly challenging taxon.
Bibliography:
Fernández Ajó, A., Hunt, K.E., Dillon, D., Uhart, M., Sironi, M., Rowntree, V., Loren Buck, C., 2021. Optimizing hormone extraction protocols for whale baleen: Tackling questions of solvent:sample ratio and variation. Gen. Comp. Endocrinol. 113828. https://doi.org/10.1016/j.ygcen.2021.113828
Fernández Ajó, A.A., Hunt, K.E., Giese, A.C., Sironi, M., Uhart, M., Rowntree, V.J., Marón, C.F., Dillon, D., DiMartino, M., Buck, C.L., 2020. Retrospective analysis of the lifetime endocrine response of southern right whale calves to gull wounding and harassment: A baleen hormone approach. Gen. Comp. Endocrinol. 296, 113536. https://doi.org/10.1016/j.ygcen.2020.113536
Fernández Ajó, A.A., Hunt, K.E., Uhart, M., Rowntree, V., Sironi, M., Marón, C.F., Di Martino, M., Buck, C.L., 2018. Lifetime glucocorticoid profiles in baleen of right whale calves: potential relationships to chronic stress of repeated wounding by Kelp Gulls. Conserv. Physiol. 6, 1–12. https://doi.org/10.1093/conphys/coy045
Hunt, K.E., Lysiak, N.S., Moore, M., Rolland, R.M., 2017a. Multi-year longitudinal profiles of cortisol and corticosterone recovered from baleen of North Atlantic right whales (Eubalaena glacialis). Gen. Comp. Endocrinol. 254, 50–59. https://doi.org/10.1016/j.ygcen.2017.09.009
Hunt, K.E., Lysiak, N.S.J., Matthews, C.J.D., Lowe, C., Fernández Ajó, A., Dillon, D., Willing, C., Heide-Jørgensen, M.P., Ferguson, S.H., Moore, M.J., Buck, C.L., 2018. Multi-year patterns in testosterone, cortisol and corticosterone in baleen from adult males of three whale species. Conserv. Physiol. 6, 1–16. https://doi.org/10.1093/conphys/coy049
Hunt, K.E., Moore, M.J., Rolland, R.M., Kellar, N.M., Hall, A.J., Kershaw, J., Raverty, S.A., Davis, C.E., Yeates, L.C., Fauquier, D.A., Rowles, T.K., Kraus, S.D., 2013. Overcoming the challenges of studying conservation physiology in large whales: a review of available methods. Conserv. Physiol. 1, cot006–cot006. https://doi.org/10.1093/conphys/cot006
Hunt, K.E., Stimmelmayr, R., George, C., Hanns, C., Suydam, R., Brower, H., Rolland, R.M., 2014. Baleen hormones: a novel tool for retrospective assessment of stress and reproduction in bowhead whales (Balaena mysticetus). Conserv. Physiol. 2, cou030–cou030. https://doi.org/10.1093/conphys/cou030
Lysiak, N.S.J., Trumble, S.J., Knowlton, A.R., Moore, M.J., 2018. Characterizing the Duration and Severity of Fishing Gear Entanglement on a North Atlantic Right Whale (Eubalaena glacialis) Using Stable Isotopes, Steroid and Thyroid Hormones in Baleen. Front. Mar. Sci. 5, 1–13. https://doi.org/10.3389/fmars.2018.00168
Madliger, C. L., Franklin, C. E., Love, O. P., & Cooke, S.J. (Ed.), 2020. Conservation Physiology: Applications for Wildlife Conservation and Management., 1st ed. Oxford University Press. https://doi.org/10.1093/oso/ 978019883610.001.0001
Palme, R., 2019. Non-invasive measurement of glucocorticoids: Advances and problems. Physiol. Behav. 199, 229–243. https://doi.org/10.1016/j.physbeh.2018.11.021
Since early May, much of the GEMM Lab has been consumed by the GRANITE project, which stands for Gray whale Response to Ambient Noise Informed by Technology and Ecology. Two weeks ago, PhD student Clara Bird discussed our field work preparations, and since May 20th we have conducted five successful days of field work (and one unsuccessful day due to fog). If you are now expecting a blog about the data we have collected so far and whales we encountered, I am sorry to disappoint you. Rather, I want to take a big step back and provide the context of the GRANITE project as a whole, explain why this project and data collection is so important, and discuss what it is that we hope to achieve with our ever-growing, multidisciplinary dataset and team.
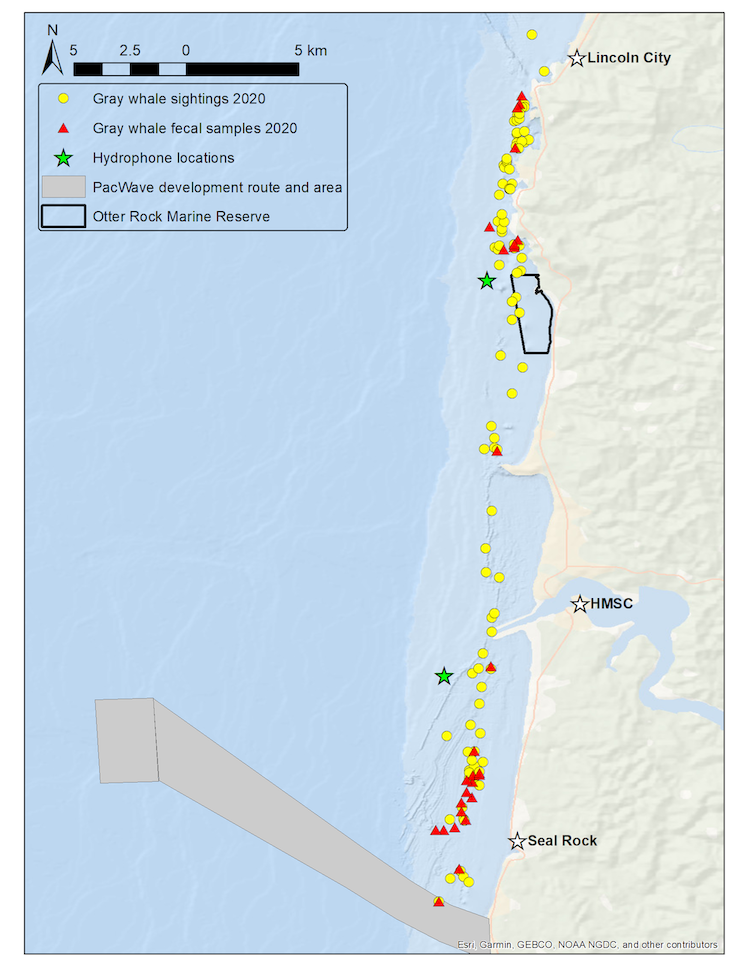
We use the Pacific Coast Feeding Group (PCFG) of gray whales that forage off the Oregon coast as our study system to better understand the ecological and physiological response of baleen whales to multiple stressors. Our field methodology includes replicate physiological and ecological sampling of this accessible baleen whale population with synoptic measurement of multiple types of stressors. We collect fecal samples for hormone analysis, conduct drone overflights of whales to collect body condition and behavioral data, record the ambient soundscape through deployment of two hydrophones, and conduct whale photo-identification to link all data streams to each individual whale of known sex, estimated age, and reproductive status. We resample these data from multiple individuals within and between summer foraging seasons, while exposed to different potential stressors occurring at different intensities and temporal periods and durations. The hydrophones are strategically placed with one in a heavily boat-trafficked (and therefore noisy) area close to the Port of Newport, while the second is located in a relatively calm (and therefore quieter) spot near the Otter Rock Marine Reserve (Fig. 1). These hydrophones provide us with information about both natural (e.g. killer whales, wind, waves) and anthropogenic (e.g. boat traffic, seismic survey, marine construction associated with PacWave wave energy facility development) noise that may affect gray whales. During sightings with whales, we also drop GoPro cameras and sample for prey to better understand the habitats where whales forage and what they might be consuming.
Figure 1. Map of GRANITE study area from Seal Rock to Lincoln City with gray whale sightings (yellow circles) and and fecal samples collected (red triangles) from the 2020 field season. Green stars represent the two hydrophone locations. Source: L. Torres.
GEMM Lab PI Dr. Leigh Torres initiated this research project in 2015 and established partnerships with acoustician Dr. Joe Haxel and (then) PhD student Dr. Leila Lemos. Since then, the team working on this project has grown considerably to provide expertise in the various disciplines that the project integrates. Leigh is currently joined at the GRANITE helm by 4 co-PIs: Dr. Haxel, endocrinologist Dr. Kathleen Hunt, biological statistician Dr. Leslie New, and physiologist Dr. Loren Buck. Drs. Alejandro Fernandez Ajo, KC Bierlich and Enrico Pirotta are postdoctoral scholars who are working on the endocrinology, photogrammetry, and biostatistical modelling components, respectively. Finally, Clara and myself are partially funded through this project for our PhD research, with Clara focusing on the links between behavior, body condition, individualization, and habitat, while I am tackling questions about the recruitment and site fidelity of the PCFG (more about these topics below).
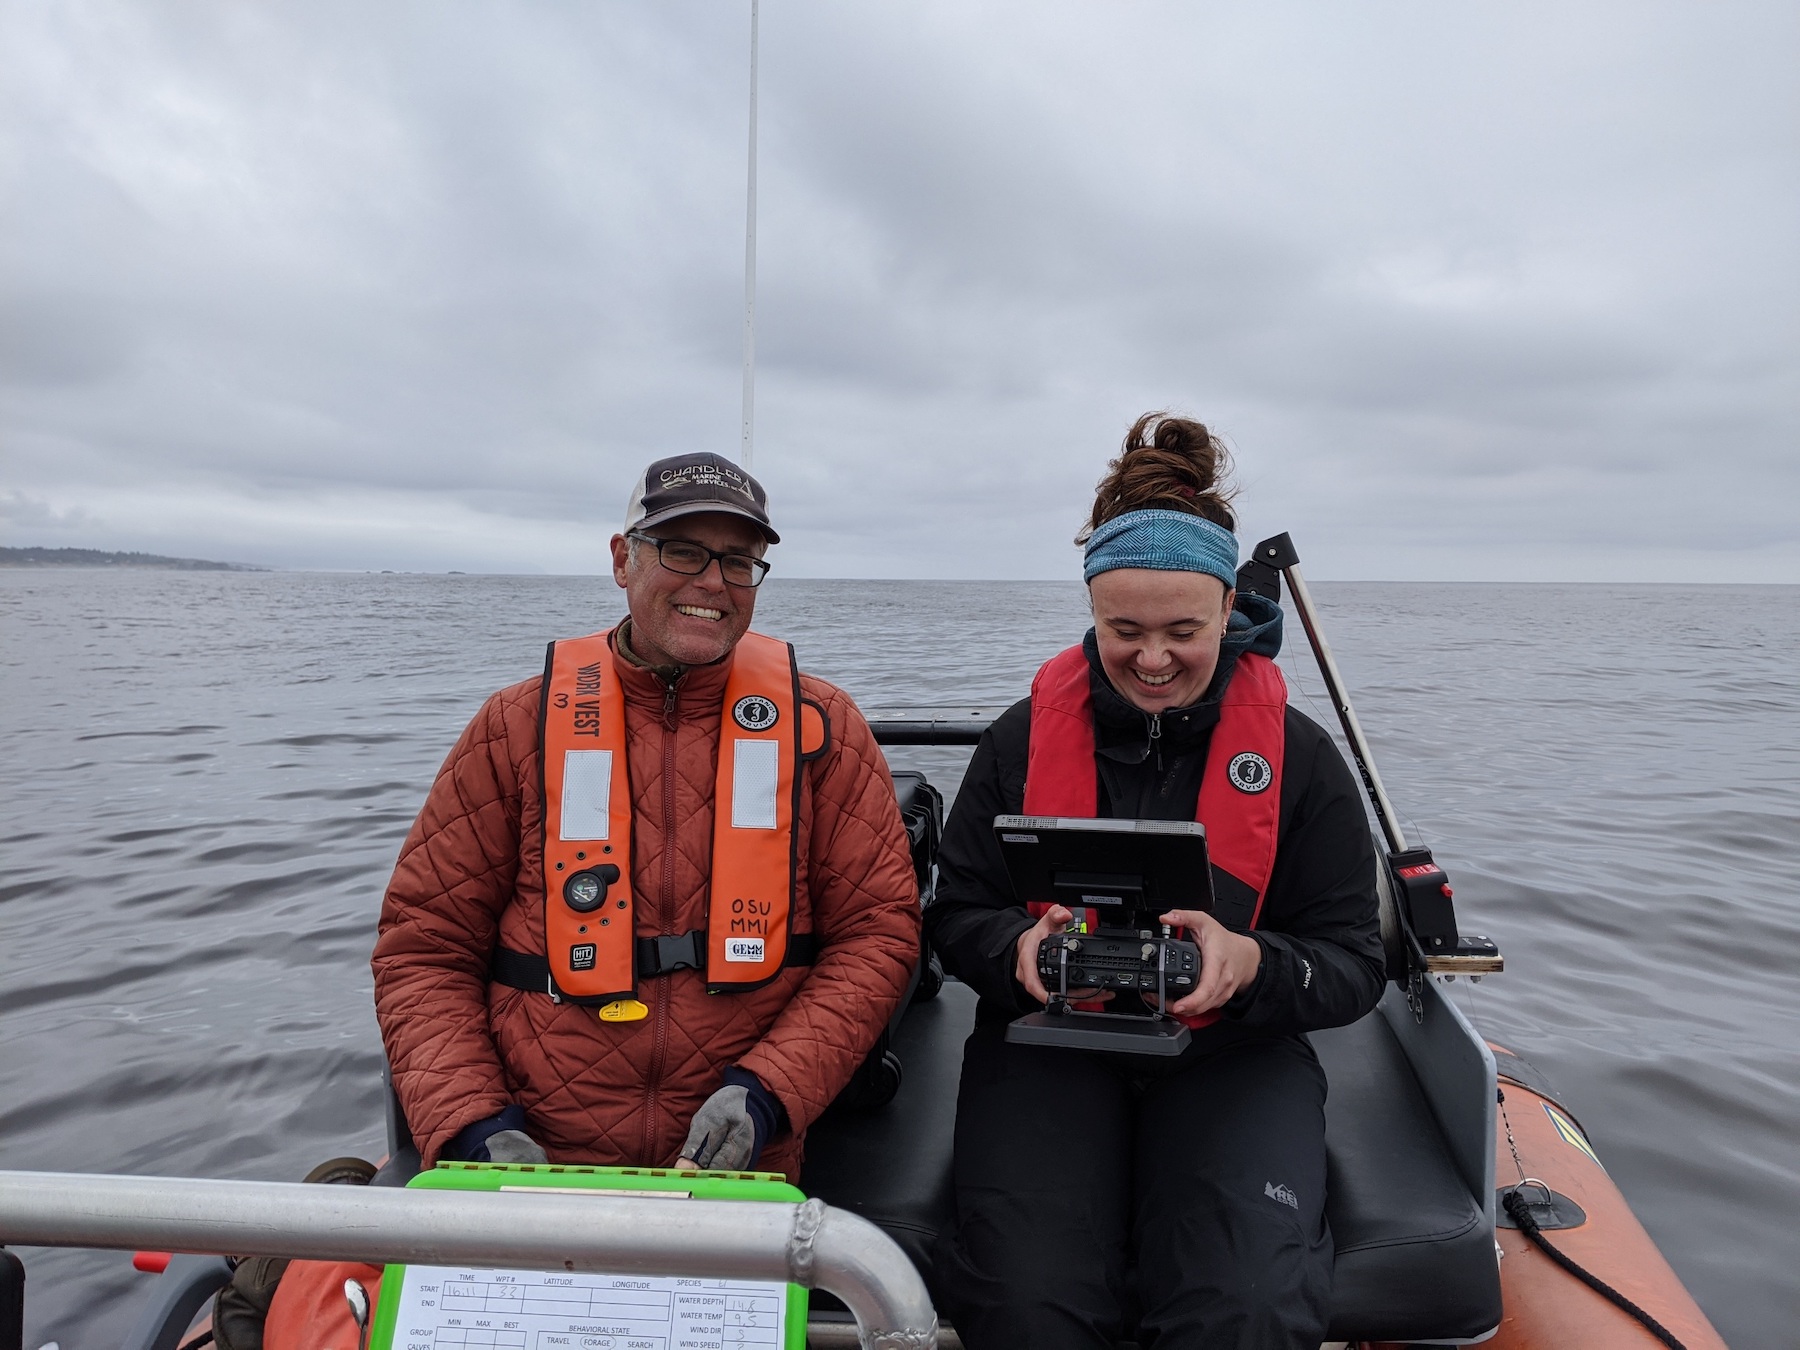
Faculty Research Assistant Todd Chandler supervises PhD student Clara Bird during her maiden drone flight over a whale. Source: L. Torres.
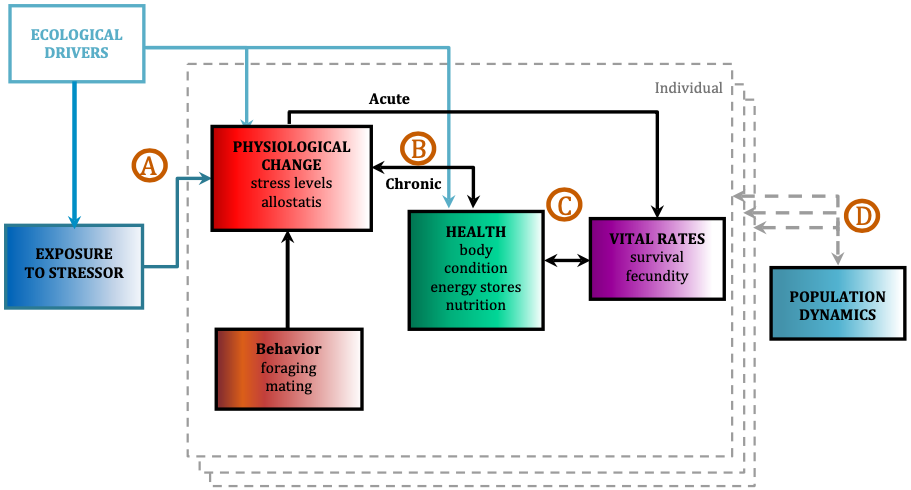
The ultimate goal of this project is to use the PCFG as a case study to quantify baleen whale physiological response to different stressors and model the subsequent impacts on the population by implementing our long-term, replicate dataset into a framework called Population consequences of disturbance (PCoD; Fig. 2). PCoD is built upon the underlying concept that changes in behavior and/or physiology caused by disturbance (i.e. noise) affect the fitness of individuals by impacting their health and vital rates, such as survival, reproductive success, and growth rate (Pirotta et al. 2018). These impacts at the individual level may (or may not) affect the population as a whole, depending on what proportion of individuals in the population are affected by the disturbance and the intensity of the disturbance effect on each individual. The PCoD framework requires quantification of four stages: a) the physiological and/or behavioral changes that occur as a result of exposure to a stressor (i.e. noise), b) the acute effects of these physiological and/or behavioral responses on individual vital rates, and their chronic effects via individual health, c) the way in which changes in health may affect the vital rates of individuals, and d) how changes in individual vital rates may affect population dynamics (Fig. 2; Pirotta et al. 2018). While four stages may not sound like a lot, the amount and longevity of data needed to quantify each stage is immense.
Figure 2. Conceptual framework of the population consequences of disturbance (PCoD). Letters (A-D) represent the four stages that require quantification in order for PCoD to be implemented. Each colored box represents external (ecological drivers, stressors) and internal (physiology, health, vital rates, behavior) factors that can change over time that are measured for each individual whale (dashed grey boundary line). The effects are then integrated across all individuals in the population to project their effects on the population’s dynamics. Figure and caption adapted from Pirotta et al. 2018.
The ability to detect a change in behavior or physiology often requires an understanding of what is “normal” for an individual, which we commonly refer to as a baseline. The best way to establish a baseline is to collect comprehensive data over a long time period. With our data collection efforts since 2015 of fecal samples, drone flights and photo identification, we have established useful baselines of behavioral and physiological data for PCFG gray whales. These baselines are particularly impressive since it is typically difficult to collect repeated measurements of hormones and body condition from the same individual baleen whale across multiple years. These repeated measurements are important because, like all mammals, hormones and body condition vary across life history phases (i.e., with pregnancy, injury, or age class) and across time (i.e., good or bad foraging conditions). To achieve these repeated measurements, GRANITE exploits the high degree of intra- and inter-annual site fidelity of the PCFG, their accessibility for study due to their affinity for nearshore habitat use, and the long-term sighting history of many whales that provides sex and approximate age information. Our work to-date has already established a few important baselines. We now know that the body condition of PCFG gray whales increases throughout a foraging season and can fluctuate considerably between years (Soledade Lemos et al. 2020). Furthermore, there are significant differences in body condition by reproductive state, with calves and pregnant females displaying higher body conditions (Soledade Lemos et al. 2020). Our dataset has also allowed us to validate and quantify fecal steroid and thyroid hormone metabolite concentrations, providing us with putative thresholds to identify a stressed vs. not stressed whale based on its hormone levels (Lemos et al. 2020).
PhD student Lisa Hildebrand and GRANITE co-PI Dr. Kathleen Hunt collecting a fecal sample. Source: L. Torres.
We continue to collect data to improve our understanding of baseline PCFG physiology and behavior, and to detect changes in their behavior and physiology due to disturbance events. All these data will be incorporated into a PCoD framework to scale from individual to population level understanding of impacts. However, more data is not the only thing we need to quantify each of the PCoD stages. The implementation of the PCoD framework also depends on understanding several aspects of the PCFG’s population dynamics. Specifically, we need to know whether recruitment to the PCFG population occurs internally (calves born from “PCFG mothers” return to the PCFG) or externally (immigrants from the larger Eastern North Pacific gray whale population joining the PCFG as adults). The degree of internal or external recruitment to the PCFG population should be included in the PCoD model as a parameter, as it will influence how much individual level disturbance effects impact the overall health and viability of the population. Furthermore, knowing residency times and home ranges of whales within the PCFG is essential to understand exposure durations to disturbance events.
To assess both recruitment and residency patterns of the PCFG, I am undertaking a large photo-identification effort, which includes compiling sightings and photo data across many years, regions, and collaborators. Through this effort we aim to identify calves and their return rate to the population, the rate of new adult recruits to the population, and the spatial residency of individuals in our study system. Although photo-id is a basic, commonplace method in marine mammal science, its role is critical to tracking individuals over time to understand population dynamics (in a non-invasive manner, no less). A large portion of my PhD research will focus on the tedious yet rewarding task of photo-id data management and matching in order to address these pressing knowledge gaps on PCFG population dynamics needed to implement the PCoD model that is an ultimate goal of GRANITE. I am just beginning this journey and have already pinpointed many analytical and logistical hurdles that I need to overcome. I do not anticipate an easy path to addressing these questions, but I am extremely eager to dig into the data, reveal the patterns, and integrate the findings into our rock-solid GRANITE project.
Funding for the GRANITE project comes from the Office of Naval Research, the Department of Energy, Oregon Sea Grant, the NOAA/NMFS Ocean Acoustics Program, and the OSU Marine Mammal Institute.
References
Lemos, L.S., Olsen, A., Smith, A., Chandler, T.E., Larson, S., Hunt, K., and L.G. Torres. 2020. Assessment of fecal steroid and thyroid hormone metabolites in eastern North Pacific gray whales. Conservation Physiology 8:coaa110.
Pirotta, E., Booth, C.G., Costa, D.P., Fleishman, E., Kraus, S.D., Lusseau, D., Moretti, D., New, L.F., Schick, R.S., Schwarz, L.K., Simmons, S.E., Thomas, L., Tyack, P.L., Weise, M.J., Wells, R.S., and J. Harwood. 2018. Understanding the population consequences of disturbance. Ecology and Evolution 8(19):9934-9946.
Soledade Lemos, L., Burnett, J.D., Chandler, T.E., Sumich, J.L., and L.G. Torres. 2020. Intra- and inter-annual variation in gray whale body condition on a foraging ground. Ecosphere 11(4):e03094.
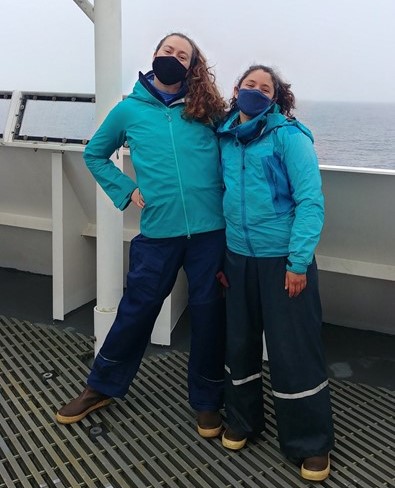
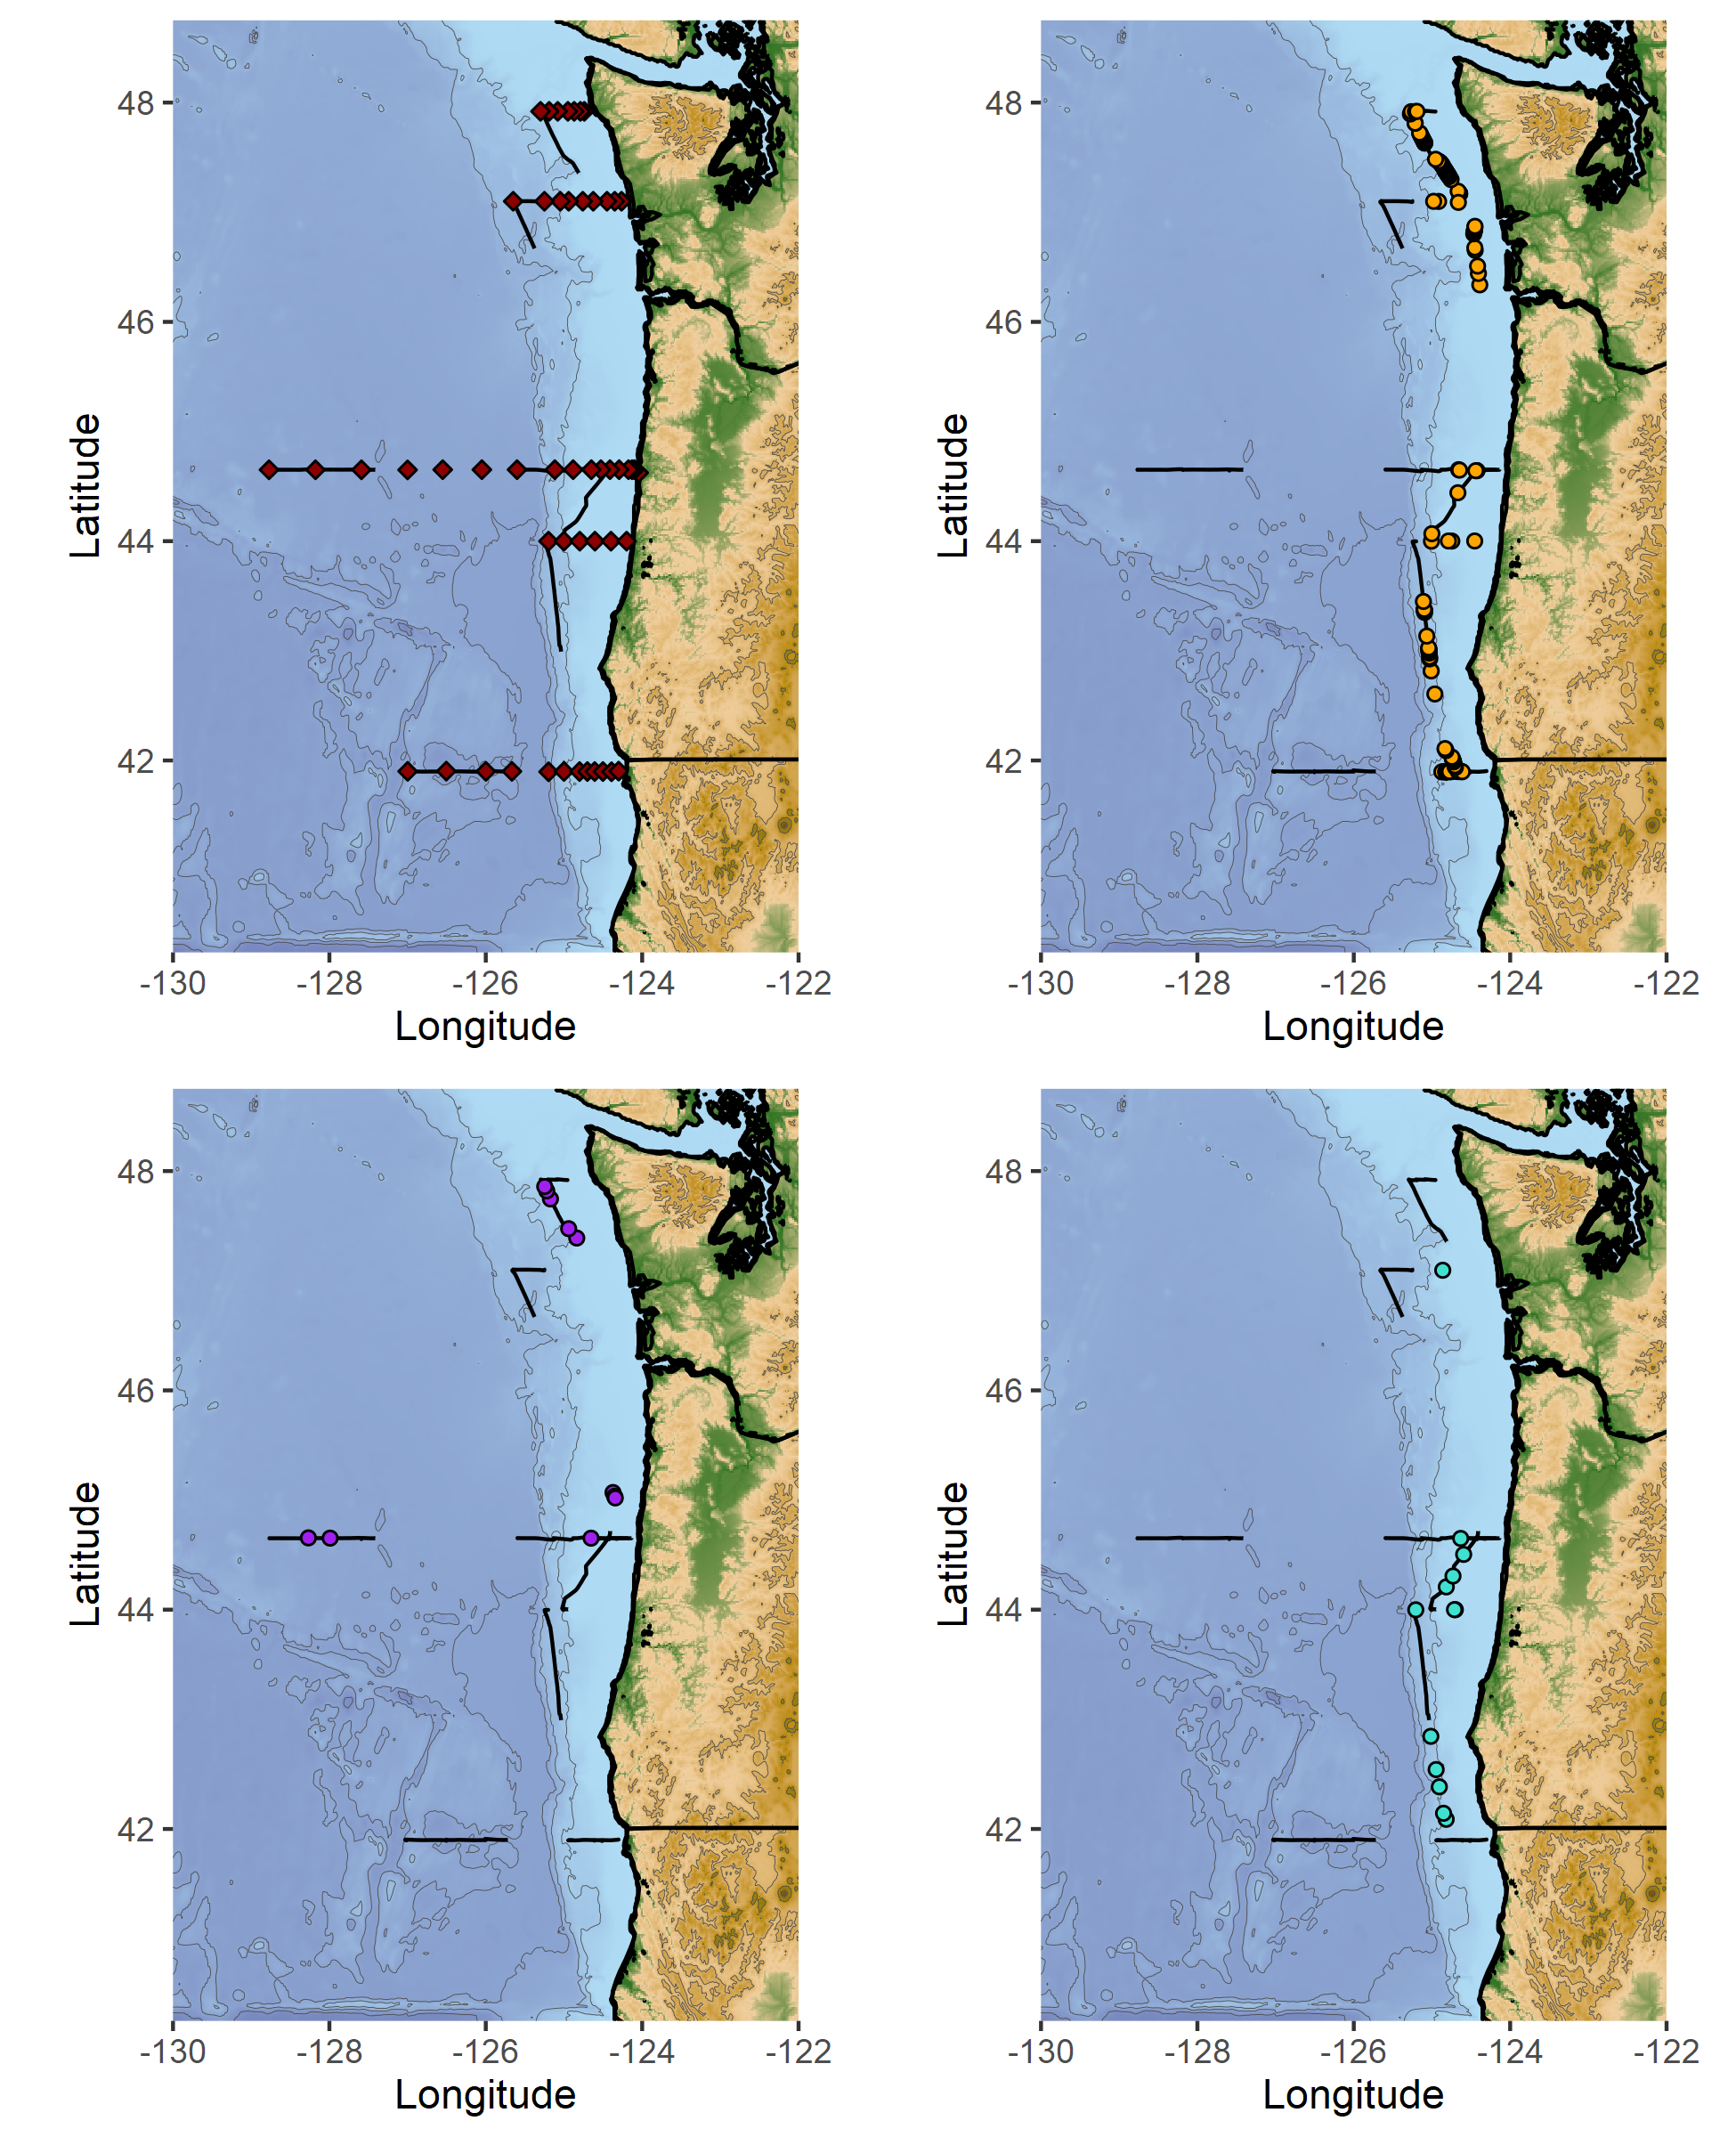
Hello from the RV Bell M. Shimada! We are currently sampling at an inshore station on the Heceta Head Line, which begins just south of Newport and heads out 45 nautical miles west into the Pacific Ocean. We’ll spend 10 days total at sea, which have so far been full of great weather, long days of observing, and lots of whales.
Dawn and Rachel in matching, many-layered outfits, 125 miles offshore on the flying bridge of the RV Bell M. Shimada.
Run by NOAA, this Northern California Current (NCC) cruise takes place three times per year. It is fabulously interdisciplinary, with teams concurrently conducting research on phytoplankton, zooplankton, seabirds, and more. The GEMM Lab will use the whale survey, krill, and oceanographic data to fuel species distribution models as part of Project OPAL. I’ll be working with this data for my PhD, and it’s great to be getting to know the region, study system, and sampling processes.
I’ve been to sea a number of times and always really enjoyed it, but this is my first time as part of a marine mammal survey. The type and timing of this work is so different from the many other types of oceanographic science that take place on a typical research cruise. While everyone else is scurrying around, deploying instruments and collecting samples at a “station” (a geographic waypoint in the ocean that is sampled repeatedly over time), we – the marine mammal team – are taking a break because we can only survey when the boat is moving. While everyone else is sleeping or relaxing during a long transit between stations, we’re hard at work up on the flying bridge of the ship, scanning the horizon for animals.
Top left: marine mammal survey effort (black lines), and oceanographic sampling stations (red diamonds). Top right: humpback whale sighting locations. Bottom left: fin whale sighting locations. Bottom right: pacific white-sided dolphin sighting locations.
During each “on effort” survey period, Dawn and I cover separate quadrants of ocean, each manning either the port or starboard side. We continuously scan the horizon for signs of whale blows or bodies, alternating between our eyes and binoculars. During long transits, we work in chunks – forty minutes on effort, and twenty minutes off effort. Staring at the sea all day is surprisingly tiring, and so our breaks often involve “going to the eye spa,” which entails pulling a neck gaiter or hat over your eyes and basking in the darkness.
Dawn has been joining these NCC cruises for the last four years, and her wealth of knowledge has been a great resource as I learn how to survey and identify marine mammals. Beyond learning the telltale signs of separate species, one of the biggest challenges has been learning how to read the sea better, to judge the difference between a frothy whitecap and a whale blow, or a distant dark wavelet and a dorsal fin. Other times, when conditions are amazing and it feels like we’re surrounded by whales, the trick is to try to predict the positions and trajectory of each whale so we don’t double-count them.
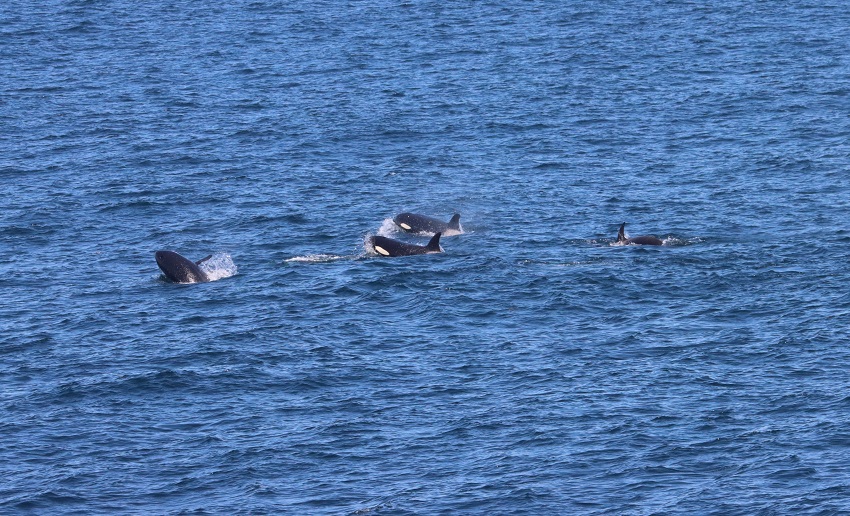
Over the last week, all our scanning has been amply rewarded. We’ve seen pods of dolphins play in our wake, and spotted Dall’s porpoises bounding alongside the ship. Here on the Heceta Line, we’ve seen a diversity of pinnipeds, including Northern fur seals, Stellar sea lions, and California sea lions. We’ve been surprised by several groups of fin whales, farther offshore than expected, and traveled alongside a pod of about 12 orcas for several minutes, which is exactly as magical as it sounds.
Killer whales traveling alongside the Bell M. Shimada, putting on a show for the NCC science team and ship crew. Photo by Dawn Barlow.
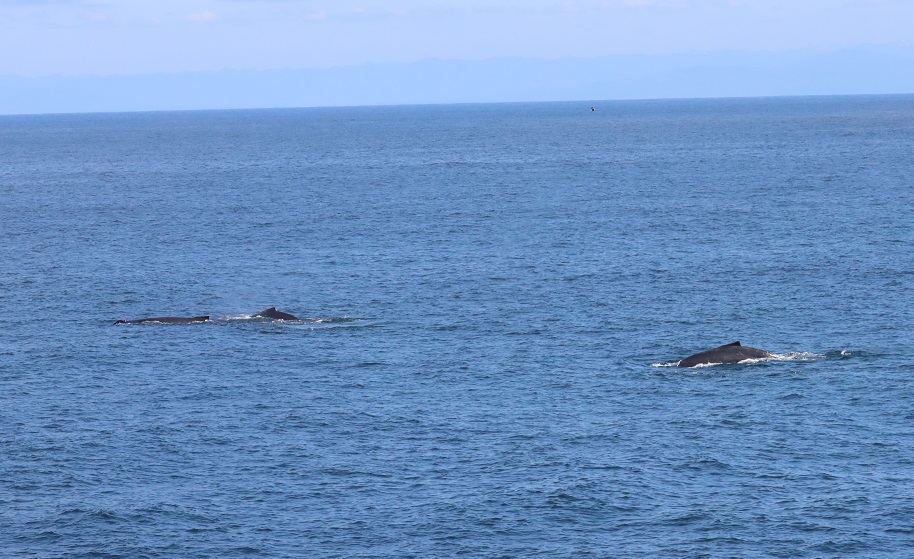
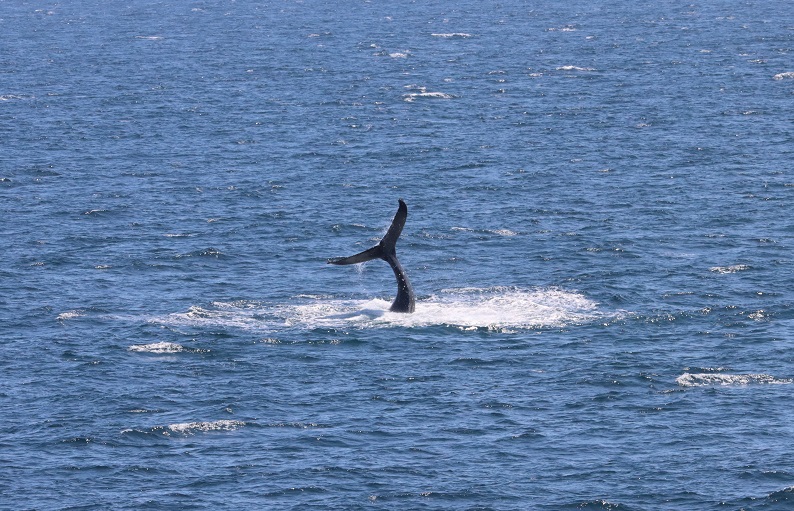
Notably, we’ve also seen dozens of humpbacks, including along what Dawn termed “the humpback highway” during our transit offshore of southern Oregon. One humpback put on a huge show just 200 meters from the ship, demonstrating fluke slapping behavior for several minutes. We wanted to be sure that everyone onboard could see the spectacle, so we radioed the news to the bridge, where the officers control the ship. They responded with my new favorite radio call ever: “Roger that, we are currently enamored.”
A group of humpbacks traveling along the humpback highway. Photo by Dawn Barlow.A humpback whale fluke slapping. Photo by Dawn Barlow.
Even with long days and tired eyes, we are still constantly enamored as well. It has been such a rewarding cruise so far, and it’s hard to think of returning back to “real life” next week. For now, we’re wishing you the same things we’re enjoying – great weather, unlimited coffee, and lots of whales!
Clara Bird, PhD Student, OSU Department of Fisheries, Wildlife, and Conservation Sciences, Geospatial Ecology of Marine Megafauna Lab
When I thought about what doing fieldwork would be like, before having done it myself, I imagined that it would be a challenging, but rewarding and fun experience (which it is). However, I underestimated both ends of the spectrum. I simultaneously did not expect just how hard it would be and could not imagine the thrill of working so close to whales in a beautiful place. One part that I really did not consider was the pre-season phase. Before we actually get out on the boats, we spend months preparing for the work. This prep work involves buying gear, revising and developing protocols, hiring new people, equipment maintenance and testing, and training new skills. Regardless of how many successful seasons came before a project, there are always new tasks and challenges in the preparation phase.
For example, as the GEMM Lab GRANITE project team geared up for its seventh field season, we had a few new components to prepare for. Just to remind you, the GRANITE (Gray whale Response to Ambient Noise Informed by Technology and Ecology) project’s field season typically takes place from June to mid-October of each year. Throughout this time period the field team goes out on a small RHIB (rigid hull inflatable boat), whenever the weather is good enough, to collect photo-ID data, fecal samples, and drone imagery of the Pacific Coast Feeding Group (PCFG) gray whales foraging near Newport, OR, USA. We use the data to assess the health, ecology and population dynamics of these whales, with our ultimate goal being to understand the effect of ambient noise on the population. As previous blogs have described, a typical field day involves long hours on the water looking for whales and collecting data. This year, one of our exciting new updates is that we are going out on two boats for the first part of the field season and starting our season 10 days early (our first day was May 20th). These updates are happening because a National Science Foundation funded seismic survey is being conducted within our study area starting in June. The aim of this survey is to assess geophysical structures but provides us with an opportunity to assess the effect of seismic noise on our study group by collecting data before, during, and after the survey. So, we started our season early in order to capture the “before seismic survey” data and we are using a two-boat approach to maximize our data collection ability.
While this is a cool opportunistic project, implementing the two-boat approach came with a new set of challenges. We had to find a second boat to use, buy a new set of gear for the second boat, figure out the best way to set up our gear on a boat we had not used before, and update our data processing protocols to include data collected from two boats on the same day. Using two boats also means that everyone on the core field team works every day. This core team includes Leigh (lab director/fearless leader), Todd (research assistant), Lisa (PhD student), Ale (new post-doc), and me (Clara, PhD student). Leigh and Todd are our experts in boat driving and working with whales, Todd is our experienced drone pilot, I am our newly certified drone pilot, and Lisa, Ale, and myself are boat drivers. Something I am particularly excited about this season is that Lisa, Ale, and I all have at least one field season under our belts, which means that we get to become more involved in the process. We are learning how to trailer and drive the boats, fly the drones, and handling more of the post-field work data processing. We are becoming more involved in every step of a field day from start to finish, and while it means taking on more responsibility, it feels really exciting. Throughout most of graduate school, we grow as researchers as we develop our analytical and writing skills. But it’s just as valuable to build our skillset for field work. The ocean conditions were not ideal on the first day of the field season, so we spent our first day practicing our field skills.
For our “dry run” of a field day, we went through the process of a typical day, which mostly involved a lot of learning from Leigh and Todd. Lisa practiced her trailering and launching of the boat (figure 1), Ale and Lisa practiced driving the boat, and I practiced flying the drone (figure 2). Even though we never left the bay or saw any whales, I thoroughly enjoyed our dry run. It was useful to run through our routine, without rushing, to get all the kinks out, and it also felt wonderful to be learning in a supportive environment. Practicing new skills is stressful to say the least, especially when there is expensive equipment involved, and no one wants to mess up when they’re being watched. But our group was full of support and appreciation for the challenges of learning. We cheered for successful boat launchings and dockings, and drone landings. I left that day feeling good about practicing and improving my drone piloting skills, full of gratitude for our team and excited for the season ahead.
Figure 1. Lisa (driving the truck) launching the boat.
Figure 2. Clara (seated, wearing a black jacket) landing the drone in Ale’s hands.
All the diligent prep work paid off on Saturday with a great first day (figure 3). We conducted five GoPro drops (figure 4), collected seven fecal samples from four different whales (figure 5), and flew four drone flights over three individuals including our star from last season, Sole. Combined, we collected two trifectas (photo-ID images, fecal samples, and drone footage)! Our goal is to get as many trifectas as possible because we use them to study the relationship between the drone data (body condition and behavior) and the fecal sample data (hormones). We were all exhausted after 10 hours on the water, but we were all very excited to kick-start our field season with a great day.
Figure 3. Lisa on the bow pulpit during our first sighting of the day.
Figure 4. Lisa doing a GoPro drop, she’s lowering the GoPro into the water using the line in her hands.
Figure 5. Clara and Ale collecting a fecal sample.
On Sunday, just one boat went out to collect more data from Sole after a rainy morning and I successfully flew over her from launching to landing! We have a long season ahead, but I am excited to learn and see what data we collect. Stay tuned for more updates from team GRANITE as our season progresses!
There are moments in our individual lifetimes that we can define as noteworthy and right now, as I prepare to start my graduate career within the Marine Mammal Institute (MMI) at OSU, I would say this is it for me. As I sit down to write this blog and document how surreal my future adventure is, I simultaneously feel this path is felicitous. After a year of being cooped up due to COVID, time presently seems to be going by at rocket speed. I am moving constantly in through my day to continue running my current life, while simultaneously arranging all that will encompass my new life. And while I answer questions to my 10-year-old daughter who is doing geometry homework in the living room, while hollering “That is not yours!” to the kitchen where the recently adopted feral dog is sticking his entire head under the trash can lid, while arranging our books in a cardboard box at the packing station I set up on the dining room table, I cannot deny a sense of serenity. This moment in my life, becoming a part of the GEMM Lab and MMI, and relocating to Corvallis is great.
This moment’s noteworthiness is emphasized by embarking on probably the most variable-heavy road trip I have planned to date. Since the age of 19, when I left my small mountain town on the Appalachian trail in Pennsylvania, I have transferred locations ~20 times. Due to extensive travel while serving in the Army (various Army trainings and overseas mission deployments), I have bounced around the US and to other countries often. Over time, one becomes acclimated to the hectic nature of this sort of lifestyle, and yet this new adventure holds significance.
So here are the details of the adventure trip that lies ahead: I will drive my 2002 Jeep Grand Cherokee across the country; from Charlottesville, Virginia to Corvallis, Oregon. My projected route will extend 2,822 miles and take ~43 driving hours total. The route will fall within the boundaries of 11 states (see Figure 1.)
Figure 1. Blue Line indicates route from Charlottesville to Corvallis (Google Maps)
Attached to the hitch of the Jeep will be a 6×12 rented cargo trailer containing our treasured books, furniture and things. Inside the Jeep will be three living variables: Mia (the 10-year-old), Angus (hyperactive border collie/ pit bull mix) and Mr. Gibbs (feral pirate dog); all three will need to be closely monitored for potential hiccups in the plan.
If we are going to make it to our destination hotel/Airbnb each night of the trip, I must be organized and calculate road time each day while factoring in breaks to the loo and fueling up. These calculations need to be precise, with little margin for error. I cannot play it too safely either, or it will take us too long to get across the country (I must start my graduate work after all). On the other hand, I cannot realistically expect too many road hours in a day. I think at this point I have got it worked out (Table 1.)
Table 1. Driving Hours and Miles Per Day
When I look back on my career, I had no idea that my not-so-smooth road would lead me to my dream goal of studying marine mammals. I took the Army placement tests at the age of 19, which led me to the field of “information operations” where I earned a great knowledge base in data analysis and encountered fantastic leaders whom I might not have known otherwise. I learned immensely on this path and it set me up very well for moving forward into research and collaboration in the sciences. I am so grateful that my life took this journey because working in the military provided me with the utmost respect for my opportunities and greater empathy for others. This route had many extreme obstacles and was intensely intimidating at times, but I am all the better for it. And I was never able to shake the dream of where I wanted to be (see Figures 2 & 3.) Timing is everything.
Figure 2 & 3. Two of the images of the Pacific coast I have hung up in my house. Keeping my eye on the prize, so to speak.
It will feel great to cross over the Oregon state line. I cannot wait to meet GEMM Lab in-person and all the other wonderful researchers and staff at MMI and Hatfield Marine Science Center. I am eager to step onto the RV Pacific Storm and begin my thesis research on the magnificent cetaceans off the Oregon coast, and hopefully do some good in the end. As I evaluate the logistics of my trip from Charlottesville to Corvallis, I feel relieved rather than overwhelmed. We could attribute this relief to my not-so-smooth road to get to where I am. Looking ahead, of course, I see a road that will require focus, attention, passion, care, and lots of fuel. Even if this road is not completely smooth, I will have my hands on 10 and 2, and feel so grateful and ready to be on it.