Wave riders or deep divers: what do cetaceans do in stormy weather?

By Lisa Hildebrand¹ and Samara Haver²

¹PhD Student, OSU Department of Fisheries, Wildlife, and Conservation Sciences, Geospatial Ecology of Marine Megafauna Lab 

²Postdoctoral Scholar, OSU Department of Fisheries, Wildlife, and Conservation Sciences, Cooperative Institute for Marine Resources Studies, Hatfield Marine Science Center

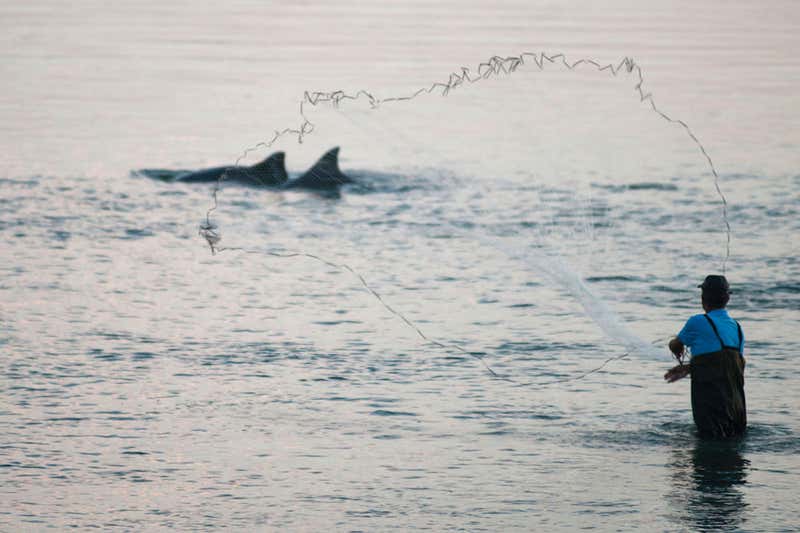
Many aspects of studying cetacean ecology, behavior, population dynamics, health, and sociality depend on being able to see and/or sample cetaceans when they come to the surface. While this research is not necessarily easy given that cetaceans spend the majority of their time underwater out of human sight, it is definitely feasible, as evidenced by decades of cetacean research. However, in order for researchers to observe cetaceans at the surface they need to get out to sea, and this boat-based effort can realistically only be done in good ocean conditions. Any sea-going individual likely uses the Beaufort sea state (BSS) scale as a measure of ocean conditions. For a full breakdown and excellent explanation of what the BSS is, check out our beloved Alexa’s blog; but for the purposes of this blog all you really need to know is that the smaller the BSS (which starts at 0), the calmer the ocean, and the higher the BSS, the rougher & stormier the ocean. There are two main reasons for conducting cetacean research in low BSS: 1) above a certain threshold (usually BSS 4) it becomes difficult to reliably spot and recognize cetaceans at the surface, thus compromising good data collection, and/or 2) to ensure safety and comfort of the research team. 

So, when the BSS gets too high, us humans usually do not go out to sea to study cetaceans, which means that the cetaceans, for the most part, go unobserved. So, many questions arise about what cetaceans are doing during these rough ocean conditions. What does an increased BSS mean for them? Are they unfazed by big waves and strong winds, or are they affected by the weather and take longer dives or seek out fairer seas? A conversation among friends sparked our curiosity of what cetaceans do in stormy conditions and inspired us to collaborate on this blog. Here, we report on what is and is not known about cetaceans in storms, and discuss some ideas about how best to quantify the effects of rough sea conditions on cetaceans.

Slide the arrows to compare sea conditions (BSS 1 [left] vs BSS 6 [right]) experienced by Alexa, the GEMM Lab marine mammal observer on the May 2019 Northern California Current cruise onboard NOAA ship Bell M. Shimada. Source: A. Kownacki/GEMM Lab.

A literature search of cetaceans during storms did not generate many results, which was not surprising to us given the above reasons about researchers not being able to survey in rough sea conditions. However, we did find a couple of interesting studies about cetacean behavior and distribution after storms.

Changes in foraging behavior

Autumnal storms in Maryland, USA resulted in less frequent and shorter encounters of bottlenose dolphins in the US Mid-Atlantic Bight. However, dolphins spent a significantly higher percentage of their encounters feeding after storms than they did before or during them (Fandel et al. 2020). Similarly, bottlenose dolphins in Mississippi Sound displayed an approximately 15% increase in foraging activity for up to 2 years following Hurricane Katrina (Smith et al. 2013). These changes in foraging behavior are attributed to shifts in distributions and behavior of dolphin prey species as a result of altered environmental conditions (primarily sea surface temperature and salinity) following the hurricanes.

Out-of-habitat events and strandings

An out-of-habitat event occurs when an animal is displaced out of its typical habitat. Seven of these events were reported following Hurricane Rita, which hit the southwest Louisiana coast in 2005, with bottlenose dolphins found in flooded roadside ditches, canals, shallow flooded fields, and a natural creek area (Rosel & Watts 2008). These locations ranged from 2.5 to 11 km inland from the coast of the Gulf of Mexico, where these dolphins were displaced from. It is believed that the animals were carried inland on the storm surge that accompanied Hurricane Rita and were left stranded in areas that held water the longest once it started receding (Rosel & Watts 2008).

One of the roadside ditches where a bottlenose dolphin was trapped in Louisiana following Hurricane Rita. Taken from Rosel & Watts (2008).

There have been two mass strandings of pygmy killer whales that are believed to have been a result of hurricanes. In 1995, five pygmy killer whales stranded (three of which died, while two were successfully refloated) in the British Virgin Islands a day after Hurricane Marilyn (Mignucci-Giannoni et al. 1999). In 2006, six pygmy killer whales (five of which died) stranded in New Caledonia during and after Hurricane Jim (Clua et al. 2014). Both studies hypothesize that increased energetic costs, as a result of attempting to evade the hurricanes, coupled with animals becoming disoriented and ending up in shallow waters, is what caused them to strand. 

While these studies reveal post-storm effects on cetaceans, we still do not know exactly how these individuals behaved during the storms. Did they attempt longer dives to stay away from the rough conditions at the surface, thus becoming disoriented? Or were they behaving normally (i.e. foraging, travelling) and were simply “pushed” into waters that they did not intend to go into? Given that very stormy sea conditions do not allow for visual, boat-based surveys, we need to employ different technologies to study cetacean behavior and distribution during storms.

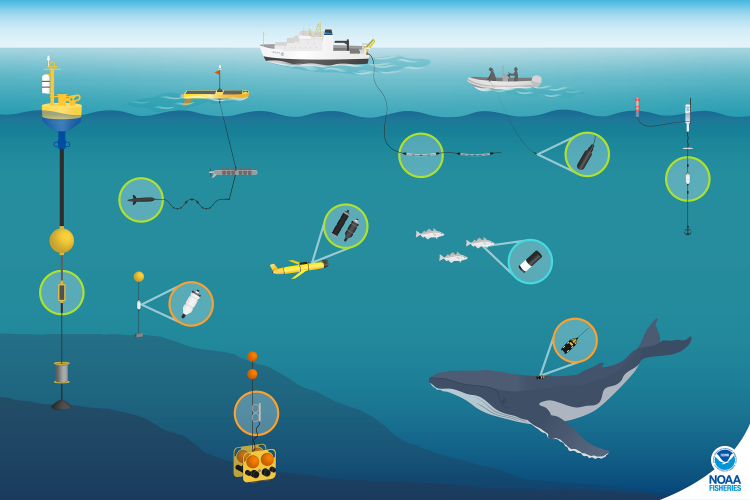
Passive acoustic monitoring (PAM) is a great tool that can monitor ocean environments for us when the seas are too stormy. Using fixed or mobile platforms, underwater PAM listening devices (hydrophone and data storage) can record sounds in the ocean for us to listen and analyze from shore. With PAM we are able to track the vocalizations of marine mammals as well as other sounds in the environment, such as waves crashing and rain. Anecdotally, we have spent many days at sea in conditions that were too rough for visual observations, but we could safely use our PAM tools to detect cetaceans. So, just because the seas may be too rough to see cetaceans, this fact does not mean that we cannot observe them – we just need to listen instead of look. 

There are many tools that can be used to record underwater sounds, including passive acoustic monitoring (PAM; shown in orange), real-time acoustic data collection (green), and active acoustics (blue.) Source: NOAA Fisheries.

A number of studies have investigated whether whales change their vocalization behavior differently in response to changing ambient sound conditions (for example: Dunlop et al. 2010; Fournet et al. 2018). While research on ocean sound levels is often focused on the impact of human-generated or anthropogenic noise, there are also natural, abiotic sound sources (e.g. wind, rain, ice) that can elevate ambient sound levels. One potential animal response to elevated ambient sound levels is to vocalize at a higher intensity, called the Lombard (or cocktail party) effect. This phenomenon is common for us humans – have you ever been at a party and at some point you realize that you are shouting to someone in order to be heard above the noise of the room? That’s the Lombard effect! Humpback whales in Glacier Bay National Park, Alaska, exhibited the Lombard effect in response to both natural and man-made sounds, but the probability of calling was lower when vessels were present compared to times with only natural sounds (Fournet et al. 2018). It is also possible that whales may vocalize at different frequencies, times, or for shorter durations when the ocean becomes louder, which we can easily track with PAM. Unfortunately, PAM is limited to what we are able to hear, so if we do not hear whales we cannot determine if this result is because their vocalizations are masked by higher intensity sounds, if they stopped vocalizing, or if they left the listening area. 

Animal-borne tags are another kind of autonomous observation tool that could help us understand cetacean behavior and distribution in storms. Admittedly, the logistics of applying tags before an imminent storm are probably complex. However, the development of medium-duration archival tags may provide a good trade-off between deploying tags long enough before a storm begins, thus providing safe working conditions for the research team, while minimizing potential physical impacts to the animals (Szesciorka et al. 2016). There are currently no published tag studies that document cetacean behavior during storms, but a study of a gray-headed albatross, fitted with a satellite transmitter, that successfully foraged during an Antarctic storm (Catry et al. 2004) shows the promise of using animal-borne tags to answer these questions.  

As with many questions about animal behavior, our best option is to combine all of our research tools to piece together evidence about what might be going on in the deep, dark, stormy ocean. Simultaneously collecting acoustic and movement & behavior data through PAM and animal-borne tags, respectively, could allow us to determine how cetaceans behave during storms. While we are probably not poised to tackle these questions right now, perhaps another curious graduate student can take it on for their own PhD research…

References

Catry, P., Phillips, R.A., and J.P. Croxall. Sustained fast travel by a gray-headed albatross (Thalassarchie chrysostoma) riding an Antarctic storm. The Auk 121(4):1208-1213.

Clua, E.E., Manire, C.A., and C. Garrigue. 2014. Biological data of pygmy killer whales (Feresa attenuata) from a mass stranding in New Caledonia (South Pacific) associated with Hurricane Jim in 2006. Aquatic Mammals 40(2):162-172.

Dunlop, R.A., Cato, D.H., and M.J. Noad. 2010. Your attention please: increasing ambient noise levels elicits a change in communication behaviour in humpback whales (Megaptera novaeangliae). Proceedings of the Royal Society B 277(1693):doi.org/10.1098/rspb.2009.2319. 

Fandel, A.D., Garrod, A., Hoover, A.L., Wingfield, J.E., Lyubchich, V., Secor, D.H., Hodge, K.B., Rice, A.N., and H. Bailey. 2020. Effects of intense storm events on dolphin occurrence and foraging behavior. Scientific Reports 10:19247.

Fournet, M.E.H., Matthews, L.P., Gabriele, C.M., Haver, S., Mellinger, D.K., and H. Klinck. 2018. Humpback whales Megaptera novaeangliae alter calling behavior in response to natural sounds and vessel noise. Marine Ecology Progress Series 607:251-268.

Mignucci-Giannoni, A.A., Toyos-González, G. M., Pérez-Padilla, J., Rodríguez-López, M. A., and J. Overing. 1999. Mass stranding of pygmy killer whales (Feresa attenuata) in the British Virgin Islands. Journal of the Marine Biological Association of the United Kingdom 80:759-760.

Rosel, P.E., and H. Watts. 2008. Hurricane impacts on bottlenose dolphins in the northern Gulf of Mexico. Gulf of Mexico Science 25:7.

Smith, C.E., Hurley, B.J., Toms, C.N., Mackey, A.D., Solangi, M., and S.A. Kuczaj II. 2013. Hurricane impacts on the foraging patterns of bottlenose dolphins Tursiops truncatus in Mississippi Sound. Marine Ecology Progress Series 487:231-244.

Szesciorka, A.R., Calambokidis, J., and J.T. Harvey. 2016. Testing tag attachments to increase the attachment duration of archival tags on baleen whales. Animal Biotelemetry 4:18.

Love thy mother: maternal care in cetaceans

By Lisa Hildebrand, PhD student, OSU Department of Fisheries & Wildlife, Geospatial Ecology of Marine Megafauna Lab

Last week marked the one year anniversary of the pandemic reality we have all been living. It has been an extremely challenging year, with everyone experiencing different kinds of difficulties and hurdles. One challenge that likely unites the majority of us is having to forego seeing our loved ones. For me personally, this is the longest time I have not seen my family (445 days and counting) and I know I am not alone in this situation. My homesickness started a train of thought about cetacean parental care and inspired me to write a blog about this topic. As you can see from the title, this post focuses on maternal care, rather than parental care. This bias isn’t due to my lack of research on this topic or active exclusion, but rather because there are currently no known cetacean species where paternal participation in offspring production and development extends beyond copulation (Rendell et al. 2019). Thus, this blog is all about the role of mothers in the lives of cetacean calves.

Like humans, cetacean mothers invest a lot of energy into their offspring. Most species have a gestation period of 10 or more months (Oftedal 1997). For baleen whale females in particular, pregnancy is not an easy feat given that they only feed during summer feeding seasons. They must therefore acquire all of the energy they will need for two migrations, birth, and (almost) complete lactation, before they will have access to food on feeding grounds again. For pregnant gray whales, a mere 4% loss in average energy intake on the foraging grounds will prevent her from successfully producing and/or weaning a calf (Villegas-Amtmann et al. 2015), demonstrating how crucial the foraging season is for a pregnant baleen whale. Once a calf is born, lactation ensues, ranging in length between approximately 6-8 months for most baleen whale species to upwards of one or two years in odontocetes (Oftedal 1997). The very short lactation period in baleen whales is offset by the large volume (for blue whales, up to 220 kg per day) and high fat percentage (30-50%) of milk that mothers provide for their calves (Oftedal 1997). In contrast, odontocetes (or toothed whales) have a more prolonged period of lactation with less fatty milk (10-30%). This discrepancy in lactation period lengths is in part because odontocete species do not undertake long migrations, which allows females to feed year-round and therefore allocate energy to nursing young for a longer time. 

Blue whale calf nursing in New Zealand in 2016. Footage captured via unmanned aerial system (UAS; drone) piloted by Todd Chandler for GEMM Lab’s OBSIDIAN project. Source: GEMM Lab.

Aside from the energetically costly task of lactation, cetacean mothers must also assist their calves as they learn to swim. Echelon swimming is a common position of mother-calf pairs whereby the calf is in very close proximity to its mother’s mid-lateral flank and provides calves with hydrodynamic benefits. Studies in bottlenose dolphins have shown that swimming in echelon results in a 24% reduction in mean maximum swim speeds and a 13% decrease in distance per stroke (Noren 2008) for mothers, while concurrently increasing average swim speeds and distance per stroke of calves by 28% and 19%, respectively (Noren et al. 2007). While these studies have only been conducted in odontocete species, echelon swimming is also observed in baleen whales (Smultea et al. 2017), indicating that baleen whale females may experience the same reductions in swimming efficiency. Furthermore, mothers will forgo sleep in the first days after birth (killer whales & bottlenose dolphins; Lyamin et al. 2005) and/or shorten their dive foraging times to accommodate calf diving ability (bottlenose dolphins [Miketa et al. 2018] & belugas [Heide-Jørgensen et al. 2001]). Females must endure these losses in foraging opportunities and decreased swimming efficiency when they are at their most nutritionally stressed to ensure the well-being and success of their offspring.

It is at the time of weaning (when a calf becomes independent), that we start to see differences in the maternal role between baleen and toothed whale mothers. Odontocetes have much stronger sociality than baleen whales causing offspring to stay with their mothers for much longer periods. Among the largest toothed whales, such as killer and sperm whales, offspring stay with their mothers in stable matrilineal units for often a lifetime. Among the smaller toothed whales, such as bottlenose dolphins, maternal kin maintain strong bonds in dynamic fission-fusion societies. In contrast, post-weaning maternal care in baleen whales is limited, with the mother-calf pair typically separating soon after the calf is weaned (Rendell et al. 2019). 

Conceptual diagram depicting where baleen (Mysticeti) and toothed (Odontoceti) whales fall on the continuum of low to high social structure and matrilineal kinship structure. The networks at the top depict long-term datasets of photo-identified individuals (red nodes = females, blue nodes = males, yellow nodes = calves) with thickness of connecting lines representing strength of association between individuals. Figure and caption [adapted] from Rendell et al. 2019.

The long-term impact of social bonds in odontocetes is evident through examples of vertically transmitted behaviors (from mother to calf) in a number of species. For example, the use of three unique foraging tactics (sponge carrying, rooster-tail foraging, and mill foraging) by bottlenose dolphin calves in Shark Bay, Australia, was only significantly explained by maternal use of these tactics (Sargeant & Mann 2009). In Brazil, individuals of four bottlenose dolphin populations along the coast cooperatively forage with artisanal fishermen, which involves specialized and coordinated behaviors from both species. This cooperative foraging tactic among dolphins is primarily maintained across generations via social learning from mothers to calves (Simões-Lopeset al. 2016). The risky tactic of intentional stranding by killer whales on beaches to capture elephant seal pups requires a high degree of skill and high parental investment to reduce the associated risk of stranding (Guinet & Bouvier 1995). 

Evidence for vertical transmission of specialized foraging tactics in baleen whales currently does not exist. Bubble-net feeding is a specialized tactic employed by humpback whales in three oceanic regions where multiple individuals work together to herd and trap prey (Wiley et al. 2011). However, it remains unknown whether this behavior is vertically transmitted. Simultaneous video tags from a mother-calf humpback whale pair in the Western Antarctic Peninsula documented synchrony in dives, with the calf’s track lagging behind the mother’s by 4.5 seconds, suggesting that the calf was following its mother (Tyson et al. 2012). Synchronous diving likely allows calves to observe their mothers and practice their diving, and could offer a pathway for them to mimic foraging behaviors and tactics displayed by mothers. 

While there currently may not be evidence for vertical transmission of specialized foraging tactics among the baleen whales, there is documentation of matrilineal fidelity to both foraging (Weinrich 1998, Barendse et al. 2013, Burnham & Duffus 2020) and breeding grounds (Carroll et al. 2015). Matrilineal site fidelity to foraging grounds is not exclusive to baleen whales and has also been documented in a number of odontocete species (Palsbøll et al. 1997, Turgeon et al. 2012). 

In the GEMM Lab, we are interested in exploring the potential long-term bonds, role and impact of Pacific Coast Feeding Group (PCFG) gray whale mothers on their calves. GEMM Lab PhD student Clara Bird is digging into whether specialized foraging tactics, such as bubble blasts and headstands, are passed down from mothers to calves. I hope to assess whether using the PCFG range as a foraging ground (rather than the Arctic region) is a vertically transmitted behavior or whether environmental factors may play a larger role in the recruitment and dynamics of the PCFG. It will take us a while to get to the bottom of these questions, so in the meantime hug your loved ones if it’s safe to do so or, if you’re in my boat, continue to talk to them virtually until it is safe to be reunited.

References

Barendse, J., Best, P. B., Carvalho, I., and C. Pomilla. 2013. Mother knows best: occurrence and associations of resighted humpback whales suggest maternally derived fidelity to a southern hemisphere coastal feeding ground. PloS ONE 8:e81238.

Burnham, R. E., and D. A. Duffus. 2020. Maternal behaviors of gray whales (Eschrichtius robustus) on a summer foraging site. Marine Mammal Science 36:1212-1230.

Carroll, E. L., Baker, C. S., Watson, M., Alderman, R., Bannister, J., Gaggiotti, O. E., Gröcke, D. R., Patenaude, N., and R. Harcourt. 2015. Cultural traditions across a migratory network shape the genetic structure of southern right whales around Australia and New Zealand. Scientific Reports 5:16182.

Guinet, C., and J. Bouvier. 1995. Development of intentional stranding hunting techniques in killer whale (Orcinus orca) calves at Crozet Archipelago. Canadian Journal of Zoology 73:27-33.

Heide-Jørgensen, M. P., Hammeken, N., Dietz, R., Orr, J., and P. R. Richard. 2001. Surfacing times and dive rates for narwhals and belugas. Arctic 54:207-355.

Lyamin, O., Pryaslova, J., Lance, V., and J. Siegel. 2005. Continuous activity in cetaceans after birth. Nature 435:1177.

Miketa, M. L., Patterson, E. M., Krzyszczyk, E., Foroughirad, V., and J. Mann. 2018. Calf age and sex affect maternal diving behavior in Shark Bay bottlenose dolphins. Animal Behavior 137:107-117.

Noren, S. R. 2008. Infant carrying behavior in dolphins: costly parental care in an aquatic environment. Functional Ecology 22:284-288.

Noren, S. R., Biedenbach, F., Redfern, J. V., and E. F. Edwards. 2007. Hitching a ride: the formation locomotion strategy of dolphin calves. Functional Ecology 22:278-283.

Oftedal, O. T. Lactation in whales and dolphins: evidence of divergence between baleen- and toothed-species. Journal of Mammary Gland Biology and Neoplasia 2:205-230.

Palsbøll, P. J., Heide-Jørgensen, M. P., and R. Dietz. 1996. Population structure and seasonal movements of narwhals, Monodon monoceros, determined from mtDNA analysis. Heredity 78:284-292.

Rendell, L., Cantor, M., Gero, S., Whitehead, H., and J. Mann. 2019. Causes and consequences of female centrality in cetacean societies. Philosophical Transactions of the Royal Society B 374:20180066.

Sargeant, B. L., and J. Mann. 2009. Developmental evidence for foraging traditions in wild bottlenose dolphins. Animal Behavior 78:715-721.

Simões-Lopes, P. C., Daura-Jorge, F. G., and M. Cantor. 2016. Clues of cultural transmission in cooperative foraging between artisanal fishermen and bottlenose dolphins, Tursiops truncatus (Cetacea: Delphinidae). Zoologia (Curitiba) 33:e20160107.

Smultea, M. A., Fertl, D., Bacon, C. E., Moore, M. R., James, V. R., and B. Würsig. 2017. Cetacean mother-calf behavior observed from a small aircraft off Southern California. Animal Behavior and Cognition 4:1-23.

Turgeon, J., Duchesne, P., Colbeck, G. J., Postma, L. D., and M. O. Hammill. 2011. Spatiotemporal segregation among summer stocks of beluga (Delphinapterus leucas) despite nuclear gene flow: implication for the endangered belugas in eastern Hudson Bay (Canada). Conservation Genetics 13:419-433.

Tyson, R. B., Friedlaender, A. S., Ware, C., Stimpert, A. K., and D. P. Nowacek. 2012. Synchronous mother and calf foraging behaviour in humpback whales Megaptera novaeangliae: insights from multi-sensor suction cup tags. Marine Ecology Progress Series 457:209-220.

Villegas-Amtmann, S., Schwarz, L. K., Sumich, J. L., and D. P. Costa. 2015. A bioenergetics model to evaluate demographic consequences of disturbance in marine mammals applied to gray whales. Ecosphere 6:1-19.

Weinrich, M. 1998. Early experience in habitat choice by humpback whales (Megaptera novaeaengliae). Journal of Mammalogy 79:163-170.

Wiley, D., Ware, C., Bocconcelli, A., Cholewiak, D., Friedlaender, A., Thompson, M., and M. Weinrich. 2011. Underwater components of humpback whale bubble-net feeding behavior. Behavior 148:575-602.

Five mind-blowing facts about sperm whales

By Solène Derville, Postdoctoral Scholar, OSU Department of Fisheries and Wildlife, Geospatial Ecology of Marine Megafauna Lab

Having worked almost exclusively on humpback whales for the past 5 years, I recently realized how specialized I have become when I was asked to participate in an expedition targeting another legendary cetacean, which I discovered I knew so little about: the sperm whale. On November 18th I boarded a catamaran with a team of 8 other seamen, film makers and scientists, all ready to sail off the west coast of New Caledonia in the search of this elusive animal. The expedition was named “Code CODA” in reference to the unique patterned series of clicks produced by sperm whales.

As I prepared for the expedition, I did my scientific literature homework and felt a growing awe for sperm whales. At every step of my research, whether I investigated their morphology, physiology, social behavior, feeding habits… everything about them appeared to be exceptional. Below is a list summarizing five mind-blowing facts everyone should know about sperm whales.

A sperm whale sketch I made on the boat in preparation for this blog post (Illustration credit: Solène Derville)

Sea giants

 Sperm whales are the largest of the odontocetes species, which is the group of “toothed whales” that also includes dolphins, porpoises and beaked whales. They show a strong sexual dimorphism, unusual for a cetacean, as adult males can be about twice as big as adult females. Indeed, male sperm whales can reach up to 18 m and 56 tons (approximately the weight of 9 elephants!). Their massive block-shaped head is perhaps their most distinctive feature. It contains the largest brain in the animal kingdom and as a comparison, it is claimed that an entire car could fit in it! By its morphology alone, the sperm whale hence appears like an all-round champion of cetaceans.

Abyssal divers

 Sperm whales are some of the best divers among air-breathing sea creatures. They have been recorded down to 2,250 m, and sperm whale carcasses have been found entangled in deep-sea cables suggesting that they can dive even deeper. In these dark and cold waters, sperm whales hunt for fish and squids (and sometimes check out ROVs, see videos of a surprising deep sea encounter made in 2015 off the coast of Louisiana, on Nautilus Live). They are renowned for attacking giant (Architeuthis spp) and colossal (Mesonychoteuthis hamiltoni) squids, which can reach more than 10 m in length. The squid sucker scars born by sperm whales give evidence of these titan combats. Because sperm whales only have teeth on the lower jaw, they cannot chew and may end up eating their prey alive. But every problem has its solution… sperm whales have evolved the longest digestive system in the world: it can reach 300 m long! Their stomach is divided into four compartments, the first of which is covered by a thick and muscular lining that can resist the assault of live prey.

Deluxe poopers  

The digestion of sperm whale prey happens in the next digestive compartments, but one component will resist: the squids’ beaks! As beaks accumulate in the digestive system (up to 18,000 beaks were found in a specimen!), they cause an irritation that is responsible for the production of a waxy substance known as ‘ambergris’. After a while, this substance is thought to be occasionally secreted along with the whale’s poop (although it has been speculated that large pieces of ambergris might be expelled by the mouth… charming!). Ambergris may be found floating at sea or washed up on coastlines, where it may make one happy beachcomber! The latest report of such a lucky finding of ambergris in 2016 was estimated at more than US$71,000 for a 1.57 kg lump. Indeed, ambergris is a valued additive used in perfume, although it has now mostly been replaced by synthetic equivalents. The use of ambergris in cooking, incense or medication in ancient Egypt and the Middle Ages is also reported.

Ambergris lump found in the UK in 2018 (photo credit: APEX, source: https://www.bbc.com/news/uk-england-devon-42703991)

Caring whales

Sperm whales are highly social animals. They are organized in “clans” with their own vocal repertoire and behavioral traits that differ geographically. Clans are formed by several connected social units, which are ruled by a complex matrilineal system. While adult males typically live solitary lives, females remain in family units composed of their close female relatives. Within these groups, females take communal care of the calves, even nursing the calves of other females. Every female can act as a babysitter to the group’s calves at the surface while the clan members perform deep foraging dives of approximately 40 min. Juvenile males may also provide care to the younger calves in the group as they remain in the group far past weaning, up to 9 to 19 years old. When attacked by predators (mostly killer whales), all the group members will protect the younger and most vulnerable individuals by adopting a compact formation, either the “marguerite” (facing inwards with their tails out and the young at the center for protection) or the “heads-out” version.

Social interaction in a pod of sperm whales… much like the whale version of a cuddle (photo credit: Tony Wu)

Powerful sonars

Like other toothed whales, sperm whales use sound to echolocate and communicate. But again, sperm whales stand out from the crowd with the unique spermaceti organ that allows them to produce the most powerful sound in the animal kingdom, reaching a source level of about 230 dB within frequencies of 5 to 25 kHz (this is louder than the sound of a jet engine at take-off). The spermaceti organ is a large cavity surrounded by a tough and fibrous wall called “the case”, and is filled with up to 1,900 liters of a fatty and waxy liquid called “spermaceti”. The spermaceti oil is chemically very different from the oils found in the melons (heads) of most other species of odontocetes, which also explains why sperm whales were particularly targeted by whalers of the 19th and 20th centuries. Indeed, the spermaceti oil has exceptional lubricant properties, and thus was used in fine machinery and even in the aerospace industry.

Original figure from Raven & Gregory 1933

Sperm whales are among the most widely distributed animals in the world, as they roam waters from the ice-edge to the equator. While pre-whaling global abundance is thought to have been 1,110,000 sperm whales, the most recent estimate suggests that only about a third of this number currently populates the ocean. It is our absolute duty to make sure that these marvelous, superlative animals recover from our past mistakes and that they can be admired by future generations.

Sources:

Gero, Shane, Jonathan Gordon, and Hal Whitehead (2013) “Calves as Social Hubs: Dynamics of the Social Network within Sperm Whale Units.” Proceedings of the Royal Society B: Biological Sciences 280 (1763). https://doi.org/10.1098/rspb.2013.1113

Graber, Cynthia (2007) “Strange but True: Whale Waste Is Extremely Valuable.” Scientific American. https://www.scientificamerican.com/article/strange-but-true-whale-waste-is-valuable/

Møhl, Bertel, Magnus Wahlberg, Peter T. Madsen, Anders Heerfordt, and Anders Lund (2003) “The Monopulsed Nature of Sperm Whale Clicks.” The Journal of the Acoustical Society of America, 114 (2): 1143–54. https://doi.org/10.1121/1.1586258

Raven, H C, and William K Gregory (1933) “The Spermaceti Organ and Nasal Passages of the Sperm Whale (Physeter Catodon) and Other Odontocetes.” American Museum Novitates, no. 677.

Whitehead, Hal (2018) “Sperm Whale.” Encyclopedia of Marine Mammals, 919–25. https://doi.org/10.1016/b978-0-12-804327-1.00242-9

Humans Hide and Wildlife Thrive: Human-mediated ecosystem changes during a pandemic

By: Alexa Kownacki, Ph.D. Student, OSU Department of Fisheries and Wildlife, Geospatial Ecology of Marine Megafauna Lab

We live in an interesting time. Many of us academic scientists sit in the confines of our homes, reading scientific papers, analyzing years-worth of data, working through a years-worth of house projects, or simply watching Netflix. While we are confined to a much smaller area, wildlife is not.  

During this challenging situation we have unique opportunities to study what happens when people are not outside for recreation. All of us who feel trapped inside our homes are not only saving human lives, we are changing ecosystems. Humans are constantly molding our ecosystems on fine and grand scales, from xeriscaping our lawns with native, drought-resistant plants to developing large plots of land for new homes. We manipulate nature, for better or for worse.

So, what happens when we change our behavior? Rather than driving, we’re gardening, instead of playing at parks, we’re playing board games at our kitchen tables; we as a society are completely changing our habitat-use patterns. When any top predator changes its habitat-use, switches niches, or drastically changes its behaviors, there are top-down ecosystem effects. When one species changes its behavior, there are major downstream impacts on predation, foraging, diet, and habitat use. For example, when bluegill sunfish underwent large shifts in both diet and habitat, major predator-mediated habitat use changes in other species occurred (Mittelbach 1986). There are multiple studies describing the impacts of human-mediated drivers on ecosystems worldwide. In coastal environments, anthropogenic activities, specifically shipping, industry, and urban development, dramatically change both the coastal and marine ecosystems (Mead et al. 2013).

The highly developed coastline along Los Angeles, CA is a prime example of urban development. (Image source: LA Magazine.)

By far the most pronounced example of how an international halt on travel can alter ecosystems comes from the tragic terrorist attacks on September 11, 2001. Prior to this current, viral pandemic, the events following 9/11 were the first time that nearly all major transit stopped in the USA—including airplanes and major shipping traffic. This halt created a unique opportunity to study some of the secondary impacts, such as a reduction in shipping traffic noise, on cetaceans. Following 9/11, there was a six decibel decrease in underwater noise that co-occurred with a decrease in stress hormones of endangered North Atlantic right whales (Rolland et al. 2012). When I first read about this study, my first thought was “leave it to scientists to make the best out of a terrible situation.” Truly, learning from nature, even in the darkest of days, is an incredible skillset. Research like this inspires me to ask questions about what changes are happening in ecosystems now because of recent events. For example, the entire port of San Diego, its beaches and bays, are closed for all recreational activity and I wonder how this reduction in traffic is similar to the post-9/11 study but on bottlenose dolphins, gray whales, and pinnipeds that are coast-associated. Are urban and suburban neighborhoods slowly becoming more rural and making space for wildlife again?

My dad lives in a suburban neighborhood of San Diego, CA. In the past few weeks, his “Ring doorbell camera” captured a bobcat walking along the raised brick path multiple times. (Media source: Eric Kownacki)

There is increasing news coverage on wild animals “taking over” cities. Dr. Leila Lemos touched on this earlier with her blog post centering on how academics are changing their means of teaching, conferencing, and learning. There are photos of wild goats running through the streets of Wales, UK, coyotes roaming the streets of San Francisco, CA, USA, monkeys swarming the streets in Thailand, pumas wandering the streets of Santiago, Chile, and Sika deer peering into empty restaurants in Nara, Japan (Colarossi 2020). In reality, this wildlife was likely part of the ecosystem prior to the formation of these cities but was forced out of the more urban centers. As we sit in our homes, rather than looking bleakly onto empty streets, we can search for wildlife, create a backyard birding competition with your friends, guess which flowers will bloom first, and ask questions of our changing ecosystems.

Coyote at a park in northern California with the San Francisco Golden Gate Bridge in the background. (Image source: u/beccatravels via Reddit)

Citations:

Colarossi, Natalie. “Photos Show Wild Animals Roaming Empty Streets as Coronavirus Lockdowns Keep Humans Inside.” Insider, Insider, 2 Apr. 2020, www.insider.com/photos-show-animals-roaming-empty-streets-during-coronavirus-lockdowns-2020-4#in-santiago-chile-a-wild-puma-was-seen-pacing-through-the-quiet-streets-according-to-the-chilean-agricultural-and-livestock-service-the-puma-came-down-from-the-mountains-after-seeing-the-streets-were-largely-empty-6.

Mead, A., Griffiths, C.L., Branch, G.M., McQuaid, C.D., Blamey, L.K., Bolton, J.J., Anderson, R.J., Dufois, F., Rouault, M., Froneman, P.W. and Whitfield, A.K., 2013. Human-mediated drivers of change—impacts on coastal ecosystems and marine biota of South Africa. African Journal of Marine Science35(3), pp.403-425.

Mittelbach, Gary. 1986. Predator-mediated habitat use: some consequences for species interactions. Environ Biol Fish 16, 159–169. https://doi.org/10.1007/BF00005168

Rolland, R.M., Parks, S.E., Hunt, K.E., Castellote, M., Corkeron, P.J., Nowacek, D.P., Wasser, S.K. and Kraus, S.D., 2012. Evidence that ship noise increases stress in right whales. Proceedings of the Royal Society B: Biological Sciences279(1737), pp.2363-2368.

Cooperative Fishing: Symbiotic Relationships between People and Dolphins

By: Alexa Kownacki, Ph.D. Student, OSU Department of Fisheries and Wildlife, Geospatial Ecology of Marine Megafauna Lab

Human-wildlife interactions have occurred since people first inhabited the Earth. However, today, when describing human-wildlife interactions specifically in relation to dolphins, frequently we hear about ‘conflicts’. Interactions between fisheries and dolphins that lead to bycatch or depredation (stealing bait/catching from gear) are particularly common. But, symbiotic relationships with dolphin species and certain human groups can also be mutualistic, with both groups benefitting. These symbiotic relationships have been around for hundreds, if not thousands of years.

A depiction of Aboriginal Australians using nets to catch fish in a small inlet with the assistance of coastal dolphins. (Image source: Our Pacific Ocean)

In eastern Australia, cooperative fishing interactions occur between Aboriginal Australians and dolphins—both bottlenose dolphins and orcas. In Burleigh Heads National Park, Queensland, AUS, the dolphins are thought to help the local indigenous Kombemerri (saltwater) people hunt for fish. Indigenous stories recall men wading into the water with their spears and nets. Then, many of the men would hit the surface waters to make noises with the splashes. Underwater, this sound was amplified and then the dolphins would begin chasing the fish toward the men and their nets (Neil 2002). Aboriginal Australians, especially those in eastern Australia have an emotional and spiritual connection to both dolphins and orcas. There are widespread accounts of cooperation between indigenous people and small cetaceans on the eastern Australian coastline, which create both context and precedent for the economic and emotional objectives to contemporary human-dolphin interactions such as dolphin provisioning (Neil 2002).

Dolphins and fishermen work together in Laguna, Brazil, to catch mullet. (Image Source: Fábio Daura-Jorge)

In the coasts off of Laguna, Brazil, bottlenose dolphins and local fishermen cooperatively fish while tourists gather to watch. Previously, PhD candidate Leila Lemos wrote about these interactions in a blog post. Like many groups of socializing dolphins, these dolphins have a unique whistle to recognize each other. The waters surrounding Laguna, Brazil are murky, turbid and dark green to the point where the fisherman cannot see any of the fish in the water. As the fishermen wade into the murky waters, bottlenose dolphins chase shoals of mullet toward the shore. Then the dolphins tail slap or abruptly dive, “signaling” the fishermen to cast their nets. Research has shown that when the fishermen “work with” the dolphins, both the dolphins and the people catch more, larger fish (Roman 2013). One fisherman claims it is not worth fishing unless the dolphins are around (Roman 2013). Here, the fishermen know the dolphins based on their markings. They know which dolphins participate in the different parts of hunting as well—which dolphin initiates the tail slap, which dolphin usually circles the fish, and which drive the fish towards the coastline. After the dolphins round up and chase the fish for the fishermen and themselves, there is no “reward” from the fishermen for the dolphins—no fish tossed their way. Scientists also found there is a difference in whistle structure between cooperative and non-cooperative dolphin groups (Preston 2017).

A fisherman in Brazil throws a net after dolphins chase mullet into the shore. (Image Source: Leo Francini:Alamy Stock Photo)

Along most coastlines worldwide, humans and dolphins are competitors. Dolphins are seen as thieves who steal fish out of nets, or get caught in their gear and ruin fishing opportunities. Thus, dolphins are often unwelcome near fishing communities. Such negative interactions sometimes lead to human-caused fatalities of dolphin from gunshots or stabbings, thought to be from angry fishermen.  Yet, in this same world, fishermen thank the dolphins for bringing their catch to them. Clearly, both humans and dolphins share high intelligence levels and skills in fishing. If it is a matter of two minds are better than one, then I think indigenous communities figured this equation out first: working with the dolphins, and not against, can better feed their people.

Citations:

Neil, David. (2002). Cooperative fishing interactions between Aboriginal Australians and dolphins in eastern Australia. Anthrozoos: A Multidisciplinary Journal of The Interactions of People & Animals. 15. 10.2752/089279302786992694.

Preston, Elizabeth. “Dolphins That Work with Humans to Catch Fish Have Unique Accent.” New Scientist, 2 Oct. 2017, www.newscientist.com/article/2149139-dolphins-that-work-with-humans-to-catch-fish-have-unique-accent/.

Roman, Joe. “Fishing with Dolphins: An astonishing cooperative venture in which every species wins but the fish.” Slate Magazine, 31 Jan. 2013, slate.com/technology/2013/01/fishing-with-dolphins-symbiosis-between-humans-and-marine-mammals-to-catch-more-fish.html.

Classifying cetacean behavior

Clara Bird, Masters Student, OSU Department of Fisheries and Wildlife, Geospatial Ecology of Marine Megafauna Lab

The GEMM lab recently completed its fourth field season studying gray whales along the Oregon coast. The 2019 field season was an especially exciting one, we collected rare footage of several interesting gray whale behaviors including GoPro footage of a gray whale feeding on the seafloor, drone footage of a gray whale breaching, and drone footage of surface feeding (check out our recently released highlight video here). For my master’s thesis, I’ll use the drone footage to analyze gray whale behavior and how it varies across space, time, and individual. But before I ask how behavior is related to other variables, I need to understand how to best classify the behaviors.

How do we collect data on behavior?

One of the most important tools in behavioral ecology is an ‘ethogram’. An ethogram is a list of defined behaviors that the researcher expects to see based on prior knowledge. It is important because it provides a standardized list of behaviors so the data can be properly analyzed. For example, without an ethogram, someone observing human behavior could say that their subject was walking on one occasion, but then say strolling on a different occasion when they actually meant walking. It is important to pre-determine how behaviors will be recorded so that data classification is consistent throughout the study. Table 1 provides a sample from the ethogram I use to analyze gray whale behavior. The specificity of the behaviors depends on how the data is collected.

Table 1. Sample from gray whale ethogram. Based on ethogram from Torres et al. (2018).

In marine mammal ecology, it is challenging to define specific behaviors because from the traditional viewpoint of a boat, we can only see what the individuals are doing at the surface. The most common method of collecting behavioral data is called a ‘focal follow’. In focal follows an individual, or group, is followed for a set period of time and its behavioral state is recorded at set intervals.  For example, a researcher might decide to follow an animal for an hour and record its behavioral state at each minute (Mann 1999). In some studies, they also recorded the location of the whale at each time point. When we use drones our methods are a little different; we collect behavioral data in the form of continuous 15-minute videos of the whale. While we collect data for a shorter amount of time than a typical focal follow, we can analyze the whole video and record what the whale was doing at each second with the added benefit of being able to review the video to ensure accuracy. Additionally, from the drone’s perspective, we can see what the whales are doing below the surface, which can dramatically improve our ability to identify and describe behaviors (Torres et al. 2018).

Categorizing Behaviors

In our ethogram, the behaviors are already categorized into primary states. Primary states are the broadest behavioral states, and in my study, they are foraging, traveling, socializing, and resting. We categorize the specific behaviors we observe in the drone videos into these categories because they are associated with the function of a behavior. While our categorization is based on prior knowledge and critical evaluation, this process can still be somewhat subjective.  Quantitative methods provide an objective interpretation of the behaviors that can confirm our broad categorization and provide insight into relationships between categories.  These methods include path characterization, cluster analysis, and sequence analysis.

Path characterization classifies behaviors using characteristics of their track line, this method is similar to the RST method that fellow GEMM lab graduate student Lisa Hildebrand described in a recent blog. Mayo and Marx (1990) analyzed the paths of surface foraging North Atlantic Right Whales and were able to classify the paths into primary states; they found that the path of a traveling whale was more linear and then paths of foraging or socializing whales that were more convoluted (Fig 1). I plan to analyze the drone GPS track line as a proxy for the whale’s track line to help distinguish between traveling and foraging in the cases where the 15-minute snapshot does not provide enough context.

Figure 1. Figure from Mayo and Marx (1990) showing different track lines symbolized by behavior category.

Cluster analysis looks for natural groupings in behavior. For example, Hastie et al. (2004) used cluster analysis to find that there were four natural groupings of bottlenose dolphin surface behaviors (Fig. 2). I am considering using this method to see if there are natural groupings of behaviors within the foraging primary state that might relate to different prey types or habitat. This process is analogous to breaking human foraging down into sub-categories like fishing or farming by looking for different foraging behaviors that typically occur together.

Figure 2. Figure from Hastie et al. (2004) showing the results of a hierarchical cluster analysis.

Lastly, sequence analysis also looks for groupings of behaviors but, unlike cluster analysis, it also uses the order in which behaviors occur. Slooten (1994) used this method to classify Hector’s dolphin surface behaviors and found that there were five classes of behaviors and certain behaviors connected the different categories (Fig. 3). This method is interesting because if there are certain behaviors that are consistently in the same order then that indicates that the order of events is important. What function does a specific sequence of behaviors provide that the behaviors out of that order do not?

Figure 3. Figure from Slooten (1994) showing the results of sequence analysis.

Think about harvesting fruits and vegetables from a garden: the order of how things are done matters and you might use different methods to harvest different kinds of produce. Without knowing what food was being harvested, these methods could detect that there were different harvesting methods for different fruits or veggies. By then studying when and where the different methods were used and by whom, we could gain insight into the different functions and patterns associated with the different behaviors. We might be able to detect that some methods were always used in certain habitat types or that different methods were consistently used at different times of the year.

Behavior classification methods such as these described provide a more refined and detailed analysis of categories that can then be used to identify patterns of gray whale behaviors. While our ultimate goal is to understand how gray whales will be affected by a changing environment, a comprehensive understanding of their current behavior serves as a baseline for that future study.

References

Burnett, J. D., Lemos, L., Barlow, D., Wing, M. G., Chandler, T., & Torres, L. G. (2019). Estimating morphometric attributes of baleen whales with photogrammetry from small UASs: A case study with blue and gray whales. Marine Mammal Science, 35(1), 108–139. https://doi.org/10.1111/mms.12527

Darling, J. D., Keogh, K. E., & Steeves, T. E. (1998). Gray whale (Eschrichtius robustus) habitat utilization and prey species off Vancouver Island, B.C. Marine Mammal Science, 14(4), 692–720. https://doi.org/10.1111/j.1748-7692.1998.tb00757.x

Hastie, G. D., Wilson, B., Wilson, L. J., Parsons, K. M., & Thompson, P. M. (2004). Functional mechanisms underlying cetacean distribution patterns: Hotspots for bottlenose dolphins are linked to foraging. Marine Biology, 144(2), 397–403. https://doi.org/10.1007/s00227-003-1195-4

Mann, J. (1999). Behavioral sampling methods for cetaceans: A review and critique. Marine Mammal Science, 15(1), 102–122. https://doi.org/10.1111/j.1748-7692.1999.tb00784.x

Slooten, E. (1994). Behavior of Hector’s Dolphin: Classifying Behavior by Sequence Analysis. Journal of Mammalogy, 75(4), 956–964. https://doi.org/10.2307/1382477

Torres, L. G., Nieukirk, S. L., Lemos, L., & Chandler, T. E. (2018). Drone up! Quantifying whale behavior from a new perspective improves observational capacity. Frontiers in Marine Science, 5(SEP). https://doi.org/10.3389/fmars.2018.00319

Mayo, C. A., & Marx, M. K. (1990). Surface foraging behaviour of the North Atlantic right whale, Eubalaena glacialis, and associated zooplankton characteristics. Canadian Journal of Zoology, 68(10), 2214–2220. https://doi.org/10.1139/z90-308

The significance of blubber hormone sampling in conservation and monitoring of marine mammals

By: Alexa Kownacki, Ph.D. Student, OSU Department of Fisheries and Wildlife, Geospatial Ecology of Marine Megafauna Lab

Marine mammals are challenging to study for many reasons, and specifically because they inhabit the areas of the Earth that are uninhabited by people: the oceans. Monitoring marine mammal populations to gather baselines on their health condition and reproductive status is not as simple as trap and release, which is a method often conducted for terrestrial animals. Marine mammals are constantly moving in vast areas below the surface. Moreover, cetaceans, which do not spend time on land, are arguably the most challenging to sample.

One component of my project, based in California, USA, is a health assessment analyzing hormones of the bottlenose dolphins that frequent both the coastal and the offshore waters. Therefore, I am all too familiar with the hurdles of collecting health data from living marine mammals, especially cetaceans. However, the past few decades have seen major advancements in technology both in the laboratory and with equipment, including one tool that continues to be critical in understanding cetacean health: blubber biopsies.

Biopsy dart hitting a bottlenose dolphin below the dorsal fin. Image Source: NMFS

Blubber biopsies are typically obtained via low-powered crossbow with a bumper affixed to the arrow to de-power it once it hits the skin. The arrow tip has a small, pronged metal attachment to collect an eraser-tipped size amount of tissue with surface blubber and skin. I compare this to a skin punch biopsies in humans; it’s small, minimally-invasive, and requires no follow-up care. With a small team of scientists, we use small, rigid-inflatable vessels to survey the known locations of where the bottlenose dolphins tend to gather. Then, we assess the conditions of the seas and of the animals, first making sure we are collecting from animals without potentially lowered immune systems (no large, visible wounds) or calves (less than one years old). Once we have photographed the individual’s dorsal fin to identify the individual, one person assembles the biopsy dart and crossbow apparatus following sterile procedures when attaching the biopsy tips to avoid infection. Another person prepares to photograph the animal to match the biopsy information to the individual dolphin. One scientist aims the crossbow for the body of the dolphin, directly below the dorsal fin, while the another photographs the biopsy dart hitting the animal and watches where it bounces off. Then, the boat maneuvers to the floating biopsy dart to recover the dart and the sample. Finally, the tip with blubber and skin tissue is collected, again using sterile procedures, and the sample is archived for further processing. A similar process, using an air gun instead of a crossbow can be viewed below:

GEMM Lab members using an air gun loaded with a biopsy dart to procure marine mammal blubber from a blue whale in New Zealand. Video Source: GEMM Laboratory.

Part of the biopsy process is holding ourselves to the highest standards in our minimally-invasive technique, which requires constant practice, even on land.

Alexa practicing proper crossbow technique on land under supervision. Image Source: Alexa Kownacki

Blubber is the lipid-rich, vascularized tissue under the epidermis that is used in thermoregulation and fat storage for marine mammals. Blubber is an ideal matrix for storing lipophilic (fat-loving) steroid hormones because of its high fat content. Steroid hormones, such as cortisol, progesterone, and testosterone, are naturally circulating in the blood stream and are released in high concentrations during specific events. Unlike blood, blubber is less dynamic and therefore tells a much longer history of the animal’s nutritional state, environmental exposure, stress level, and life history status. Blubber is the cribs-notes version of a marine mammal’s biography over its previous few months of life. Blood, on the other hand, is the news story from the last 24 hours. Both matrices serve a specific purpose in telling the story, but blubber is much more feasible to obtain from a cetacean and provides a longer time frame in terms of information on the past.

A simplified depiction of marine mammal blubber starting from the top (most exterior surface) being the skin surface down to the muscle (most interior). Image Source: schoolnet.org.za

I use blubber biopsies for assessing cortisol, testosterone, and progesterone in the bottlenose dolphins. Cortisol is a glucocorticoid that is frequently associated with stress, including in humans. Marine mammals utilize the same hypothalamic-pituitary-adrenal (HPA) axis that is responsible for the fight-or-flight response, as well as other metabolic regulations. During prolonged stressful events, cortisol levels will remain elevated, which has long-term repercussions for an animal’s health, such as lowered immune systems and decreased ability to respond to predators. Testosterone and progesterone are sex hormones, which can be used to indicate sex of the individual and determine reproductive status. This reproductive information allows us to assess the population’s composition and structure of males and females, as well as potential growth or decline in population (West et al. 2014).

Alexa using a crossbow from a small boat off of San Diego, CA. Image Source: Alexa Kownacki

The coastal and offshore bottlenose dolphin ecotypes of interest in my research occupy different locations and are therefore exposed to different health threats. This is a primary reason for conducting health assessments, specifically analyzing blubber hormone levels. The offshore ecotype is found many kilometers offshore and is most often encountered around the southern Channel Islands. In contrast, the coastal ecotype is found within 2 kilometers of shore (Lowther-Thieleking et al. 2015) where they are subjected to more human exposure, both directly and indirectly, because of their close proximity to the mainland of the United States. Coastal dolphins have a higher likelihood of fishery-related mortality, the negative effects of urbanization including coastal runoff and habitat degradation, and recreational activities (Hwang et al. 2014). The blubber hormone data from my project will inform which demographics are most at-risk. From this information, I can provide data supporting why specific resources should be allocated differently and therefore help vulnerable populations. Further proving that the small amount of tissue from a blubber biopsy can help secure a better future for population by adjusting and informing conservation strategies.

Literature Cited:

Hwang, Alice, Richard H Defran, Maddalena Bearzi, Daniela. Maldini, Charles A Saylan, Aime ́e R Lang, Kimberly J Dudzik, Oscar R Guzo n-Zatarain, Dennis L Kelly, and David W Weller. 2014. “Coastal Range and Movements of Common Bottlenose Dolphins (Tursiops Truncatus) off California and Baja California, Mexico.” Bulletin of the Southern California Academy of Sciences 113 (1): 1–13. https://doi.org/10.3390/toxins6010211.

Lowther-Thieleking, Janet L., Frederick I. Archer, Aimee R. Lang, and David W. Weller. 2015. “Genetic Differentiation among Coastal and Offshore Common Bottlenose Dolphins, Tursiops Truncatus, in the Eastern North Pacific Ocean.” Marine Mammal Science 31 (1): 1–20. https://doi.org/10.1111/mms.12135.

West, Kristi L., Jan Ramer, Janine L. Brown, Jay Sweeney, Erin M. Hanahoe, Tom Reidarson, Jeffry Proudfoot, and Don R. Bergfelt. 2014. “Thyroid Hormone Concentrations in Relation to Age, Sex, Pregnancy, and Perinatal Loss in Bottlenose Dolphins (Tursiops Truncatus).” General and Comparative Endocrinology 197: 73–81. https://doi.org/10.1016/j.ygcen.2013.11.021.

Zooming in: A closer look at bottlenose dolphin distribution patterns off of San Diego, CA

By: Alexa Kownacki, Ph.D. Student, OSU Department of Fisheries and Wildlife, Geospatial Ecology of Marine Megafauna Lab

Data analysis is often about parsing down data into manageable subsets. My project, which spans 34 years and six study sites along the California coast, requires significant data wrangling before full analysis. As part of a data analysis trial, I first refined my dataset to only the San Diego survey location. I chose this dataset for its standardization and large sample size; the bulk of my sightings, over 4,000 of the 6,136, are from the San Diego survey site where the transect methods were highly standardized. In the next step, I selected explanatory variable datasets that covered the sighting data at similar spatial and temporal resolutions. This small endeavor in analyzing my data was the first big leap into understanding what questions are feasible in terms of variable selection and analysis methods. I developed four major hypotheses for this San Diego site.

The study species: common bottlenose dolphin (Tursiops truncatus) seen along the California coastline in 2015. Image source: Alexa Kownacki.

Hypotheses:

H1: I predict that bottlenose dolphin sightings along the San Diego transect throughout the years 1981-2015 exhibit clustered distribution patterns as a result of the patchy distributions of both the species’ preferred habitats, as well as the social nature of bottlenose dolphins.

H2: I predict there would be higher densities of bottlenose dolphin at higher latitudes spanning 1981-2015 due to prey distributions shifting northward and less human activities in the northerly sections of the transect.

H3: I predict that during warm (positive) El Niño Southern Oscillation (ENSO) months, the dolphin sightings in San Diego would be distributed more northerly, predominantly with prey aggregations historically shifting northward into cooler waters, due to (secondarily) increasing sea surface temperatures.

H4: I predict that along the San Diego coastline, bottlenose dolphin sightings are clustered within two kilometers of the six major lagoons, with no specific preference for any lagoon, because the murky, nutrient-rich waters in the estuarine environments are ideal for prey protection and known for their higher densities of schooling fishes.

Data Description:

The common bottlenose dolphin (Tursiops truncatus) sighting data spans 1981-2015 with a few gap years. Sightings cover all months, but not in all years sampled. The same transect in San Diego was surveyed in a small, rigid-hulled inflatable boat with approximately a two-kilometer observation area (one kilometer surveyed 90 degrees to starboard and port of the bow).

I wanted to see if there were changes in dolphin distribution by latitude and, if so, whether those changes had a relationship to ENSO cycles and/or distances to lagoons. For ENSO data, I used the NOAA database that provides positive, neutral, and negative indices (1, 0, and -1, respectively) by each month of each year. I matched these ENSO data to my month-date information of dolphin sighting data. Distance from each lagoon was calculated for each sighting.

Figure 1. Map representing the San Diego transect, represented with a light blue line inside of a one-kilometer buffered “sighting zone” in pale yellow. The dark pink shapes are dolphin sightings from 1981-2015, although some are stacked on each other and cannot be differentiated. The lagoons, ranging in size, are color-coded. The transect line runs from the breakwaters of Mission Bay, CA to Oceanside Harbor, CA.

Results: 

H1: True, dolphins are clustered and do not have a uniform distribution across this area. Spatial analysis indicated a less than a 1% likelihood that this clustered pattern could be the result of random chance (Fig. 1, z-score = -127.16, p-value < 0.0001). It is well-known that schooling fishes have a patchy distribution, which could influence the clustered distribution of their dolphin predators. In addition, bottlenose dolphins are highly social and although pods change in composition of individuals, the dolphins do usually transit, feed, and socialize in small groups.

Figure 2. Summary from the Average Nearest Neighbor calculation in ArcMap 10.6 displaying that bottlenose dolphin sightings in San Diego are highly clustered. When the z-score, which corresponds to different colors on the graphic above, is strongly negative (< -2.58), in this case dark blue, it indicates clustering. Because the p-value is very small, in this case, much less than 0.01, these results of clustering are strongly significant.

H2: False, dolphins do not occur at higher densities in the higher latitudes of the San Diego study site. The sightings are more clumped towards the lower latitudes overall (p < 2e-16), possibly due to habitat preference. The sightings are closer to beaches with higher human densities and human-related activities near Mission Bay, CA. It should be noted, that just north of the San Diego transect is the Camp Pendleton Marine Base, which conducts frequent military exercises and could deter animals.

Figure 3. Histogram comparing the latitudes with the frequency of dolphin sightings in San Diego, CA. The x-axis represents the latitudinal difference from the most northern part of the transect to each dolphin sighting. Therefore, a small difference would translate to a sighting being in the northern transect areas whereas large differences would translate to sightings being more southerly. This could be read from left to right as most northern to most southern. The y-axis represents the frequency of which those differences are seen, that is, the number of sightings with that amount of latitudinal difference, or essentially location on the transect line. Therefore, you can see there is a peak in the number of sightings towards the southern part of the transect line.

H3: False, during warm (positive) El Niño Southern Oscillation (ENSO) months, the dolphin sightings in San Diego were more southerly. In colder (negative) ENSO months, the dolphins were more northerly. The differences between sighting latitude and ENSO index was significant (p<0.005). Post-hoc analysis indicates that the north-south distribution of dolphin sightings was different during each ENSO state.

Figure 4. Boxplot visualizing distributions of dolphin sightings latitudinal differences and ENSO index, with -1,0, and 1 representing cold, neutral, and warm years, respectively.

H4: True, dolphins are clustered around particular lagoons. Figure 5 illustrates how dolphin sightings nearest to Lagoon 6 (the San Dieguito Lagoon) are always within 0.03 decimal degrees. Because of how these data are formatted, decimal degrees is the easiest way to measure change in distance (in this case, the difference in latitude). In comparison, dolphins at Lagoon 5 (Los Penasquitos Lagoon) are distributed across distances, with the most sightings further from the lagoon.

Figure 5. Bar plot displaying the different distances from dolphin sighting location to the nearest lagoon in San Diego in decimal degrees. Note: Lagoon 4 is south of the study site and therefore was never the nearest lagoon.

I found a significant difference between distance to nearest lagoon in different ENSO index categories (p < 2.55e-9): there is a significant difference in distance to nearest lagoon between neutral and negative values and positive and neutral years. Therefore, I hypothesize that in neutral ENSO months compared to positive and negative ENSO months, prey distributions are changing. This is one possible hypothesis for the significant difference in lagoon preference based on the monthly ENSO index. Using a violin plot (Fig. 6), it appears that Lagoon 5, Los Penasquitos Lagoon, has the widest variation of sighting distances in all ENSO index conditions. In neutral years, Lagoon 0, the Buena Vista Lagoon has multiple sightings, when in positive and negative years it had either no sightings or a single sighting. The Buena Vista Lagoon is the most northerly lagoon, which may indicate that in neutral ENSO months, dolphin pods are more northerly in their distribution.

Figure 6. Violin plot illustrating the distance from lagoons of dolphin sightings under different ENSO conditions. There are three major groups based on ENSO index: “-1” representing cold years, “0” representing neutral years, and “1” representing warm years. On the x-axis are lagoon IDs and on the y-axis is the distance to the nearest lagoon in decimal degrees. The wider the shapes, the more sightings, therefore Lagoon 6 has many sightings within a very small distance compared to Lagoon 5 where sightings are widely dispersed at greater distances.


Bottlenose dolphins foraging in a small group along the California coast in 2015. Image source: Alexa Kownacki.

Takeaways to science and management: 

Bottlenose dolphins have a clustered distribution which seems to be related to ENSO monthly indices, and likely, their social structures. From these data, neutral ENSO months appear to have something different happening compared to positive and negative months, that is impacting the sighting distributions of bottlenose dolphins off the San Diego coastline. More research needs to be conducted to determine what is different about neutral months and how this may impact this dolphin population. On a finer scale, the six lagoons in San Diego appear to have a spatial relationship with dolphin sightings. These lagoons may provide critical habitat for bottlenose dolphins and/or for their preferred prey either by protecting the animals or by providing nutrients. Different lagoons may have different spans of impact, that is, some lagoons may have wider outflows that create larger nutrient plumes.

Other than the Marine Mammal Protection Act and small protected zones, there are no safeguards in place for these dolphins, whose population hovers around 500 individuals. Therefore, specific coastal areas surrounding lagoons that are more vulnerable to habitat loss, habitat degradation, and/or are more frequented by dolphins, may want greater protection added at a local, state, or federal level. For example, the Batiquitos and San Dieguito Lagoons already contain some Marine Conservation Areas with No-Take Zones within their reach. The city of San Diego and the state of California need better ways to assess the coastlines in their jurisdictions and how protecting the marine, estuarine, and terrestrial environments near and encompassing the coastlines impacts the greater ecosystem.

This dive into my data was an excellent lesson in spatial scaling with regards to parsing down my data to a single study site and in matching my existing data sets to other data that could help answer my hypotheses. Originally, I underestimated the robustness of my data. At first, I hesitated when considering reducing the dolphin sighting data to only include San Diego because I was concerned that I would not be able to do the statistical analyses. However, these concerns were unfounded. My results are strongly significant and provide great insight into my questions about my data. Now, I can further apply these preliminary results and explore both finer and broader scale resolutions, such as using the more precise ENSO index values and finding ways to compare offshore bottlenose dolphin sighting distributions.

Our GEM(M), Ruby, is back in action!

By Lisa Hildebrand, MSc student, OSU Department of Fisheries and Wildlife, Geospatial Ecology of Marine Megafauna Lab

Every season, or significant period of time, usually has a distinct event that marks its beginning. For example, even though winter officially begins when the winter solstice occurs sometime between December 20 and December 23, many people often associate the first snowfall as the real start of winter. To mark the beginning of schooling, when children start 1stgrade in Germany (which is where I’m from), they receive something called a “Zuckertüte”, which translated means “sugar bag”. It is a large (sometimes as large as the child) cone-shaped container made of cardboard filled with toys, chocolates, sweets, school supplies and various other treats topped with a large bow.

Receiving my Zuckertüte in August of 2001 before starting 1st grade. Source: Ines Hildebrand.

I still remember (and even have) mine – it was almost as tall as I was, had a large Barbie printed on it (and a real one sitting on top of it) and was bright pink. And of course, while at a movie theatre, once the lights dim completely and the curtain surrounding the screen opens just a little further, members of the audience stop chit-chatting or sending text messages, everyone quietens down and puts their devices away – the film is about to start. There are hundreds upon thousands of examples like these – moments, events, days that mark the start of something.

In the past, the beginning of summer has always been tied to two things for me: the end of school and the chance to be outside in the sun for many hours and days. This reality has changed slightly since moving to Oregon. While I don’t technically have any classes during the summer, the work definitely won’t stop. There are still dozens of papers to read, samples to run in the lab, and data points to plot. For anyone from Oregon or the Pacific Northwest (PNW), it’s pretty well known that the weather can be a little unpredictable and variable, meaning that summer might not always be filled with sunny days. Despite somewhat losing these two “summer markers”, I have found a new event to mark the beginning of summer – the arrival of the gray whales.

Their propensity for coastal waters and near-shore feeding is part of what makes gray whales so unique and arguably “easier” to study than some other baleen whale species. Image captured under NOAA/NMFS permit #21678. Source: Leigh Torres.


It’s official – the gray whale field season is upon us! As many of you may already know, the GEMM Lab has two active gray whale research projects: investigating the impacts of ocean noise on gray whale physiology and exploring potential individual foraging specialization among the Pacific Coast Feeding Group (PCFG) gray whales. Both projects involve field work, with the former operating out of Newport and the latter taking place in Port Orford, both collecting photographs and a variety of samples and tracklines to study the PCFG, which is a sub-group of the larger Eastern North Pacific (ENP) population. June 1st is the widely accepted “cut-off date” for the PCFG whales, whereby gray whales seen after June 1st along the PNW coastline (specifically northern California, Oregon, Washington and British Columbia) are considered members of the PCFG. While this date is not the only qualifying factor for an individual to be considered a PCFG member, it is a good general rule of thumb. Since last week happened to be the first week of June, PI Leigh Torres, field technician Todd Chandler and myself launched out onto the Pacific Ocean in our trusty RHIB Ruby twice looking for gray whales, and it sure was a successful start to the season!

Even though I have done small boat-based field work before, every project and field team operates a little differently, which is why I was a little nervous at first. There are a lot of components to the Newport-based project as Leigh & co. assess gray whale physiology by collecting fecal samples, drone imagery and taking photographs, observing behavior patterns, as well as assessing local prey through GoPro footage and light traps. I wasn’t worried about the prey components of the research, since there is plenty of prey sampling involved in my Port Orford research, however I was worried about the whale side of things. I wasn’t sure whether I would be able to catch the drone as it returned back home to Ruby, fearing I might fumble and let it slip through my fingers. I also experienced slight déjà vu when handling the net we use to collect the fecal samples as I was forced to think back to some previous field work that involved collecting a biopsy dart with a net as well. During that project, I had somehow managed to get the end of the net stuck in the back of the boat and as I tried to scoop up the biopsy dart with the net-end, the pole became more and more stuck while the water kept dragging the net-end down and eventually the pole ended up snapping in my hands. On top of all this anxiety and work, trying to find your footing in a small RHIB like Ruby packed with lots of gear and a good amount of swell doesn’t make any of those tasks any easier.

However, as it turned out, none of my fears came to fruition. As soon as Todd fired up Ruby’s engine and we whizzed out and under the Newport bridge, I felt exhilarated. I love field work and was so excited to be out on the water again. During the two days I was able to observe multiple individuals of a species of whale that I find unique and fascinating.

Markings and pigmentation on the flukes are also unique to individuals and allow us to perform photo identification to track individuals over months and years. Image captured under NOAA/NMFS permit #21678. Source: Leigh Torres.

I felt back in my natural element and working with Leigh and Todd was rewarding and fun, as I have so much to learn from their years of experience and natural talent in the field dealing with stressful situations and juggling multiple components and gear. Even though I wasn’t out there collecting data for my own project, some of my observations did get me thinking about what I hope to focus on in my thesis – individualization. It is always interesting to see how differently whales will behave, whether due to the substrate we find them over, the water depths we find them in, or what their surfacing patterns are like. Although I still have six weeks to go until my field season starts and feel lucky to have the opportunity to help Leigh and Todd with the Newport field work, I am already looking forward to getting down to Port Orford in mid-July and starting the fifth consecutive gray whale field season down there.

But back to Newport – over the course of two days, we were able to deploy and retrieve one light trap to collect zooplankton, collect two fecal samples, perform two GoPro drops, fly the drone three times, and take hundreds of photos of whales. Leigh and Todd were both glad to be reunited with an old friend while I felt lucky to be able to meet such a famous lady – Scarback. A whale with a long sighting history not just for the GEMM Lab but for various researchers along the coast that study this population. Scarback is well-known (and easily identified) by the large concave injury on her back that is covered in whale lice, or cyamids. While there are stories about how Scarback’s wound came to be, it is not known for sure how she was injured. However, what researchers do know is that the wound has not stopped this female from reproducing and successfully raising several calves over her lifetime. After hearing her story from Leigh, I wasn’t surprised that both she and Todd were so thrilled to get both a fecal sample and a drone flight from her early in the season. The two days weren’t all rosy; most of day 1 was shrouded in a cloud of mist resulting in a thin but continuous layer of moisture forming on our clothes, while on day 2 we battled with some pretty big swells (up to 6 feet tall) and in typical Oregon coast style we were victims of a sudden downpour for about 10 minutes. We had some excellent sightings and some not-so-excellent sightings. Sightings where we had four whales surrounding our boat at the same time and sightings where we couldn’t re-locate a whale that had popped up right next to us. It happens.


A local celebrity – Scarback. Image captured under NOAA/NMFS permit #21678. Source: Lisa Hildebrand.


An ecstatic Lisa with wild hair standing in the bow pulpit of Ruby camera at the ready. Source: Leigh Torres.

Field work is certainly one of my favorite things in the world. The smell of the salt, the rustling of cereal bar wrappers, the whipping of hair, the perpetual rosy noses and cheeks no matter how many times you apply and re-apply sunscreen, the awkward hilarity of clambering onto the back of the boat where the engine is housed to take a potty break, the whooshing sound of a blow, the sometimes gentle and sometimes aggressive rocking of the boat, the realization that you haven’t had water in four hours only to chug half of your water in a few seconds, the waft of peanut butter and jelly sandwiches, the circular footprint where a whale has just gracefully dipped beneath the surface slipping away from view. I don’t think I will ever tire of any of those things.


Marine Mammal Observing: Standardization is key

By: Alexa Kownacki, Ph.D. Student, OSU Department of Fisheries and Wildlife, Geospatial Ecology of Marine Megafauna Lab

For the past two years, I’ve had the opportunity to be the marine mammal observer aboard the NOAA ship Bell M. Shimada for 10 days in May. Both trips covered transects in the Northern California Current Ecosystem during the same time of year, but things looked very different from my chair on the fly bridge. This trip, in particular, highlighted the importance of standardization, seeing as it was the second replicate of the same area. Other scientists and crew members repeatedly asked me the same questions that made me realize just how important it is to have standards in scientific practices and communicating them.

Northern right whale dolphin porpoising out of the water beside the ship while in transit. May 2019. Image source: Alexa Kownacki

The questions:

  1. What do you actually do here and why are you doing it?
  2. Is this year the same as last year in terms of weather, sightings, and transect locations?
  3. Did you expect to see greater or fewer sightings (number and diversity)?
  4. What is this Beaufort Sea State scale that you keep referring to?

All of these are important scientific questions that influence our hypothesis-testing research, survey methods, expected results, and potential conclusions. Although the entire science party aboard the ship conducted marine science, we all had our own specialties and sometimes only knew the basics, if that, about what the other person was doing. It became a perfect opportunity to share our science and standards across similar, but different fields.

Now, to answer those questions:

  1. a) What do you actually do here and b) why are you doing it?

a) As the only marine mammal observer, I stand watch during favorable weather conditions while the ship is in transit, scanning from 0 to 90 degrees off the starboard side (from the front of the ship to a right angle towards the right side when facing forwards). Meanwhile, an application on an iPad called SeaScribe, records the ship’s exact location every 15 seconds, even when no animal is sighted. This process allows for the collection of absence data, that is, data when no animals are present. The SeaScribe program records the survey lines, along with manual inputs that I add, including weather and observer information. When I spot a marine mammal, I immediately mark an exact location on a hand held GPS, use my binoculars to identify the species, and add information to the sighting on the SeaScribe program, such as species, distance to the sighted animal(s), the degree (angle) to the sighting, number of animals in a group, behavior, and direction if traveling.

b) Marine mammal observing serves many different purposes. In this case, observing collects information about what species are where at what time. By piggy-backing on these large-scale, offshore oceanographic NOAA surveys, we have the unique opportunity to survey along standardized transect lines during different times of the year. From replicate survey data, we can start to form an idea of which species use which areas and what oceanographic conditions may impact species distributions. Currently there is not much consistent marine mammal data collected over these offshore areas between Northern California and Washington State, so our work is aiming to fill this knowledge gap.

Alexa observing on the R/V Shimada in May 2019, all bundled up. Image Source: Alexa Kownacki

  1. What is this Beaufort Sea State scale that you keep referring to?

Great question! It took me a while to realize that this standard measuring tool to estimate wind speeds and sea conditions, is not commonly recognized even among other sea-goers. The Beaufort Sea State, or BSS, uses an empirical scale that ranges from 0-12 with 0 being no wind and calm seas, to 12 being hurricane-force winds with 45+ ft seas. It is frequently referenced by scientists in oceanography, marine science, and climate science as a universally-understood metric. The BSS was created in 1805 by Francis Beaufort, a hydrographer in the Royal Navy, to standardize weather conditions across the fleet of vessels. By the mid-1850s, the BSS was standardized to non-naval use for sailing vessels, and in 1916, expanded to include information specific to the seas and not the sails1. We in the marine mammal observation field constantly collect BSS information while on survey to measure the quality of survey conditions that may impact our observations. BSS data allows us to measure the extent of our survey range, both in the distance that we are likely to sight animals and also the likelihood of sighting anything. Therefore, the BSS scale gives us an important indication of how much absence data we have collected, in addition to presence data.

A description of the Beaufort Sea State Scale. Image source: National Weather Service.


  1. Is this year the same as last year in terms of weather, sightings, and transect locations?

The short answer is no. Observed differences in marine mammal sightings in terms of both species diversity and number of animals between years can be normal. There are many potential explanatory variables, from differences in currents, upwelling strength, El Nino index levels, water temperatures, or, what was obvious in this case: sighting conditions. The weather in May 2019 varied greatly from that in May 2018. Last year, I observed for nearly every day because the Beaufort Sea State (BSS) was frequently less than a four. However, this year, more often than not, the BSS greater than or equal to five. A BSS of 5 equates to approximately 17-21 knots of breeze with 6-foot waves and the water appears to have many “white horses” or pronounced white caps with sea spray. Additionally, mechanical issue with winches delayed and altered our transect locations. Therefore, although multiple transects from May 2018 were also surveyed during May 2019, there were a few lines that do not have data for both cruises.

May 2018 with a BSS 1

May 2019 with a BSS 6


  1. Did you expect to see greater or fewer sightings (number and diversity)?

Knowing that I had less favorable sighting conditions and less amount of effort observing this year, it is not surprising that I observed fewer marine mammals in total count and in species diversity. Even less surprising is that on the day with the best weather, where the BSS was less than a five, I recorded the most sightings with the highest species count. May 2018 felt a bit like a tropical vacation because we had surprisingly sunny days with mild winds, and during May 2019 we had some rough seas with gale force winds. Additionally, as an observer, I need to remove as much bias as possible. So, yes, I had hoped to see beaked whales or orca like I did in May 2018, but I was still pleasantly surprised when I spotted fin whales feeding in May 2019.

Marine Mammal Species Number of Sightings
May 2018 May 2019
Humpback whale 31 6
Northern right whale dolphin 1 2
Pacific white-sided dolphin 3 6
UNID beaked whale 1 0
Cuvier’s beaked whale 1 0
Gray whale 4 1
Minke whale 1 1
Fin whale 4 1
Blue whale 1 0
Transient killer whale 1 0
Dall’s porpoise 2 0
Northern fur seal 1 0
California sea lion 0 1

Pacific white-sided dolphin. Image source: Alexa Kownacki

Standardization is a common theme. Observing between years on standard transects, at set speeds, in different conditions using standardized tools is critical to collecting high quality data that is comparable across different periods. Scientists constantly think about quality control. We look for trends and patterns, similarities and differences, but none of those could be understood without having standard metrics.

The entire science party aboard the R/V Shimada in May 2019, including a marine mammal scientist, phytoplankton scientists, zooplankton scientists, and fisheries scientists, and oceanographers. Image Source: Alexa Kownacki

Literature Cited:

1Oliver, John E. (2005). Encyclopedia of world climatology. Springer.