What we know now about New Zealand blue whales

By Dawn Barlow, PhD student, OSU Department of Fisheries and Wildlife, Geospatial Ecology of Marine Megafauna Lab

For my PhD, I am using a variety of data sources and analytical tools to study the ecology and distribution of blue whales in New Zealand. I live on the Oregon Coast, across the world and in another season from the whales I study. I love where I live and I am passionate about my work, but I do sometimes feel removed from the whales and the ecosystem that are the focus of my research.

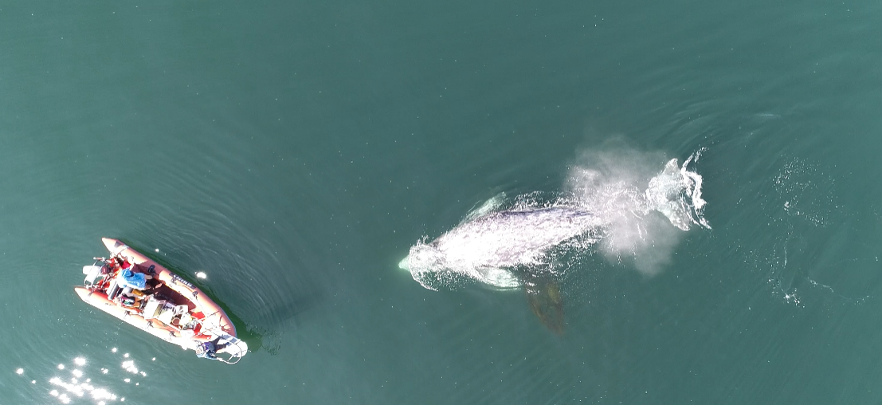
A pair of blue whales surface in the South Taranaki Bight region of New Zealand. Drone piloted by Todd Chandler during the 2017 field season.

Recently, I have turned my attention to processing acoustic data recorded in our study region in New Zealand between 2016 and 2018. In the fall, I developed detector algorithms to identify possible blue whale vocalizations in the recording period, and now I am going through each of the detections to validate whether it is indeed a blue whale call or not. Looking closely at spectrograms for hours and hours is a change of pace from the analysis and writing I have been doing recently. Namely, I am looking at biological signals – not lines of code and numbers on a screen, but depictions of sounds that blue whales produced. I have to say, it is the “closest” I have felt to these whales in a long time. Scrolling through thousands of spectrograms of blue whale calls leaves room for my mind to wander, and I recently had the realization that those whales have absolutely no idea that on the other side of the Pacific Ocean, there are a few scientists dedicating years of their lives to understand and protect them. Which led me to another realization: we know so much more about blue whales in New Zealand now than we did 10 years ago. In fact, we know so much more than we did even a year ago.

Screenshot of the process of reviewing blue whale D call detections in the acoustic analysis program Raven.

Nine years ago, Dr. Leigh Torres had a cup of coffee with a colleague who recounted observer reports of several blue whales during a seismic survey of the South Taranaki Bight region (STB) of New Zealand. This conversation sparked her curiosity, and led to the formulation of a hypothesis that the STB was in fact an unrecognized feeding ground for blue whales in the southern hemisphere (Torres 2013).

A blue whale surfaces in front of an oil rig in the South Taranaki Bight. Compiling opportunistic sightings like this one was an important step in realizing the importance of the region for blue whales. Photo by Deanna Elvines.

After three field seasons and several years of dedicated work, the hypothesis that the STB region is important for blue whales was validated. By drawing together multiple data streams and lines of evidence, we now know that New Zealand is home to a unique population of blue whales, which are genetically distinct from all other documented populations in the Southern Hemisphere. Furthermore, they use the STB for multiple critical life history functions such as feeding, nursing and calf raising, and they are present there year-round (Barlow et al. 2018).

Once we documented the New Zealand population, we were left with perhaps even more questions than we started with. Where do they feed, and why? Are they feeding and breeding there? Does their distribution change seasonally? What is the health of the population? Are they being impacted by industrial activity and human impacts such as noise in the region? We certainly do not have all the answers, but we have been piecing together an increasingly comprehensive story about these whales and their ecology.

For example, we now know that blue whales in New Zealand average around 19 meters in length, which we calculated by measuring images taken via drones and using an analysis program developed in the GEMM Lab (Burnett et al. 2018). The use of drones has opened up a whole new world for studying health and behavior in whales, and we recently used video footage to better understand the movement and kinematics of how blue whales engulf their krill prey. Furthermore, we know that blue whales may preferentially feed on dense krill aggregations at the surface, and that this surface feeding strategy may be an energetically favorable strategy in this part of the world (Torres et al. 2020).

We have also assessed one aspect of the health of blue whales by describing their skin condition. By analyzing thousands of photographs, we now know that nearly all blue whales in New Zealand bear the scars of cookie cutter shark bites, which they seem more likely to acquire at more northerly latitudes, and that 80% are affected by blister lesions (Barlow et al. 2019). Next, we are beginning to draw together multiple data streams such as body condition and hormone analysis, paired with skin condition, to form a detailed understanding about the health of this population.

Most recently we have produced a study describing how oceanography, prey and blue whales are connected within this region of New Zealand. The STB region is home to a wind-driven upwelling system that drives productivity and leads to aggregations of krill, which in turn provide sustenance for blue whales to feed on. By compiling data on oceanography and water column structure, krill availability, and blue whale distribution, we now have a solid understanding of this trophic pathway: how oceanography structures prey, and how blue whales respond to both prey and oceanography (Barlow et al. 2020). Furthermore, we are beginning to understand how those relationships may look under changing ocean conditions, with global sea temperatures rising and the increasing frequency and intensity of marine heatwaves.

The knowledge we have accumulated better enables managers to make informed decisions for the conservation of these blue whales and the ecosystem they inhabit. To me, there are several take-away messages from the story that continues to unfold about these blue whales. One is the importance of following a hunch, and then gathering the necessary tools and team to explore and tackle challenging questions. An idea that started over a cup of coffee and many years of hard work and dedication have led to a whole new body of knowledge. Another message is that the more questions you ask and the more questions you try to answer, the more questions you are often left with. That is a beautiful truth about scientific inquiry – the questions we ask drive the knowledge we uncover, but that process is never complete because new questions continue to emerge. Finally, it is easy to get swept up in details, outputs, timelines, and minutia, and every now and then it is important to take a step back. I have appreciated taking a step back and musing on the state of our knowledge about these whales, about how much we have learned in less than 10 years, and mostly about how many answers and new questions are still waiting to be uncovered.

A victorious field team celebrates a successful end to the 2017 field season with an at-sea sunset dance party. A good reminder of sunny, salty days on the water and where the data come from!

References

Barlow DR, Bernard KS, Escobar-Flores P, Palacios DM, Torres LG (2020) Links in the trophic chain: Modeling functional relationships between in situ oceanography, krill, and blue whale distribution under different oceanographic regimes. Mar Ecol Prog Ser.

Barlow DR, Pepper AL, Torres LG (2019) Skin Deep: An Assessment of New Zealand Blue Whale Skin Condition. Front Mar Sci.

Barlow DR, Torres LG, Hodge KB, Steel D, Baker CS, Chandler TE, Bott N, Constantine R, Double MC, Gill P, Glasgow D, Hamner RM, Lilley C, Ogle M, Olson PA, Peters C, Stockin KA, Tessaglia-hymes CT, Klinck H (2018) Documentation of a New Zealand blue whale population based on multiple lines of evidence. Endanger Species Res 36:27–40.

Burnett JD, Lemos L, Barlow DR, Wing MG, Chandler TE, Torres LG (2018) Estimating morphometric attributes on baleen whales using small UAS photogrammetry: A case study with blue and gray whales. Mar Mammal Sci.

Torres LG (2013) Evidence for an unrecognised blue whale foraging ground in New Zealand. New Zeal J Mar Freshw Res 47:235–248.

Torres LG, Barlow DR, Chandler TE, Burnett JD (2020) Insight into the kinematics of blue whale surface foraging through drone observations and prey data. PeerJ.
How we plan to follow whales

Clara Bird, Masters Student, OSU Department of Fisheries and Wildlife, Geospatial Ecology of Marine Megafauna Lab

The GEMM Lab gray whale team is in the midst of preparing for our fifth field season studying the Pacific Coast Foraging Group (PCFG): whales that forage off the coast of Newport, OR, USA each summer. On any given good weather day from June to October, our team is out on the water in a small zodiac looking for gray whales (Figure 1). When we find a gray whale, we try to collect photo ID data, fecal samples, drone data, and behavioral data. We use the drone data to study both the whale’s body condition and their behavior. In a previous blog, I described ethograms and how I would like to use the behavior data from drone videos to classify behaviors, with the ultimate goal of understanding how gray whale behavior varies across space, time, and by individual. However, this explanation of studying whale behavior is actually a bit incomplete. Before we start fieldwork, we first need to decide how to collect that data.

Figure 1. Image of GEMM lab team collecting gray whale UAS data. Image taken under NOAA/NMFS permit #16111

As observers, we are far from omnipresent and there is no way to know what the animals are doing all of the time. In any environment, scientists have to decide when and where to observe their animals and what behaviors they are interested in recording. In many studies, behavior is recorded live by an observer. In those studies, other limitations need to be taken into account, such as human error and observer fatigue. Collecting behavioral data is particularly challenging in the marine environment. Cetaceans spend most of their lives out of sight from humans, their time at the surface is brief, and when they appear together in large groups it can be very difficult to keep track of who is doing what when. Imagine being in a boat trying to keep track of what three different whales are doing without a pre-determined method – the task could quickly become overwhelming and biased. This is why we need a methodology for collecting and classifying behavior. We cannot study behavior without acknowledging these limitations and the potential biases that come with the methods we choose. Different data collection methods are better suited to address different questions.

The use of drones gives us the ability to record cetacean behavior non-invasively, from a perspective that allows greater observation (Figure 2, Torres et al. 2018), and for later review, which is a significant improvement. However, as we prepare to collect more behavior data, we need to study the methods and understand the benefits and disadvantages of each approach so that we capture the information we need without bias. Altmann (1974) provides a thorough overview of behavioral sampling methods.

Figure 2. Diagram illustrating “whale surface time” relative to “whale visible time” data as collected from an unmanned aerial systems (UAS) aircraft flying over a gray whale as it moves sequentially (from right to left) from “headstand” foraging to surfacing. Figure from Torres et al. (2018).

Ad libitum behavioral sampling has no structure and occurs when we find a group of whales and just write down everything they are doing. This method is a good first step, however it comes with bias.  Without structure, we cannot be sure that there was an equal probability of detecting each kind of behavior; this problem is called detectability bias. This type of bias is an issue if we are trying to answer questions about how often a behavior occurs, or what percent of time is spent in each behavior state. This is a bias to be especially concerned about when it comes to cetaceans because there are many examples of behaviors with different levels of detectability. An extreme example would be the detectability of breaching versus a behavior that takes place under the surface. A breaching whale is easier to spot and more exciting, which could lead to results suggesting that whales breach more often than they do relative to underwater behaviors. While it’s impossible to eliminate detectability bias, other sampling methods employ decision rules to try and reduce its effect. Many decision rules revolve around time, such as setting a minimum or maximum observation time interval. Other time rules involve recording the behavior state at set intervals of time (e.g., every 5 minutes). Setting observation boundaries helps standardize the methods and the data being collected.

In a structured sampling plan, the first big decision that needs to be addressed is the need to know the duration of behaviors. Point events do not include duration data but can be used to study the frequencies of behaviors. For example, if my research question was “Do whales perform “headstands” in a specific habitat type?”, then I would need point events of headstanding behavior. But, if I wanted to ask, “Do whales spend more time spent headstanding in a specific habitat type than in other habitat types?”, I would need headstanding to be a state event. State events are events with associated duration information and can be used for activity budgets. Activity budgets show how much time an animal spends in each behavior state. Some sampling methods focus on collecting only point events. However, to get the most complete understanding of behavior I think it’s important to collect both. Focal animal follows are another method of collecting more detailed data and is commonly used in cetacean studies.

The explanation of a focal follow method is in the name.  We focus on one individual, follow it, and record all of its behaviors. When employing this method, decisions are made about how an individual is chosen and how long it is followed. In some cases, the behavior of this animal is used as a proxy for the behavior of an entire group. I essentially use the focal follow method in my research. While I review drone footage to record behavioral data instead of recording behaviors live in the field, I focus on one individual a time as I go through the videos. To do this I use a software called BORIS (Friard and Gamba 2016) to mark the time of each behavior per individual (Figure 3). If there are three individuals in a video, I’ll review the footage three times to record behaviors once per individual, focusing on each in turn.

Figure 3. Screenshot of BORIS layout.

While the drone footage brings the advantages of time to review and a better view of the whale, we are constrained by the duration of a flight. Focal follows would ideally last longer than the ~15 minutes of battery life per drone flight. Our previously collected footage gives us snapshots of behavior, and this makes it challenging to compare and analyze durations of behaviors. Therefore, I am excited that we are going to try conducting drone focal follows this summer by swapping out drones when power runs low to achieve longer periods of video coverage of whale behavior. I’ll be able to use these data to move from snapshots to analyzing longer clips and better understanding the behavioral ecology of gray whales. As exciting as this opportunity is, it also presents the challenge of method development. So, I now need to develop decision rules and data collection methods to answer the questions that I have been eagerly asking.

References

Altmann, Jeanne. 1974. “Observational Study of Behavior: Sampling Methods.” Behaviour 49 (3–4): 227–66. https://doi.org/10.1163/156853974X00534.

Friard, Olivier, and Marco Gamba. 2016. “BORIS: A Free, Versatile Open-Source Event-Logging Software for Video/Audio Coding and Live Observations.” Methods in Ecology and Evolution 7 (11): 1325–30. https://doi.org/10.1111/2041-210X.12584.

Torres, Leigh G., Sharon L. Nieukirk, Leila Lemos, and Todd E. Chandler. 2018. “Drone up! Quantifying Whale Behavior from a New Perspective Improves Observational Capacity.” Frontiers in Marine Science 5 (SEP). https://doi.org/10.3389/fmars.2018.00319.

“Do Dolphins Get Hives?”: The Skinny on Allergies in Cetaceans

By: Alexa Kownacki, Ph.D. Student, OSU Department of Fisheries and Wildlife, Geospatial Ecology of Marine Megafauna Lab 

While sitting on my porch and watching the bees pollinate the blooming spring flowers, I intermittently pause to scratch the hives along my shoulders and chest. In the middle of my many Zoom calls, I mute myself and stop my video because a wave of pollen hits my face and I immediately have to sneeze. With this, I’m reminded: Welcome to prime allergy season in the Northern Hemisphere. As I was scratching my chronic idiopathic urticaria (hives caused by an overactive immune system), I asked myself “Do dolphins get hives?” I had no idea. I know most terrestrial mammals can and do—just yesterday, one of the horses in the nearby pasture was suffering from a flare of hives. But, what about aquatic and marine mammals? 

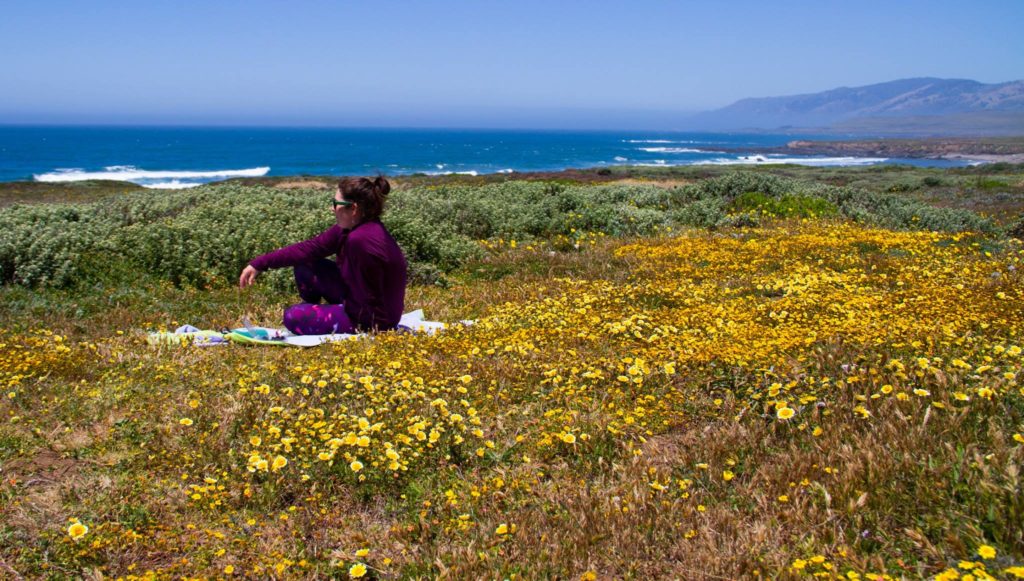
Springtime flowers blooming on the Central California Coast 2017. (Image Source: A. Kownacki)

As with most research on marine mammal health, knowledge is scare and is frequently limited to studies conducted on captive and stranded animals. Additionally, most of the current theories on allergic reactions in marine mammals are based on studies from terrestrial wildlife and humans. Because nearly all research on histamine pathways centers on terrestrial animals, I wanted to see what information exists the presence of skin allergies in marine mammals.  

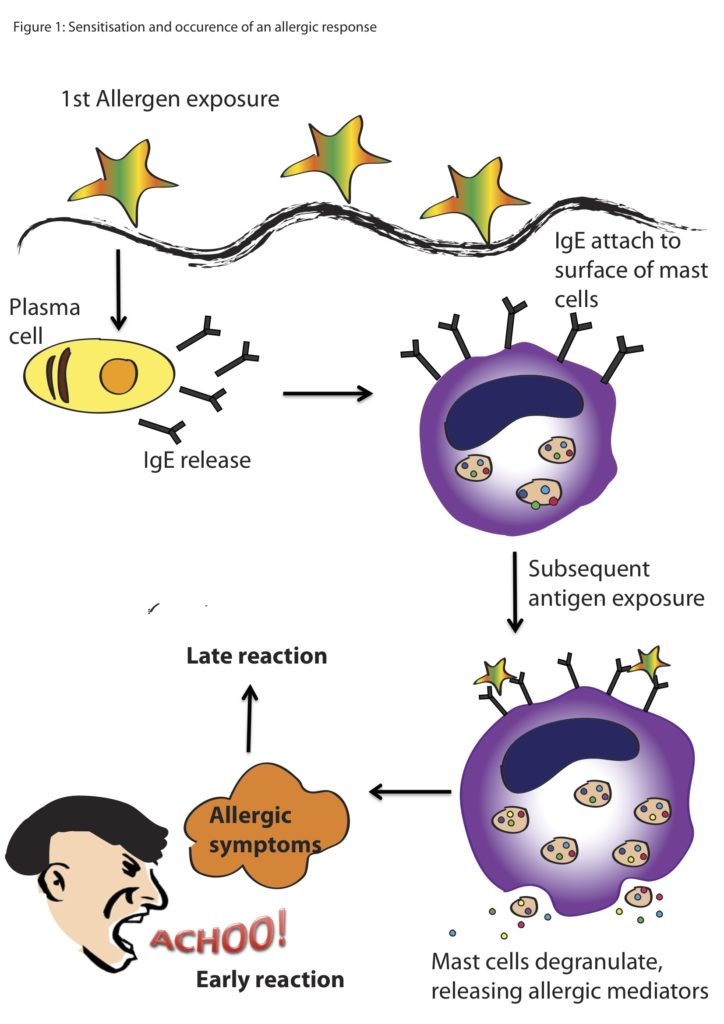
Allergic reactions trigger a cascade within the body, beginning with the introduction of a foreign body, which for many people is pollen. The allergen binds to antibodies that are produced to fight potentially harmful substances. Once this allergen binds to different types of cells, including mast cells, chemicals like histamines are released. Histamines cause the production of mucus and constriction of blood vessels, and thus are the reason your eyes water, your nose runs, or you start coughing. 

Basic cartoon of an allergic reaction from exposure to the allergen to the reaction from the animal. (Image Source: Scientific Malaysian)

As you probably can tell just by looking at a marine mammal, they have thicker skin and fewer mucus membranes that humans, due to the fact that they live in the water. However, mast cells or mast cell-like cells have been described in most vertebrate lineages including mammals, birds, reptiles, amphibians, and bony fishes (Hellman et al. 2017, Reite and Evenson 2006). Mast cell-like cells have also been described in an early ancestor of the vertebrates, the tunicate, or sea squirt (Wong et al. 2014). Therefore, allergic-reaction cascades that may present as hives, red and itchy eyes or nose in humans, also exist in marine mammals, but perhaps cause different or less visible symptoms.  

Skin conditions in cetaceans are gathering interest within the marine mammal health community. Even our very own Dawn BarlowDr. Leigh Torres, and Acacia Pepper assessed the skin conditions in New Zealand blue whales in their recent publication. Most visible skin lesions or markings on cetaceans are caused by parasites, shark bits, fungal infections, and fishery or boat interactions (Leone et al. 2019, Sweeney and Ridgway 1985). However, there is very little scientific literature about allergic reactions in marine mammals, let alone cetaceans. That being said, I managed to find a few critical pieces of information supporting the theory that marine mammals do in fact have allergies that can produce dermal reactions similar to hives in humans.  

In one study, three captive bottlenose dolphins developed reddened skin, sloughing, macules, and wheals on their ventral surfaces (Monreal-Pawlowsky et al. 2017). The medical staff first noticed this atopic dermatitis in 2005 and observed the process escalate over the next decade. Small biopsy samples from the affected areas on the three dolphins coincided with the appearance of four pollens in the air within the geographic region: Betula, Pistacia, Celtis, and Fagus (Monreal-Pawlowsky et al. 2017). Topical prednisone treatments were applied to the affected areas at various dosages that slowly resolved the skin irritations. Researchers manufactured an allergy vaccine using a combination of the four pollens in hopes that it would prevent further seasonal outbreaks, but it was unsuccessful. In the coming years, the facility intends to adjust the dosages to create a successful vaccine.  

In the three top images, visible skin irritation including redness, macules, wheals, and sloughing are present. In the image below, the above animal was treated with methylprednisolone and the skin irritation subsides. (Monreal-Pawlowsky et al. 2017)

In addition to the above study, there is an unpublished case of suspected allergic reaction to another pollen that produces a pruritic reaction on the ventral areas of dolphins on a seasonal basis (Vicente Arribes, personal communication). Although there are only a few documented cases of environmentally-triggered allergic reactions that are visible on the dermal layer of cetaceans, I believe this evidence makes the case that some cetaceans suffer from allergies much like us. So, next time you’re enjoying the beautiful blooms and annoyingly scratch your eyes, know that you are not alone. 

Image Source: FurEver Family

Citations: 

Barlow DR, Pepper AL and Torres LG (2019) Skin Deep: An Assessment of New Zealand Blue Whale Skin Condition. Front. Mar. Sci. 6:757.doi: 10.3389/fmars.2019.00757 

Hellman LT, Akula S, Thorpe M and Fu Z (2017) Tracing the Origins of IgE, Mast Cells, and Allergies by Studies of Wild Animals. Front. Immunol. 8:1749. doi: 10.3389/fimmu.2017.01749 

Leone AB, Bonanno Ferraro G, Boitani L, Blasi MF. Skin marks in bottlenose dolphins (Tursiops truncatus) interacting with artisanal fishery in the central Mediterranean Sea. PLoS One. 2019;14(2):e0211767. Published 2019 Feb 5. doi:10.1371/journal.pone.0211767 

Monreal-Pawlowsky T, Fernández-Bellon H, Puigdemont A (2017) Suspected Allergic Reaction in Bottlenose Dolphins (Tursiops truncatus). J Vet Sci Ani Husb 5(1): 108. doi: 10.15744/2348-9790.5.108 

Reite OB, Evensen O. Inflammatory cells of teleostean fish: a review focusing on mast cells/eosinophilic granule cells and rodlet cells. Fish Shellfish Immunol (2006) 20:192–208. doi:10.1016/j.fsi.2005.01.012 

Sweeney, J. C., & Ridgway, S. H. (1975). Common diseases of small cetaceans. J. Am. Vet. Med. Assoc167(7), 533-540. 

Wong GW, Zhuo L, Kimata K, Lam BK, Satoh N, Stevens RL. Ancient originof mast cells. Biochem Biophys Res Commun (2014) 451:314–8. doi:10.1016/j.bbrc.2014.07.124 

You can’t build a pyramid without the base: diving into the foundations of behavioral ecology to understand cetacean foraging

By Lisa Hildebrand, MSc student, OSU Department of Fisheries & Wildlife, Marine Mammal Institute, Geospatial Ecology of Marine Megafauna Lab

The last two months have been challenging for everyone across the world. While I have also experienced lows and disappointments during this time, I always try to see the positives and to appreciate the good things every day, even if they are small. One thing that I have been extremely grateful and excited about every week is when the clock strikes 9:58 am every Thursday. At that time, I click a Zoom link and after a few seconds of waiting, I am greeted by the smiling faces of the GEMM Lab. This spring term, our Principal Investigator Dr. Leigh Torres is teaching a reading and conference class entitled ‘Cetacean Behavioral Ecology’. Every week there are 2-3 readings (a mix of book chapters and scientific papers) focused on a particular aspect of behavioral ecology in cetaceans. During the first week we took a deep dive into the foundations of behavioral ecology (much of which is terrestrial-based) and we have now transitioned into applying the theories to more cetacean-centric literature, with a different branch of behavior and ecology addressed each week.

Leigh dedicated four weeks of the class to discussing foraging behavior, which is particularly relevant (and exciting) to me since my Master’s thesis focuses on the fine-scale foraging ecology of gray whales. Trying to understand the foraging behavior of cetaceans is not an easy feat since there are so many variables that influence the decisions made by an individual on where and when to forage, and what to forage on. While we can attempt to measure these variables (e.g., prey, environment, disturbance, competition, an individual’s health), it is almost impossible to quantify all of them at the same time while also tracking the behavior of the individual of interest. Time, money, and unworkable weather conditions are the typical culprits of making such work difficult. However, on top of these barriers is the added complication of scale. We still know so little about the scales at which cetaceans operate on, or, more importantly, the scales at which the aforementioned variables have an effect on and drive the behavior of cetaceans. For instance, does it matter if a predator is 10 km away, or just when it is 1 km away? Is a whale able to sense a patch of prey 100 m away, or just 10 m away? The same questions can be asked in terms of temporal scale too.

What is that gray whale doing in the kelp? Source: F. Sullivan.

As such, cetacean field work will always involve some compromise in data collection between these factors. A project might address cetacean movements across large swaths of the ocean (e.g., the entire U.S. west coast) to locate foraging hotspots, but it would be logistically complicated to simultaneously collect data on prey distribution and abundance, disturbance and competitors across this same scale at the same time. Alternatively, a project could focus on a small, fixed area, making simultaneous measurements of multiple variables more feasible, but this means that only individuals using the study area are studied. My field work in Port Orford falls into the latter category. The project is unique in that we have high-resolution data on prey (zooplankton) and predators (gray whales), and that these datasets have high spatial and temporal overlap (collected at nearly the same time and place). However, once a whale leaves the study area, I do not know where it goes and what it does once it leaves. As I said, it is a game of compromises and trade-offs.

Ironically, the species and systems that we study also live a life of compromises and trade-offs. In one of this week’s readings, Mridula Srinivasan very eloquently starts her chapter entitled ‘Predator/Prey Decisions and the Ecology of Fear’ in Bernd Würsig’s ‘Ethology and Behavioral Ecology of Odontocetes’ with the following two sentences: “Animal behaviors are governed by the intrinsic need to survive and reproduce. Even when sophisticated predators and prey are involved, these tenets of behavioral ecology hold.”. Every day, animals must walk the tightrope of finding and consuming enough food to survive and ensure a level of fitness required to reproduce, while concurrently making sure that they do not fall prey to a predator themselves. Krebs & Davies (2012) very ingeniously use the idea of economic analysis of costs and benefits to understand foraging behavior (but also behavior in general). While foraging, individuals not only have to assess potential risk (Fig. 1) but also decide whether a certain prey patch or item is profitable enough to invest energy into obtaining it (Fig. 2).

Leigh’s class has been great, not only to learn about foundational theories but to then also apply them to each of our study species and systems. It has been exciting to construct hypotheses based on the readings and then dissect them as a group. As an example, Sih’s 1984 paper on the behavioral response race of predators and prey prompted a discussion on responses of predators and prey to one another and how this affects their spatial distributions. Sih posits that since predators target areas with high prey densities, and prey will therefore avoid areas that predators frequent, their responses are in conflict with one another. Resultantly, there will be different outcomes depending on whichever response dominates. If the predator’s response dominates (i.e. predators are able to seek out areas of high prey density before prey can respond), then predators and prey will have positively correlated spatial distributions. However, if the prey responses dominate, then the spatial distributions of the two should be negatively correlated, as predators will essentially always be ‘one step behind’ the prey. Movement is most often the determinant factor to describe the strength of these relationships.

Video 1. Zooplankton closest to the camera will jump or dart away from it. Source: GEMM Lab.

So, let us think about this for gray whales and their zooplankton prey. The latter are relatively immobile. Even though they dart around in the water column (I have seen them ‘jump’ away from the GoPro when we lower it from the kayak on several occasions; Video 1), they do not have the ability to maneuver away fast or far enough to evade a gray whale predator moving much faster. As such, the predator response will most likely always be the strongest since gray whales operate at a scale that is several orders of magnitude greater than the zooplankton. However, the zooplankton may not be as helpless as I have made them seem. Based on our field observations, it seems that zooplankton often aggregate beneath or around kelp. This behavior could potentially be an attempt to evade predators as the kelp and reef crevices may serve as a refuge. So, in areas with a lot of refuges, the prey response may in fact dominate the relationship between gray whales and zooplankton. This example demonstrates the importance of habitat in shaping predator-prey interactions and behavior. However, we have often observed gray whales perform “bubble blasts” in or near kelp (Video 2). We hypothesize that this behavior could be a foraging tactic to tip the see-saw of predator-prey response strength back into their favor. If this is the case, then I would imagine that gray whales must decide whether the energetic benefit of eating zooplankton hidden in kelp refuges outweighs the energy required to pursue them (Fig. 2). On top of all these choices, are the potential risks and threats of boat traffic, fishing gear, noise, and potential killer whale predation (Fig. 1). Bringing us back to the analogy of economic analysis of costs and benefits to predator-prey relationships. I never realized it so clearly before, but gray whales sure do have a lot of decisions to make in a day!

Video 2. Drone footage of a gray whale foraging in kelp and performing a “bubble blast” at 00:40. Footage captured under NMFS permit #21678. Source: GEMM Lab.

Trying to tease apart these nuanced dynamics is not easy when I am unable to simply ask my study subjects (gray whales) why they decided to abandon a patch of zooplankton (Were the zooplankton too hard to obtain because they sought refuge in kelp, or was the patch unprofitable because there were too few or the wrong kind of zooplankton?). Or, why do gray whales in Oregon risk foraging in such nearshore coastal reefs where there is high boat traffic (Does their need for food near the reefs outweigh this risk, or do they not perceive the boats as a risk?). So, instead, we must set up specific hypotheses and use these to construct a thought-out and informed study design to best answer our questions (Mann 2000). For the past few weeks, I have spent a lot of time familiarizing myself with spatial packages and functions in R to start investigating the relationships between zooplankton and kelp hidden in the data we have collected over 4 years, to ultimately relate these patterns to gray whale foraging. I still have a long and steep journey before I reach the peak but once I do, I hope to have answers to some of the questions that the Cetacean Behavioral Ecology class has inspired.

Literature cited

Krebs, J. R., and N. B. Davies. 2012. Economic decisions and the individual in Davies, N. B. et al., eds. An introduction to behavioral ecology. John Wiley & Sons, Oxford.

Mann, J. 2000. Unraveling the dynamics of social life: long-term studies and observational methods in Mann, J., ed. Cetacean societies: field studies of dolphins and whales. University of Chicago Press, Chicago.

Sih, A. 1984. The behavioral response race between predator and prey. The American Naturalist 123:143-150.

Srinivasan, M. 2019. Predator/prey decisions and the ecology of fear in Würsig, B., ed. Ethology and ecology of odontocetes. Springer Nature, Switzerland.