Lessons learned from (not) going to sea

By Rachel Kaplan1 and Dawn Barlow2

1PhD student, Oregon State University College of Earth, Ocean, and Atmospheric Sciences and Department of Fisheries and Wildlife, Geospatial Ecology of Marine Megafauna Lab

2PhD Candidate, Oregon State University Department of Fisheries and Wildlife, Geospatial Ecology of Marine Megafauna Lab

“Hurry up and wait.” A familiar phrase to anyone who has conducted field research. A flurry of preparations, followed by a waiting game—waiting for the weather, waiting for the right conditions, waiting for unforeseen hiccups to be resolved. We do our best to minimize unknowns and unexpected challenges, but there is always uncertainty associated with any endeavor to collect data at sea. We cannot control the whims of the ocean; only respond as best we can.

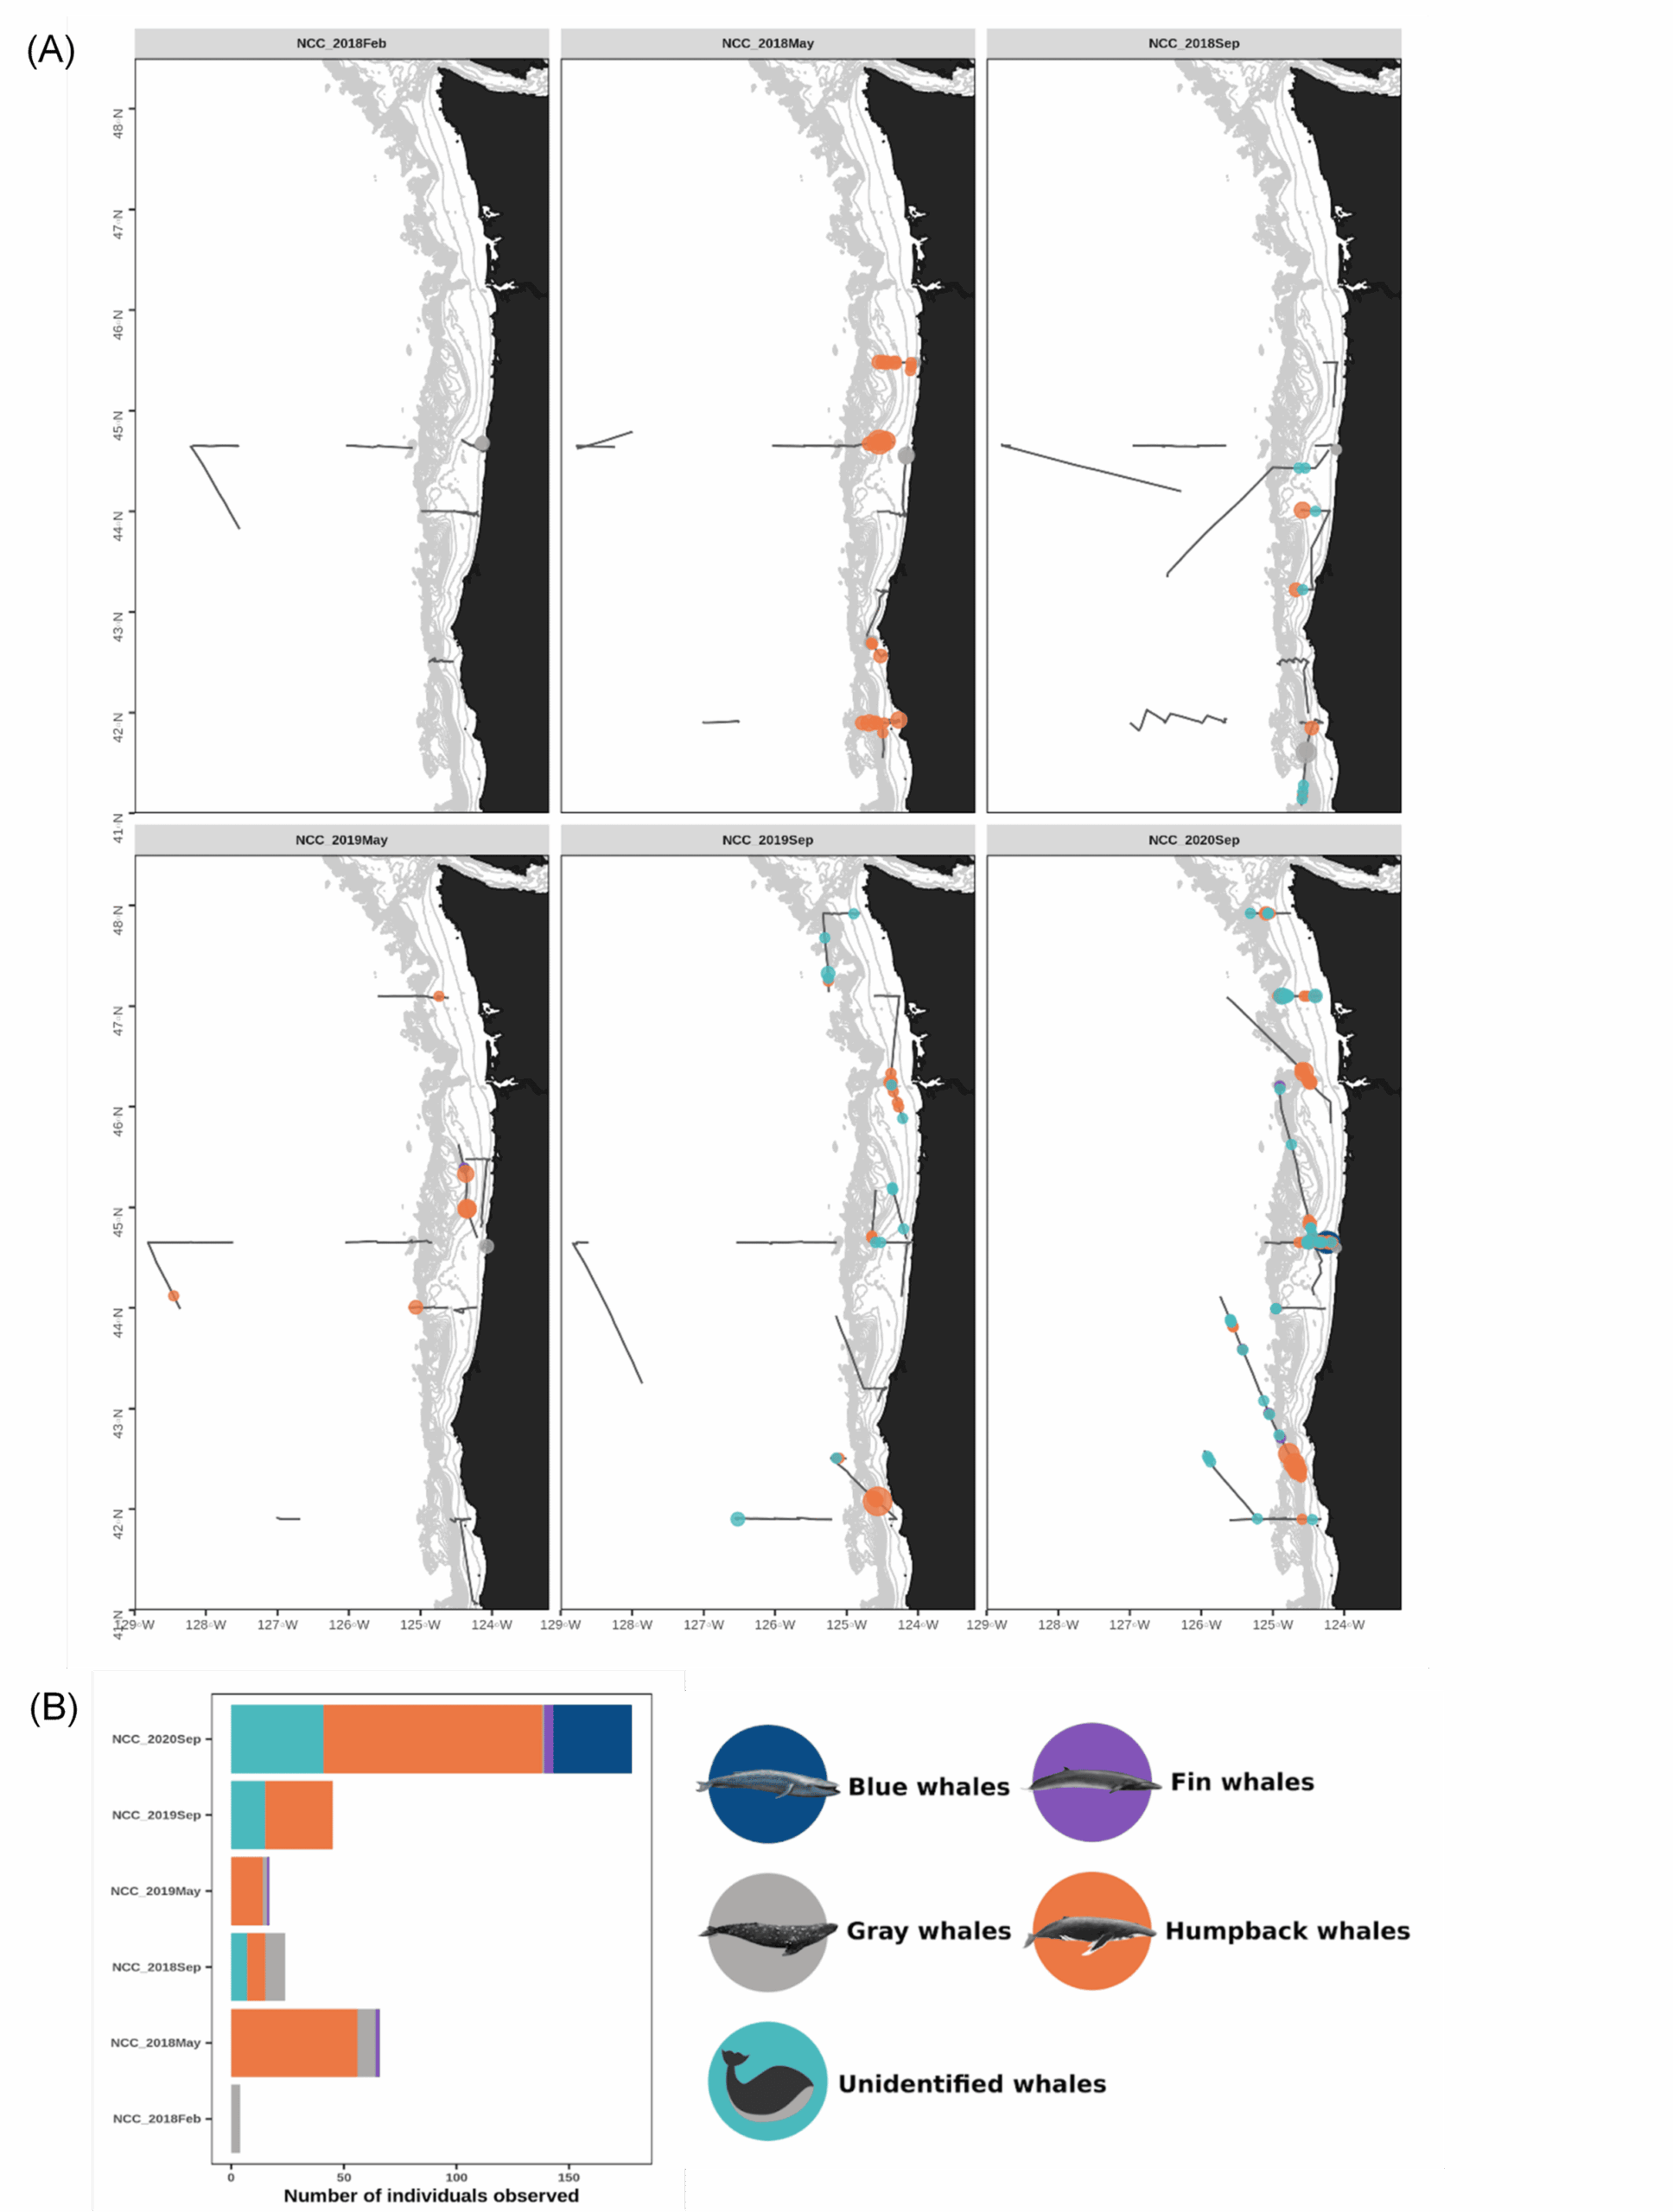
On 15 February 2021, we were scheduled to board the NOAA Ship Bell M. Shimada as marine mammal observers for the Northern California Current (NCC) ecosystem survey, a recurring research cruise that takes place several times each year. The GEMM Lab has participated in this multidisciplinary data collection effort since 2018, and we are amassing a rich dataset of marine mammal distribution in the region that is incorporated into the OPAL project. February is the middle of wintertime in the North Pacific, making survey conditions challenging. For an illustration of this, look no further than at the distribution of sightings made during the February 2018 cruise (Fig. 1), when rough sea conditions meant only a few whales were spotted.

Figure 1. (A) Map of marine mammal survey effort (gray tracklines) and baleen whale sightings recorded onboard the NOAA ship R/V Shimada during each of the NCC research cruises to-date and (B) number of individuals sighted per cruise since 2018. Note the amount of survey effort conducted in February 2018 (top left panel) compared to the very low number of whales sighted. Data summary and figures courtesy of Solene Derville.

Now, this is February 2021 and the world is still in the midst of navigating the global coronavirus pandemic that has affected every aspect of our lives. The September 2020 NCC cruise was the first NOAA fisheries cruise to set sail since the pandemic began, and all scientists and crew followed a strict shelter-in-place protocol among other COVID risk mitigation measures. Similarly, we sheltered in place in preparation for the February 2021 cruise. But here’s where the weather comes in yet again. Not only did we have to worry about winter weather at sea, but the inclement conditions across the country meant our COVID tests were delayed in transit—and we could not board the ship until everyone tested negative. By the time our results were in, the marine forecast was foreboding, and the Captain determined that the weather window for our planned return to port had closed.

So, we are still on shore. The ship never left the dock, and NCC February 2021 will go on the record as “NAs” rather than sightings of marine mammal presence or absence. So it goes. We can dedicate all our energy to studying the ocean and these spectacularly dynamic systems, but we cannot control them. It is an important and humbling reminder. But as we have continued to learn over the past year, there are always silver linings to be found.

Even though we never made it to the ship, it turns out there’s a lot you can get done onshore. Dawn has sailed on several NCC cruises before, and one of the goals this time was to train Rachel for her first stint at marine mammal survey work. This began at Dawn’s house in Newport, where we sheltered in place together for the week prior to our departure date.

We walked through the iPad program we use to enter data, looked through field guides, and talked over how to respond in different scenarios we might encounter while surveying for marine mammals at sea. We also joined Solene, a postdoc working on the OPAL project, for a Zoom meeting to edit the distance sampling protocol document. It was great training to discuss the finer points of data collection together, with respect to how that data will ultimately be worked into our species distribution models.

The February NCC cruise is famously rough, and a tough time to sight whales (Fig. 1). This low sighting rate arises from a combination of factors: baleen whales typically spend the winter months on their breeding grounds in lower latitudes so their density in Oregon waters is lower, and the notorious winter sea state makes sighting conditions difficult. Solene signed off our Zoom call with, “Go collect that high-quality absence data, girls!” It was a good reminder that not seeing whales is just as important scientifically as seeing them—though sometimes, of course, it’s not possible to even get out where you can’t see them. Furthermore, all absence data is not created equal. The quality of the absence data we can collect deteriorates along with the weather conditions. When we ultimately use these survey data to fuel species distribution models, it’s important to account for our confidence in the periods with no whale sightings.

In addition to the training we were able to conduct on land, the biggest silver lining came just from sheltering in place together. We had only met over Zoom previously, and spending this time together gave us the opportunity to get to know each other in real life and become friends. The week involved a lot of fabulous cooking, rainy walks, and an ungodly number of peanut butter cups. Even though the cruise couldn’t happen, it was such a rich week. The NCC cruises take place several times each year, and the next one is scheduled for May 2021. We’ll keep our fingers crossed for fair winds and negative COVID tests in May!

Figure 2. Dawn’s dog Quin was a great shelter in place buddy. She was not sad that the cruise was canceled.

Putting Physiological Tools to Work for Whale Conservation

By Alejandro Fernandez Ajo, PhD student at the Department of Biology, Northern Arizona University, Visiting scientist in the GEMM Lab working on the gray whale physiology and ecology project  

About four years ago, I was in Patagonia, Argentina deciding where to focus my research and contribute to whale conservation efforts. At the same time, I was doing fieldwork with the Whale Conservation Institute of Argentina at the “Whale Camp” in Península Valdés. I read tons of papers and talked with my colleagues about different opportunities and gaps in knowledge that I could tackle during my Ph.D. program. One of the questions that caught my attention was about the unknown cause (or causes) for the recurrent high calf mortalities that the Southern Right Whale (SRW) population that breeds at Peninsula Valdés experienced during the 2000s (Rowntree et al. 2013). Still, at that time, I was unsure how to tackle this research question.

Golfo San José, Península Valdés – Argentina. Collecting SRW behavioral data from the cliff’s vantage point. Source: A. Fernandez Ajo.

Between 2003 and 2013, at least 672 SRWs died, of which 91% were calves (Sironi et al. 2014). These mortalities represented an average total whale death per year of 80 individuals in the 2007-2013 period, which vastly exceeded the 8.2 average deaths per year of previous years by a ten-fold increase (i.e., 1993-2002) (Rowntree et al. 2013). In fact, this calf mortality rate was the highest ever documented for any population of large whales. During this period, from 2006 to 2009, I was the Coordinator of the Fauna Area in the Patagonian Coastal Zone Management Plan, and I collaborated with the Southern Right Whale Health Monitoring Program (AKA: The Stranding Program) that conducted field necropsies on stranded whales along the coasts of the Península and collected many different samples including whale baleen.

Southern Right Whale, found stranded in Patagonia Argentina. Source: Instituto de Conservación de Ballenas.

In this process, I learned about the emerging field of Conservation Physiology and the challenges of utilizing traditional approaches to studying physiology in large whales. Basically, the problem is that there is no possible way to obtain blood samples (the gold standard sample type for physiology) from free-swimming whales; whales are just too large! Fortunately, there are currently several alternative approaches for gathering physiological information on large whales using a variety of non-lethal and minimally invasive (or non-invasive) sample matrices, along with utilizing valuable samples recovered at necropsy (Hunt et al. 2013). That is how I learned about Dr. Kathleen Hunt’s novel research studying hormones from whale baleen (Hunt et al., 2018, 2017, 2014). Thus, I contacted Dr. Hunt and started a collaboration to apply these novel methods to understand the case of calf mortalities of the SRW calves in Patagonia utilizing the baleen samples that we recovered with the Stranding program at Península Valdés (see my previous blog post).

What is conservation physiology?

Conservation physiology is a multidisciplinary field of science that utilizes physiological concepts and tools to understand underlying mechanisms of disturbances to solve conservation problems. Conservation physiology approaches can provide sensitive biomarkers of environmental change and allow for targeted conservation strategies. The most common Conservation Physiology applications are monitoring environmental stressors, understanding disease dynamics and reproductive biology, and ultimately reducing human-wildlife conflict, among other applications.

I am now completing the last semester of my Ph.D. program. I have learned much about the amazing field of Conservation Physiology and how much more we need to know to achieve our conservation goals. I am still learning, yet I feel that through my research I have contributed to understanding how different stressors impact the health and wellbeing of whales, and about aspects of their biology that have long been obscured or unknown for these giants. One contribution I am proud of is our recent publication of, “A tale of two whales: putting physiological tools to work for North Atlantic and southern right whales,” which was published in January 2021 as a book chapter in “Conservation Physiology: Applications for Wildlife Conservation and Management” published by Oxford University Press: Oxford, UK.

This book outlines the significant avenues and advances that conservation physiology contributes to the monitoring, management, and restoration of wild animal populations. The book also defines opportunities for further growth in the field and identifies critical areas for future investigation. The text and the contributed chapters illustrate several examples of the different approaches that the conservation physiology toolbox can tackle. In our chapter, “A tale of two whales,” we discuss developments in conservation physiology research of large whales, with the focus on the North Atlantic right whale (Eubalaena glacialis) and southern right whale (Eubalaena australis), two closely related species that differ vastly in population status and conservation pressures. We review the advances in Conservation Physiology that help overcome the challenges of studying large whales via a suite of creative approaches, including photo-identification, visual health assessment, remote methods of assessing body condition, and endocrine research using non-plasma sample types such as feces, respiratory vapor, and baleen. These efforts have illuminated conservation-relevant physiological questions for both species, such as discrimination of acute from chronic stress, identification of likely causes of mortality, and monitoring causes and consequences of body condition and reproduction changes.

Book Overview:

This book provides an overview of the different applications of Conservation Physiology, outlining the significant avenues and advances by which conservation physiology contributes to the monitoring, management, and restoration of wild animal populations. By using a series of global case studies, contributors illustrate how approaches from the conservation physiology toolbox can tackle a diverse range of conservation issues, including monitoring environmental stress, predicting the impact of climate change, understanding disease dynamics, and improving captive breeding, and reducing human-wildlife conflict. The variety of taxa, biological scales, and ecosystems is highlighted to illustrate the far-reaching nature of the discipline and allow readers to appreciate the purpose, value, applicability, and status of the field of conservation physiology. This book is an accessible supplementary textbook suitable for graduate students, researchers, and practitioners in conservation science, ecophysiology, evolutionary and comparative physiology, natural resources management, ecosystem health, veterinary medicine, animal physiology, and ecology.

References

Hunt KE, Fernández Ajó A, Lowe C, Burgess EA, Buck CL. 2021. A tale of two whales: putting physiological tools to work for North Atlantic and southern right whales. In: “Conservation Physiology: Integrating Physiology Into Animal Conservation And Management”, ch. 12. Eds. Madliger CL, Franklin CE, Love OP, Cooke SJ. Oxford University press: Oxford, UK.

Sironi, M., Rowntree, V., Di Martino, M. D., Beltramino, L., Rago, V., Franco, M., and Uhart, M. (2014). Updated information for 2012-2013 on southern right whale mortalities at Península Valdés, Argentina. SC/65b/BRG/06 report presented to the International Whaling Commission Scientific Committee, Portugal. <https://iwc.int/home>.

Rowntree, V.J., Uhart, M.M., Sironi, M., Chirife, A., Di Martino, M., La Sala, L., Musmeci, L., Mohamed, N., Andrejuk, J., McAloose, D., Sala, J., Carribero, A., Rally, H., Franco, M., Adler, F., Brownell, R. Jr, Seger, J., Rowles, T., 2013. Unexplained recurring high mortality of southern right whale Eubalaena australis calves at Península Valdés, Argentina. Marine Ecology Progress Series, 493, 275-289. DOI: 10.3354/meps10506

Hunt KE, Moore MJ, Rolland RM, Kellar NM, Hall AJ, Kershaw J, Raverty SA, Davis CE, Yeates LC, Fauquier DA, et al., 2013. Overcoming the challenges of studying conservation physiology in large whales: a review of available methods. Conserv Physiol 1: cot006–cot006.

Hunt, K.E., Stimmelmayr, R., George, C., Hanns, C., Suydam, R., Brower, H., Rolland, R.M., 2014. Baleen hormones: a novel tool for retrospective assessment of stress and reproduction in bowhead whales (Balaena mysticetus). Conserv. Physiol. 2, cou030. https://doi.org/10.1093/conphys/cou030

Hunt, K.E., Lysiak, N.S., Moore, M.J., Rolland, R.M., 2016. Longitudinal progesterone profiles in baleen from female North Atlantic right whales (Eubalaena glacialis) match known calving history. Conserv. Physiol. 4, cow014. https://doi.org/10.1093/conphys/cow014

Hunt, K.E., Lysiak, N.S., Robbins, J., Moore, M.J., Seton, R.E., Torres, L., Buck, C.L., 2017. Multiple steroid and thyroid hormones detected in baleen from eight whale species. Conserv. Physiol. 5. https://doi.org/10.1093/conphys/cox061

Hunt, K.E., Lysiak, N.S.J., Matthews, C.J.D., Lowe, C., Fernández Ajó, A., Dillon, D., Willing, C., Heide-Jørgensen, M.P., Ferguson, S.H., Moore, M.J., Buck, C.L., 2018. Multi-year patterns in testosterone, cortisol and corticosterone in baleen from adult males of three whale species. Conserv. Physiol. 6, coy049. https://doi.org/10.1093/conphys/coy049

What makes a species, a species?

By Lisa Hildebrand, PhD student, OSU Department of Fisheries & Wildlife, Geospatial Ecology of Marine Megafauna Lab

Over the roughly 2.5 years that I have researched the Pacific Coast Feeding Group (PCFG) of gray whales, I have thought more and more about what makes a population, a population. From a management standpoint, the PCFG is currently not considered a separate population or even a sub-population of the Eastern North Pacific (ENP) gray whales. Rather, the PCFG is most commonly referred to as a ‘sub-group’ of the ENP. In my opinion, there are valid arguments both for and against the PCFG being designated as its own population. I will address those arguments briefly at the end of this post, but first, I want you to join on me on a journey that is tangential to my question of ‘what makes a population, a population?’ and one that started at the last Marine Mammal Institute Monthly Meeting (MMIMM).

During 2021’s first MMIMM, our director Dr. Lisa Ballance proposed that we lengthen our monthly meeting duration from 1 hour to 1.5 hours. The additional 30 minutes was to allow for an open-ended, institute-wide discussion of a current hot topic in marine mammal science. This proposal was immediately adopted, and the group dove into a discussion about the discovery of a new baleen whale species in the northeastern Gulf of Mexico: Rice’s whale (Balaenoptera ricei). Let me pause here very briefly to reiterate – the discovery of a new baleen whale species!! The fact that anything as large as 12 m could remain undiscovered in our oceans is really quite fascinating and shows that our scientific quest will likely never run out of discoverable subjects. Anyway, the discovery of this new species is supported by several lines of evidence. Unfortunately (but understandably), MMI’s discussion of these topics had to cease after 30 minutes, however I had more questions. I wanted to know what had sparked the researchers to believe that they had discovered a new cetacean species. 

Scientific illustration of Bryde’s whale. Source: NOAA Fisheries.

I started my research by skimming through some news articles about the Rice’s whale discovery. In a Smithsonian Magazine article, I saw a quote by Dr. Patricia Rosel, the lead author of the study detailing Rice’s whale, that read: “But we didn’t have a skull.”. That quote made me pause. A skull? Is that what it takes to discover and establish a new species? This desired piece of evidence seemed rather puzzling and a little antiquated to me, given that the field of genetics is so advanced now and since it is no longer an accepted practice to kill a wild animal just to study it (i.e., scientific whaling). I backtracked through the article to learn that in the 1990s, renowned marine mammal scientist Dale Rice (after whom Rice’s whale was named) recognized that a small population of baleen whale occurred in the northeastern part of the Gulf of Mexico year-round. At the time, this population was believed to be a sub-population of Bryde’s whale. It wasn’t until 2008, that NOAA scientists were able to conduct a genetic analysis of tissue samples from this population, only to find that these whales were genetically distinct from other Bryde’s whales (Rosel & Wilcox 2014). Yet, this information was not enough for these whales to be established as their own species. A skull really was needed to prove that these whales were in fact a new species. Thankfully (for the scientists) but sadly (for the whale), one of these individuals stranded in Sandy Key, Florida, in 2019, and a dedicated team of stranding responders from Florida Fish and Wildlife, Mote Marine Lab, NOAA, Dolphins Plus, and Marine Animal Rescue Society worked tirelessly in difficult conditions to comprehensively document and preserve this animal. Through the diligent work of this, and previous, stranding response teams, Dr. Rosel and her team were provided the opportunity to examine the skull needed to determine population-status. The science team determined that the bones atop the skull around the blowhole provided evidence that these whales were not only genetically, but also anatomically, different from Bryde’s whales. It was this incident, triggered by that short quote in the Smithsonian article, that brought me to my journey of asking ‘what makes a species, a species?’.

Given that I had just read that Dr. Rosel needed a skull to establish Rice’s whale as its own species, I assumed that my search for ‘how to establish a new species’ would end quickly in me finding a list of requirements, one of which would be ‘must present anatomical/skeletal evidence’. To my surprise, my search did not end quickly, and I did not find a straightforward list of requirements. Instead, I discovered that my question of ‘what makes a species, a species?’ does not have a black-and-white answer and involves a lot of debate.

The skull of this stranded whale was a large piece of evidence in establishing Rice’s whale as its own species. Source: Smithsonian Magazine from NOAA / Florida Fish and Wildlife Commission

Kevin de Queiroz, a vertebrate, evolutionary, and systematic biologist who has published extensively on theoretical and conceptual topics in systematic and evolutionary biology, believes that the issue of species delimitation (‘what makes a species, a species?’) has been made more complicated by a larger issue involving the concept of species itself (‘what is a species?’) (De Queiroz 2007). To date, there are 24 recognized species concepts (Mayden 1997). In other words, there are 24 different definitions of what a species is. Perhaps the most common example is the biological species concept where a species is defined as a group of individuals that are able to produce viable and fertile offspring following natural reproduction. Another example is the ecological species concept whereby a species is a group of organisms adapted to a particular set of resources and conditions, called a niche, in the environment. Problematically, many of these concepts are incompatible with one another, meaning that applying different concepts leads to different conclusions about the boundaries and numbers of species in existence (De Queiroz 2007).

This large number of species concepts is due to the different interests of certain subgroups of biologists. For example, highlighting morphological differences between species is central to paleontologists and taxonomists, whereas ecologists will focus on niche differences. Population geneticists will attribute species differences to genes, while for systematists, monophyly will be paramount. It goes on and on. And so does the debate about the concept of species. It seems that there currently is not one clear, defined consensus on what a species is. Some biologists argue that a species is a species if it is genetically different, while others will insist that skeletal and morphological evidence must be present. From what I can tell, it seems that scientists describe and (attempt to) establish a new species by publishing their lines of evidence, after which experts in the field discuss and evaluate whether a new species should be established. 

In the field of marine mammal science, the Society of Marine Mammalogy’s Taxonomic Committee is charged with maintaining a standard, accepted classification and nomenclature of marine mammals worldwide. The committee annually considers and evaluates new, peer-reviewed literature that proposes changes (including additions) to marine mammal taxonomy. I expect that the case of Rice’s whale will be on the committee’s docket this year. Given that Rosel and co-authors presented geographic, morphological, and genetic evidence to support the establishment of Rice’s whale, I would not be surprised if the committee adds it to their curated list.

After taking this dive into the ‘what makes a species, a species?’ question, let’s see if we can apply some of what we’ve learned to the ‘what makes a population, a population?’ question regarding the PCFG and ENP gray whales. Following the ecological species concept, an argument for the recognition of the PCFG as its own population would be that they occupy an entirely different environment during their summer foraging season than the ENP whales. Not only are the geographic ranges different, but PCFG whales also show behavioral differences in their foraging tactics and targeted prey. The argument against the PCFG being classified as its own population is largely supported by genetic analysis that has revealed ambiguous evidence that the PCFG and ENP are not genetically isolated from one another. While one study has shown that there is maternal cultural affiliation within the PCFG (meaning that calves born to PCFG females tend to return to the PCFG range; Frasier et al. 2011), another has revealed that mixing between ENP and PCFG gray whales on the breeding grounds does occur (Lang et al. 2014). So, even though these two groups feed in areas that are very far apart (ENP: Arctic vs PCFG: US & Canadian west coast) and certain individuals do show a propensity for a specific feeding ground, the genetic evidence suggests that they mix when on their breeding grounds in Baja California, Mexico. Depending on which species concept you align with, you may see better arguments for either side.

PCFG gray whale along the Oregon coast during the GEMM Lab’s 2020 GRANITE summer field season. Image captured under NOAA/NMFS permit #21678. Source: GEMM Lab.

You may be wondering why it is important to even ponder questions like ‘what makes a species, a species?’ and ‘what makes a population, a population?’. Does it really matter if the PCFG are considered their own population? Would anything really change? The answer is, most likely, yes. If the PCFG were to be recognized as their own population, it would likely have an immediate effect on their conservation status and subsequently on how the population needed to be managed. Rather than being under the umbrella of a large, (mostly) stable population of ~25,000 individuals, the PCFG would consist of only ~250 individuals. A group this small would possibly be considered “endangered”, which would require much stricter monitoring and management to ensure that their numbers did not decline from year to year, especially due to anthropogenic activities. 

For a long time, I felt like taxonomy was a bit of an archaic scientific field. In my mind, it was something that biologists had focused their time and energy on in the 18th century (most notably Carl Linnaeus, whose taxonomic classification system is still used today), but something that many biologists have moved on from focusing on in the 21st century. However, as I have developed and grown over the last years as a scientist, I have learned that scientific disciplines are often heavily intertwined and co-dependent on one another. As a result, I am able to see the enormous value and need for taxonomic work as it plays a large part in understanding, managing, and ultimately, conserving species and populations.

Literature cited

De Queiroz, K. 2007. Species concepts and species delimitation. Systematic Biology 56(6):879-886.

Frasier, T. R., Koroscil, S. M., White, B. N., and J. D. Darling. 2011. Assessment of population substructure in relation to summer feeding ground use in the eastern North Pacific gray whale. Endangered Species Research 14:39-48.

Lang, A. R., Calambokidis, J., Scordino, J., Pease, V. L., Klimek, A., Burkanov, V. N., Gearin, P., Litovka, D. I., Robertson, K. M., Mate, B. R., Jacobsen, J. K., and B. L. Taylor. 2014. Assessment of genetic structure among eastern North Pacific gray whales on their feeding grounds. Marine Mammal Science 30(4):1473-1493.

Mayden, R. L. 1997. A hierarchy of species concepts: the denouement of the species problem in The Units of Biodiversity – Species in Practice Special Volume 54 (M. F. Claridge, H. A. Dawah, and M. R. Wilson, eds.). Systematics Association.

Rosel, P. E., and L. A. Wilcox. 2014. Genetic evidence reveals a unique lineage of Bryde’s whale in the northeastern Gulf of Mexico. Endangered Species Research 25:19-34.

The ups and downs of the ocean

By Solène Derville, Postdoc, OSU Department of Fisheries and Wildlife, Geospatial Ecology of Marine Megafauna Lab

As a GEMM lab post-doc working on the OPAL project, my main goal for 2021 will be to produce accurate predictive models of baleen whale distribution off the Oregon coast to reduce entanglement risk. For the past months, I have been compiling, cleaning, and processing about two years of data collected by Leigh Torres and Craig Hayslip during monthly repeat surveys conducted onboard United States Coast Guard (USCG) helicopters. These standardized surveys record where and when whales are observed off the Oregon coast. These presence and absence data may now be modeled in relation to habitat, while accounting for effort and detection (as several parameters, such as weather and sea state, can affect the capacity of observers to detect whales at the surface). Considering that several baleen whale species (namely, humpback, fin, blue and gray whales) are known to feed in the area, prey availability is expected to be a major driver of their distribution.

As prey distribution data are frequently the lacking component in the habitat model equation, whale ecologists often resort to using environmental proxies. Variables such as topography (e.g., the depth or slope of the seafloor), water physical and chemical characteristics (e.g., temperature, salinity, oxygen concentration) or ocean circulation (e.g., currents, turbulence) have proved to be good predictors for fish or krill distribution, and in turn potential predictors for whale suitable habitats. In my search for such environmental variables to be tested in our future OPAL models, I have been focusing my research on a fascinating ocean feature: sea height.

Sea height varies both temporally and spatially under the influence of multiple factors, from internal mass of the solid Earth to the orbital revolution of the moon. After reading this blog you will realize that the flatness of the horizon at sea is a deceiving perspective (Figure 1) …

Figure 1: Flat? Really? (source: Pixabay)

Gravity and the geoid

We all know of Newton’s s discovery of gravity: the attraction force exerted by any object with a given mass on its surroundings. Yet, it is puzzling to think that the rate of acceleration of the apple falling on Newton’s head would have been different if Newton had been anywhere else on Earth.

Why is that and what does it have to do with sea height? On Earth, the standard gravity g is set at 9.80665 m/s2. This constant is called a “standard” because in fact, gravity varies at the surface of our planet, even if estimated at a fixed altitude. Indeed, as gravity is caused by mass, any change in relief or rock composition results in a change in gravity. For instance, magmatic activity in the upper mantle of the Earth and the crust causes a change in rock density and results in a change in gravity measured at the surface.

Gravity therefore is the first reason why the ocean surface is not flat. Gravity shapes an irregular surface called the “geoid”. This hypothetical ocean surface has equal gravitational potential anywhere on Earth and differs from the ellipsoid of reference by as much as 100 m! So to the question whether Earth is round or flat, I would say it is potato shaped (Figure 2)!

Figure 2: Exaggerated view of the gravitational potential of Earth. View a video animation here. (credit: European Space Agency)

The geoid is an essential reference for understanding ocean currents and monitoring changes in sea-level. Hypothetically, if ocean water had equal density everywhere and at any depth, the sea surface should match with the geoid… but that’s not the case. Let’s see why.

Ocean dynamic topography

Not unlike the hills and valleys covering landscapes, the ocean surface also has its highs and lows. Except that in the ocean, the surface topography is ever changing. Sea surface height (SSH) measures the average height difference between the observed sea level and the ellipsoid of reference (Figure 3). SSH is mostly affected by ocean circulation and may vary by as much as ±1 m. Indeed, just like the rocks inside the Earth, the water in the ocean varies in density. The vertical and horizontal physical structuring of the ocean was extensively discussed by Dawn last November while she was preparing for her PhD Qualifying Exams. Temperature clearly is at the core of the processes. As thermal expansion increases the space between warming water particles, the volume of a given amount of liquid water increases with increasing temperature. Warmer waters therefore take up “more space” than cooler waters, resulting in an elevated SSH.

Figure 3: Overview of the different fields used in altimetry (credit: CLS, https://duacs.cls.fr/)

SSH may therefore be used as an indicator of oceanographic phenomena such as upwellings, where warm surface waters are replaced by deep, cooler, and nutrient-rich waters moving upwards. The California Current that moves southwards along the North American coast is known as one of the world’s major currents affiliated with strong upwelling zones, which often triggers increased biological productivity. Several studies conducted in the California Current system have found a link between the variations in SSH and whale abundance or foraging activity (Abrahms et al. 2019; Pardo et al. 2015; Becker et al. 2016; Hazen et al. 2016).⁠

SSH is measured by altimeter satellites and is made freely available by the European Space Agency and the US National Aeronautics and Space Administration. Lucky me! Numerous variables are derived from SSH, as shown in Figure 3. Among other things, I was able to download the daily maps of Sea Surface Height Anomaly (SSHa, also referred to as Sea Level Anomaly: SLA) over the Oregon coast from February 2019 to December 2020. SSHa is the difference between observed SSH at a specific time and place from the mean SSH field of reference calculated over a long period of time. Negative values of SSHa potentially suggest upwellings of cooler waters that could be associated with higher prey availability. Figure 4 shows an example of environmental data mining as I try to match SSHa with whale observations made during OPAL surveys. Figure 4B suggests increased whale occurrence where/when SSHa is lower.

Figure 4: Preliminary exploration of the relationship between sea surface height anomaly (SSHa) and baleen whales (blue, fin, humpback, unidentified) observed during OPAL surveys off Oregon, USA, between February 2019 and December 2020. A) Example covering 3 months of survey during summer 2019. Sightings were grouped over 5-km segments of surveyed trackline and segments with at least one sighting were mapped with colored circles. Dotted grey lines are the repeated survey tracklines for each of the labeled study areas (NB = North Bend). Sightings are symbolized by area (color)
and group size (circle size). Monthly averages of SSHa are represented with a colored gradient. B) Monthly averages of SSHa measured over 5-km segments where whales were detected (presence) or not (absence).

Although encouraging, these preliminary insights are just the tip of the modeling iceberg. Many more testing and modeling steps will be required to determine confounding factors and relevant spatio-temporal scales at which these oceanographic variables may be influencing whale distribution off the Oregon coast. I am only at the start of a long road…

References

Abrahms, Briana, Heather Welch, Stephanie Brodie, Michael G. Jacox, Elizabeth A. Becker, Steven J. Bograd, Ladd M. Irvine, Daniel M. Palacios, Bruce R. Mate, and Elliott L. Hazen. 2019. “Dynamic Ensemble Models to Predict Distributions and Anthropogenic Risk Exposure for Highly Mobile Species.” Diversity and Distributions, no. December 2018: 1–12. https://doi.org/10.1111/ddi.12940.

Becker, Elizabeth, Karin Forney, Paul Fiedler, Jay Barlow, Susan Chivers, Christopher Edwards, Andrew Moore, and Jessica Redfern. 2016. “Moving Towards Dynamic Ocean Management: How Well Do Modeled Ocean Products Predict Species Distributions?” Remote Sensing 8 (2): 149. https://doi.org/10.3390/rs8020149.

Hazen, Elliott L, Daniel M Palacios, Karin A Forney, Evan A Howell, Elizabeth Becker, Aimee L Hoover, Ladd Irvine, et al. 2016. “WhaleWatch : A Dynamic Management Tool for Predicting Blue Whale Density in the California Current.” Journal of Applied Ecology 54 (5): 1415–28. https://doi.org/10.1111/1365-2664.12820.

Pardo, Mario A., Tim Gerrodette, Emilio Beier, Diane Gendron, Karin A. Forney, Susan J. Chivers, Jay Barlow, and Daniel M. Palacios. 2015. “Inferring Cetacean Population Densities from the Absolute Dynamic Topography of the Ocean in a Hierarchical Bayesian Framework.” PLOS One 10 (3): 1–23. https://doi.org/10.1371/journal.pone.0120727.