By Morgan O’Rourke-Liggett, M.S., Oregon State University, Department of Fisheries, Wildlife, and Conservation Sciences, Geospatial Ecology of Marine Megafauna Lab
It is the end.
I graduated with a Master’s degree.
This journey began 10 years ago when I visited colleges as a high school junior.
Begin with the end in mind.
I knew I would major in science as an undergrad and focus on something more specific as a graduate student. Studying whales required a background in marine biology, which led to my undergraduate degree in oceanography with strong emphasis in fisheries and wildlife, policy, and ecology. My master’s degree was built on that and added specific skills in data collection, management, and analysis.
The last time I wrote a blog, I was sharing the details of the data management and intricacies of my master’s project. Part of what made that project so successful was knowing the end goal: we wanted to know the area surveyed based on visibility and a visual representation of it. This knowledge aided in the development of matrices for environmental conditions, assigning integer variables to text survey notes, and determining what toolboxes and packages would be the most appropriate for analysis.
As a visual learner, I like to sketch out what I am doing or draw it on a whiteboard in a concept board. This approach is something I have always done and was further reinforced as a necessary step in my programming classes early on in my master’s education. My professors would assign a problem that could be solved in programming by making a function or script of code. We were taught to write out what our end goals were and what inputs were available for the problem. From there, filling in what steps were needed would be added. That was a critical step that made writing many difficult Python and R for loops and functions easier to build.
This skill and mentality of “beginning with the end” in mind can also be useful in preparation for data collection. There are eleven common data types that are described with examples in Table 1. Understanding what data type is being collected could save several hours of data management and wrangling during the data analysis phase. From my experience in data analytics, some models yield more accurate results if the character data is manipulated to behave like an integer in R. Additionally, certain packages and toolboxes in R and GIS are only useful for certain data types.
Data Type
Definition
Example
Integer (int)
Numeric data without fractions
-707, 0, 707
Floating point (float) or Double
Numeric data with fractions
707.07, 0.7, 707.00
Character (char)
Single letter, digit, space, punctuation mark, symbol
a, !
String (str or text) or Complex
Sequence of characters, digits, or symbols
Hello, +1-999-666-3333
Boolean (bool) or Logical
True or false values
0 (false), 1 (true)
Enumerated type (enum)
Small set of predefined values that can be text or numerical
rock (0), jezz (1)
Array
List with a number of elements in a specific order
rock (0), jazz (1), blues (2), pop (3)
Data
Date in YYYY-MM-DD fomat
2021-09-28
Time
Time in hh:mm:ss format or a time interval between two events
12:00:59
Datetime
Stores a value of both YYYY-MM-DD hh:mm:ss
2021-09-28 12:00:59
Timestamp
Number of seconds that have elapsed since midnight, 1st January 1970 in UTC
1632855600
Table 1. Table of the eleven most common data types with a short definition and an example of the data type. Table inspired by (Choudhury 2022).
Beginning with the end in mind allows more clarity and strategies to be efficient and achieve your goal. It develops a better understanding of why each stage of data collection and analysis is important; why each stage in a career is important. It provides a road map for what will, undoubtedly, be an incredible learning experience.
Did you enjoy this blog? Want to learn more about marine life, research, and conservation? Subscribe to our blog and get a weekly message when we post a new blog. Just add your name and email into the subscribe box below.
The winds are consistently (and sometimes aggressively) blowing from the north here on the Oregon coast, which can only mean one thing – summer has arrived! Since mid-May, the GRANITE (Gray whale Response to Ambient Noise Informed by Technology and Ecology) team has been looking for good weather windows to survey for gray whales and we have managed to get five great field work days already. In today’s blog post, I am going to share what (and who) we have seen so far.
On our first day of the field season, PI Leigh Torres, postdoc KC Bierlich and myself, were joined by a special guest: Dr. Andy Read. Andy is the director of the Duke University Marine Lab, where he also runs his own lab, which focuses on conservation biology and ecology of marine vertebrates. Andy was visiting the Hatfield Marine Science Center as part of the Lavern Weber Visiting Scientist program and was hosted here by Leigh. For those of you that do not know, Andy was Leigh’s graduate school advisor at Duke where she completed her Master’s and doctoral degrees. It felt very special to have Andy on board our RHIB Ruby for the day and to introduce him to some friends of ours. The first whale we encountered that day was “Pacman”. While we are always excited to re-sight an individual that we know, this sighting was especially mind-blowing given the fact that Leigh had “just” seen Pacman approximately two months earlier in Guerrero Negro, one of the gray whale breeding lagoons in Mexico (read this blog about Leigh and Clara’s pilot project there). Aside from Pacman, we saw five other individuals, all of which we had seen during last year’s field season.
The first day of field work for the 2023 GRANITE field season! From left to right: Leigh Torres, Lisa Hildebrand, Andy Read, and KC Bierlich. Source: L. Torres.
Since that first day on the water, we have conducted field work on four additional days and so far, we have only encountered known individuals in our catalog. This fact is exciting because it highlights the strong site fidelity that Pacific Coast Feeding Group (PCFG) gray whales have to areas within their feeding range. In fact, I am examining the residency and space use of each individual whale we have observed in our GRANITE study for one of my PhD chapters to better understand the level of fidelity individuals have to the central Oregon coast. Furthermore, this site fidelity underpins the unique, replicate data set on individual gray whale health and ecology that the GRANITE project has been able to progressively build over the years. So far during this field season in 2023, we have seen 13 unique individuals, flown the drone over 10 of them and collected four fecal samples from two, which represent critical data points from early on in the feeding season.
Our sightings this year have not only highlighted the high site fidelity of whales to our study area but have also demonstrated the potential for internal recruitment of calves born to “PCFG mothers” into the PCFG. Recruitment to a population can occur in two ways: externally (individuals immigrate into a population from another population) or internally (calves born to females that are part of the population return to, or stay, within their mothers’ population). Three of the whales we have seen so far this year are documented calves from females that are known to consistently use the PCFG range, including our central Oregon coast study area. In fact, we documented one of these calves, “Lunita”, just last year with her mother (see Clara’s recap of the 2022 field season blog for more about Lunita). The average calf survival estimate between 1997-2017 for the PCFG was 0.55 (Calambokidis et al. 2019), though it varied annually and widely (range: 0.34-0.94). Considering that there have been years with calf survival estimates as low as ~30%, it is therefore all the more exciting when we re-sight a documented calf, alive and well!
“Lunita”, an example of successful internal recruitment
We have also been collecting data on the habitat and prey in our study system by deploying our paired GoPro/RBR sensor system. We use the GoPro to monitor the benthic substrate type and relative prey densities in areas where whales are feeding. The RBR sensor collects high-frequency, in-situ dissolved oxygen and temperature data, enabling us to relate environmental metrics to relative prey measurements. Furthermore, we also collect zooplankton samples with a net to assess prey community and quality. On our five field work days this year, we have predominantly collected mysid shrimp, including gravid (a.k.a. pregnant) individuals, however we have also caught some Dungeness and porcelain crab larvae. The GEMM Lab is also continuing our collaboration with Dr. Susanne Brander’s lab at OSU and her PhD student Lauren Kashiwabara, who plan on conducting microplastic lab experiments on wild-caught mysid shrimp. Their plan is to investigate the growth rates of mysid shrimp under different temperature, dissolved oxygen, and microplastic load conditions. However, before they can begin their experiments, they need to successfully culture the mysids in the lab, which is why we collect samples for them to use as their ‘starter culture’. Stay tuned to hear more about this project as it develops!
So, all in all, it has been an incredibly successful start to our field season, marked by the return of many familiar flukes and flanks! We are excited to continue collecting rock solid GRANITE data this summer to increase our efforts to understand gray whale ecology and physiology.
References
Calambokidis, J., Laake, J., and Perez, A. (2019). Updated analyses of abundance and population structure of seasonal gray whales in the Pacific Northwest, 1996-2017. IWC, SC/A17/GW/05 for the Workshop on the Status of North Pacific Gray Whales. La Jolla: IWC.
By Annie Doron, Undergraduate Intern, Oregon State University, GEMM Laboratory
Hey up! My name is Annie Doron, and I am an undergraduate Environmental Science student from the University of Sheffield (UK) on my study year abroad. One of my main motivations for undertaking this year abroad was to gain experience working in a marine megafauna lab. Whales in particular have always captivated my interest, and I have been lucky enough to observe humpback whales in Iceland and The Azores, and even encountered one whilst diving in Australia! For the past 10 months, I have had the unique opportunity to work in the GEMM Lab analyzing Pacific Coast Feeding Group (PCFG) gray whales off the Oregon Coast (Figure 1). I must admit, it has been simply wonderful!
Figure 1. Aerial image of a PCFG gray whale off the Oregon Coast.
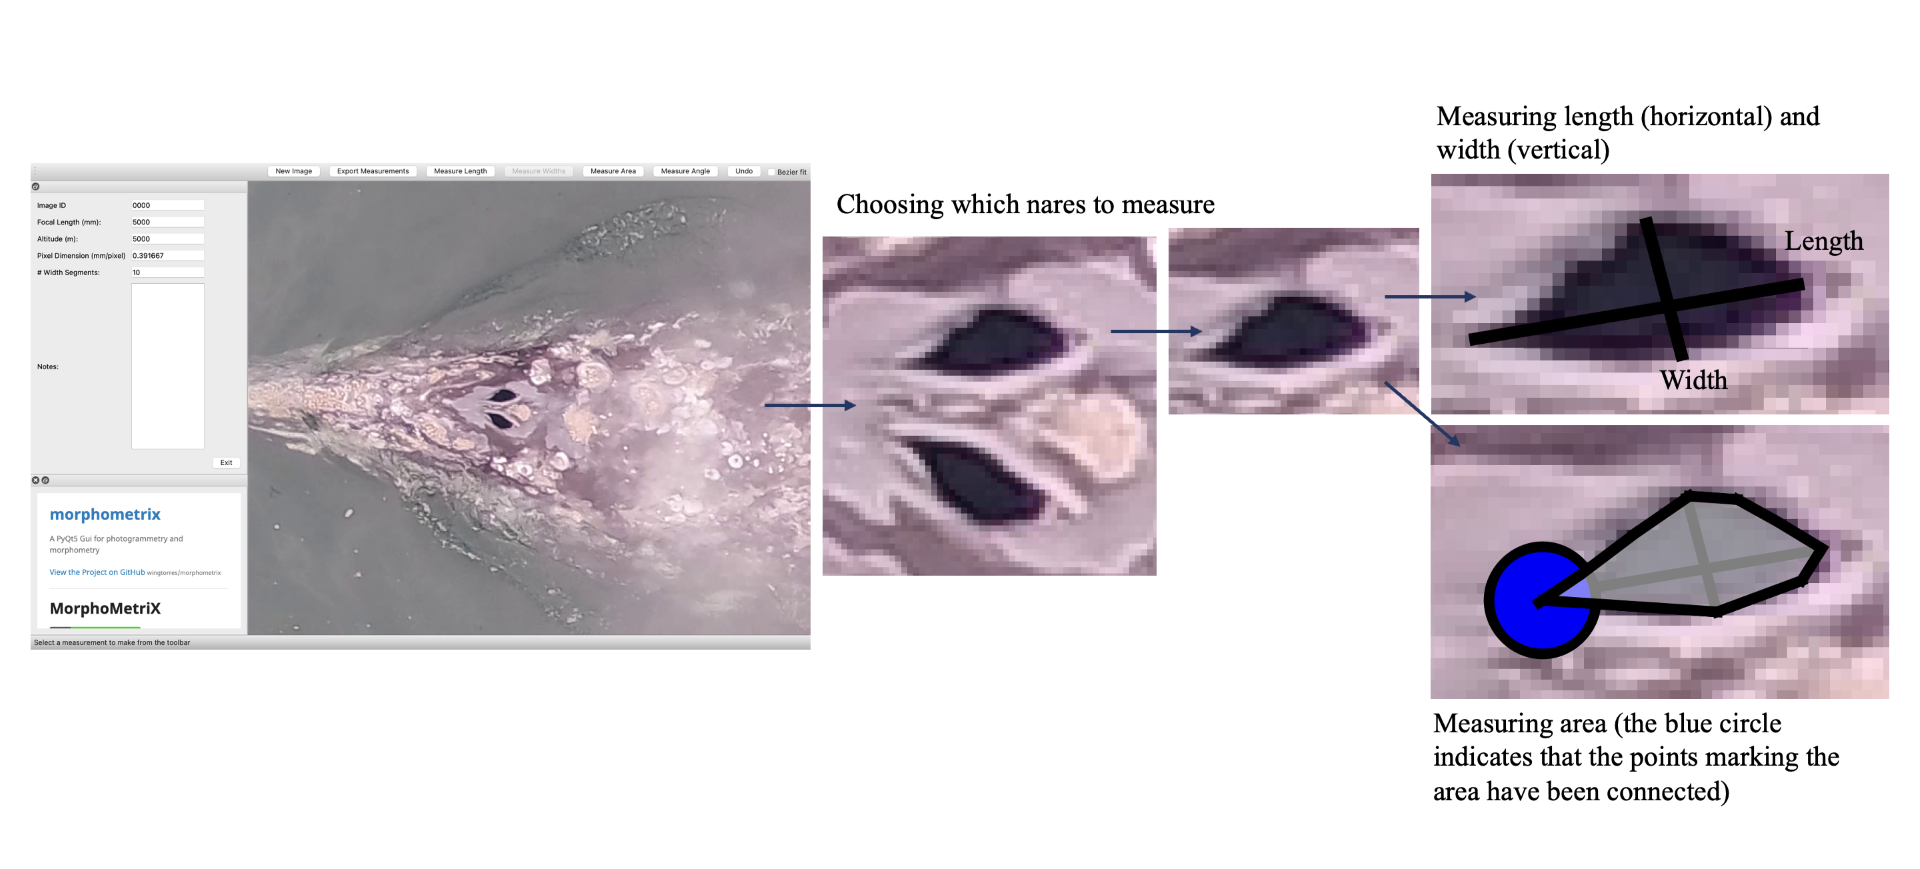
How did I end up getting involved with the GEMM Lab? I was first accepted into Scarlett Arbuckle’s research-based class in fall term 2022, which is centered around partnering with a mentor for a research project. Having explored the various fields of research at HMSC, I contacted Leigh Torres with interest in getting involved in the GEMM Lab and to establish a research project suitable for a totally inexperienced, international, undergraduate student. Thankfully, Leigh forwarded my email to KC Bierlich who offered to be my mentor for the class, and the rest is history! I first began analyzing drone imagery to measure length and body condition of PCFG gray whales, which provided an opportunity to get involved with the lab and gain experience using the photogrammetry software MorphoMetriX (Torres & Bierlich, 2020) (see KC’s blog), which is used to make morphometric measurements of whales. Viewing drone imagery of whales sparked my interest in how they use their blowholes (otherwise called ‘nares’) to replenish their oxygen stores; this led to us establishing a research project for the class where we tested if we could use MorphoMetriX to measure blowholes from drone imagery.
Extending this project into winter and spring terms (via research credits) has enabled me to continue working with Leigh and KC, as well as to collaborate with Clara Bird and Jim Sumich. Thanks to KC, who has patiently guided me through the ins and outs of working on a research project, I now feel more confident handling and manipulating large datasets, analyzing drone footage (i.e., differentiating between behavioral states, recording breathing sequences, detecting when a whale is exhaling vs inhaling, etc.), and speaking in public (although I still get pretty bad stage fright, but I think that is a typical conundrum undergrads face). Whatsmore, applying R – a programming language used for statistical analysis and data visualization, which I have been trying to wrap my head around for years – to my own dataset has helped me greatly enhance my skills using it.
So, what exciting things have we been working on this year? Given that we often cannot simply study a whale from inside a laboratory – due to size-related logistical implications – we must use proxies (i.e., a variable that is representative of an immeasurable variable). Since cetaceans must return to the surface to offload carbon dioxide and replenish their oxygen stores, measuring their breath frequency and magnitude is one way to study a whale’s oxygen consumption, in turn offering insight into its energy expenditure (Williams, 1999). Blowholes are one proxy we can use to study breath magnitude. Blowholes can be utilized in this way by measuring inhalation duration (the amount of time a whale is inhaling, which is based on a calculation developed by Jim Sumich) and blowhole area (the total area of a blowhole) to gauge variations in tidal volume (the amount of air flowing in and out of the lungs).
Measuring inhalation duration and blowhole area is important because a larger blowhole area (i.e., one that is more dilated) and a longer inhalation duration is indicative of higher oxygen intake, which can infer stress. For example, in this population, higher stress levels are associated with increased vessel traffic (Lemos et al., 2022), and skinnier whales have higher stress levels compared to chubby, healthy whales (Lemos, Olsen, et al., 2022). Hence, measuring the variation around blowholes could be utilized to predict challenges whales face from climate change and anthropogenic disturbance, including fishing (Scordino et al., 2017) and whale watching industry threats (Sullivan & Torres, 2018) (see Clara’s blog), as well as to inform effective management strategies. Furthermore, measuring the variables inhalation duration and blowhole area could help to identify whether whales are taking larger breaths associated with certain ‘gross behavior states’, otherwise known as ‘primary states’, which include: travel, forage, rest, social (Torres et al., 2018). This could enable us to assess the energetic costs of different foraging tactics (i.e., head standing, side-swimming, and bubble blasting (Torres et al., 2018), as well as consequences of disturbance events, on an individual and population health perspective.
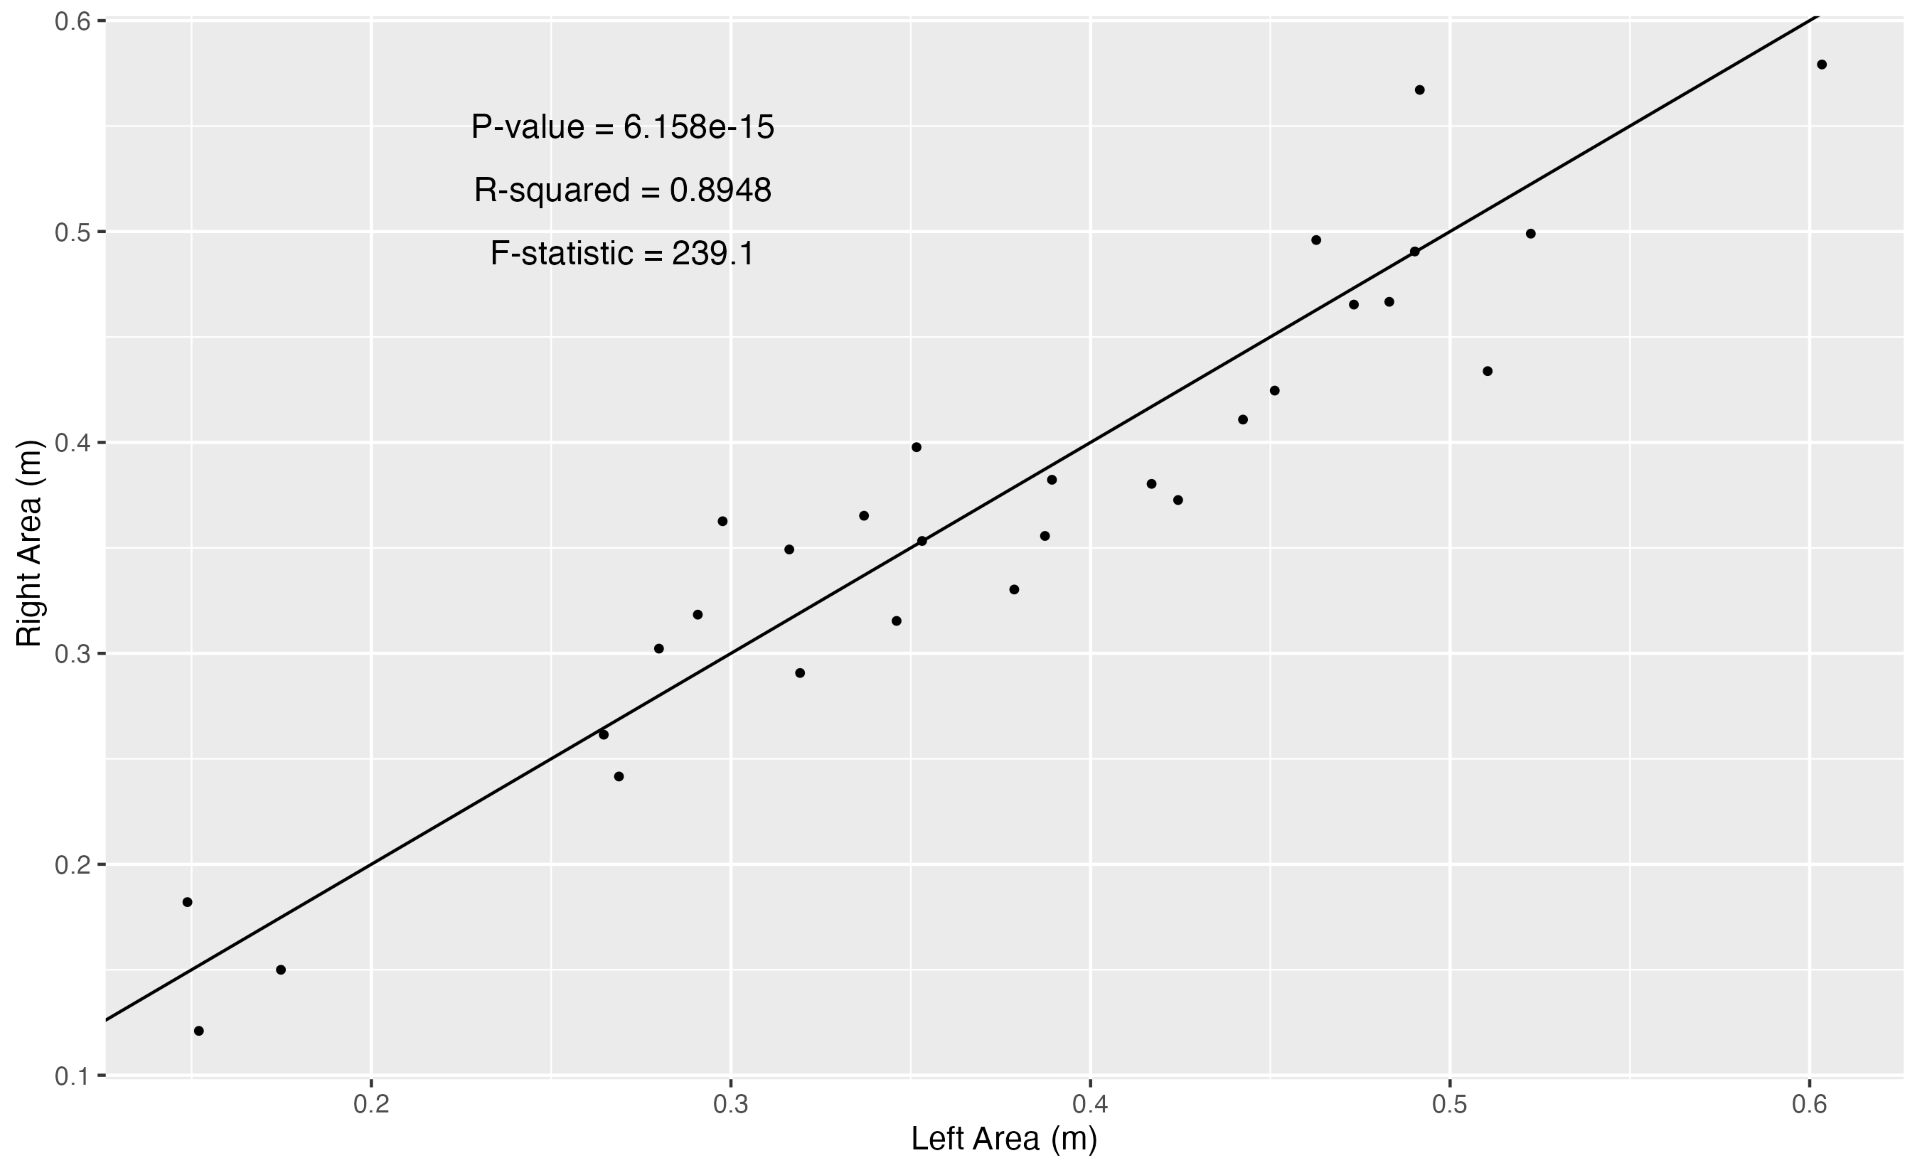
Inhalation duration has been explored in the past by using captive animals. For example, there have been studies on heart rate and breathing of bottlenose dolphins in human care facilities (Blawas et al., 2021; Fahlman et al., 2015). Recently, Nazario et al. (2022) was able to measure inhalation duration and blowhole area using suction-cup video tags. Her study led us to consider if it was possible to measure the parameters and variation around respiration by measuring blowhole area and inhalation duration of PCFGs from drone imagery. We employed MorphoMetriX to study the length, width, and area of a blowhole (Figure 2). Preliminary analyses verified that the areas of the left and right blowholes are very similar (Figure 3); this finding saved us a lot of time because from thereon we only measured either the left or right side. Interestingly, we see some variation in blowhole area within and across individuals (Figure 4). This variation changes within individuals based on primary state. For example, the whales “Glacier”, “Nimbus”, and “Rat” show very little variation whilst traveling but a large amount whilst foraging. Comparatively, “Dice” shows little variation whilst foraging and large variation whilst traveling. Whilst considering cross-individual comparisons, we can see that “Sole”, “Rat”, “Nimbus”, “Heart”, “Glacier”, “Dice”, and “Coal” each exhibit relatively large amounts of variation, yet “Mahalo”, “Luna”, “Harry”, “Hummingbird” and “Batman” exhibit very little. One potential reason for some individuals displaying higher levels of variation than others could be higher levels of exposure to disturbance events that we were unable to measure or evaluate in this study.
Figure 2. How we measured the length, width, and area of a blowhole using MorphoMetriX.
Figure 3. Data driven evidence that the left and the right blowhole areas are very similar.
Figure 4. Variation in blowhole area amongst individual PCFG whales. The hollow circles represent the means, and the color represents the primary state the whale is exhibiting, foraging (purple) vs. traveling (blue), which will be further explored in Clara’s PhD.
Now, we are venturing into June and are at a stage where we (KC, Clara, Jim, Leigh, and I) are preparing to publish a manuscript! What a way to finish such a fantastic year! The transition from a 3-month-long pilot study to a much larger data analysis and eventual preparation for a manuscript has been a monumental learning experience. If anybody had told me a year ago that I would be involved in publishing a body of work – especially one that is so meaningful to me – I would simply not have believed them! We hope this established methodology for measuring blowholes will help other researchers carry out blowhole measurements using drone imagery across different populations and species. Further research is required to explore the differences in inhalation duration and blowhole area between different primary states, specifically across different foraging tactics.
It has been a great privilege working with the GEMM Lab these past months, and I was grateful to be included in their monthly lab meetings, during which members gave updates and we discussed recently published papers. Seeing such an enthusiastic, kind, and empathic group of people working together taught me what working in a supportive lab could look and feel like. In spite of relocating from Corvallis to Bend after my first term, I was happy to be able to continue working remotely for the lab for the remainder of my time (even though I was ~200 miles inland). I thoroughly enjoyed living in Corvallis, highlights of which were scuba diving adventures to the Puget Sound and coastal road trips with friends. The appeal to move arose from Bend’s reputation as an adventure hub – with unlimited opportunities for backcountry ski access – as well as its selection of wildlife ecology courses (with a focus on species specific to central Oregon). I moved into ‘Bunk & Brew’ (Bend’s only hostel, which is more like a big house of friends with occasional hostel guests) on January 1st after returning from spending Christmas with friends in my old home in Banff, Canada. I have since been enjoying this wonderful multifaceted lifestyle; working remotely in the GEMM Lab, attending in-person classes, working part-time at the hostel, as well as skiing volcanoes (Mount Hood, Middle and South Sister (Figure 5) or climbing at Smith Rock during my days off. Inevitably, I do miss the beautiful Oregon coast, and I will always be grateful for this ideal opportunity and hope this year marks the start of my marine megafauna career!
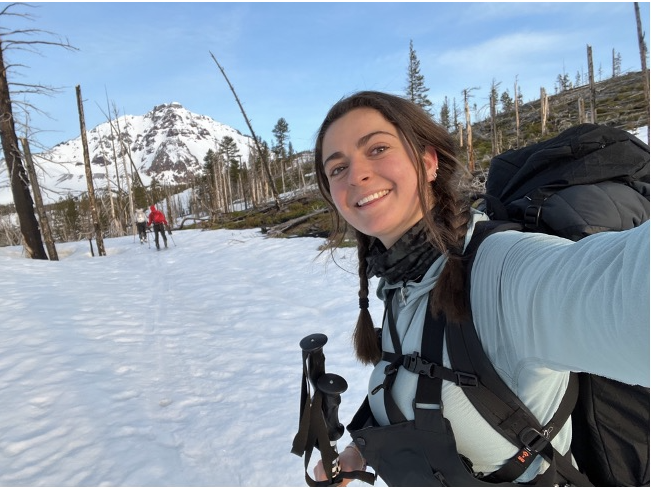
Figure 5. What I get up to when I’m not studying blowholes! (This was taken at 5am on the long approach to Middle and North Sister. North Sister is the peak featured in the backdrop).
References
Blawas, A. M., Nowacek, D. P., Allen, A. S., Rocho-Levine, J., & Fahlman, A. (2021). Respiratory sinus arrhythmia and submersion bradycardia in bottlenose dolphins (Tursiops truncatus). Journal of Experimental Biology, 224(1), jeb234096. https://doi.org/10.1242/jeb.234096
Fahlman, A., Loring, S. H., Levine, G., Rocho-Levine, J., Austin, T., & Brodsky, M. (2015). Lung mechanics and pulmonary function testing in cetaceans. Journal of Experimental Biology, 218(13), 2030–2038. https://doi.org/10.1242/jeb.119149
Lemos, L. S., Haxel, J. H., Olsen, A., Burnett, J. D., Smith, A., Chandler, T. E., Nieukirk, S. L., Larson, S. E., Hunt, K. E., & Torres, L. G. (2022). Effects of vessel traffic and ocean noise on gray whale stress hormones. Scientific Reports, 12(1), 18580. https://doi.org/10.1038/s41598-022-14510-5
Lemos, L. S., Olsen, A., Smith, A., Burnett, J. D., Chandler, T. E., Larson, S., Hunt, K. E., & Torres, L. G. (2022). Stressed and slim or relaxed and chubby? A simultaneous assessment of gray whale body condition and hormone variability. Marine Mammal Science, 38(2), 801–811. https://doi.org/10.1111/mms.12877
Nazario, E. C., Cade, D. E., Bierlich, K. C., Czapanskiy, M. F., Goldbogen, J. A., Kahane-Rapport, S. R., van der Hoop, J. M., San Luis, M. T., & Friedlaender, A. S. (2022). Baleen whale inhalation variability revealed using animal-borne video tags. PeerJ, 10, e13724. https://doi.org/10.7717/peerj.13724
Scordino, J., Carretta, J., Cottrell, P., Greenman, J., Savage, K., & Scordino, J. (2017). Ship Strikes and Entanglements of Gray Whales in the North Pacific Ocean. Cambridge: International Whaling Commission, 1924–2015.
Sullivan, F. A., & Torres, L. G. (2018). Assessment of vessel disturbance to gray whales to inform sustainable ecotourism: Vessel Disturbance to Whales. The Journal of Wildlife Management, 82(5), 896–905. https://doi.org/10.1002/jwmg.21462
Sumich, J. L. (1994). Oxygen extraction in free-swimming gray whale caves. Marine Mammal Science, 10(2), 226–230. https://doi.org/10.1111/j.1748-7692.1994.tb00266.x
Torres, W., & Bierlich, K. (2020). MorphoMetriX: A photogrammetric measurement GUI for morphometric analysis of megafauna. Journal of Open Source Software, 5(45), 1825. https://doi.org/10.21105/joss.01825
Torres, L. G., Nieukirk, S. L., Lemos, L., & Chandler, T. E. (2018). Drone Up! Quantifying Whale Behavior From a New Perspective Improves Observational Capacity. Frontiers in Marine Science, 5, 319. https://doi.org/10.3389/fmars.2018.00319 Williams, T. M. (1999). The evolution of cost efficient swimming in marine mammals: Limits to energetic optimization. Philosophical Transactions of the Royal Society of London. Series B: Biological Sciences, 354(1380), 193–201. https://doi.org/10.1098/rstb.1999.0371