Celest Sorrentino, GEMM Lab MSc Student, OSU Department of Fisheries, Wildlife and Conservation Sciences, Geospatial Ecology of Marine Megafauna Lab
July has rolled around just as quickly as the coastal winds sweep across the south coast of Oregon, bringing in a new team for the 2026 TOPAZ/JASPER field season, the projects’ 12th year in the running. This season also marks my third summer as part of the long-standing TOPAZ/JASPER legacy: first learning the ropes alongside Team Protein and master’s student Allison Dawn in 2024, then growing into my role as the on-site lead for Team Dabwich in 2025 with both Leigh and Lisa’s invaluable guidance from Newport, and now returning once again to guide the 2026 team.
With each season, I have gained a deeper appreciation for the collaboration and genuine passion required to sustain a long-term project like ours. I am especially grateful for the foundation created by previous master’s students Florence Sullivan, Lisa Hildebrand, and Allison Dawn, and for Leigh’s unwavering dedication and effort for TOPAZ/JASPER to continue year after year. Now a week and a half into the field season, the team has completed their first 10-day stretch of training, and morale remains just as high as it was on day one. Each year unites an entirely new and exciting mix of undergraduate and high school interns, and the 2026 team is no exception.
Adrian Ruiz got a head start by joining the GEMM lab in June as our NSF REU intern for this summer. Originally from Santa Rosa, Adrian just completed his second year at CSU Monterey Bay studying Marine Science. Using a microscope to identify tiny bits in the water is no new feat, since at CSUMB he interned along Dr. Matt Scott Savoca and Chad King identifying microplastics from water samples taken in the Monterey Bay area, as part of a larger project investigating the potential health risk for marine mammals. As the oldest brother of three, Adrian naturally acts as a gentle instructive team member for the younger interns.
(left) Adrian reviewing drone footage of pygmy blue whale mother-calf pairs using BORIS for his REU project.(middle) Celest and Adrian out on the kayak in PO. (right) Adrian and fellow TOPAZ/JASPER HS intern Gavin C working together as cliff team.
Gavin Vierra is one of our high school interns residing in Lakeside, OR. Gavin was one of our first applicants for the TOPAZ/JASPER project this year, where his curious spirit shined through. Having spent most of his life fishing and kayaking, spending a few hours on the water is nothing new. However, Gavin is truly in his element when cooking, as his love for making others feel at home manifests in delicious pasta meals for post-fieldwork dinner, such as chicken alfredo and three-cheese penne.
(left) Gavin V with his grandmother and nephew in California. (middle) Gavin V. whipping up some French Toast for the team. (right) Gavin V and Adrian learning how to ocean kayak in sync during our kayak training with Southcoast Tours.
Owen Fewell is an upcoming senior at OSU studying Fisheries and Wildlife. Originally from Marin County, CA, his earliest memories begin in the outdoors, ocean kayaking along the dynamic coastline of Point Reyes with his parents. Also, an older brother like Adrian, Owen’s personality as a natural jester helps keep morale high even after spending 5 hours navigating to our stations.
(left) Throwback picture of Owen ocean kayaking with his parents in Point Reyes. (middle) Celest, Owen, and Gavin V out on the kayak in Tichenor Cove after completing all of Mill Rocks stations.(right) Owen and Adrian practicing some stability at Natural Bridges.
Gavin Cada is our second high school intern from Brookings-Harbor High School. Having moved to the south coast from Las Vegas, NV, just this past year, the coastal system is an entirely new world. In Nevada, Gavin became fascinated with wildlife, taking photographs of birds and reptiles. Now, as part of the TOPAZ/JASPER project, he spends each day on the cliff, eager for a gray whale visitor to finally put his photography skills to the test.
(left) Gavin C. learning how to use a microscope and processing a zooplankton sample. (right) Gavin C. creating a “start fix” to start out cliff team’s observation effort.
Although whales haven’t been observed quite yet, morale remains high both out on the cliff and on the water. Reports of whale sightings prior to the team’s arrival, and the hope of witnessing a gray whale surface alongside while on the kayak, continue to inspire each morning’s 6:30 AM wake up. Through challenging waves and long hours scanning the horizon, this team has found the best way to stay sharp is through riffing off one another and testing each other with some of the best riddles Reddit has to offer. The team has also enjoyed gearing up for the next day by watching the Transformers movies, and carrying that same action-movie intensity onto the water by dramatically narrating our paddles: “In a world where light meets darkness, two men. One kayak. One dream. Twelve stations. Countless zooplankton. Missing whales. Their mission: brave the insurmountable waves and descend into the unforgiving depths to retrieve the samples that could save the planet. This summer…”
(top) Owen and Gavin paddling out to Mill Rocks together.
(bottom-left): Gavin V. introduced the team to a super niche Coos Bay favorite: Vinny’s Smokin’ Burgers!(bottom-right) A few of our team members (Gavin V., Adrian, Owen, and Celest) visiting Natural Bridges to celebrate completing their first 10-day stretch of training.
With their quick comebacks and eagerness to get out on the water, even if actually launching quickly still needs some work, it only seemed fitting to name this year’s crew: Team Quick-with-it.
With plenty of running jokes and action-movie-level determination, Team Quick-With-It is ready to take on the 12th TOPAZ/JASPER field season. Now, we await the whales!
It’s been three years since I last wrote a blog post for the GEMM Lab. At the time, I was wrapping up a wonderful summer filled with science, sun, and new friends and was eager to share all that I had learned and accomplished during my 10 weeks working on the Oregon coast as part of Hatfield Marine Science Center’s Research Experience for Undergraduates (REU). My love and concern for our oceans and its animals has always been the driving force of my academic pursuits. I am so thankful to this REU – funded by the US National Science Foundation – for introducing me to marine science research as a career path.
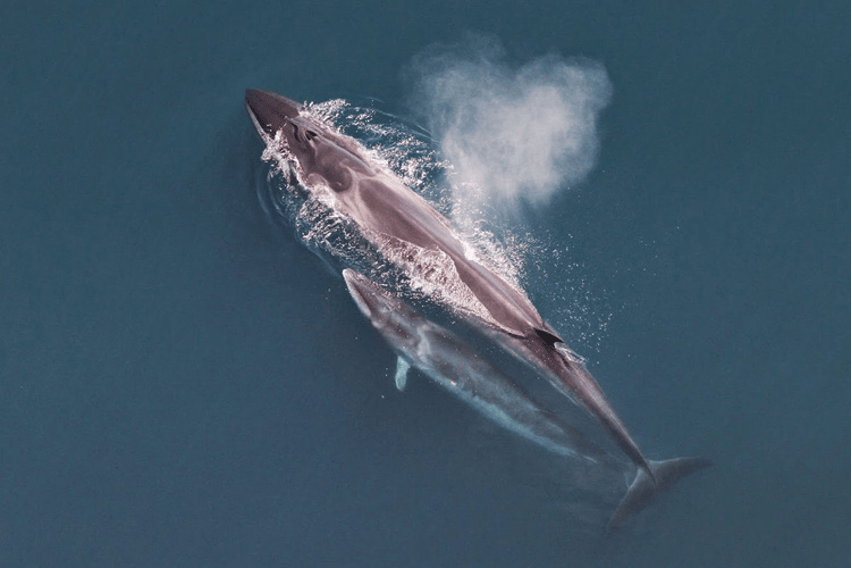
Alongside the mentorship of Drs. Dawn Barlow and Leigh Torres, I investigated the occurrence of sei whales, an endangered species of baleen whale, offshore of Oregon. The sei whale’s global population is believed to have dropped by 80% due to whaling in the 19th and 20th centuries and little is known about their contemporary population status, especially in the Northeast Pacific (Horwood, 2018; Nieukirk et al., 2020). Sei whales have occasionally been observed by the GEMM Lab on research cruises and we were curious about when and how often they were in our neck of the woods. Despite being massive animals (the 3rd largest rorqual in the world!), these animals are challenging to study due to their low population densities and visual similarities to fin whales (Horwood, 2018, Reeves et al., 1998). Luckily, sei whales produce characteristic vocalizations that can help distinguish them from other baleen whales that call at similar frequency bandwidths (e.g. blue, fin, and humpback whales).
Figure 1. Sei whale mom and calf (NOAA fisheries)
This is where bioacoustics – the study of sounds produced by living organisms – comes in. We are able to study this elusive species by deploying hydrophones (underwater microphones) offshore of Oregon and reviewing recorded data in search of sei whale calls. (See this blog post if you’re curious about our methods and findings!).
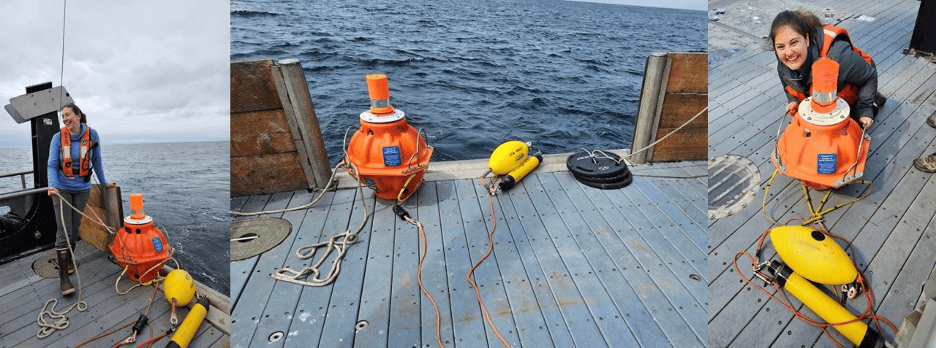
Since 2021, the GEMM Lab and the K. Lisa Yang Center for Conservation Bioacoustics at Cornell University have collaborated to deploy three hydrophones for continuous acoustic recording along the Newport Hydrographic Line as part of the Holistic Assessment of Living marine resources off Oregon (HALO) project. These hydrophones are bottom mounted to the seafloor and are deployed 20, 45, and 65 nautical miles offshore of Newport, OR. HALO cruises are scheduled to refurbish and redeploy these instruments every six months or so. These cruises are also an opportunity to conduct visual surveys of cetaceans and seabirds in between deployments.
Figure 2. Hydrophone deployments on one of our HALO cruises. Dr. Dawn Barlow pictured on the left and Marrissa Garcia pictured on the right.
I immediately fell in love with bioacoustics and was enraptured by the diversity of clicks, pulses, and moans made by marine animals that flood our oceans. Hydrophones are able to record sounds in locations and frequency ranges that we would never naturally get to experience. Baleen whales are especially fascinating because they tend to produce infrasonic calls (i.e., <20 Hz) to communicate over large distances. These calls occur at frequencies below our hearing range and are only audible when sped up. Listening to these recordings feels like a window into a secret world that few have ventured.
Figure 3. Period of high vocal activity from blue whales (A, B, and D calls), fin whales (20 Hz pulses) , and rockfish (pulses). Audio was sped up by 5x.
After completing my undergraduate degree, I participated in a bioacoustics research fellowship hosted by the US Forest Service and Oak Ridge Institute for Science and Education. During this time, I explored the world of terrestrial acoustics by leading a research project on American pika occupancy in the Oregon and Washington Cascades. Forest soundscapes have a different beauty to them. While periods of quiet are rare in the ocean, this is even scarcer on the surface. Bird songs, insect buzzing, human chatter, rainfall, and highway noise constantly fill our soundscapes, sometimes simultaneously. This experience processing terrestrial sound gave me a newfound appreciation for the world around me and the sounds I’ve become so accustomed to hearing. Nevertheless, I found myself yearning for the ocean and its secrets.
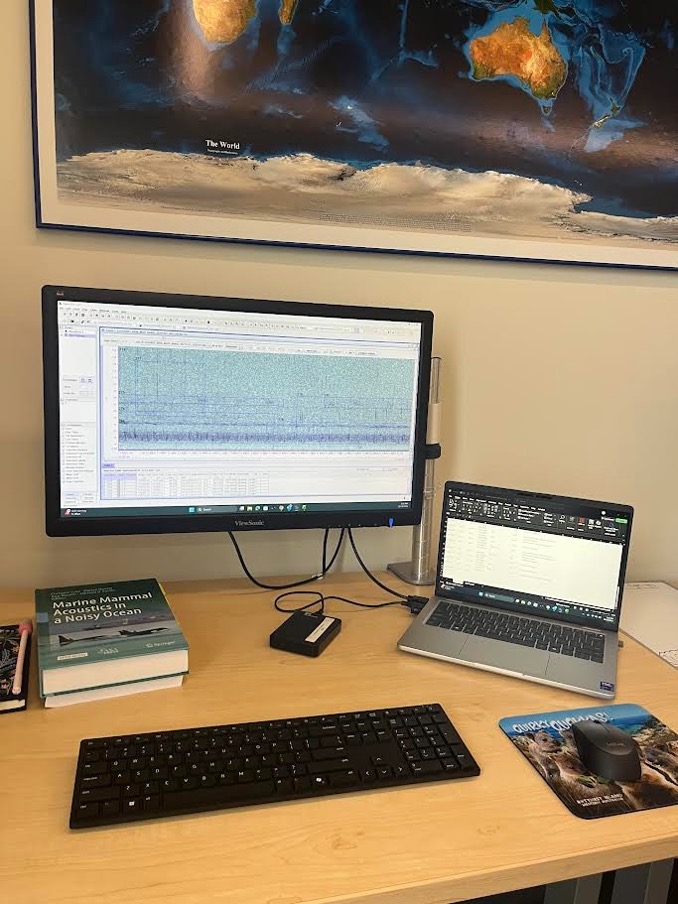
Figure 3. The typical work setup of an acoustic analyst (headphones, extra hard drives, and coffee missing from photo)
I was invited back to the Marine Mammal Institute last fall as the GEMM Lab’s baleen whale acoustic analyst to continue working on the HALO project. I dove back into the data collected from our hydrophones, this time targeting blue, fin, and humpback whale calls in addition to sei whales. My efforts were also broadened to all five years of recording data instead of just one. Because manually reviewing large amounts of acoustic data can be cumbersome, I trained artificial intelligence classifiers using the BirdNET convolutional neural network to make acoustic data processing more efficient. After much iterative trial and error, I was able to develop a set of four classifiers, each specialized to detect one of our four target species. The first classifier was trained to target blue whale A, B, and D calls; the second targets fin whale 20 Hz and 40 Hz pulses; the third targets sei whale downsweeps; and the fourth targets humpback song and single non-song grunts. Once I evaluated that the classifiers were performing with high precision and recall rates, I used them to predict when calls occurred in the five years of recording data. I am currently in the process of validating the hundreds of thousands of predictions to generate detection histories of these species of baleen whales in this region. This information will be incorporated with various oceanographic datasets to get a better understanding of baleen whale distribution patterns and habitat preferences in the Northeast Pacific.
I will be wrapping up my contract with the Marine Mammal Institute next month and I am endlessly grateful to the GEMM Lab for shaping me into the marine mammalogist I am today. I will look back on my time here fondly as I begin this next chapter of my life as a PhD student at the University of Washington’s School of Oceanography this fall. I am excited to share that I will continue to use acoustics to study baleen whales in the Northeast Pacific during my PhD! Although I dread the thought of having to say goodbye to Oregon and the Hatfield community, I thankfully won’t have to say goodbye to the whales.
Works cited
Horwood, J. (2018). Sei Whale – Balaenoptera borealis. Encyclopedia of Marine Mammals
Natalie Chazal, PhD Candidate, OSU Department of Fisheries, Wildlife, and Conservation Sciences, GEMM Lab
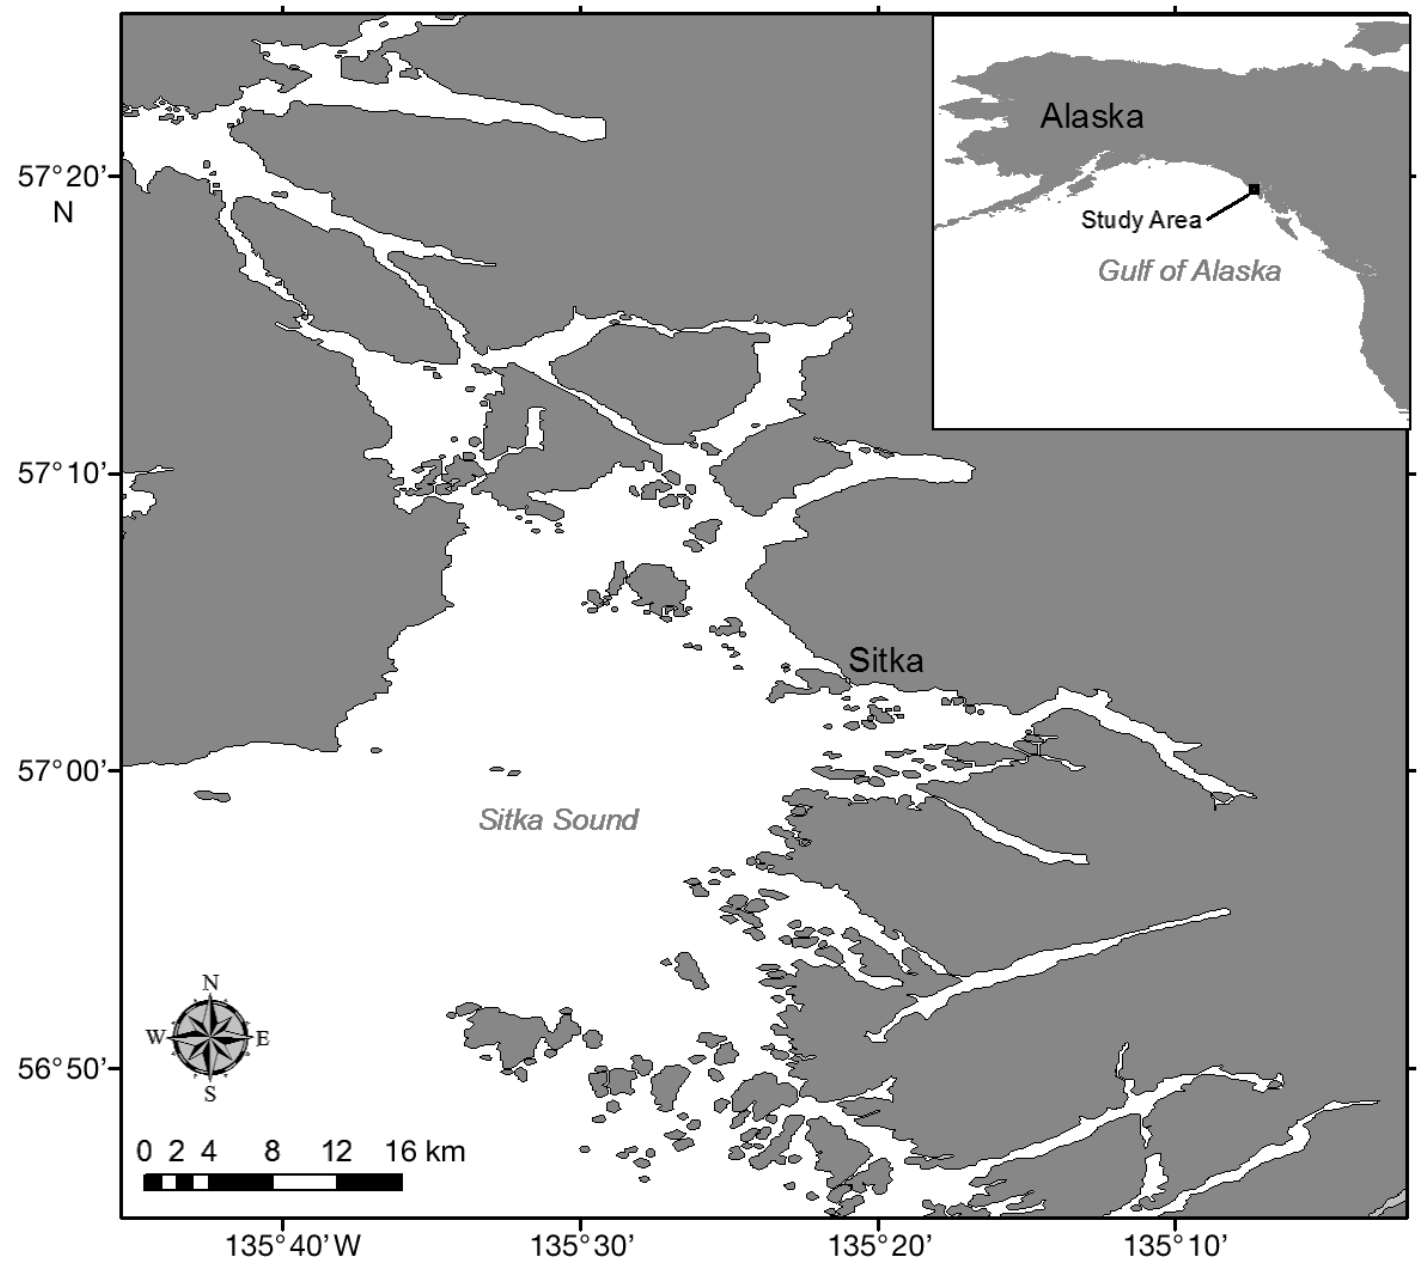
Sitka (Tlingit: Sheet’ká), Alaska is a wonderful town, tucked along the western coast of Baranof Island in Southeast Alaska. With one side of the sound framed by cascading mountains and the other by Mount Edgecumbe volcano, this place has a striking beauty with a very distinctive ecology.
Figure 1. Map of Sitka Sound from Starr et al. 2011.
One of the many islands within the sound is Japonski Island, home to the University of Alaska Southeast (UAS) Sitka Campus Whale Lab, led by Dr. Lauren Wild and Dr. Ellen Chenoweth. The Whale Lab, previously led by Professor emeritus Jan Straley, has been monitoring whales for over 40 years. Through a myriad of data collection methods including photographic-identification (photo-ID), tissue samples, acoustic recordings, and accelerometry tags, the lab investigates whale diets, genetics, population dynamics, human-cetacean interaction, movement, and foraging ecology. With such rich datasets and, more importantly, deep ties to the community, the Whale Lab has long been a leader in understanding the whales of Sitka Sound.
Since around 2019, the Whale Lab has noted a marked increase in gray whales coming into the sound to take advantage of the pulsed resource of the spring herring spawn (from fewer than 20 individuals prior to 2019, to more than 150 individuals since 2019). Gray whales have been opportunistically monitored by the Whale Lab since the 1990s. To get a better understanding of the dynamic use of Sitka sound by these whales, the Whale Lab initiated a dedicated research program. Through collaboration with the Whale Lab, we in the GEMM Lab hope to learn more about the Sitka gray whales and the health and ecology of gray whales along the Oregon coast through comparative studies. But first, let’s get acquainted with the herring spawn!
The Herring Spawn
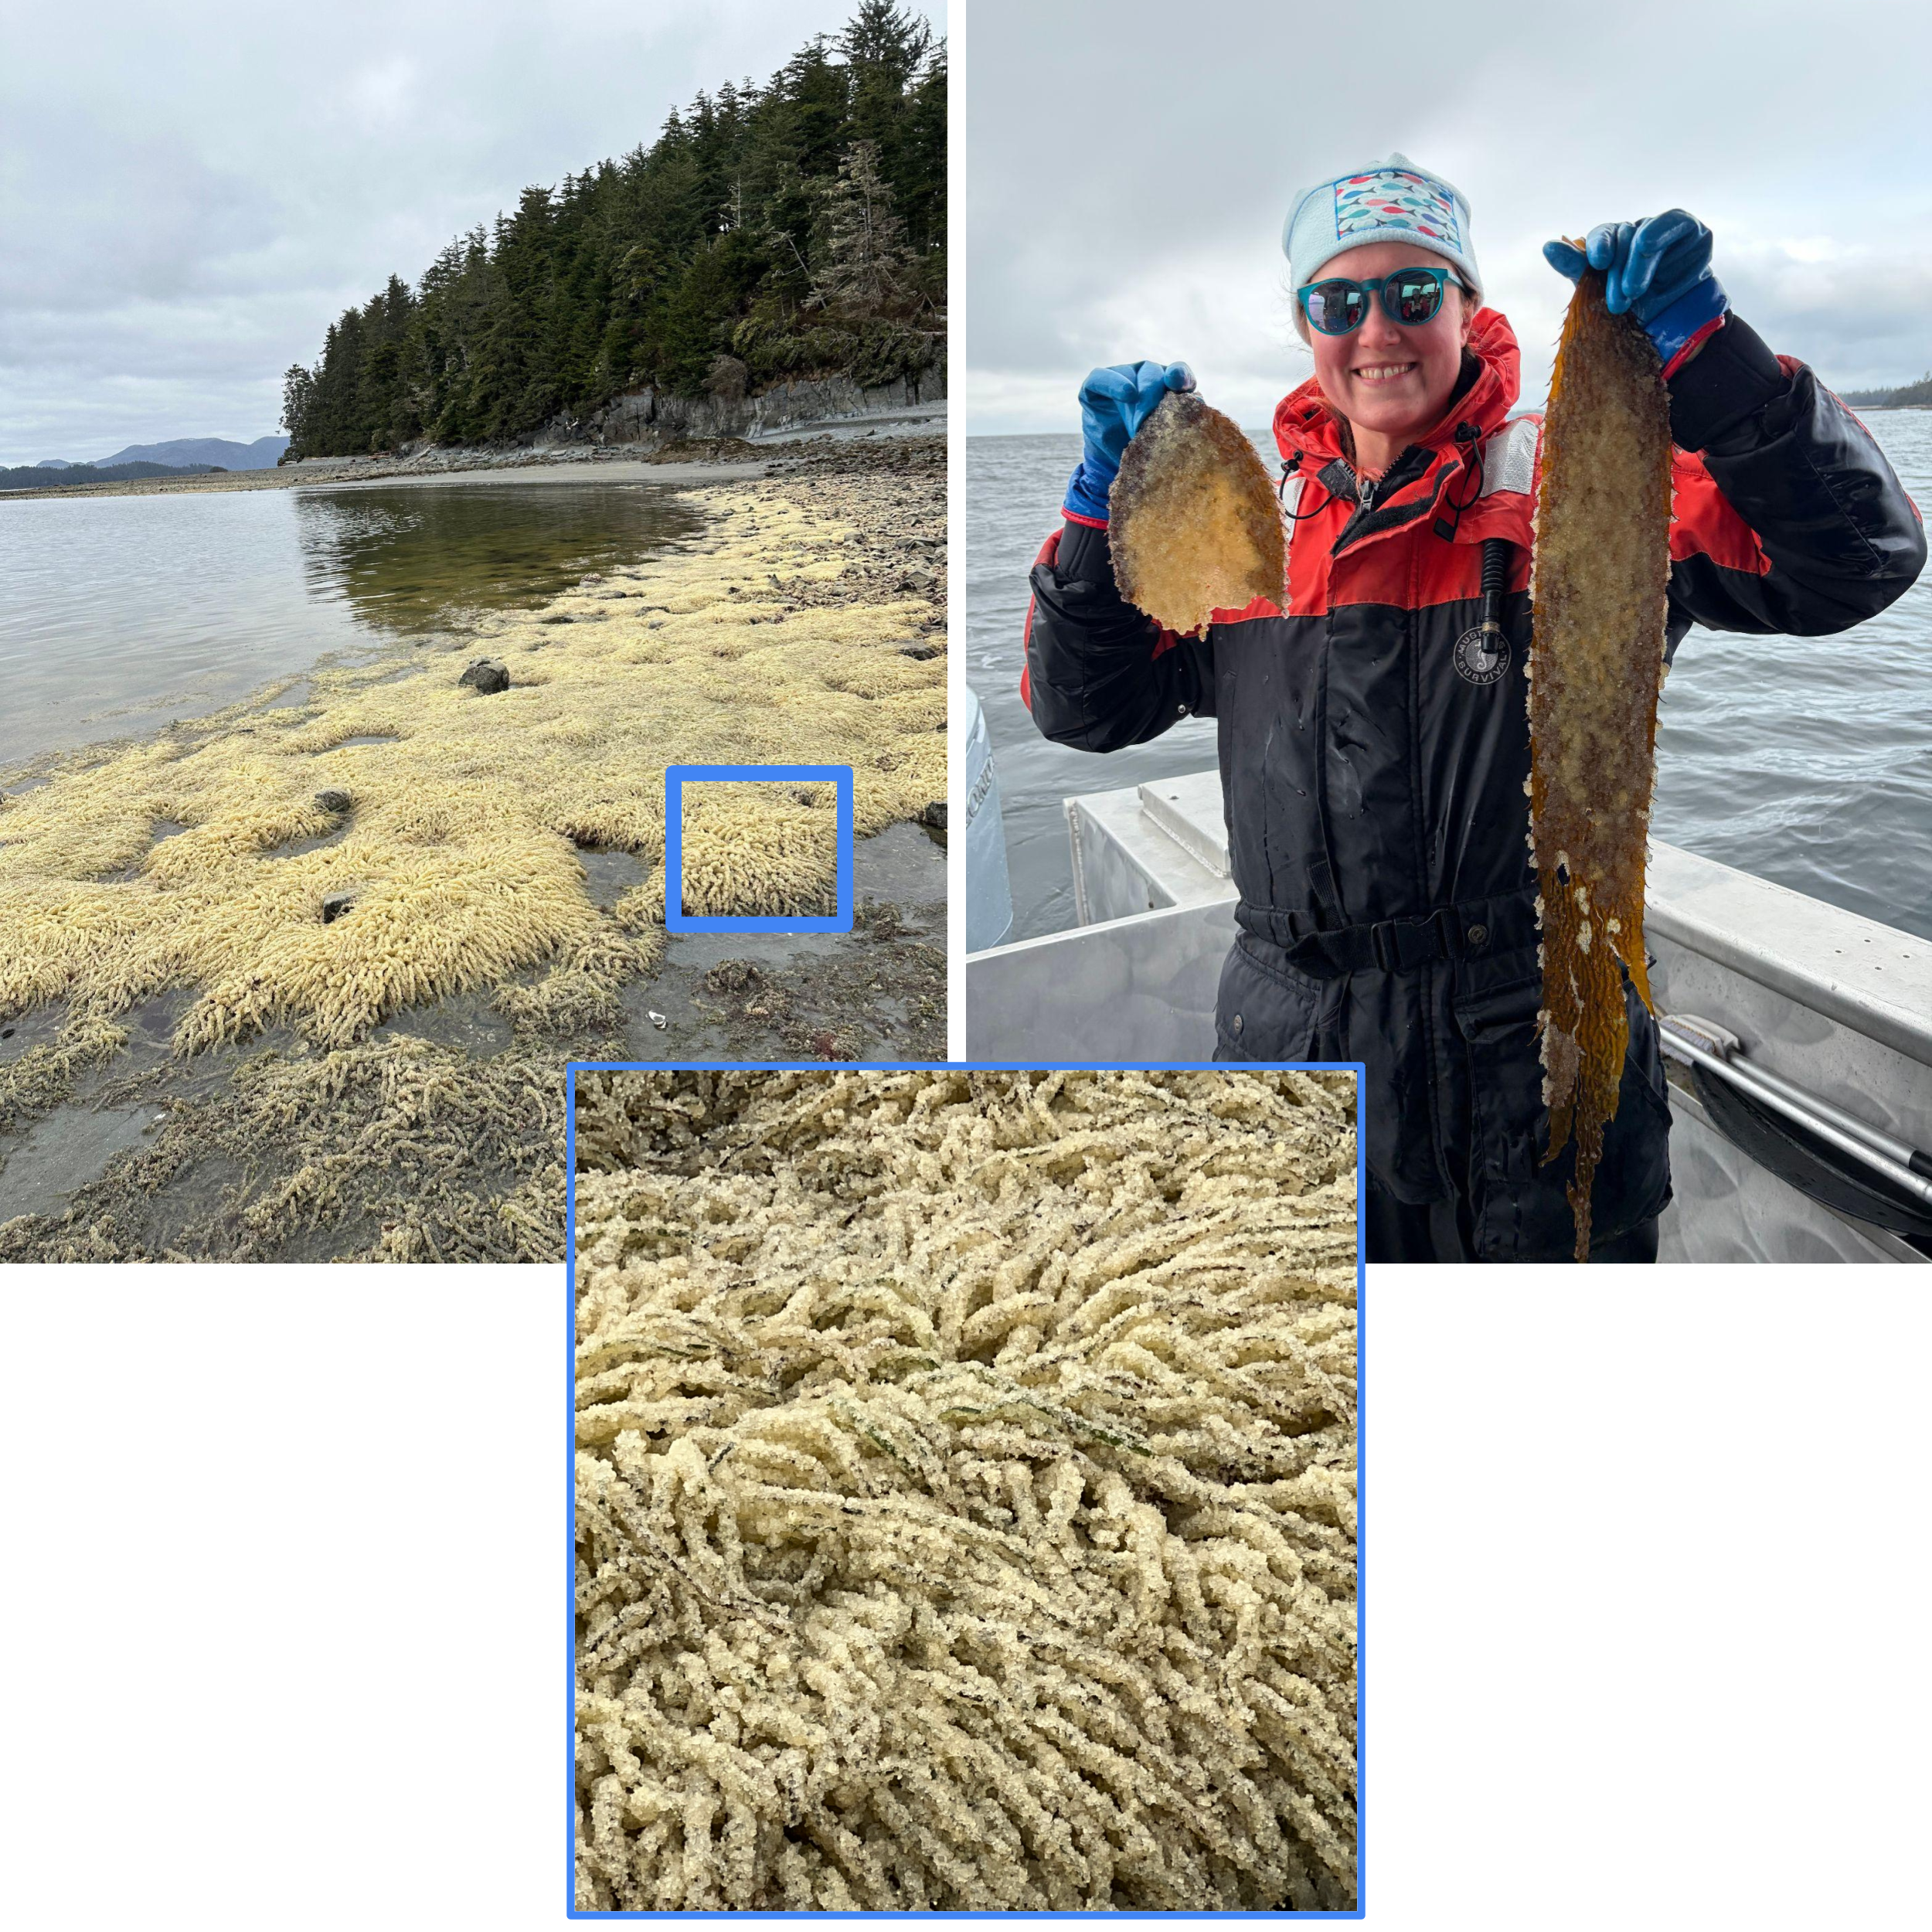
Pacific herring (Tlingit: Yaaw) are small schooling forage fish that spend most of their lives offshore, moving inshore each spring to spawn (NOAA Fisheries). However, Sitka Sound is unique because some herring overwinter locally in deeper trenches on both the southeast and western sides of the sound, helping to sustain a productive ecosystem year-round. As they approach the spawning season, the herring stay deeper in the canyons, waiting for sea surface temperatures to reach a threshold suitable for spawning (Harley et al. 2024). Once conditions are right, they move farther up in the water column and further into Sitka Sound. This draws in predators like humpback whales that forage on the adult herring using behaviors like bubble-net feeding.
Humpbacks aren’t the only ones targeting the adult herring. In Southeast Alaska, herring are harvested by humans in the spring for their roe using purse seines. Fishery openings are timed based on abundance, distribution, size, population structure, and past trends. The goal of the Sitka sac roe fishery is to sustainably harvest adults with the highest quality roe, meaning that specific fishing areas will open when pre-spawning fish are abundant and areas will close or be reduced when spawning begins (Dupuis et al. 2026). Sitka supports a robust herring fishery and is one of the last remaining sac roe fisheries in the state of Alaska (ADFG Herring Timeline).
Herring are broadcast spawners and synchronize the timing of the eggs (roe) release and the sperm (milt). The release of milt is what causes the water to turn that characteristic light turquoise color. Spawning occurs continuously for roughly two weeks, though timing varies by year. The eggs are incredibly adhesive, sticking to each other, kelp, seagrass, rocks, and even settling onto mats over the benthos.
Figure 2. (Left) Eelgrass beds at low tide with herring eggs, (Center) closer image showing more detail of herring eggs attached to eelgrass and (Right) Willa Johnson holding kelp blades with attached herring eggs | Photo Credit: Willa Johnson (left, center) & Dr. Lauren Wild (right)
The huge quantity of eggs settles to the bottom and form mats that provide a rich nutrient source for many organisms. Another important harvest occurs at this point in the spawn: the cultural, traditional, and subsistence harvest of the eggs. Tlingit people have harvested herring eggs as an important food source and cultural resource for over 10,000 years. One of the Tlinigt clans, Kiks.ádi, is even named for them, with the women of the clan being called the herring ladies. The Tlingit and Haida method of gathering herring eggs involves placing hemlock boughs in the water, allowing herring to spawn on the branches, which are then collected (Thornton 2019; Theriault Boots 2026). Any eggs or branches not needed are returned to the ocean to contribute back to the ecosystem, so no food is wasted.
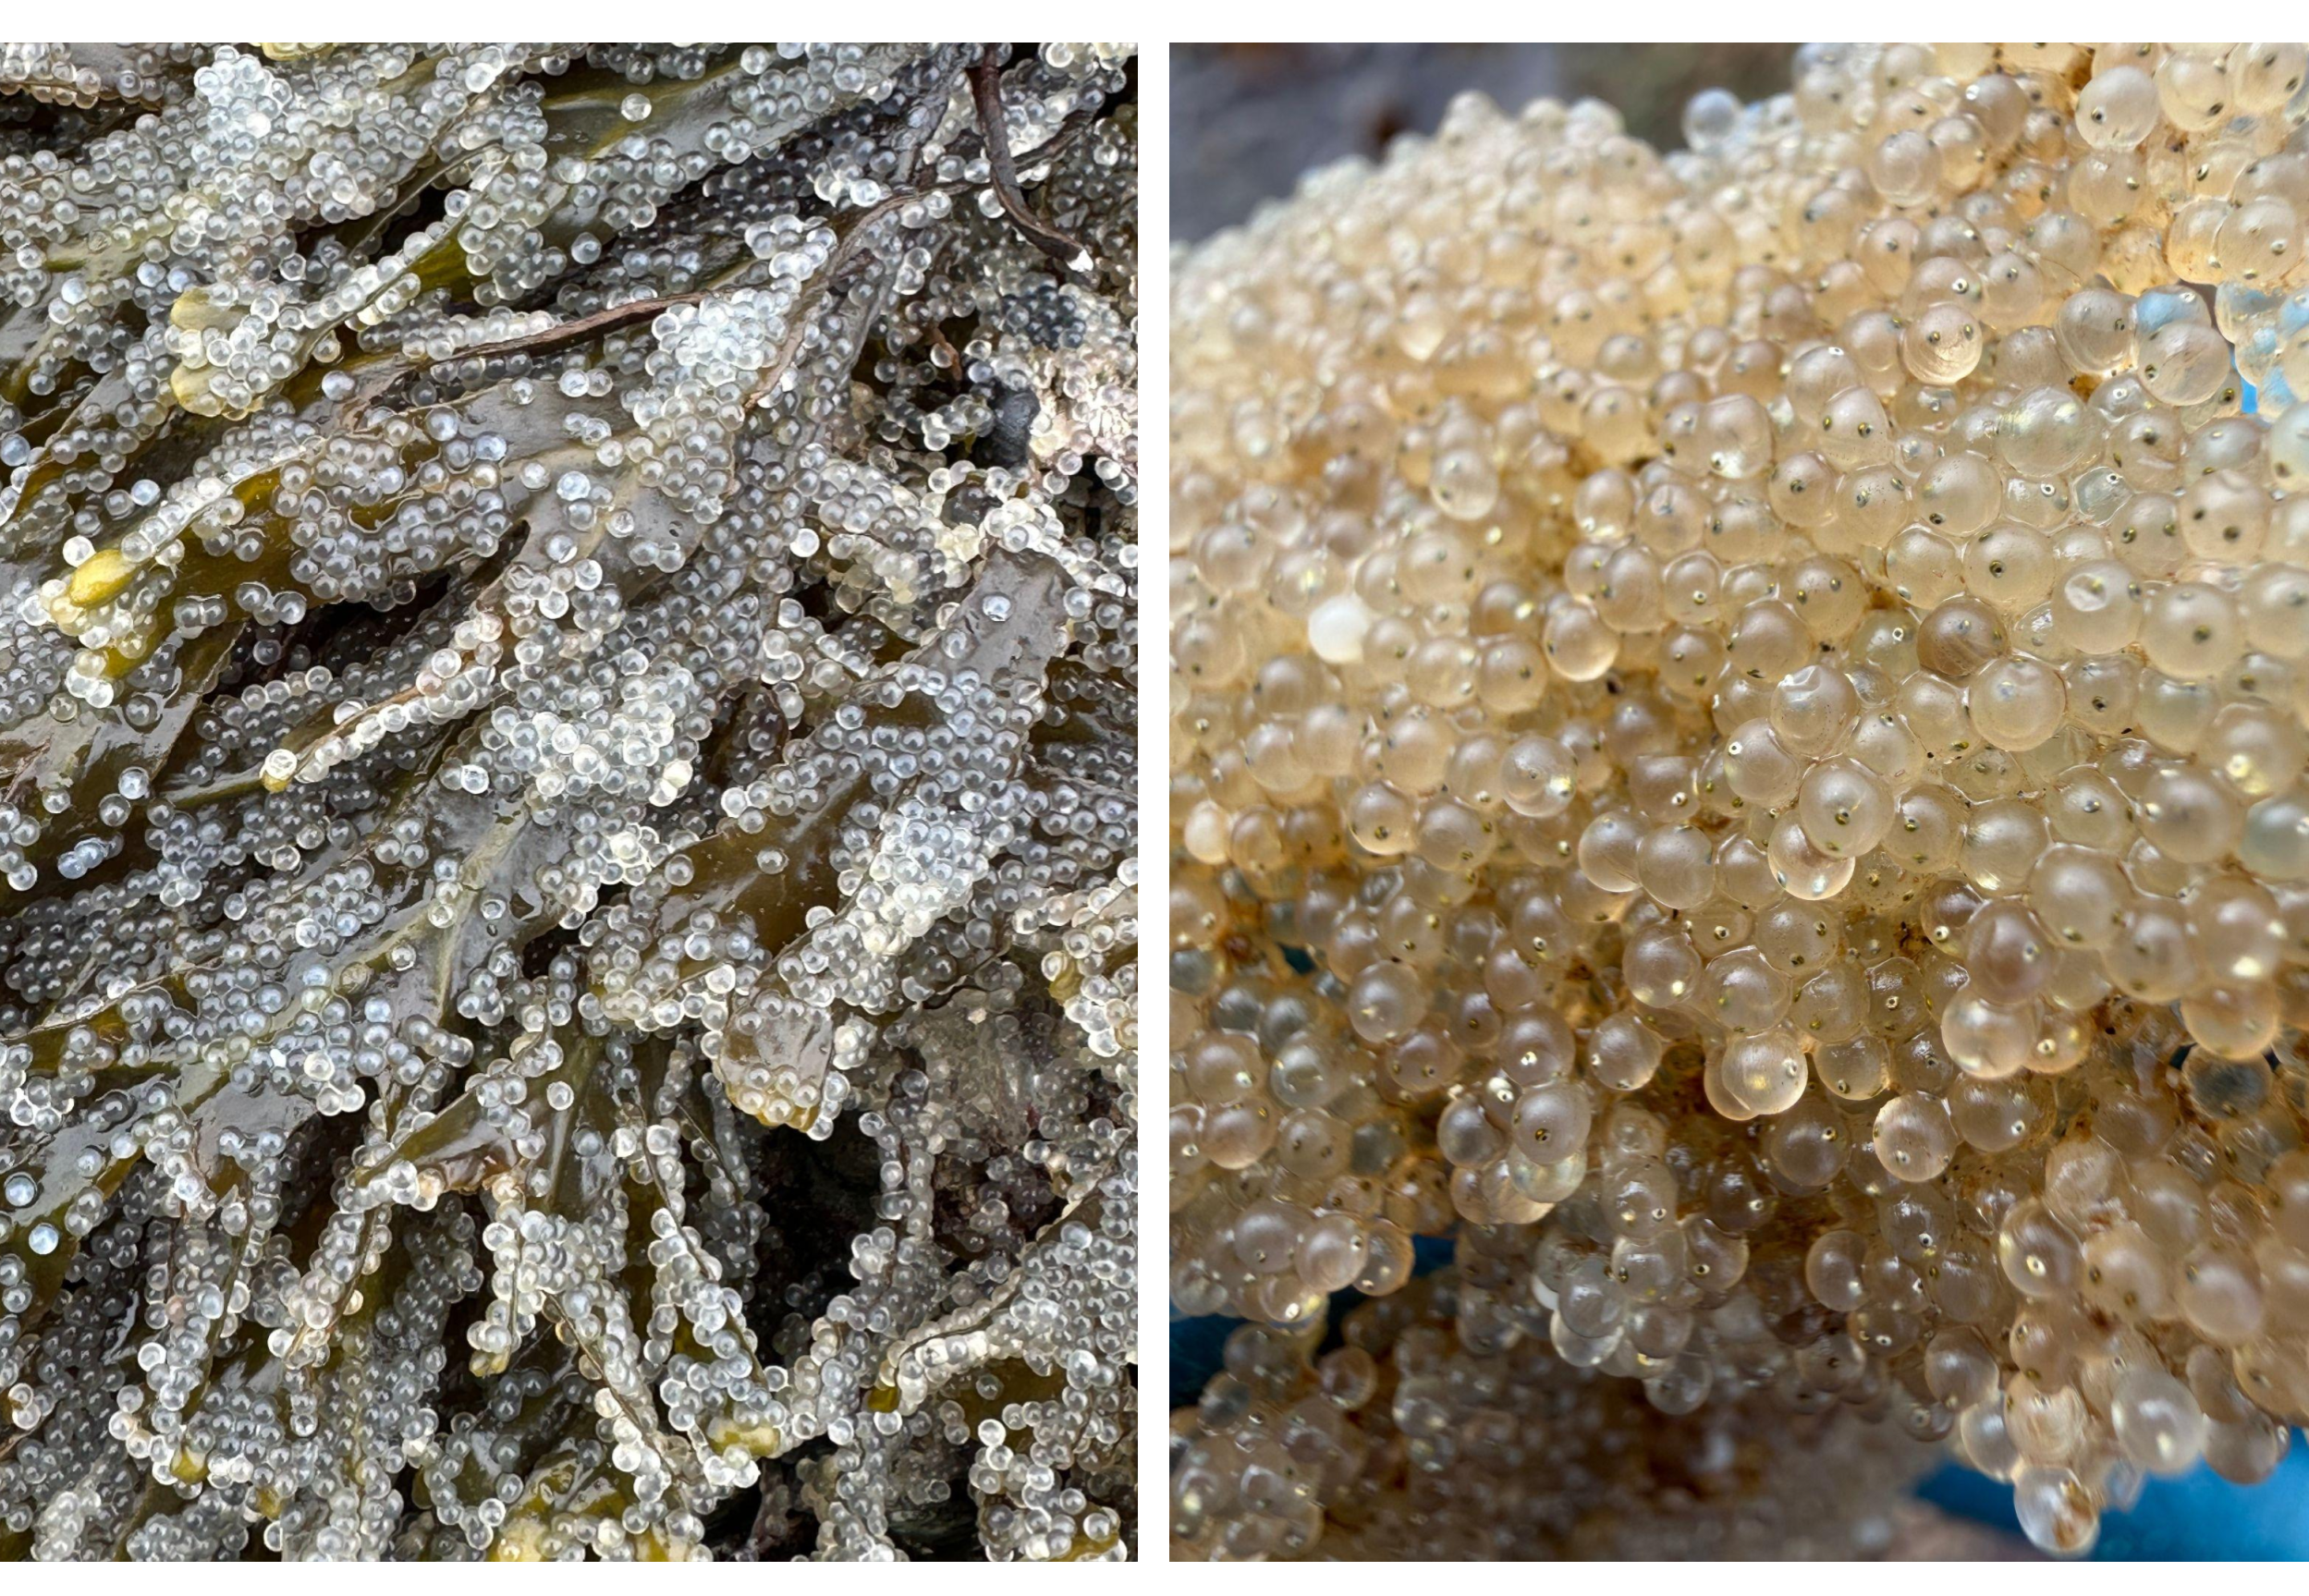
A single fertilized herring egg takes about two weeks to develop and hatch. After hatching, the herring larvae remain in the nearshore waters for a couple of weeks to months, though ocean conditions may advect some out of the sound. Due to the sheer size of the broadcast spawning event, there are inevitably eggs that go unfertilized or don’t survive to hatching. As a result, multiple developmental stages (hatched larvae, live developing eggs, and dead eggs) can coexist in the same area. These stages may differ in their distribution, caloric value, and availability, creating a complex and dynamic resource landscape for predators.
Figure 3. (Left) undeveloped herring eggs attached to Fucus distichus and (Right) herring eggs that have developed eyes or “eyed out” | Photo Credit: Willa Johnson (left) & Dr. Lauren Wild (right)
Bringing in the Whales
Now that we have a sense of the significance and timing of the herring spawn in Sitka Sound, let’s bring in the gray whales! Unlike humpback whales, which target adult herring, gray whales are sticking around for the herring spawn itself. Over the past seven years, the Whale Lab has noted an increased presence of gray whales within the sound. One of their hypotheses for this increase is that a spatial shift of the herring spawn closer to the mouth of the sound has allowed northbound migrating gray whales to detect and track this resource. Another draw may be a lack of predictability and reliability in other food sources for gray whales in their more traditional feeding grounds.
This unique ecological system is the source of endless questions: How many herring eggs are the gray whales consuming? Do whales that forage on this herring spawn gain an energetic advantage at the beginning of the foraging season? Where do these whales go after leaving Sitka Sound? Do PCFG whales incorporate this foraging opportunity into their broader foraging strategies? What impact is this increased feeding aggregation having on the herring biomass in Sitka Sound? Is this new prey resource supporting gray whale population resilience to declining prey availability in the Arctic? These questions span from local to basin-wide scales, and from individual gray whale to population levels. Collaborations between the Whale Lab and the GEMM Lab allow us to address different facets of these questions more effectively, with broader impacts for local communities, gray whale populations, and the broader scientific community.
Having a Field Day!
How are we beginning to answer these questions? Dr. Wild and Dr. Chenoweth lead field seasons to capture gray whale data using photo-ID, biopsies, Go-Pro imagery, and herring roe sampling, and net-tows. I was fortunate enough to join for a week of the Whale Lab’s field season and expand their efforts by incorporating drone imagery! With drone data, we can quantify body condition and capture fine-scale behavioral patterns, particularly the tactics whales use to forage on herring roe.
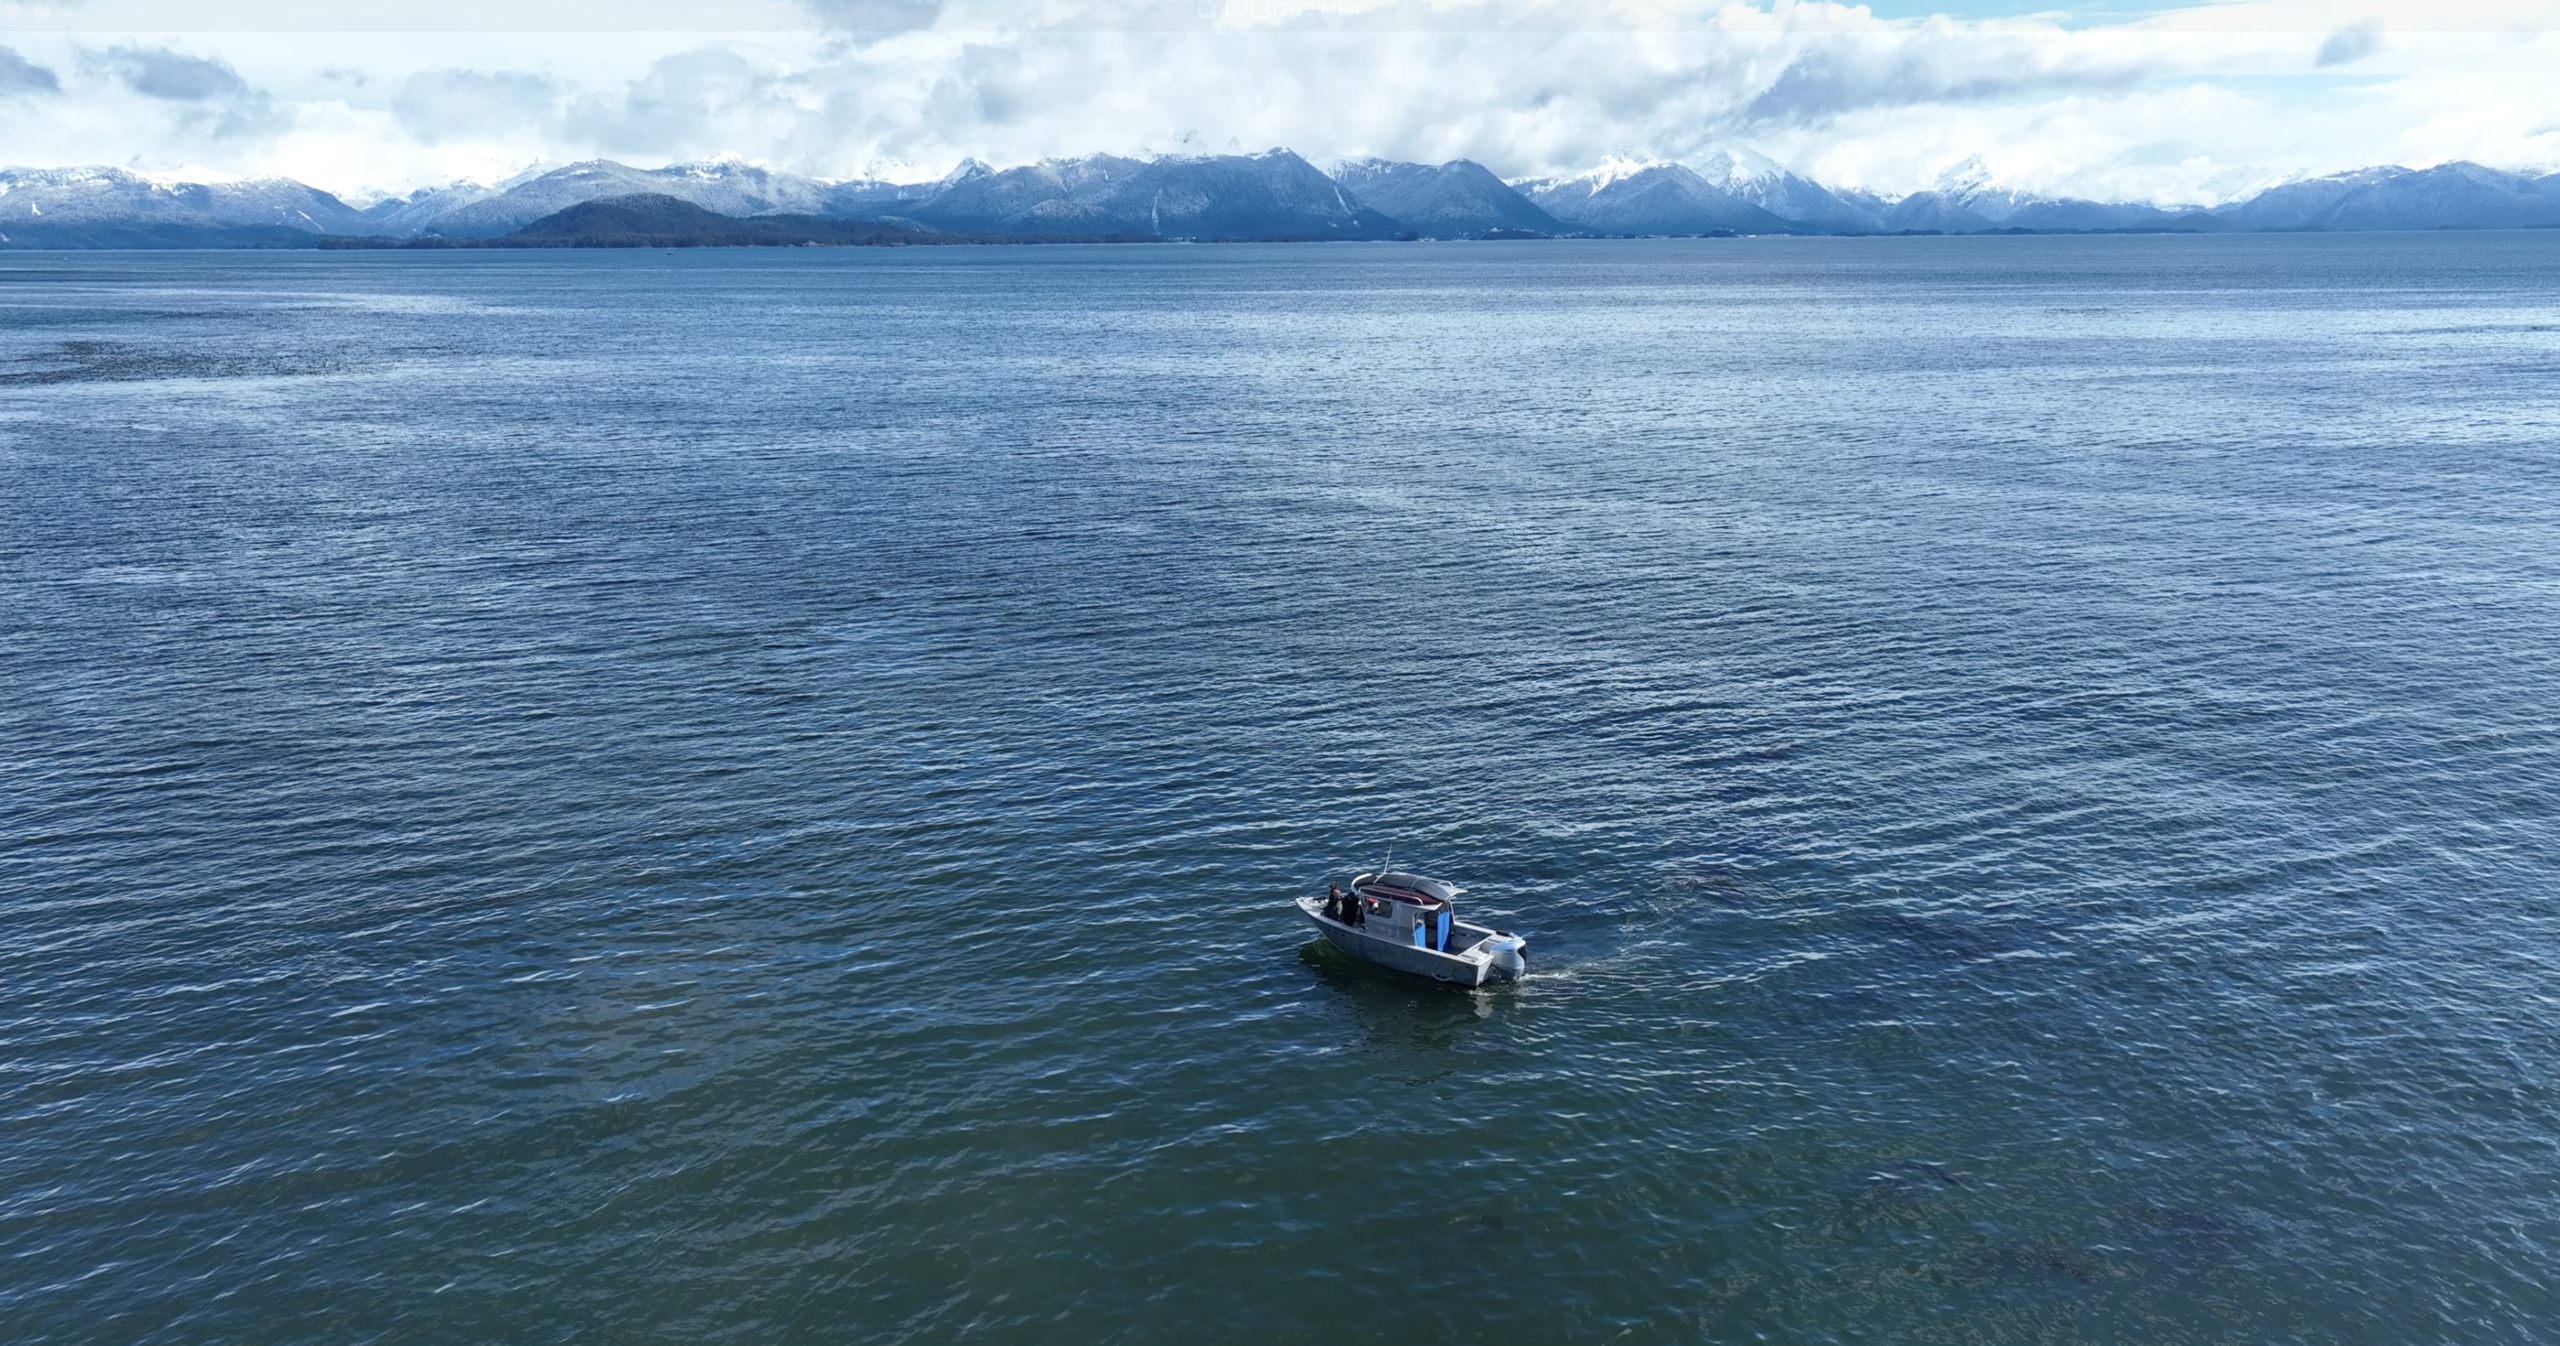
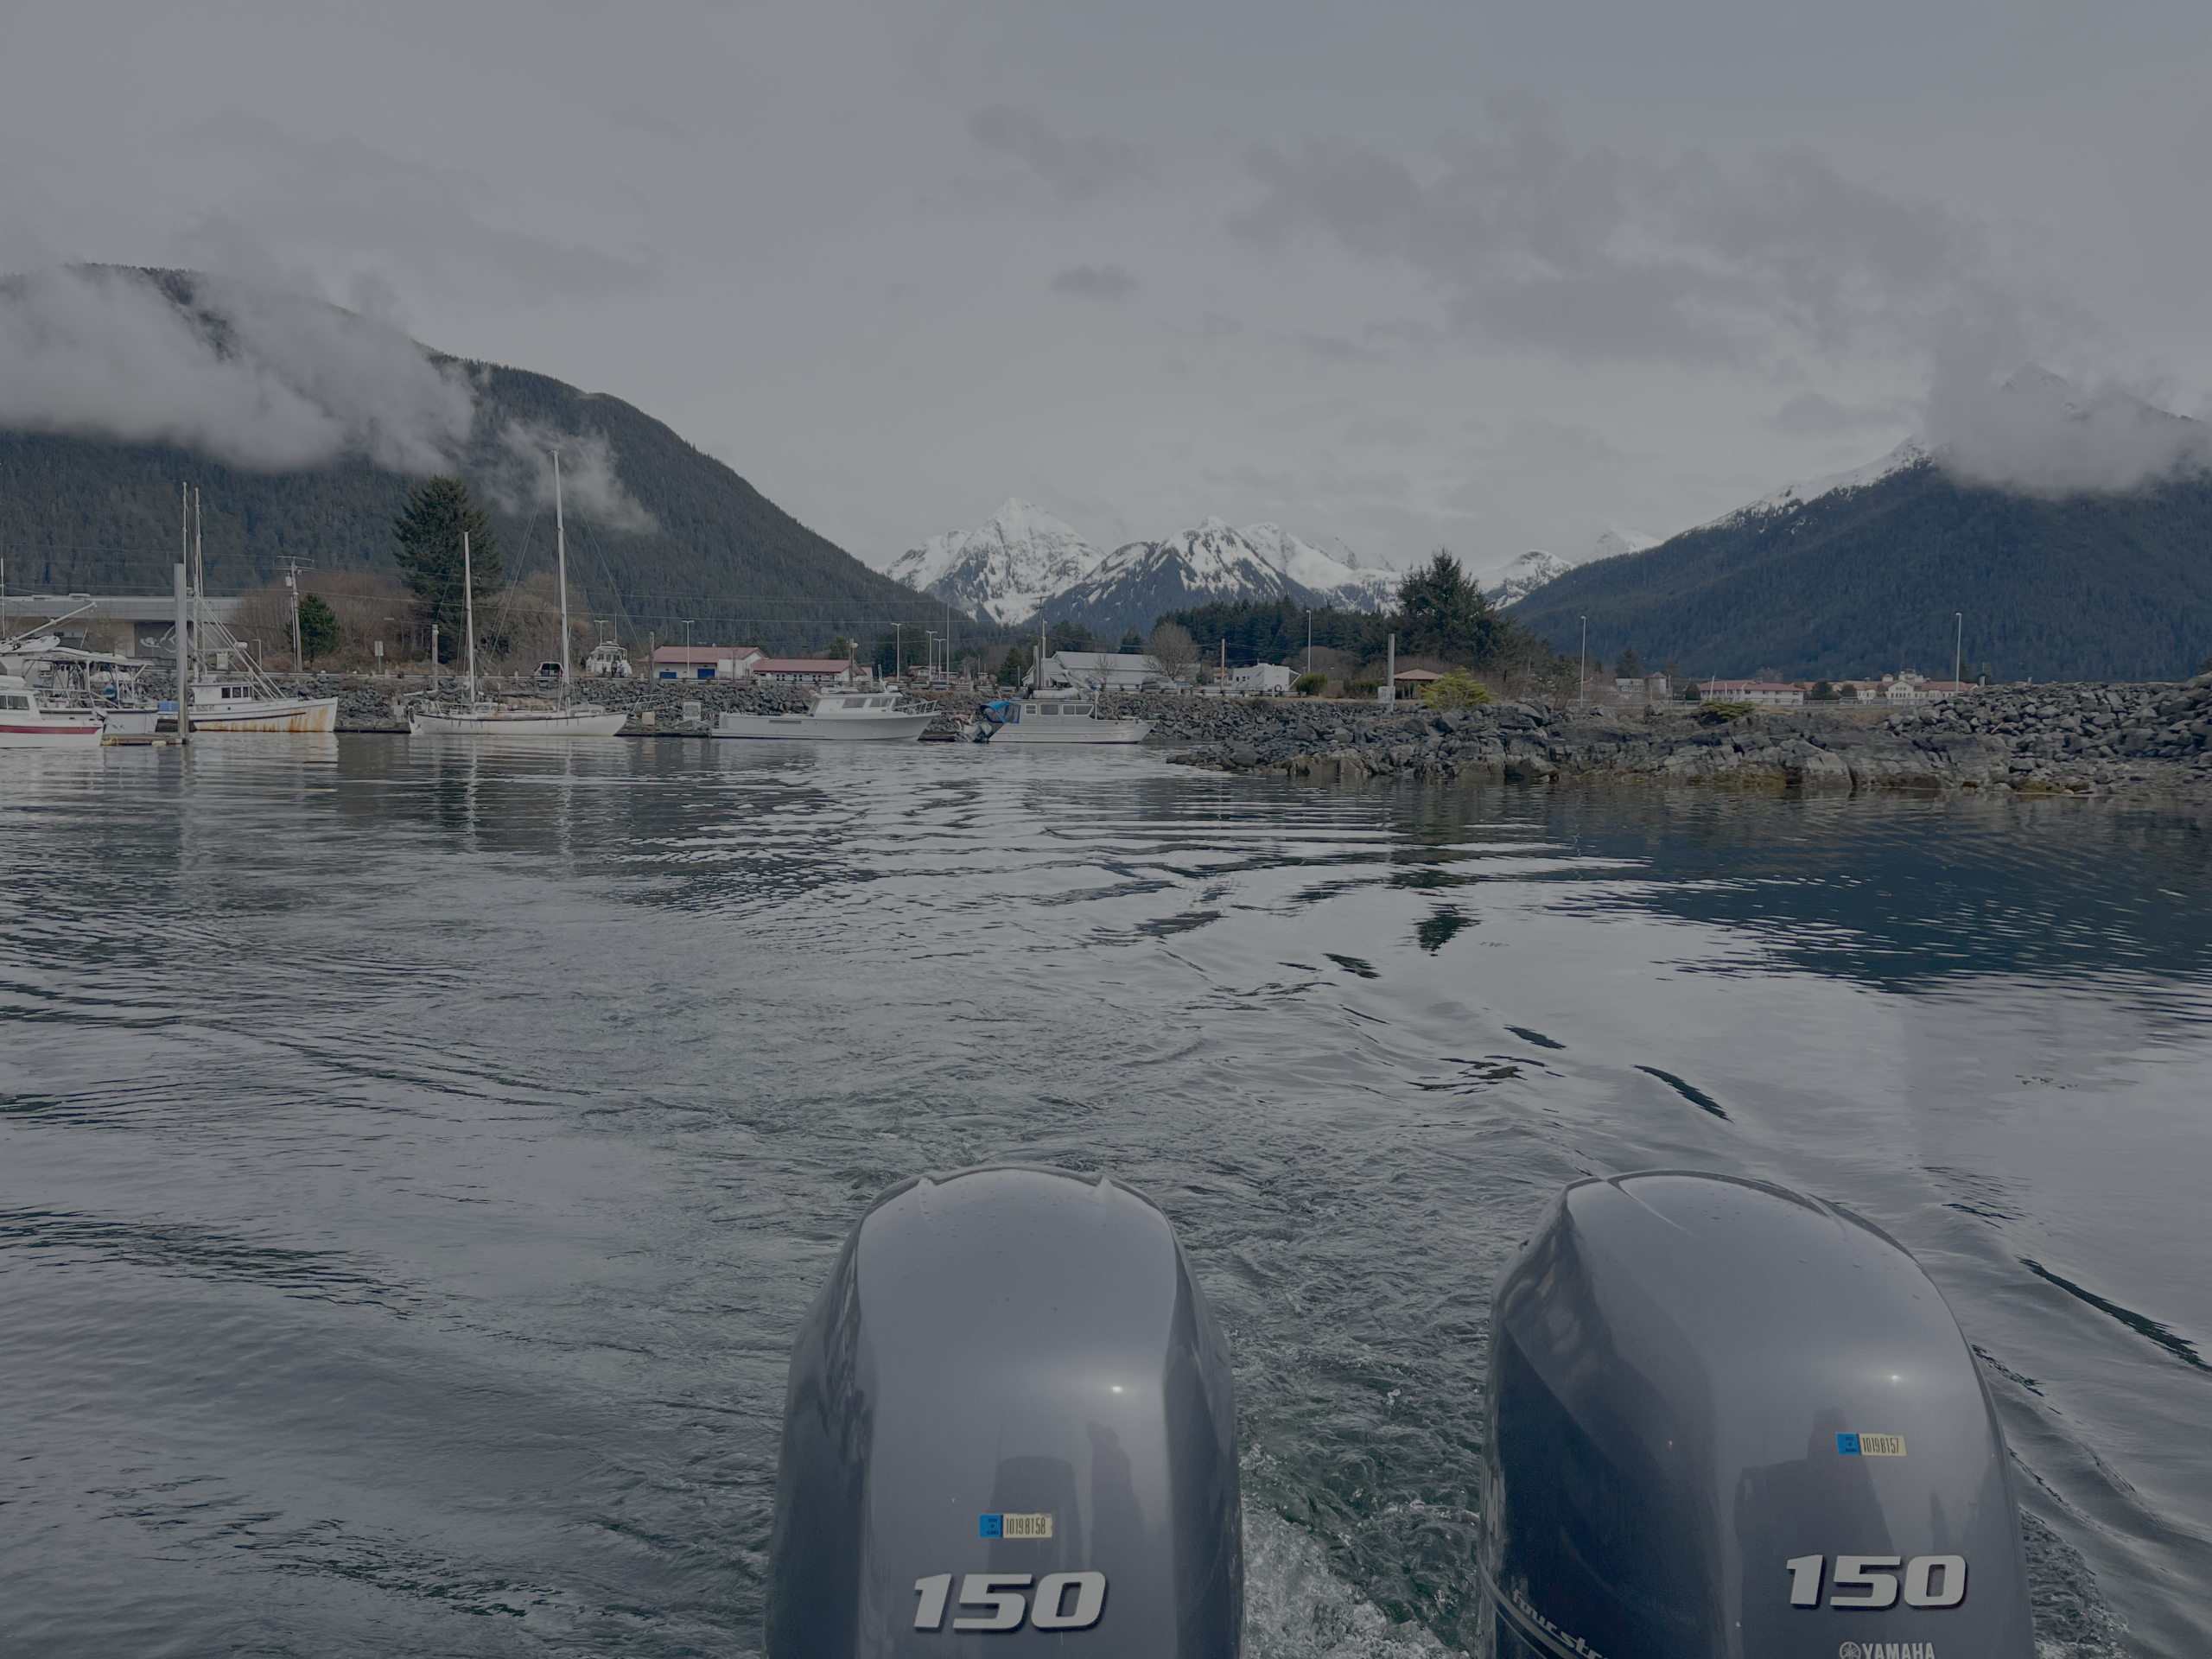
The morning after I arrived, we were on the water by 9:00, heading across the sound to Fred’s Creek. I met Dr. Wild’s incredible field team including Stacey Golden – a teacher in Sitka, Kaleigh Shroeder – a fish hatchery technician, Willa Johnson – a student at the University of Alaska Fairbanks (who I would meet the next day), and Dr. Wild herself. Having flown into Sitka in the dark, I was struck with the scenery surrounding us on our trip out.
Figure 4. Dr. Wild’s research vessel facing east towards the mountains.
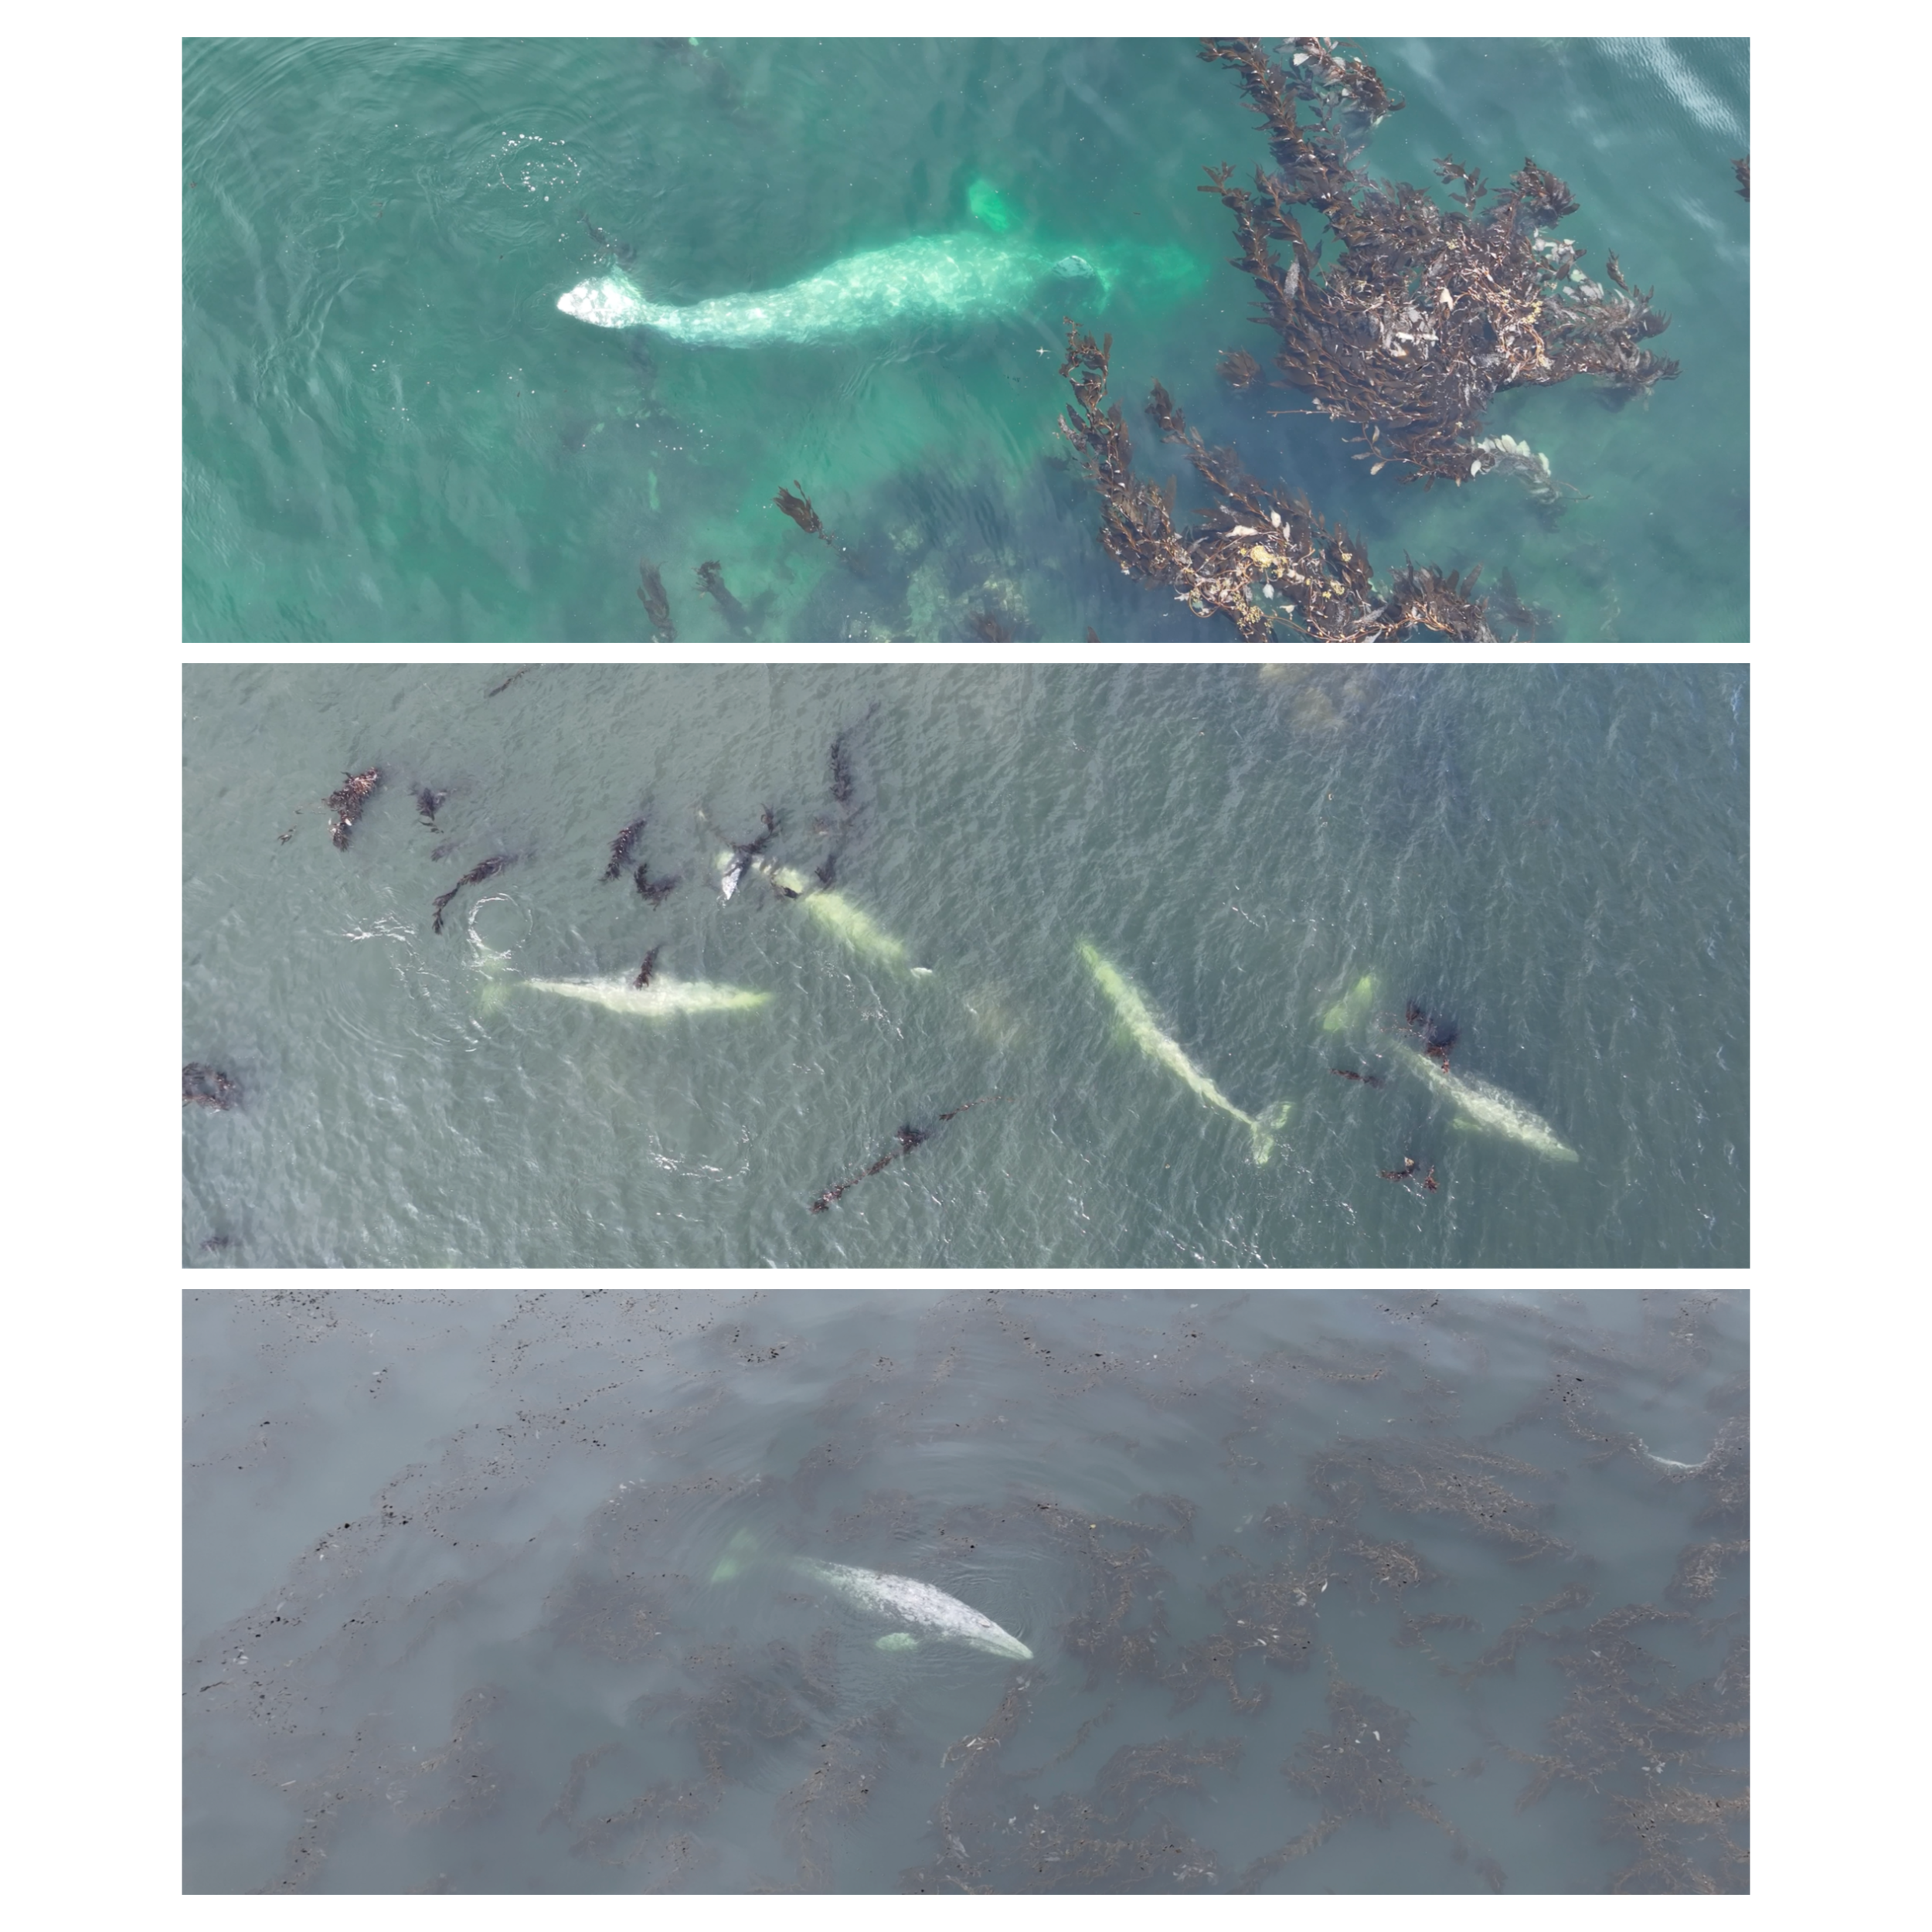
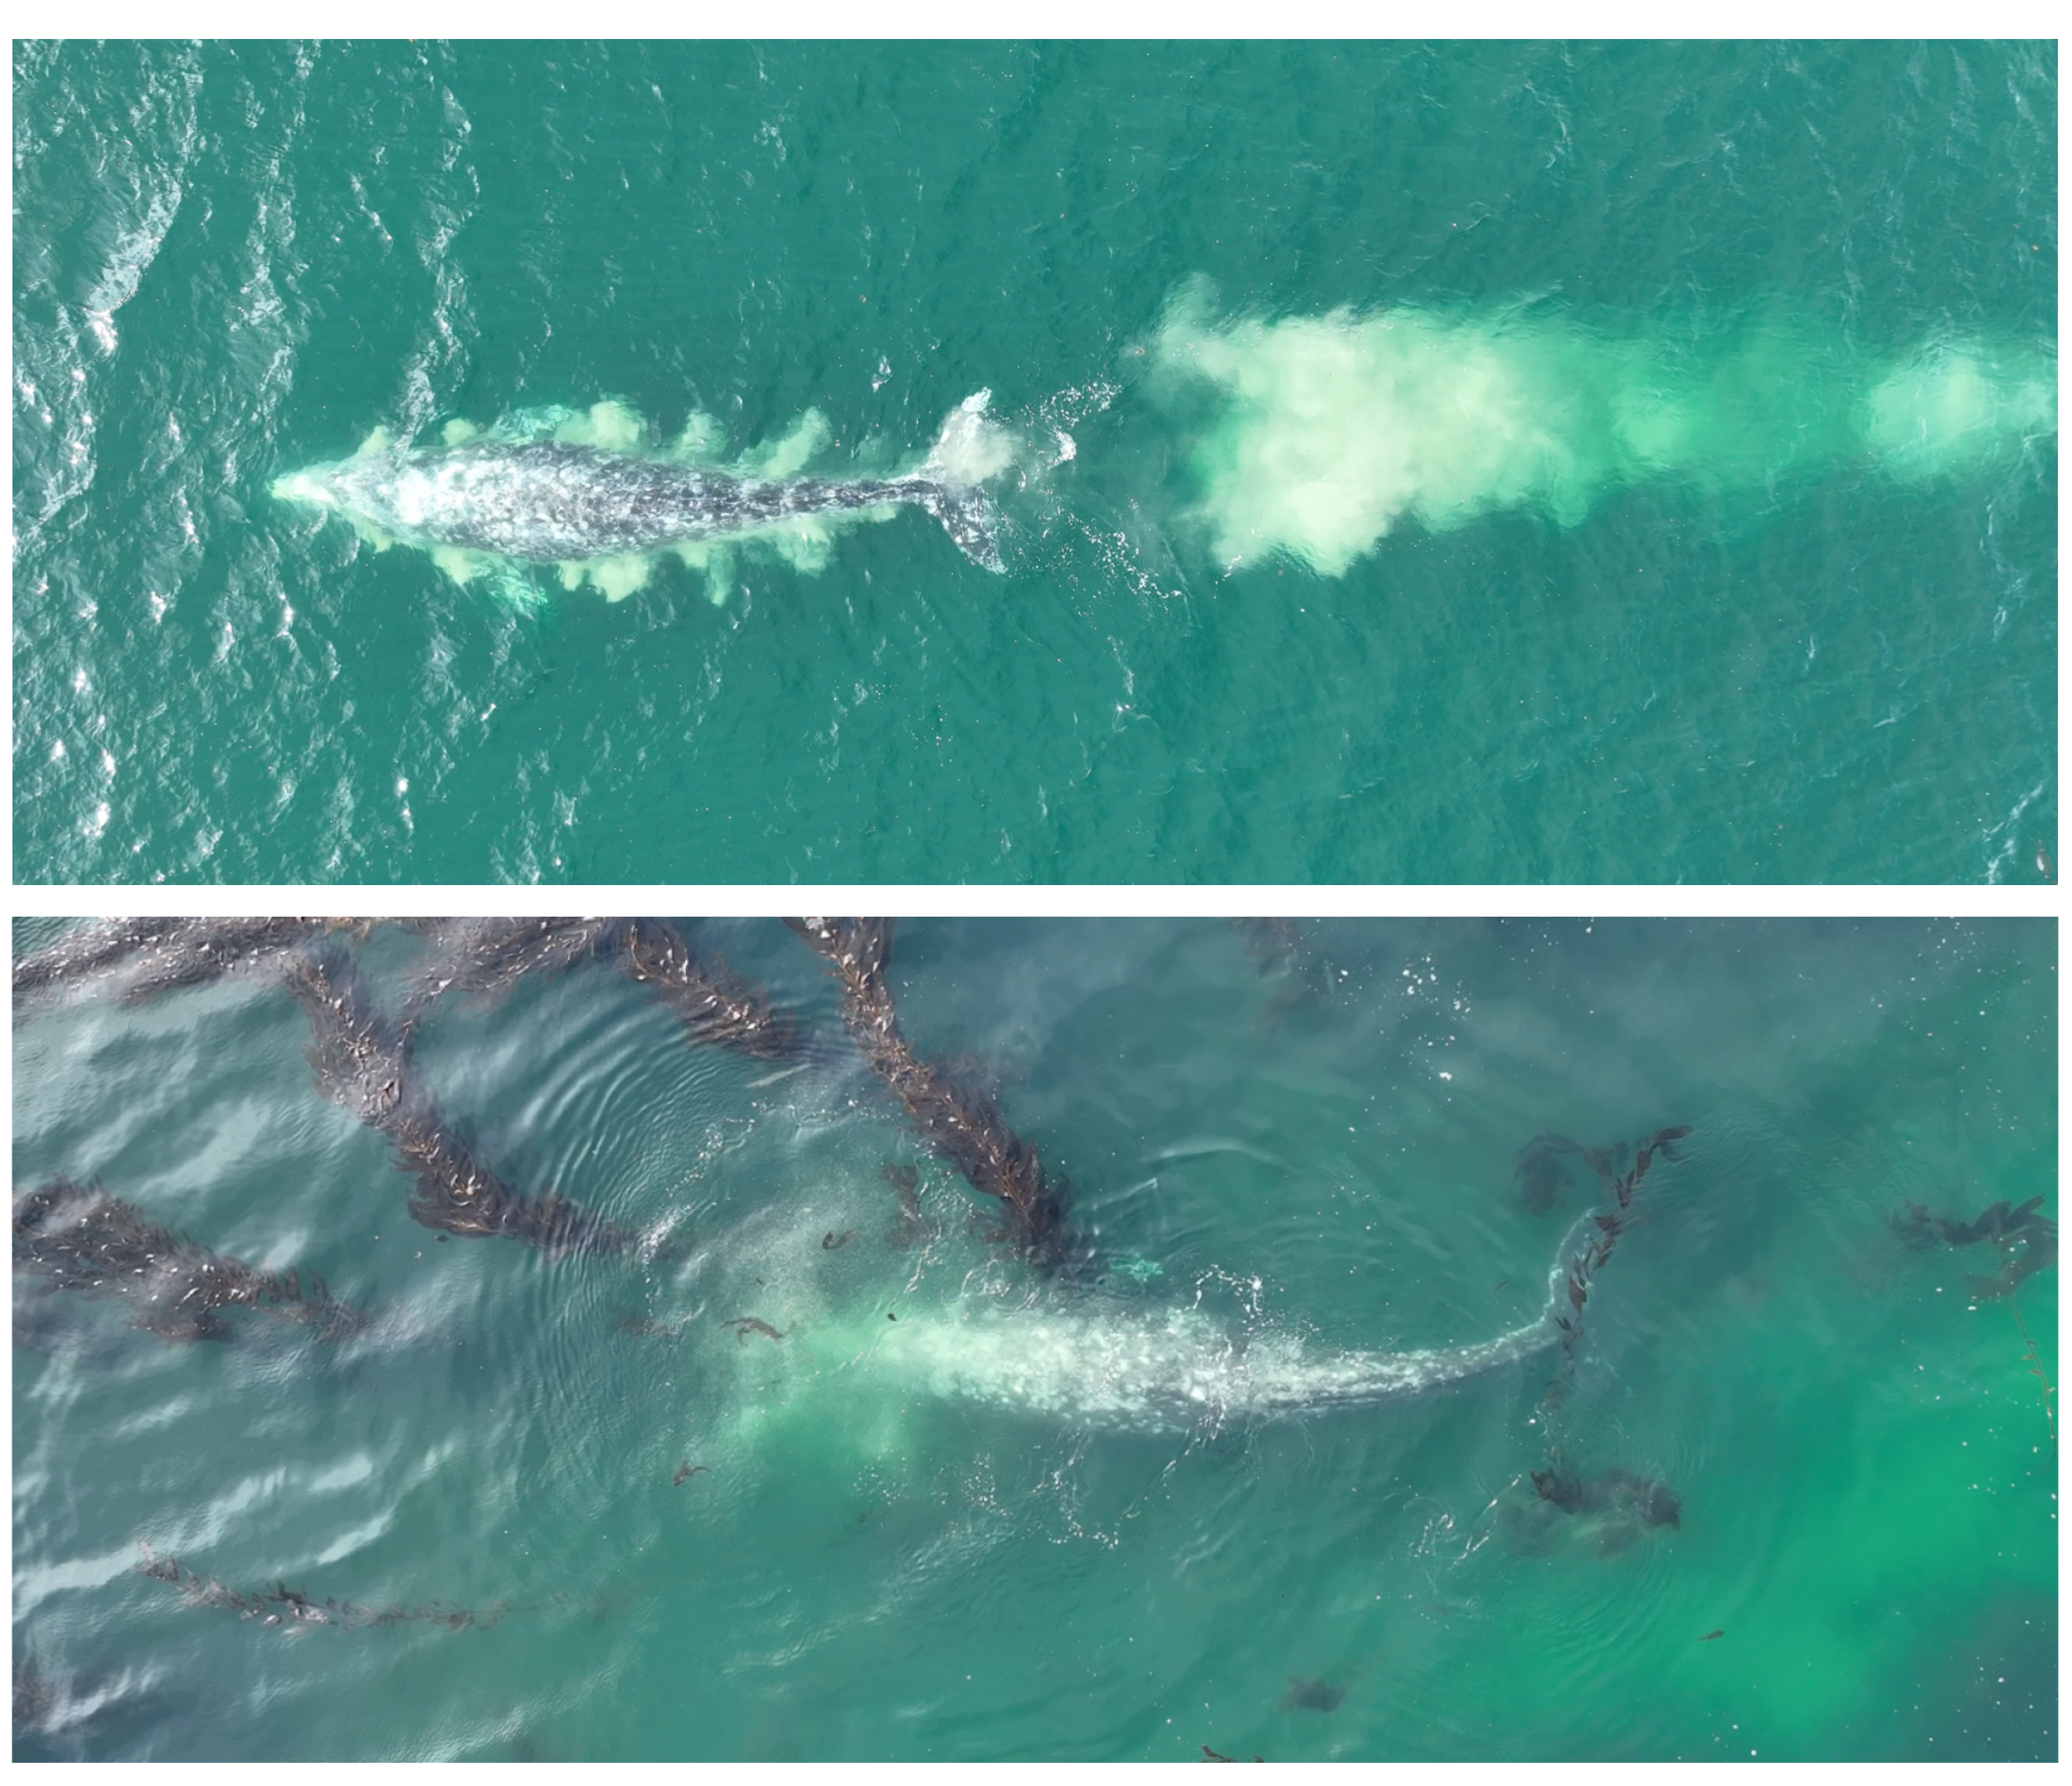
And it wasn’t just the mountains that were striking. As we approached the shoreline along the base of Mount Edgecumbe, I couldn’t believe my eyes when I started counting the number of blows that I was seeing. In just three hours with the Whale Lab on the first day, the best estimate of the number of whales was 28… this was whale soup! Once we reached a group of whales near the shore, we got to work. Stacey captured photo-ID pictures of each whale, Kaleigh recorded meticulous data and prepared for biopsy opportunities, I launched the drone, and Dr. Wild expertly maneuvered the boat among the whales and kelp beds. From a birds-eye view, I was able to see these groups of whales headstanding, aggregating in dense foraging groups, and even logging at the surface.Figure 4. Dr. Wild’s research vessel facing east towards the mountains.
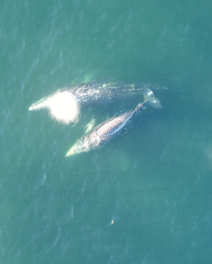
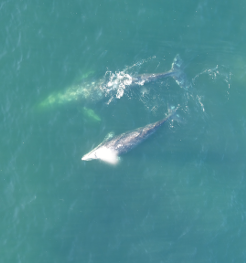
Figure 5. (Top) whale exhibiting a headstand next to a kelp bed with attached herring eggs, (Middle) 4 whales foraging and traveling close together, and (Bottom) a whale logging amidst a kelp bed.
The aerial view also revealed the environmental context of these behaviors. Patches of herring roe were clearly visible, clinging to kelp in the water. It wasn’t until later that afternoon, when the fieldwork adrenaline settled and I started reviewing the drone footage, that I began to fully appreciate the complexity of what we had observed.
On the second day, I was able to capture one of the fascinating behaviors Dr. Wild had described: gray whales actively scraping herring eggs off kelp. While a majority of the gray whales were headstanding and foraging on the roe associated with the benthos, there were other whales pushing through kelp beds, tearing at the blades to access the eggs attached. This behavior may have broader implications, particularly for kelp-associated communities and the zooplankton species that rely on kelp as refugia later in the season – one of the many fascinating open questions about this elaborate system. That second day was also our largest survey effort of that week, with a best estimate of 154 gray whales observed along our transect!
Figure 6. (Top) Gray whale filtering sediment after foraging in the benthos and (Bottom) gray whale stripping kelp to acquire attached herring spawn.
After returning to shore, I attended a Sitka Natural History Seminar by Matt Goff, a local naturalist who has dedicated himself to documenting and learning about Sitkan ecology. His talk, “Getting to Know our Neighbors”, highlighted a few of the over 3,000 species that he has documented on iNaturalist within the Sitka region. He also maintains a blog that documents his observations and a radio show where he hosts conversations with community members and scientists, including an October 4th, 2024 show where he interviews Dr. Wild about the gray whales.
The following day would end up being the last opportunity to fly the drone. By then, the coordination of the drone operations into the Whale Lab’s fieldwork had become seamless – calling out notes and timestamps, aligning observations, and integrating multiple data streams real time. Although the rain grounded the drone on the last day, we were still able to get out on the sound and collect photo-ID data and tissue samples with Dr. Chenoweth as well as Scott Simmons – a UAS dive instructor. As we drove back into the harbor I was trying to savor every second of being on the water in this incredible place, with these incredible people.
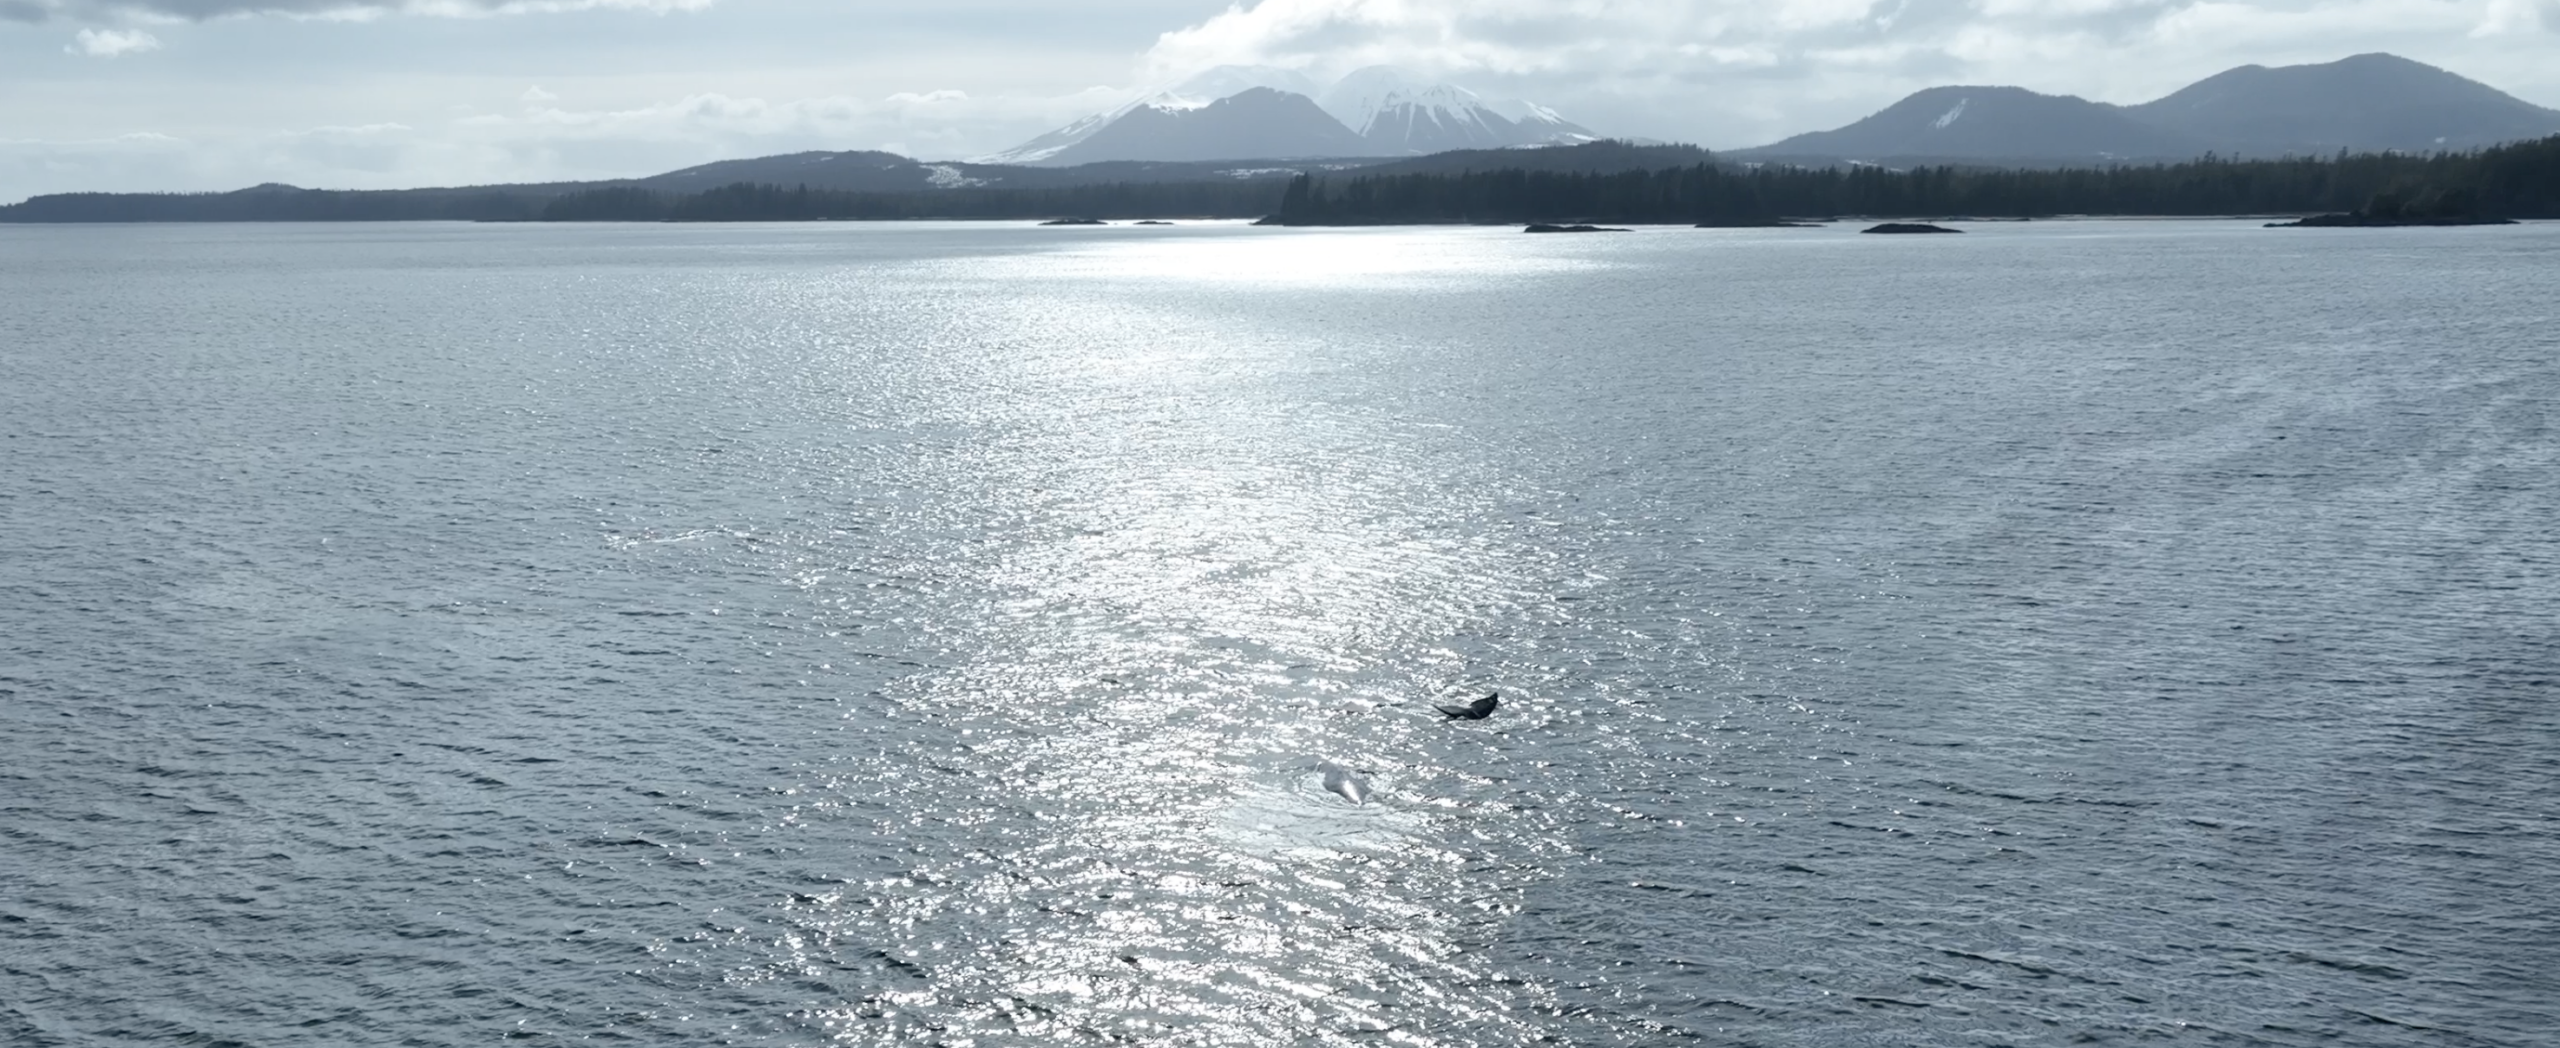
Figure 7. Coming into harbor with the Three Sisters mountains in the background.
Having come into an established, long-term gray whale study in Newport, Oregon (GRANITE), and then being able to experience another established, long-term gray whale study in Sitka, Alaska (Whale Lab) is a rare privilege. I am so grateful to Dr. Wild and Dr. Chenoweth for welcoming me into their homes, labs, and community. Experiencing these different ecosystems and being a part of a collaboration between two major gray whale research programs is deeply inspiring, especially at such an exciting time in gray whale research.
What the Future Holds
Looking ahead, the strength of this collaboration lies not just in the questions we are asking now, but in how adaptable this system is to the rapidly changing conditions gray whales are experiencing. As gray whales continue to navigate population-level fluctuations, understanding how localized foraging opportunities like the Sitka herring spawn fit into broader energetic and health dynamics is becoming increasingly important. Moreover, understanding the effects of the increasing number of gray whales in regions that they haven’t previously used intensively is critical for addressing questions about localized ecological impacts and community interactions. By pairing the Whale Lab’s fine-scale, system-specific work on bioenergetics and consumption with the GEMM Lab’s broader, range-wide perspective on gray whale health and ecology, we can begin to piece together how these whales are responding to shifting ecosystems. These insights are only possible through sustained monitoring and strong, reciprocal collaborations, not just between research groups, but with the communities who live alongside and are deeply connected to these whales. As generalist foragers operating across diverse and dynamic habitats, gray whales challenge us to think across scales, disciplines, and perspectives, making this continued collaborative effort more important than ever.
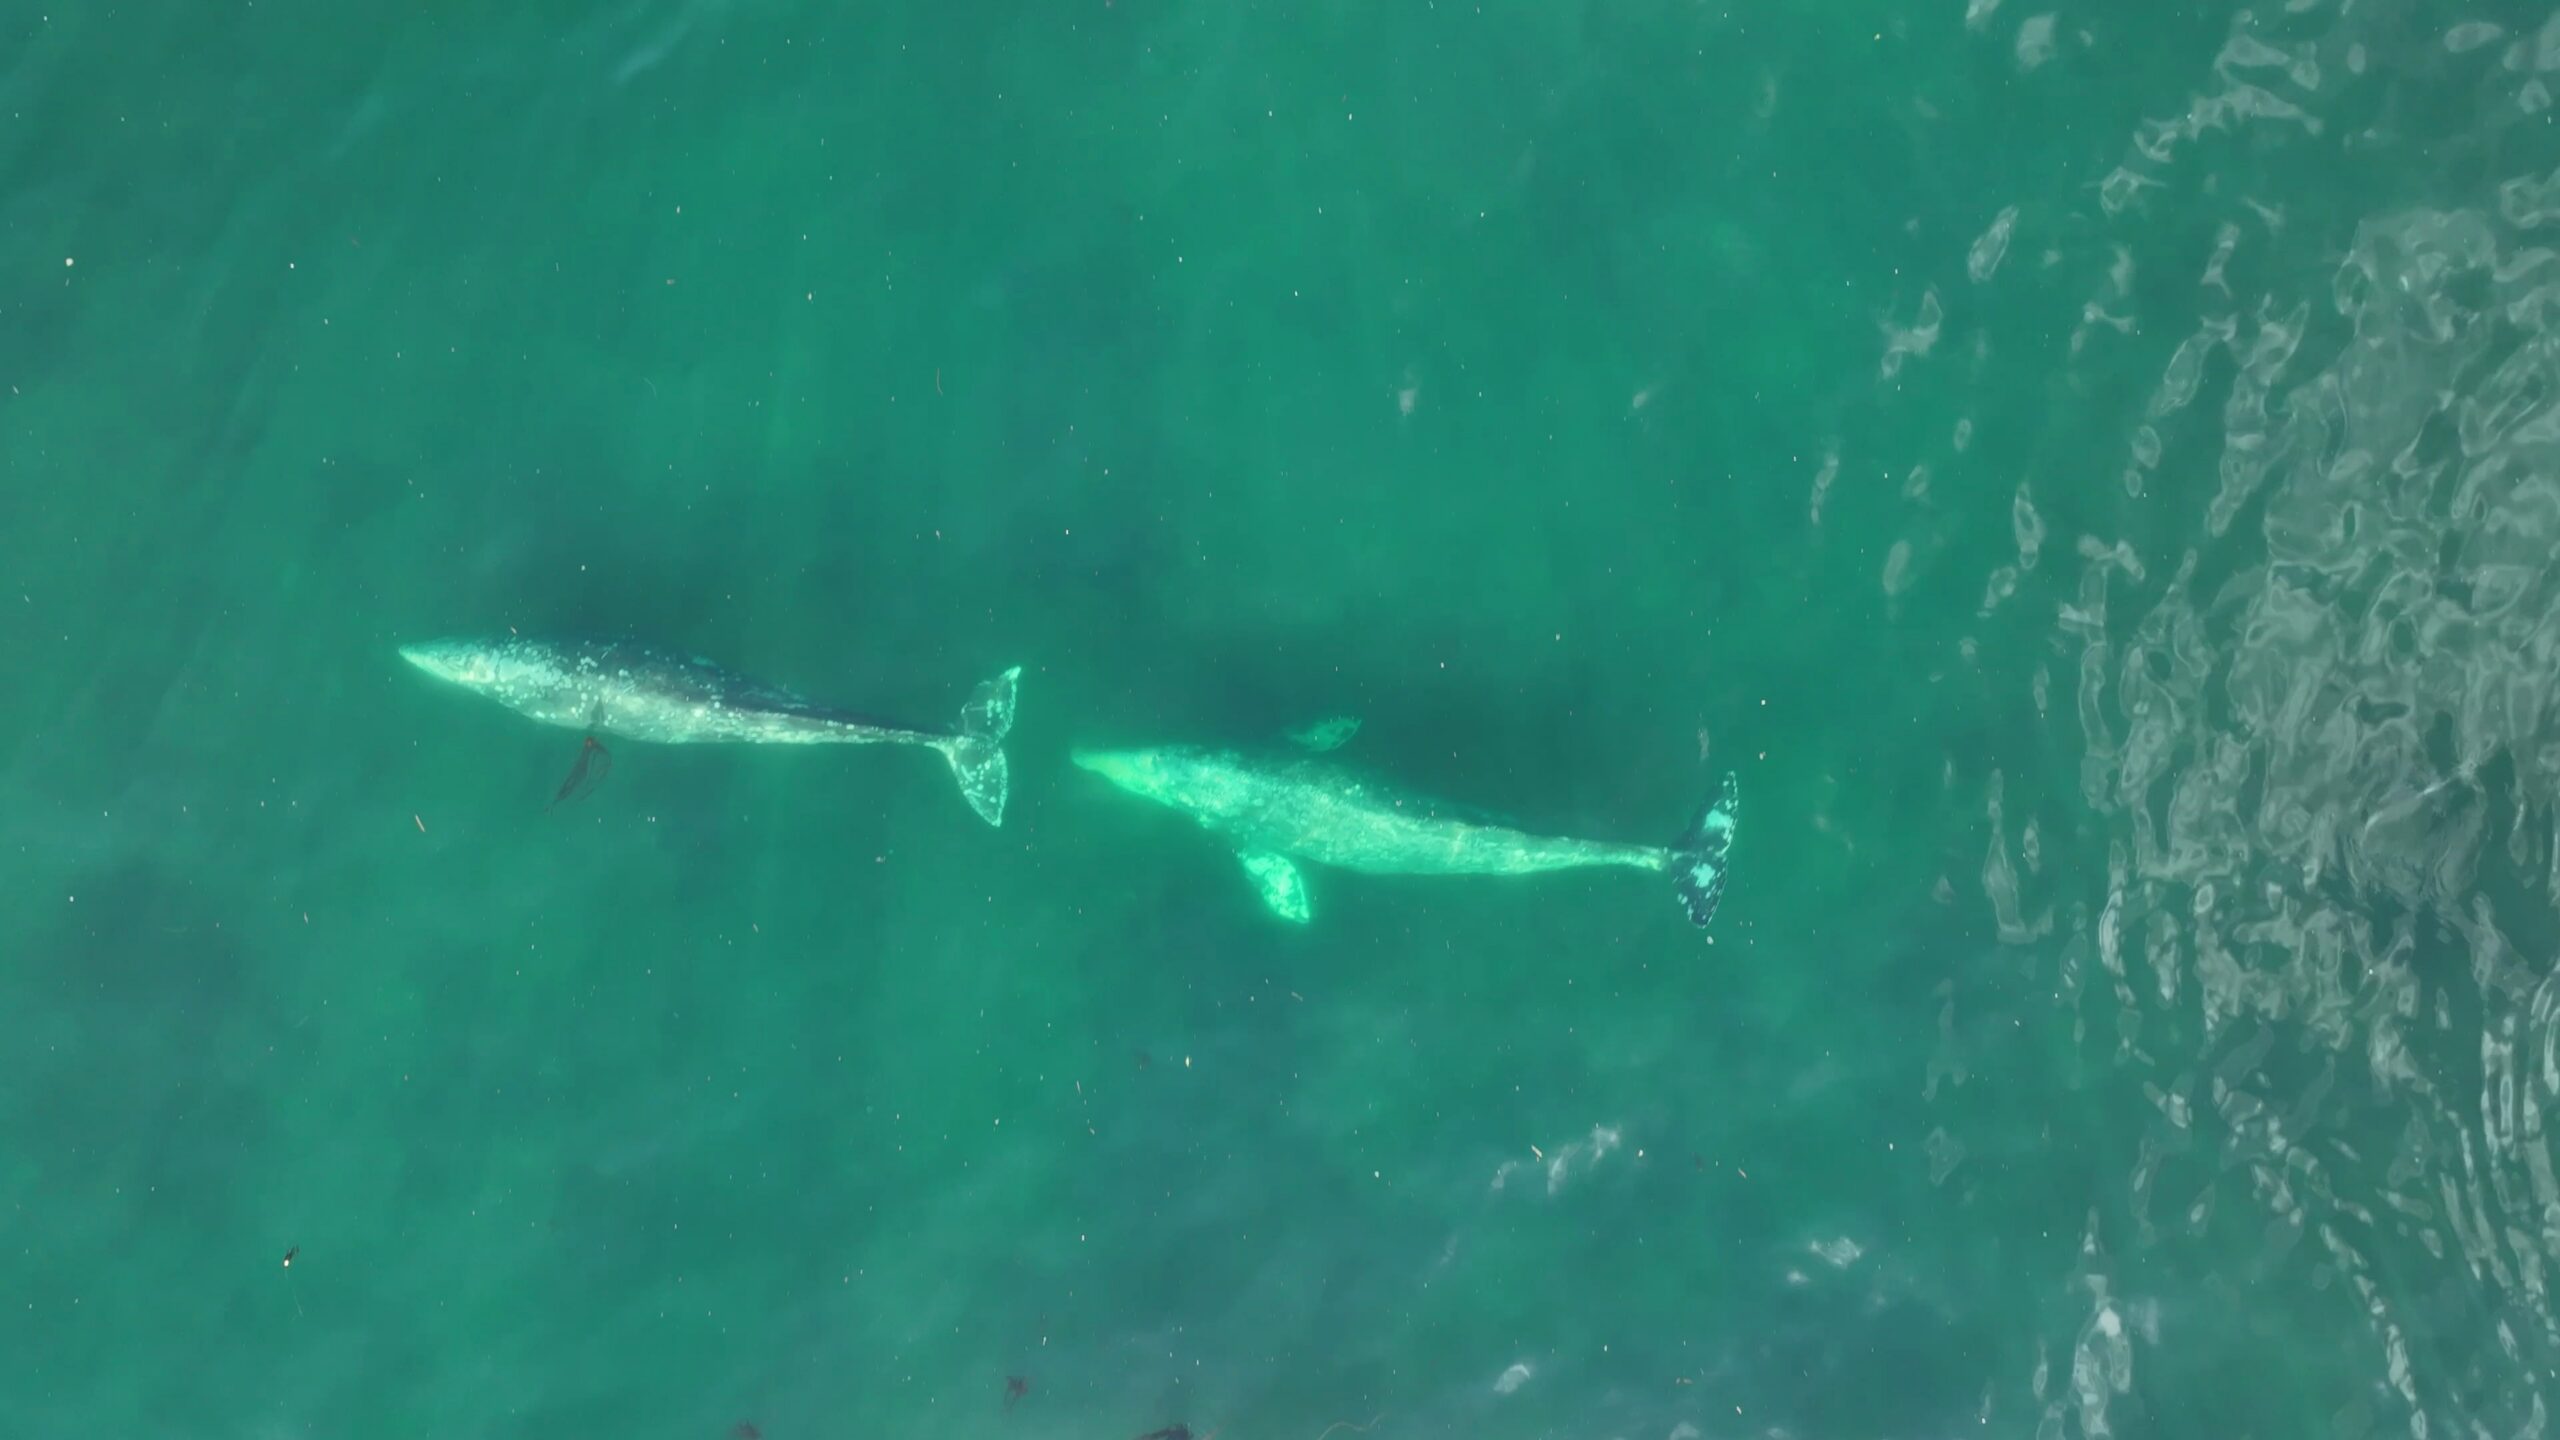
Figure 8. Photo of two whales surfacing in front of Mount Edgecumbe
Acknowledgements
I would like to first and foremost acknowledge the Tlingit people, who have stewarded the lands and waters around Sitka for over 10,000 years, and on whose homelands we are guests. Immense thank you to Dr. Lauren Wild and Dr. Ellen Chenoweth for hosting me and additional thanks to Dr. Wild for proofreading the first draft of this blog.
References
ADFG Herring Timeline, n.d. TIMELINE OF COMMERCIAL HERRING FISHERIES IN SOUTHEAST ALASKA.
Heintz, R., Moran, J., Vollenweider, J., Straley, J., Boswell, K., Rice, J., 2010. Humpback Whale Predation and the Case for Top-Down Control of Local Herring Populations in the Gulf of Alaska.
Liddle, J.B., 2015. Population dynamics of Pacific herring and humpback whales, Sitka Sound, Alaska 1981-2011 (Ph.D.). ProQuest Dissertations and Theses. University of Alaska Fairbanks, United States — Alaska.
Starr, R., O’Connell, V., Ralston, S., 2011. Movements of lingcod (Ophiodon elongatus) in southeast Alaska: Potential for increased conservation and yield from marine reserves. Canadian Journal of Fisheries and Aquatic Sciences 61, 1083–1094. https://doi.org/10.1139/f04-054
Wild, L.A., Riley, H.E., Pearson, H.C., Gabriele, C.M., Neilson, J.L., Szabo, A., Moran, J., Straley, J.M., DeLand, S., 2023. Biologically Important Areas II for cetaceans within U.S. and adjacent waters – Gulf of Alaska Region. Front. Mar. Sci. 10. https://doi.org/10.3389/fmars.2023.1134085
Dr. Clara Bird, Postdoctoral Scholar, OSU Department of Fisheries, Wildlife, and Conservation Sciences, GEMM Lab & LABIRINTO
In one of my first GEMM lab blogs (over six years ago!) I wrote that for my thesis I was going to, “…use the drone footage to analyze gray whale behavior and how it varies across space, time, and individual.”, and I’m happy to say that I more or less accomplished that goal. Now as I write my last blog for the GEMM lab, a whole PhD and postdoc later, I want to take this opportunity to share what we’ve learned about Pacific Coast Feeding Group (PCFG) gray whale behavior from my PhD and postdoc work.
A behavioral specialization
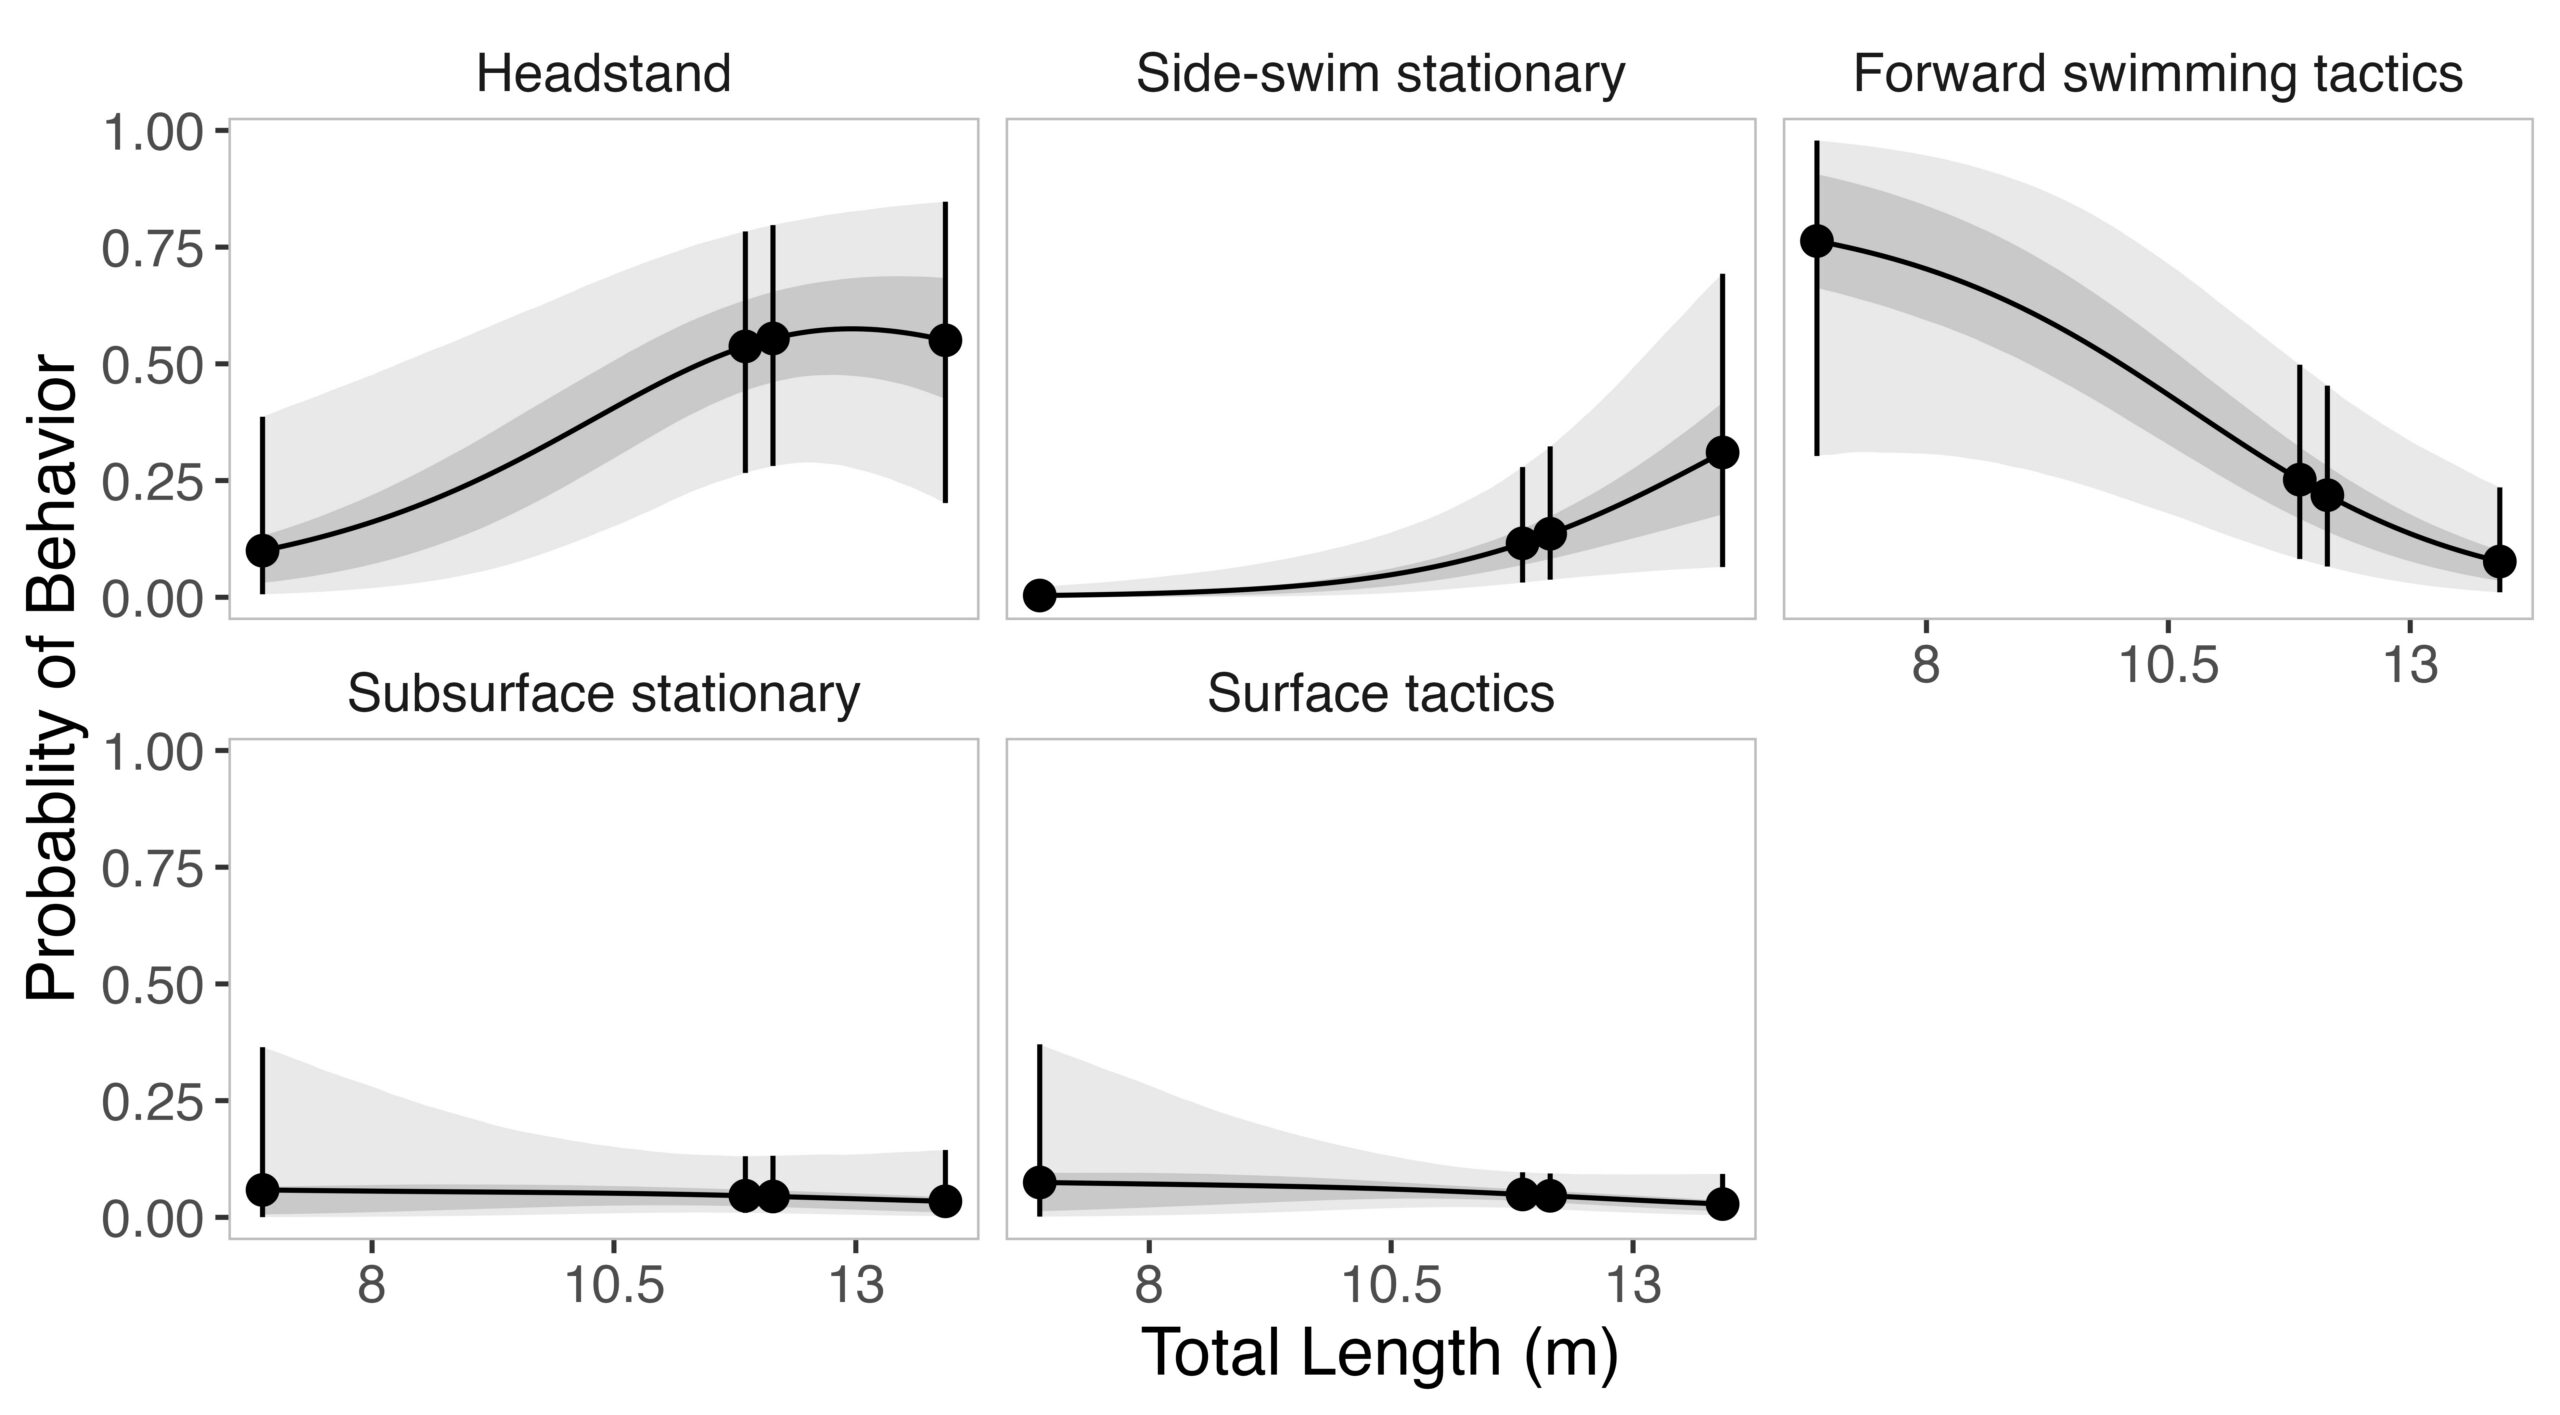
Given the impressive diversity of foraging tactics used by PCFG gray whales (Torres et al., 2018), a central question from the start was, “do all individuals use all behaviors, or is there variation in which whales use each behavior?”. This interest in individual specialization led to several blogs and became the question I asked in my first PhD chapter (read an introduction to specialization here and summaries of the drivers of specialization here and here). In my first chapter, I used drone data to study the relationship between individual behavior use, body length and condition, and habitat type. We found a strong relationship between foraging behavior and individual length (which is also a proxy for age). Longer, older, whales were more likely to feed using the headstanding tactic while shorter, younger, whales were more likely to feed using forward swimming tactics (Figure 1; Bird et al., 2024a). Together, these results suggest an ontogenetic shift (i.e., a shift associated with age) in foraging behavior use. Furthermore, we found that different tactics were more likely to be used in different habitats; headstanding was more likely to occur in reef habitats while the forward swimming tactics were more likely to occur in rock habitat. Overall, this chapter showed us that PCFG gray whale foraging behavior varies by length/age and habitat, indicating a lack of generalization across the group.
Figure 1. The relationship between individual total length and the probability of a behavior being used. In each box, the x-axis represents total length, and the y-axis represents the probability of that behavior (shown in the box title) being used. Figure from Bird et al. (2024a).
A behavioral adaptation
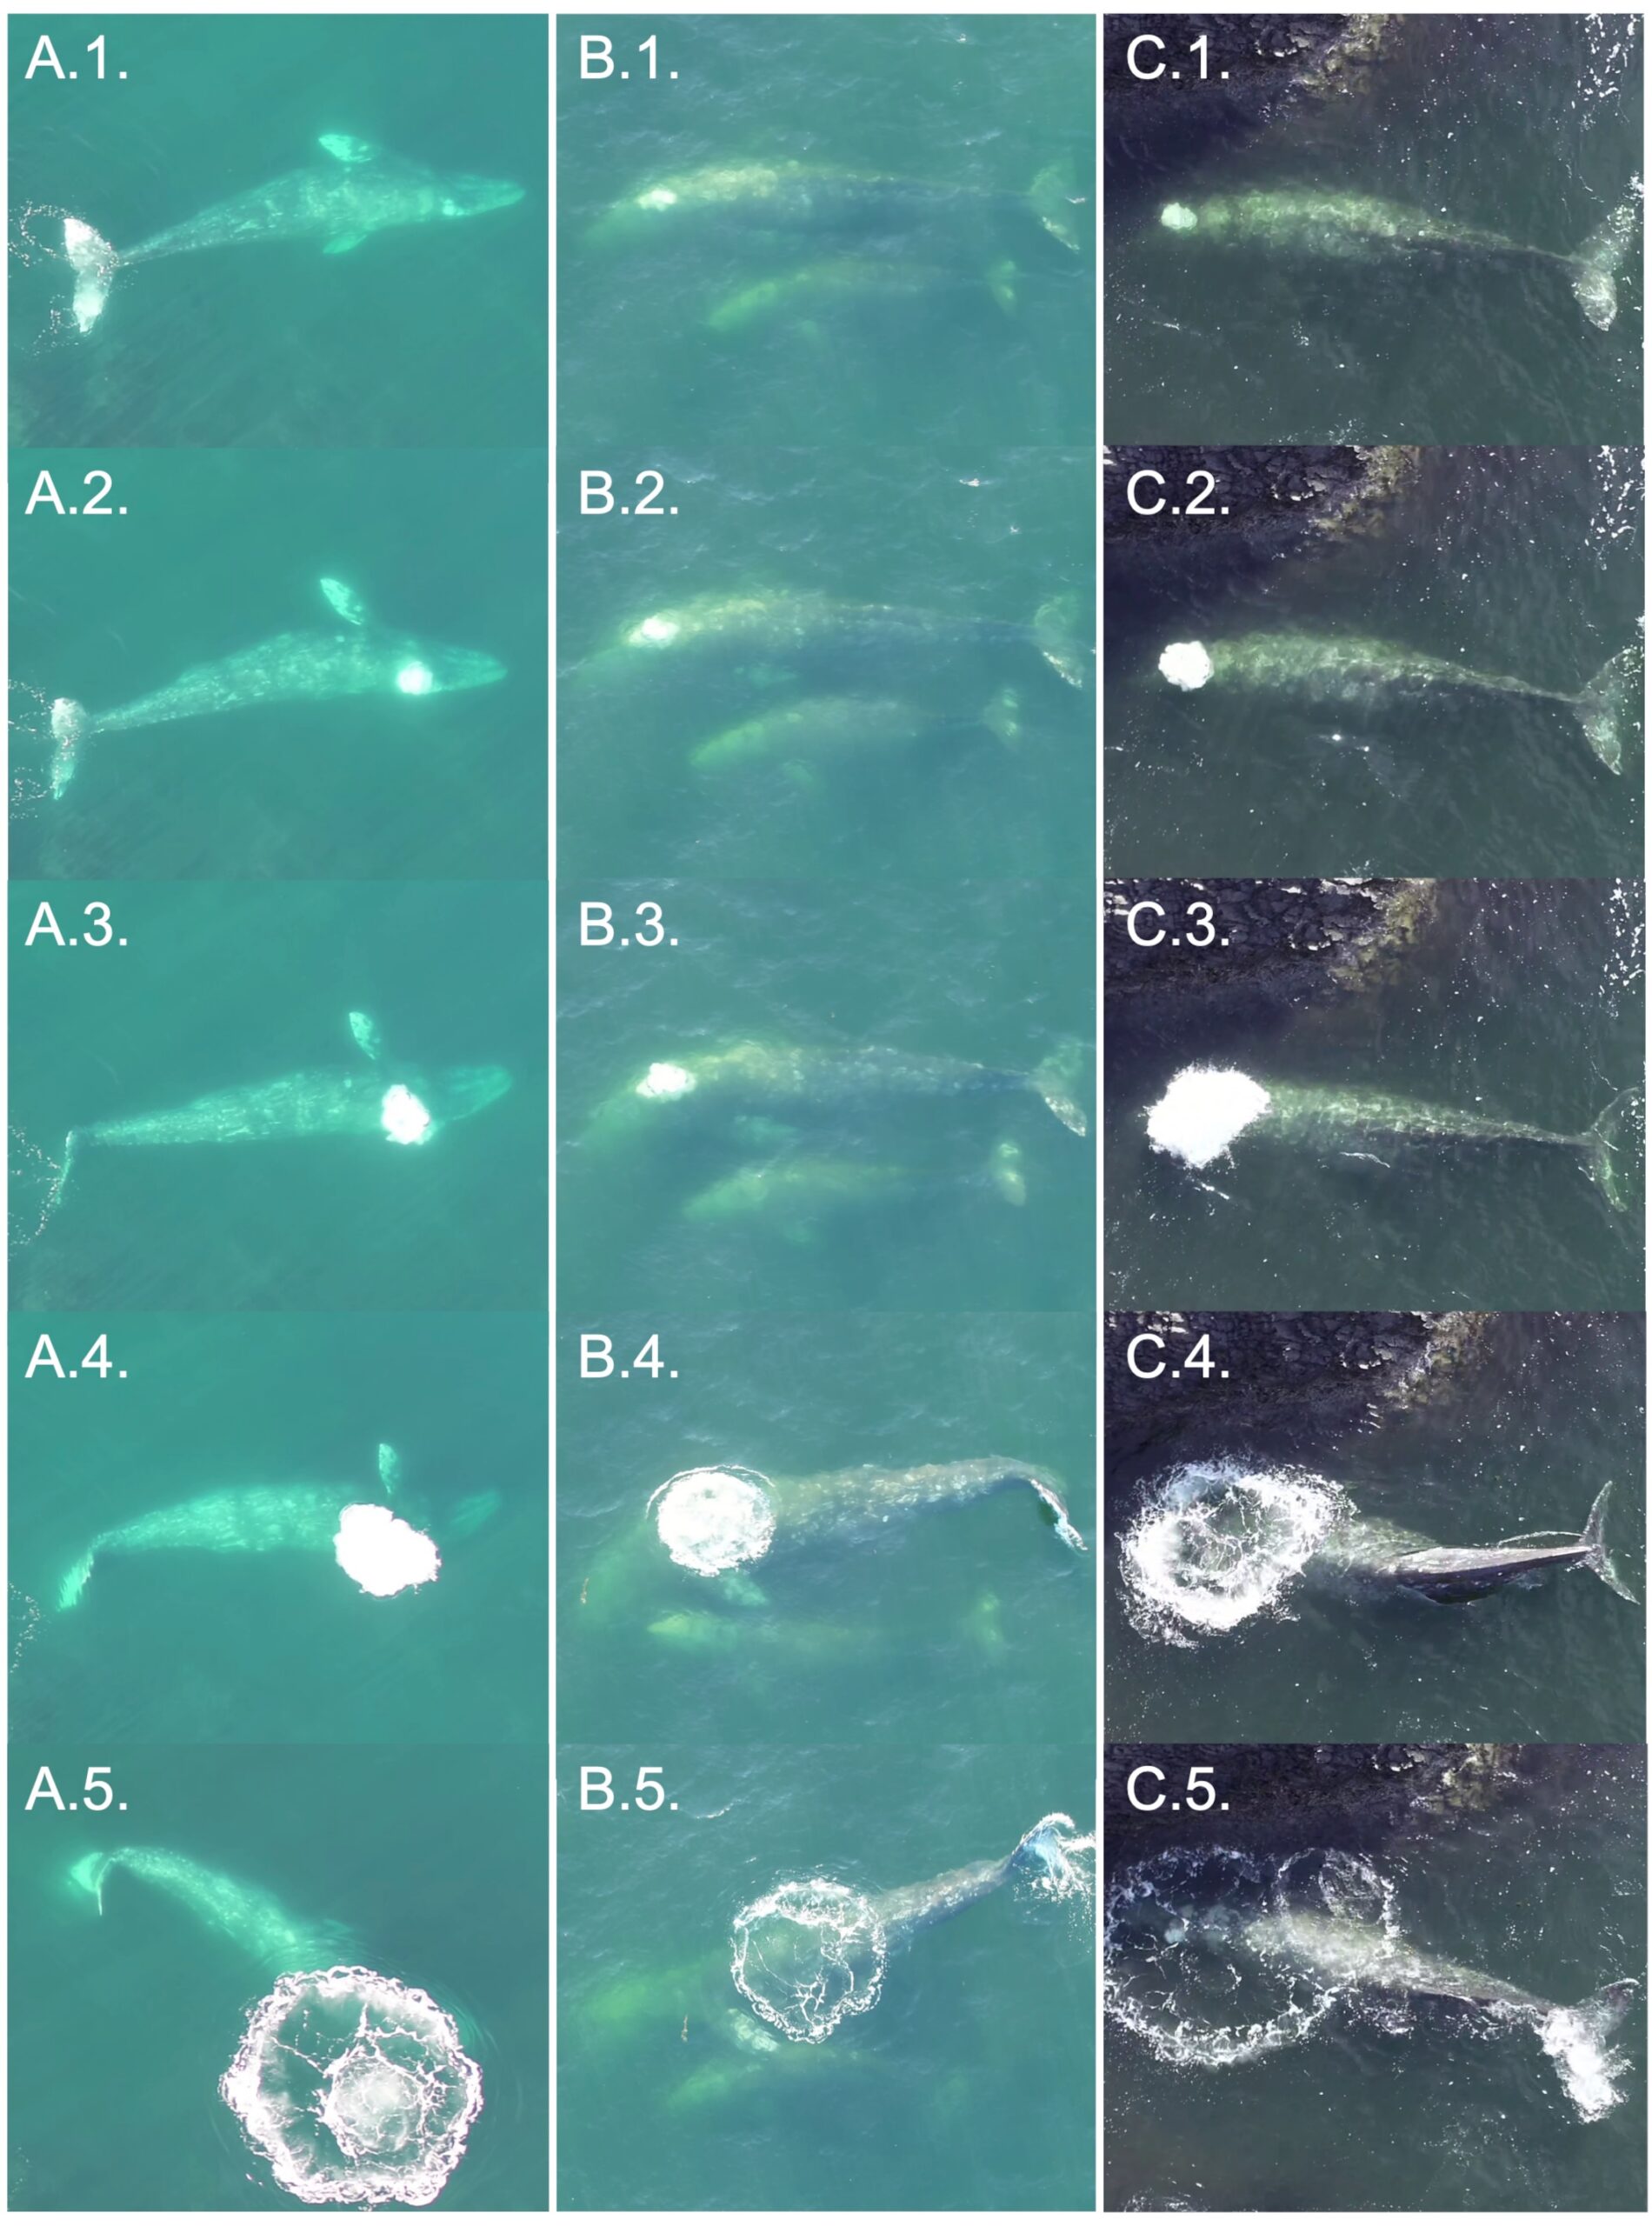
If you’ve ever watched gray whales off the coast and seen a large bubble rise to the surface, then you’ve seen a bubble blast! While we observed these bubble blasts, described as “underwater release of air that rises to surface and forms a circle/puka.” (Torres et al., 2018), fairly often in the field (Figure 2), we were never quite sure of their function, leading to my second chapter.
Figure 2. Sequential photos extracted from drone video of bubble blasts performed by PCFG gray whales during a headstand (a), side-swim stationary (b), and subsurface feeding (c). Images 1–5 in each panel show a bubble blast event from the start of the exhalation (1) to the whale continuing to feed after the bubble has diffused at the surface (5). Figure from Bird et al., (2024b).
We initially wondered if bubble blasts served a prey corralling function (like humpback whale bubble nets), but the timing and location did not fit that idea. We instead wondered if bubble blasts were being used to regulate buoyancy. The whales we study forage in water nearly as shallow (<15 m) as they are long (~12 m), meaning that they must work against their buoyancy to dive. So, like a diver releasing air from their vest to sink, we hypothesized that these whales release air from their lungs (in the form of a bubble blast) to be able to dive more efficiently. Building on this idea, we specifically hypothesized that a whale would be more likely to bubble blast if they were bigger (i.e., because they had larger lungs) and fatter (i.e., they are more buoyant due to increased blubber). To test this hypothesis, we modeled the relationship between bubble blast use, total length, and body condition and found that the probability of an individual whale bubble blasting increased with total length and body condition. Furthermore, we found that whales who bubble blasted performed longer dives than those who did not, supporting our hypothesis that bubble blasts improved dive efficiency (Bird et al., 2024b).
Behavior and energetics
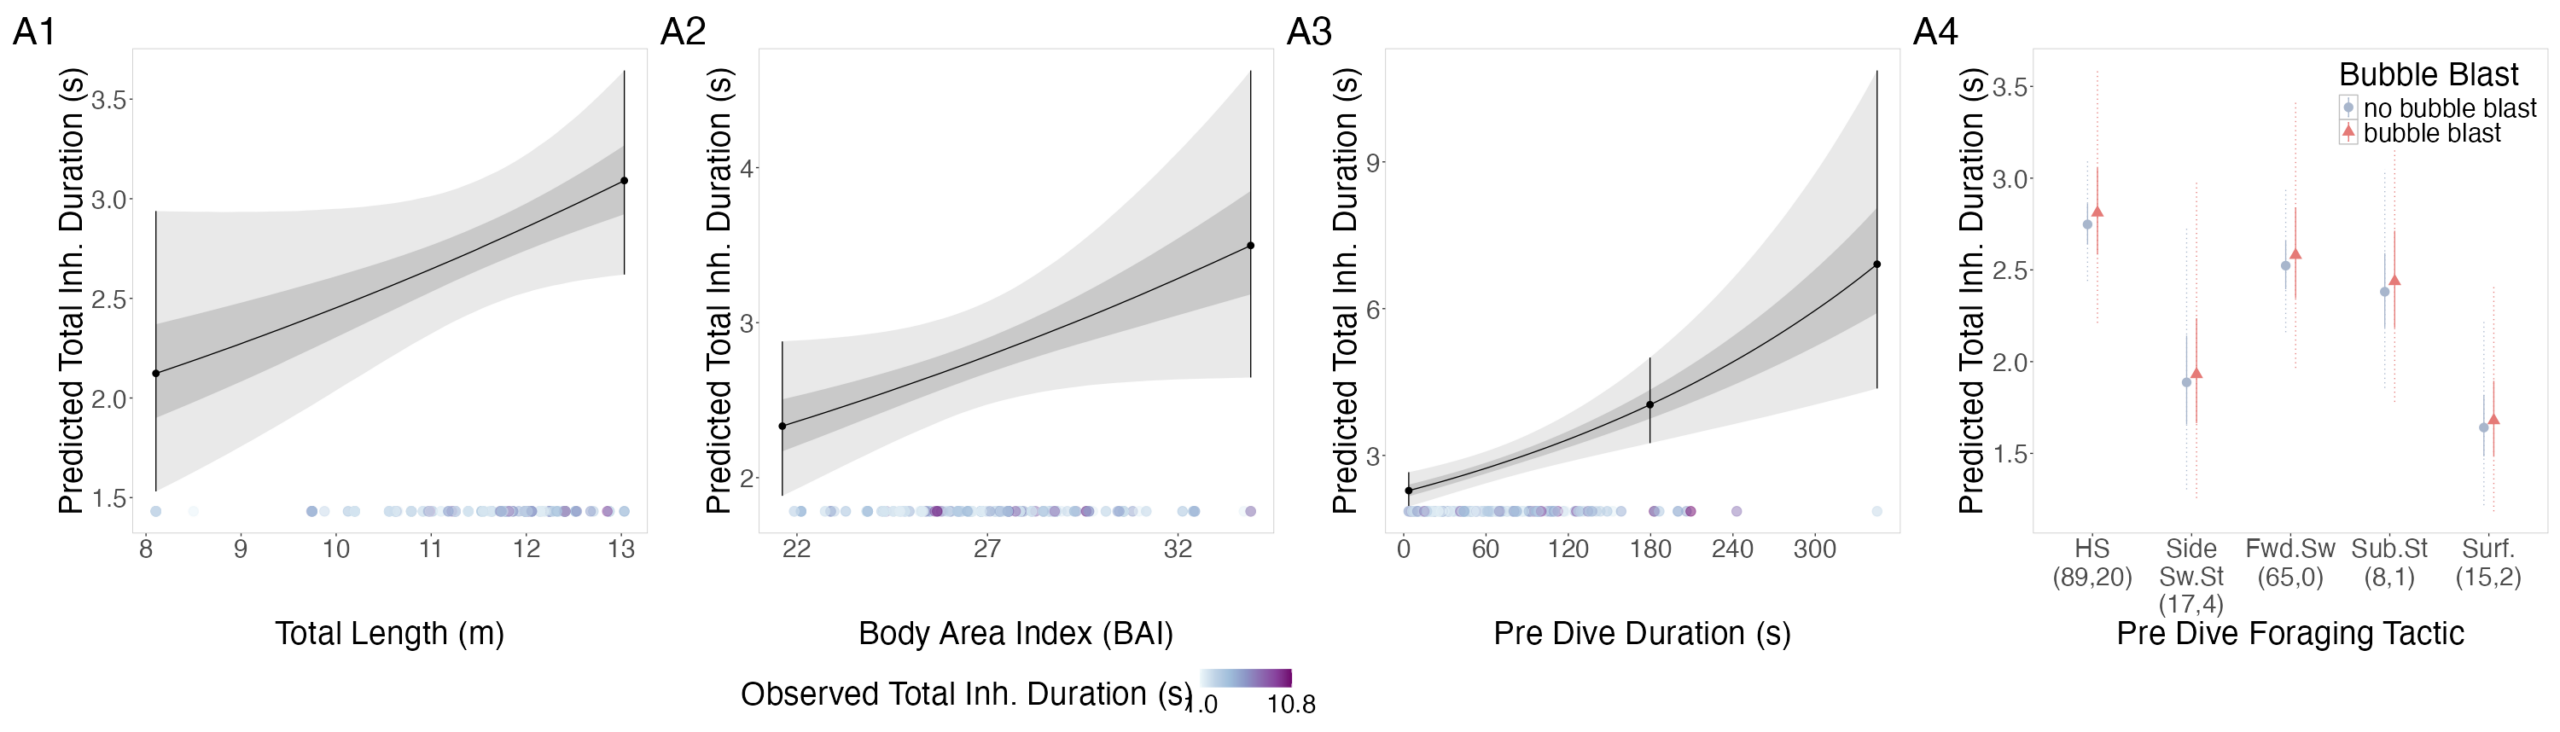
The interpretation of results from my first two chapters involved many questions regarding energetics. As we’ve described in previous blogs (here and here), it is important to understand how much energy different behaviors require because energetics helps us understand foraging success. Following the results of my first chapters, we wanted to better understand if different foraging behaviors cost different amounts of energy and if bubble blasts affected the energetic cost of a dive. To ask these questions we used individual breathing patterns as a proxy for energy expenditure (read more on the method here) and explored how breathing patterns were related to individual length, body condition, and behavior (including dive duration, foraging tactic, and bubble blast use). We found that the energetic cost of a dive increased with individual length, body condition, and dive duration (Figure 3.A1-3). Interestingly, we found no relationship between foraging tactic, bubble blast use and energetic expenditure (Bird et al., 2025; Figure 3.A4). However, my second chapter showed that both foraging behavior and bubble blast use affect dive duration (Bird et al., 2024b), indicating that effects of behavior on energetics come via the dive duration variable.
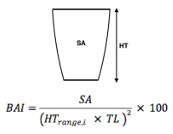
Figure 3. Estimated relationships between (1) total length (TL), (2) Body Area Index (BAI), (3) preceding dive duration (s) and (4) preceding dive foraging tactic and bubble blast occurrence and (A) total inhalation duration (s). Here total inhalation duration is the sum of all inhalations following a dive; a higher value indicates higher energy expenditure during the dive.In A4 the foraging tactics have been abbreviated as follows: HS = Headstand, Side.Sw.St = Side-swim stationary, Fwd.Sw. = Forward swimming tactics, Sub.St = Subsurface stationary, Surf. = Surface tactics.Figure from Bird et al., (2025).
Social patterns
As a postdoctoral scholar I had the opportunity to pivot from PCFG foraging behavior to social behavior. We generally think of baleen whales as solitary animals with loose social structure when on their foraging grounds, including gray whales while in nearshore Oregon waters. But social structure is not well studied in gray whales and can provide important insight into how information or disease might pass through a population. To look for social patterns we first assigned whales to a group if they were seen within 10 minutes and 100 meters of each other; whales seen in the same group were determined to be “associated”. If we saw whales interact with each other (e.g., touch each other, swim in a synchronized movement) they were determined to be “interacting”. We then tallied the number of times each possible pair of whales had been seen associating and/or interacting. The higher the tally, the stronger the association. Using that dataset, we assessed if some whales were more central (i.e., had strong associations or more associations with other whales) than others and if centrality was related to sex and age. We also assessed if whales were more likely to associate with other whales of similar sex or age. Finally, we reviewed our notes from the field and drone footage and documented the kinds of social interactions we’ve observed. While we’re still wrapping up this work, I’m excited to share that we’ve found that gray whales have more social structure than previously thought, including relationships with age and sex, and documented several interesting social interactions (Figure 4). I am excited to see what more years of data collection reveal about their social patterns, especially with an emphasis on how they might be learning from each other.
Figure 4. A social interaction documented from the drone. Here one whale is pursuing the other. Collected under NMFS permit #27426.
Tying it all together
Looking ahead, I’m most curious to better understand how the PCFG successfully feed in this shallow habitat. The findings of my third chapter show that the energetic cost of foraging increases with body condition (Bird et al., 2025). I hypothesize that this increase is because it becomes physically more difficult to dive as they become more buoyant (due to the increased fat). So, while bubble blasts appear to be a behavioral adaptation to reduce buoyancy (Bird et al., 2024b), there could be a point at which a whale is too fat to continue feeding in this shallow environment. Could this be why PCFG gray whales are skinnier than the Eastern North Pacific (ENP) gray whales that feed in the deeper arctic waters (Torres et al., 2022)? Given recent evidence that the PCFG may be facing a possible population decline (Pirotta et al., 2025), these questions are more relevant than ever.
The one theme that weaves throughout all this work is the importance of individual variation. Thanks to our incredible dataset, built from years of hard work and accessible whales that keep returning to our study site, we are able to follow individuals over time and uncover the links between habitat, individual size, body condition and sex, behavior, energetics, and the whales themselves.
While I am sad to be leaving the GEMM lab, I am certainly proud of all that we have learned so far and excited to see what’s next (as an avid reader of the blog of course).
Did you enjoy this blog? Want to learn more about marine life, research, and conservation? Subscribe to our blog and get a weekly alert when we make a new post! Just add your name into the subscribe box below!
References
Bird CN, Pirotta E, New L, Bierlich KC, Donnelly M, Hildebrand L, Fernandez Ajó A, Torres LG. 2024a. Growing into it: evidence of an ontogenetic shift in grey whale use of foraging tactics. Animal Behaviour 214:121–135. DOI: 10.1016/j.anbehav.2024.06.004.
Bird CN, Pirotta E, New L, Bierlich KC, Hildebrand L, Fernandez Ajó A, Torres LG. 2024b. Bubble blasts! An adaptation for buoyancy regulation in shallow foraging gray whales. Ecology and Evolution 14:e70093. DOI: 10.1002/ece3.70093.
Bird CN, Pirotta E, New L, Cornelius JM, Sumich JL, Colson KM, Bierlich KC, Hildebrand L, Ajó AAF, Doron A, Torres LG. 2025. Size and body condition drive the energetic cost of a baleen whale foraging in shallow habitat. PeerJ13:e20247. DOI: 10.7717/peerj.20247.
Pirotta E, New L, Fernandez Ajó A, Bierlich KC, Bird CN, Buck CL, Hildebrand L, Hunt KE, Calambokidis J, Torres LG. 2025. Body size, nutritional state and endocrine state are associated with calving probability in a long-lived marine species. Journal of Animal Ecology 94:1–13. DOI: 10.1111/1365-2656.70068.
Torres LG, Bird CN, Rodríguez-González F, Christiansen F, Bejder L, Lemos L, Urban R J, Swartz S, Willoughby A, Hewitt J, Bierlich KC. 2022. Range-Wide Comparison of Gray Whale Body Condition Reveals Contrasting Sub-Population Health Characteristics and Vulnerability to Environmental Change. Frontiers in Marine Science 9:1–13. DOI: https://doi.org/10.3389/fmars.2022.867258.
Torres LG, Nieukirk SL, Lemos L, Chandler TE. 2018. Drone up! Quantifying whale behavior from a new perspective improves observational capacity. Frontiers in Marine Science 5:1–14. DOI: 10.3389/fmars.2018.00319.
I successfully defended my PhD 55 days ago and I have been grappling with a lot of complex emotions since then. I feel pride in having accomplished such a milestone, sadness to have left such an incredible lab and workplace, excitement to see what the future holds, and, admittedly, also relief to have a bit of time off. I have also been reflecting about all the things I have learned during my seven-year journey of being a graduate student. Naturally there is all the ecological, quantitative and communication knowledge and skills I learned that have shaped me into the scientist I am today. However, there are so many lessons that I have learned that are less tangible but equally as important in building a successful career in academia, I think.
Feeling stupid is kind of the point
Graduate school is riddled with unknowns. As we embark on these journeys there is much to be learned and it can be exhausting not knowing a lot of the time. During many stints of my graduate school journey, I felt stupid, with varying magnitudes of stupidity. Whether I felt stupid because I had to Google “how to save one object in R environment” for the thousandth time or because I simply could not grasp why a Bayesian posterior distribution was so much better than a frequentist p-value result. If you’re struggling with feeling stupid in academia, know that it is actually an important part of the process – sitting in the discomfort of not knowing something is what drives us to get answers. Of course, in graduate school, it isn’t that we just don’t know the answer to a scientific question (for example, in my case, how do different individual gray whales use space during a foraging season?), but we also don’t know how to get the answers to that question right away. Before I could even begin to tackle that question for one of my PhD chapters, I had to learn about how to quantify survey effort from survey conditions, the principles of Bayesian statistics, theoretical spatial ecology, coding in Python, capture-recapture models, and so much more. Each of those pursuits involved weeks, if not months, of feeling stupid. But feeling stupid throughout the pursuits was kind of the point. There’s an incredibly excellent (and short) article on this topic by Martin Schwartz that I cannot recommend highly enough.
Asking questions isn’t a weakness, it’s a strength
Somewhat related to the importance of feeling stupid, is realizing that it’s ok, neigh even necessary, to ask for help. Learning to be an independent problem-solver is of course a huge part of being a graduate student. But it’s also important to learn that at some points, continuing to bang your head against the keyboard because you can’t figure something out, is not the most productive use of your time. I have been so lucky to have been surrounded by so many knowledgeable, generous and kind people throughout my graduate career, ranging from fellow graduate students to lab mates, to project colleagues, and my committee members and advisor. I have benefitted so much from countless Zoom meetings or whiteboarding sessions where people have shared their wisdom with me in helping me solve a problem. I know this quote is probably a cliché but I think it holds so much truth: “Ask a question and be a fool for five minutes, don’t ask a question and be a fool for life.”. More often than not, a question that you ask is one that someone else probably also had in mind but was too shy or embarrassed to ask. So, be the risk taker and ask that question!
Learning takes time
The months leading up to a defense are usually a massive crunch. There are analyses that are still getting figured out, chapters that need to be written, citations that need to be integrated, and a big beefy Word document that needs to be formatted according to very specific thesis guidelines. By the end of a degree, a graduate student has learned so much and honed so many skills that tasks are happening much more efficiently than they did the first time around. A few weeks before my defense, I had a conversation with Marine Mammal Institute research associate Selene Fregosi where I lamented about not having achieved enough in the first three years of my PhD seeing as I was able to complete two data analyses and chapters in the final six months of my PhD. It left me wondering, what did I spend all those years doing at the start of my PhD?! Selene chuckled in response and she said, “Lisa, you were learning!”. Selene helped me realize that it was those years spent in the slow learning process that allowed me to be fast yet effective in the final months before my defense, enabling the completion of two chapters in a much shorter amount of time than my first chapters took. That flip in perspective was a much kinder way of looking at the years gone by. Dovetailed with this lesson is that everything takes way longer than you think it will, especially if it involves learning, so budget for learning time!
Adaptability is key
I consider myself a Type A personality. I like being organized, I like having a plan, and I like knowing what is around every corner. Unfortunately, a graduate student trajectory (and life!) rarely has a defined, clear, unchanging path. I recently looked back at a document titled ‘PhD Chapter Ideas’ that I made in June 2020 while I was in the final six months of my Master’s degree and starting to brainstorm with Leigh about what my PhD dissertation could entail. Of the six ideas listed in that document, only two of them sort of align with the chapters that ended up in my final dissertation five years later. My dissertation morphed quite a bit over the years and this change is inevitable. So many things can go wrong during scientific endeavors: equipment can malfunction and fail, data may not be available in time or impossible to acquire, proposed collaborations may not take place, weather, funding hiccups, computational limitations, to name a few. While it is important to be persistent and to find solutions to problems that arise, sometimes the solution to a problem may be pivoting and embracing change.
Thinking ahead
As I begin the next, somewhat daunting, journey of entering the job market, I am reminded that graduate school has shaped me in ways I did not always recognize at the time. I take comfort in knowing that graduate school has prepared me in ways that extend far beyond technical training. Alongside tools and knowledge, I leave with resilience, perspective, and a collection of hard-earned lessons that will continue to guide me as I navigate what comes next.
By Nicole Principe, second-year PhD student, OSU Dept of Fisheries, Wildlife and Conservation Sciences, GEMM Lab
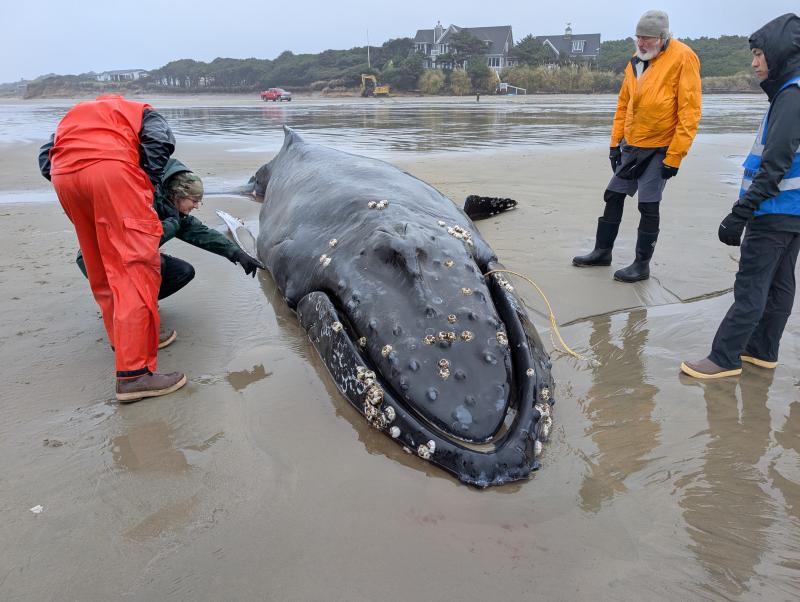
On November 15, 2025, a juvenile humpback whale stranded alive on the Oregon Coast, showing clear evidence of entanglement in gear linked to the 2023-2024 Oregon commercial Dungeness crab fishery1(Fig. 1). A large, multi-organization response followed, including groups from the West Coast Marine Mammal Stranding Network, OSU’s Marine Mammal Institute, Pacific Marine Mammal Center, Cascadia Research Collective, Oregon Coast Aquarium, SeaLife Response, Rehabilitation, Research, and more. After an unsuccessful attempt to help the whale return to sea, trained responders and veterinarians made the difficult decision to humanely euthanize it to prevent further suffering. A full necropsy (animal autopsy) was conducted afterwards to better understand the health of the whale and why it stranded
Figure 1. A stranded humpback whale off the coast of Yachats, OR. (West Coast Marine Mammal Stranding Network)
This event drew significant public attention, with community members gathering on the beach to witness this rare and emotional scene. Seeing a large, sentient animal like a humpback whale stranded on land is deeply upsetting and it naturally raised questions: Why did this happen? Was the whale sick or injured? Why couldn’t it be rescued? These are important and understandable questions and answering them openly is a core part of marine mammal science and education.
I worked as a marine mammal stranding technician in the Southeast US for almost two years, leading responses on numerous deceased and live stranded dolphins and whales. These experiences gave me insights about the realities of marine mammal response, how stranding networks operate, why marine mammals strand, how the public can safely assist when strandings occur, and efforts being done to mitigate human-related threats.
What is a Marine Mammal Stranding?
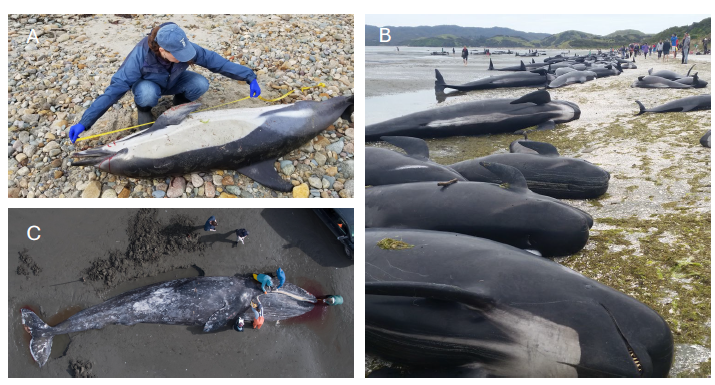
Before getting into the details of how responses work, it’s important to define what a marine mammal stranding is. The word “stranding” is used to describe sick, injured, entangled, distressed, or dead seals, sea lions, dolphins, porpoises, and whales. Cases vary with animals either washing ashore dead or live stranding on a beach or in shallow water and being unable to return to the water without assistance (Fig. 2). A mass-stranding involves two or more individual cetaceans of the same species stranding together. Each situation is different and requires various resources, equipment, and personnel2.
Figure 2. A) A single stranded dolphin (WDC), B) A mass stranding of pilot whales (Deb Pierce), C) A stranded gray whale in Washington (Cascadia Research Collective)
Stranding Networks
The National Oceanic and Atmospheric Administration (NOAA) Marine Mammal Health and Stranding Response Program (MMHSRP) was established under the Marine Mammal Protection Act and is the governing authority that oversees national responses to stranded pinnipeds and cetaceans. The MMHSRP works in collaboration with federal and state facilities as well as via networks of regional stranding responders, involving aquariums, academic institutions, and non-governmental organizations (NGOs). Network members have a Stranding Agreement from NOAA Fisheries, ensuring that all activities performed are safe for both responders and animals3.
Many stranding networks are made up of only a small number of paid employees and rely on support and assistance from community volunteer members. These networks also rely heavily on federal funding to maintain operations, including funding staff, ordering laboratory and necropsy supplies, facility maintenance, vessel and truck costs, sample shipment, pathology testing, and more. The John H. Prescott Marine Mammal Rescue Assistance Grant Program is a critical source of funding for many stranding groups. From 2001 through 2023, the Prescott Program awarded more than $75.4 million in grants to networks across the U.S4. Proposed budget cuts by the current administration put stranding networks at risk of losing this critical funding, which could impact the level of responses, limit necropsies, or reduce long-term monitoring efforts that are essential for detecting emerging threats to ocean and human health.
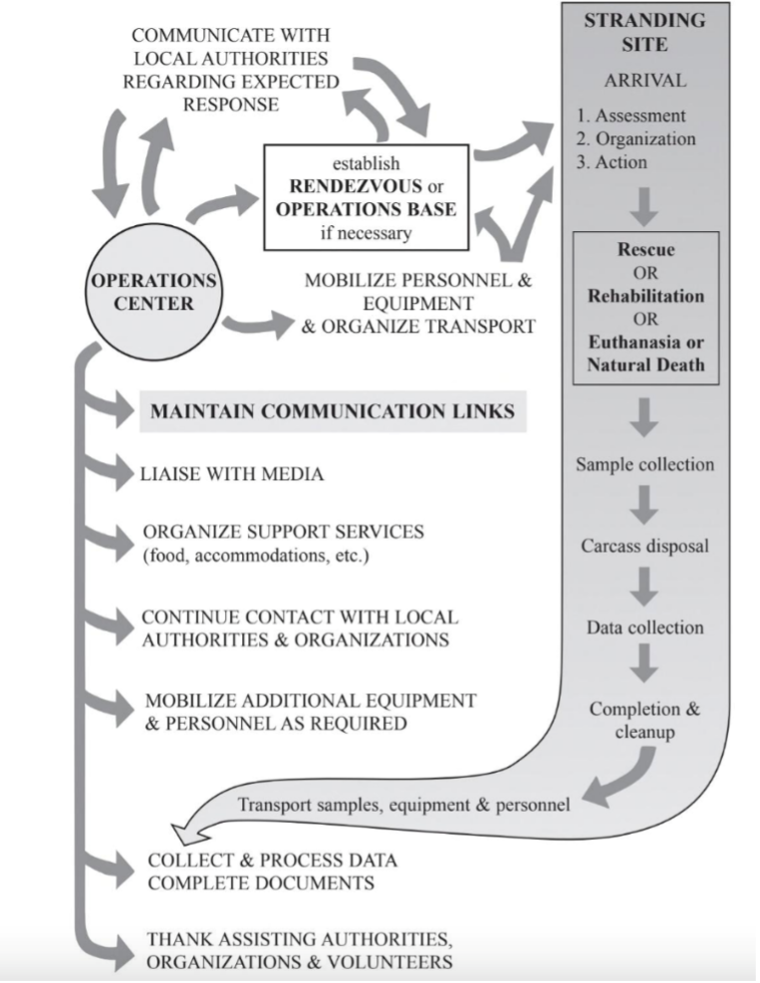
Key Steps to A Stranding Response
Figure 3. The steps to a marine mammal stranding response. (Geraci & Lousnbury, 2025).
Step 1 – Stranding Network Receives a Call
Most marine mammal stranding networks operate a 24/7 hotline for the public to report stranded animals. These calls are critical for gathering information such as species, size, condition (alive or dead), location, and any visible injuries or entanglement. Photos and continued communication with the caller can greatly help responders coordinate an appropriate response.
Step 2 – Coordinating a Response
Every stranding is logistically complex, and response strategies differ greatly depending on whether the animal is alive or deceased.
Deceased animals
If an animal is found dead, it may be examined in the field or transported to a lab for further analysis. Accessing the carcass can be challenging due to tides, weather, terrain, and remoteness, often requiring coordination with volunteers and local agencies such as park officials, fire departments, or the Coast Guard.
Live Strandings
Live strandings are time-sensitive and require rapid decision-making. Once intervention is deemed necessary, responders may attempt to return the animal to sea, transport it to a rehabilitation facility, or, in some cases, humanely euthanize it. These decisions are based on the animal’s condition, likelihood of survival, resources available, and safety of both the animal and responders2.
Returning an animal to sea is a viable option only when the animal is deemed healthy and they can safely be returned to their natural habitat. Smaller animals like dolphins and porpoises may be more easily returned to the water or transported to a more appropriate location for release. Whales are typically given one to two tidal cycles to refloat on their own, but their own body weight causes immense pressure once stranded, which can lead to respiratory and circulatory collapse. Pulling a large whale back into the ocean can dislocate the tail, cause paralysis, or even break the spinal cord1. Rare, but successful refloats of whales have happened only when the animal wasn’t exhausted, the sea conditions and the slope of the beach were suitable, and heavy machinery and boats were accessible and usable5.
Rehabilitation and release can be successful for some species, particularly pinnipeds and certain small cetaceans, but outcomes vary widely6,7. Large whales, especially baleen whales, rarely survive rehabilitation due to their size and biological needs8.
Euthanasia is an option when it is necessary to end suffering of an animal in irreversibly poor condition, and the procedure can be carried out humanely, no rehab or care facility is available, rescue is not feasible, or the animal continually re-strands2. This option should only be done after all other options have been considered, proper authorities with NOAA have given approval, and a trained veterinarian is available to safely do the procedure. Oftentimes, veterinarians will administer a sedative to keep the animal calm before euthanasia. While the outcome can be sad, euthanasia is never a choice of convenience. It reflects a commitment to animal welfare, ensuring that when recovery is not possible, the animal does not endure unnecessary pain or distress.
Live Strandings Do’s and Don’ts
Well-intentioned public involvement can sometimes complicate response to a live stranding. Approaching a distressed animal puts human safety at risk and is illegal under the Marine Mammal Protection Act9. Attempting to push a stranded animal back into the water can increase stress, risk injury or drowning, or lead to re-stranding.
Before responders arrive, the public can help by keeping noise levels low, keeping pets away, and following instructions from authorities (Fig. 4). Once on site, response teams may establish boundaries to protect both people and the animal. Community support, such as providing access to private beaches or properties, supplying water or food, or assistance when requested, can play an important role in a smooth response.
Figure 4. Do’s and don’ts for live stranded marine mammals. (Katharina J. Peters and Rebecca M. Boys)
Step 3 – Performing a Necropsy
A critical step after a marine mammal stranding is performing the necropsy to gain further insight into the cause of death. Preliminary information about the stranding itself is recorded, followed by identifying species and sex. Photos are taken of each part of the animal and measurements are collected to obtain morphometric data. A careful external examination is required to identify any signs of human interaction (i.e., entanglement, boat strike) or evidence of disease (i.e., skin lesions, blisters).
Upon opening the animal, each organ is examined and noted for abnormalities. Samples are collected from each organ for histopathology (to identify disease), virology, parasitology, or contaminant analysis. The number of samples that can be collected is influenced by how far along in the decomposition process the carcass is in, and how safely accessible the animal is (e.g., based on tides, daylight, weather).
Step 4 – Identifying Cause of Death
Determining the cause of death for stranded marine mammals is not always possible and rarely straightforward. But broadly, the causes of mortality fall into two categories: environmental factors and anthropogenic factors.
Environmental factors of mortality
Infectious and non-infectious diseases are among the leading causes of marine mammal mortality10. These include bacterial, viral, fungal, and parasitic infections that can affect multiple organ systems, impair feeding, and ultimately lead to emaciation or starvation11-13. Some pathogens, like cetacean morbillivirus and brucellosis, have caused large-scale mortality events and raise concerns for human health, highlighting the need for global monitoring14,15.
Marine mammals are also exposed to pollutants that bioaccumulate in marine ecosystems, including legacy contaminants such as DDT, PCBs, and heavy metals16-19. High contaminant loads have been linked to immunosuppression, increased disease susceptibility, reproductive impairment, endocrine disruption, and neoplasia20-23.
Harmful algal blooms (HABs) and the toxins they produce, such as domoic acid, have also caused mass mortality events in pinnipeds, sea otters, and cetaceans24-27. As HABs increase in frequency and intensity worldwide, they represent a growing threat to both marine mammals and ecosystem health.
Anthropogenic factors of mortality
In addition to natural and environmental causes, many marine mammal strandings are directly linked to human activities in the ocean. Collisions with vessels can result in severe injury or death and are often identified in stranded animals by propeller wounds or evidence of blunt force trauma observed during necropsy. While large, fast-moving ships are responsible for many fatalities involving large whales28,29, smaller recreational vessels also pose substantial risks to coastal species such as bottlenose dolphins and manatees30,31.
Entanglement in fishing gear is also a major source of human-caused mortality for marine mammals worldwide, affecting thousands of animals each year. Smaller species may drown from heavy gear, while large whales can become entangled and drag gear for weeks or months, leading to exhaustion, impaired feeding, infection, and drowning32.
Why do Marine Mammal Strandings Matter?
Marine mammal strandings play a critical role in monitoring ecosystem health. Through strandings and subsequent necropsies, scientists can identify the primary causes of mortality and detect patterns that would otherwise remain hidden in the open ocean. Marine mammals are particularly effective sentinels because they are long-lived, occupy mid- to high-trophic levels, and accumulate pollutants and toxins in their tissues, often providing early warning signs of emerging environmental stressors10.
Multiple stressors from both environmental and human-related threats can compound on a species, resulting in population declines. Continued monitoring through surveys on living animals and information gathered from stranded animals help provide data on what threats are most critical to inform conservation and management decisions and protect both marine ecosystems and human communities.
Preventing Strandings
Many efforts are being made to reduce mortality in marine mammals stemming from direct human impacts. NOAA has established regulations to implement speed restrictions in certain places and times to reduce lethal collisions. There is also a Whale Alert App that boaters can use to see where whales have recently been detected and avoid those areas. Remaining alert and vigilant on the water and transiting slowly in areas where marine mammals may be present can greatly reduce the risk of vessel strikes.
A significant amount of work worldwide is being done to better understand whale entanglements and develop solutions to reduce these events. In the GEMM Lab, Project OPAL was developed to identify co-occurrence between whales and fishing effort in Oregon to reduce entanglement risk. This collaborative project brings together scientists, managers from the Oregon Department of Fish and Wildlife, the commercial Oregon Dungeness crab fishery, and environmental nonprofits to discuss research methods and findings, and develop best practices and regulations to limit risk of entanglement while also ensuring a vibrant and profitable fishery.
If You Come Across a Stranded Marine Mammal
If you see a marine mammal stranding in Oregon, please make your first call to (541) 270-6830 to alert trained responders quickly. If you are in other U.S. regions, the hotlines can be found here.
Neves, M. C., Neto, H. G., Cypriano-Souza, A. L., da Silva, B. M. G., de Souza, S. P., Marcondes, M. C. C., & Engel, M. H. (2020). Humpback Whale (Megaptera novaeangliae) Resighted Eight Years After Stranding. Aquatic Mammals, 46(5), 483–487.
Mazzoil, M. S., McCulloch, S. D., Youngbluth, M. J., Kilpatrick, D. S., Murdoch, E. M., Mase-Guthrie, B., Odell, D. K., & Bossart, G. D. (2008). Radio-Tracking and Survivorship of Two Rehabilitated Bottlenose Dolphins (Tursiops truncatus) in the Indian River Lagoon, Florida. Aquatic Mammals, 34(1), 54–64.
McHugh, K. A., Barleycorn, A. A., Allen, J. B., Bassos-Hull, K., Lovewell, G., Boyd, D., Panike, A., Cush, C., Fauquier, D., Mase, B., Lacy, R. C., Greenfield, M. R., Rubenstein, D. I., Weaver, A., Stone, A., Oliver, L., Morse, K., & Wells, R. S. (2021). Staying Alive: Long-Term Success of Bottlenose Dolphin Interventions in Southwest Florida. Frontiers in Marine Science, 7.
Moore, M., Early, G., Touhey, K., Barco, S., Gulland, F., & Wells, R. (2007). Rehabilitation And Release Of Marine Mammals In The United States: Risks And Benefits. Marine Mammal Science, 23(4), 731–750.
Bossart, G. D. (2010). Marine Mammals as Sentinel Species for Oceans and Human Health. Veterinary Pathology, 48(3), 676–690.
Bogomolni, A., Pugliares, K., Sharp, S., Patchett, K., Harry, C., LaRocque, J., Touhey, K., & Moore, M. (2010). Mortality trends of stranded marine mammals on Cape Cod and southeastern Massachusetts, USA, 2000 to 2006. Diseases of Aquatic Organisms, 88, 143–155.
McFee, W. E., & Lipscomb, T. P. (2009). Major Pathologic Findings And Probable Causes Of Mortality In Bottlenose Dolphins Stranded In South Carolina From 1993 To 2006. Journal of Wildlife Diseases, 45(3), 575–593.
Sanderson, C. E., & Alexander, K. A. (2020). Unchartered waters: Climate change likely to intensify infectious disease outbreaks causing mass mortality events in marine mammals. Global Change Biology, 26(8), 4284–4301.
Taubenberger, J. K., Tsai, M.m Krafft, A. E., Lichy, J. H., Reid, A. H., Schulman, F. Y. & Lipscomb, T. P. (1996). Two morbilliviruses implicated in bottlenose dolphin epizootics. Emerging Infectious Diseases, 2(3), 213-216.
Whatmore, A. M., Dawson, C. E., Groussaud, P., Koylass, M. S., King, A. C., Shankster, S. J., Sohn, A. H., Probert, W. S., & McDonald, W. L. (2008). Marine mammal Brucella genotype associated with zoonotic infection. Emerging Infectious Diseases, 14(3), 517-518.
Becker, P. R. (2000). Concentration of Chlorinated Hydrocarbons and Heavy Metals in Alaska Arctic Marine Mammals. Marine Pollution Bulletin, 40(10), 819–829.
Fair, P. A., Mitchum, G., Hulsey, T. C., Adams, J., Zolman, E., McFee, W., Wirth, E., & Bossart, G. D. (2007). Polybrominated Diphenyl Ethers (PBDEs) in Blubber of Free-Ranging Bottlenose Dolphins (Tursiops Truncatus) from Two Southeast Atlantic Estuarine Areas. Archives of Environmental Contamination and Toxicology, 53(3), 483–494.
Lee, K., Alava, J. J., Cottrell, P., Cottrell, L., Grace, R., Zysk, I., & Raverty, S. (2022). Emerging Contaminants and New POPs (PFAS and HBCDD) in Endangered Southern Resident and Bigg’s (Transient) Killer Whales (Orcinus orca): In Utero Maternal Transfer and Pollution Management Implications. Environmental Science & Technology, 57(1), 360–374.
Noël, M., & Brown, T. M. (2021). Contaminants as a Conservation Threat to Marine Mammals. Wildlife Biodiversity Conservation, 401–420.
Colborn, T., & Smolen, M.J.(2003). Cetaceans and contaminants. In Vos, J. G., Bossart, G. D., Fournier, M., & O’Shea, T. (Eds.). Toxicology of Marine Mammals (pp. 291-232). Taylor & Francis, London.
Murphy, S., Pierce, G. J., Law, R. J., Bersuder, P., Jepson, P. D., Learmonth, J. A., Addink, M., Dabin, W., Santos, M. B., Deaville, R., Zegers, B. N., Mets, A., Rogan, E., Ridoux, V., Reid, R. J., Smeenk, C., Jauniaux, T., López, A., Alonso Farré, J. M., & González, A. F. (2010). Assessing the effect of persistent organic pollutants on reproductive activity in common dolphins and harbour porpoises. Journal of Northwest Atlantic Fishery Science, 42, 153–173.
Ross, P. S. (2002). The Role of Immunotoxic Environmental Contaminants in Facilitating the Emergence of Infectious Diseases in Marine Mammals. Human and Ecological Risk Assessment: An International Journal, 8(2), 277–292.
Tanabe, S. (2002). Contamination and toxic effects of persistent endocrine disrupters in marine mammals and birds. Marine Pollution Bulletin, 45(1-12), 69–77.
Fire, S. E., Wang, Z., Byrd, M., Whitehead, H. R., Paternoster, J., & Morton, S. L. (2011). Co-occurrence of multiple classes of harmful algal toxins in bottlenose dolphins (Tursiops truncatus) stranding during an unusual mortality event in Texas, USA. Harmful Algae, 10(3), 330–336.
Häussermann, V., Gutstein, C. S., Bedington, M., Cassis, D., Olavarria, C., Dale, A. C., Valenzuela-Toro, A. M., Perez-Alvarez, M. J., Sepúlveda, H. H., McConnell, K. M., Horwitz, F. E., & Försterra, G. (2017). Largest baleen whale mass mortality during strong El Niño event is likely related to harmful toxic algal bloom. PeerJ, 5, e3123.
Miller, M. A., Kudela, R. M., Mekebri, A., Crane, D., Oates, S. C., Tinker, M. T., Staedler, M., Miller, W. A., Toy-Choutka, S., Dominik, C., Hardin, D., Langlois, G., Murray, M., Ward, K., & Jessup, D. A. (2010). Evidence for a Novel Marine Harmful Algal Bloom: Cyanotoxin (Microcystin) Transfer from Land to Sea Otters. PLoS ONE, 5(9), e12576.
Smith, J., Cram, J. A., Berndt, M. P., Hoard, V., Shultz, D., & Deming, A. C. (2023). Quantifying the linkages between California sea lion (Zalophus californianus) strandings and particulate domoic acid concentrations at piers across Southern California. Frontiers in Marine Science, 10.
Laist, D. W., Knowlton, A. R., Mead, J. G., Collet, A. S., & Podesta, M. (2001). COLLISIONS BETWEEN SHIPS AND WHALES. Marine Mammal Science, 17(1), 35–75.
Schoeman, R. P., Patterson-Abrolat, C., & Plön, S. (2020). A Global Review of Vessel Collisions With Marine Animals. Frontiers in Marine Science, 7.
Calleson, C., & Kipp Frohlich, R. (2007). REVIEW: Slower boat speeds reduce risks to manatees. Endangered Species Research, 3, 295–304.
Wells, R. S., & Scott, M. D. (1997). Seasonal Incidence Of Boat Strikes On Bottlenose Dolphins Near Sarasota, Florida. Marine Mammal Science, 13(3), 475–480.
Cassoff, R., Moore, K., McLellan, W., Barco, S., Rotstein, D., & Moore, M. (2011). Lethal entanglement in baleen whales. Diseases of Aquatic Organisms, 96(3), 175–185.
When I moved to Oregon to begin my PhD, I pictured long days on the water watching gray whales feed and travel along the coast. That does happen, and it is as incredible as I imagined. But I have learned that studying cetaceans is about much more than observing whales. It is also about people: how cultures – past and present – perceive these animals and share space with them.
In addition to marine mammals, I have always loved history and geography. Now, as I start my work with the GRANITE Project in the GEMM Lab, I find myself thinking about how these relationships between humans and whales unfold across time and space. In this post, I want to share a few examples of how whales have shaped human traditions for hundreds, even thousands of years, across societies that have never crossed. Then I will discuss how our research fits into this larger picture of human–cetacean connections.
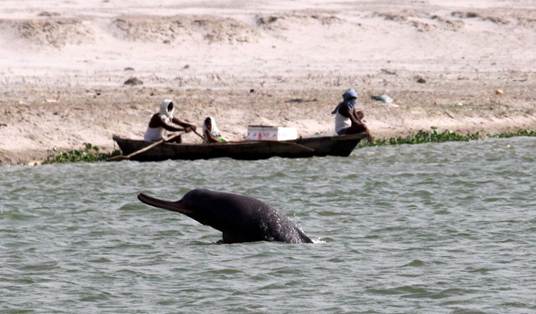
Our journey begins in India, where the Ganges River dolphin inhabits a river that millions of people consider sacred. Its presence has long been linked to the health of the river, giving the species spiritual and cultural significance. Over the past century, the river’s ecological integrity has declined due to pollution, altered flow, and habitat disturbances, and this has caused the dolphin population to diminish1, 2. Conservation efforts that improve water quality, restore natural flow, and reduce disturbances not only help the dolphin recover but also protect the river and the human communities that rely on it1, 2. In this way, cultural reverence for the dolphin drives conservation measures that benefit both people and ecosystems1, 2.
From there we move to Aotearoa, New Zealand, where Māori tradition speaks of tohorā, or whales, as guardians and ancestors3. They appear in ancestral stories as guides and protectors, and whale strandings have historically brought communities together in collective response. The Māori principles of kaitiakitanga, or guardianship, continue to shape marine conservation decisions today, guiding policies that integrate ecological and cultural values4. Here, whales are not seen as resources. They are part of a living genealogy that binds people to the sea and the life it sustains. In fact, team members of the SAPPHIRE project in the GEMM lab frequently engage with multiple iwi (Māori tribes) across Aotearoa through hui (meetings) where knowledge, stories, and culture are shared about blue whales and their ecosystem.
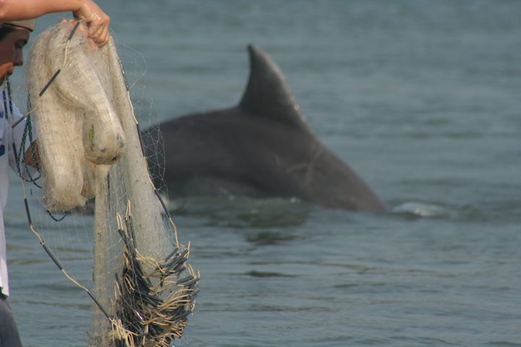
Traveling nearly to the antipodes, we arrive on the Atlantic coast of Brazil, in the town of Laguna, where an extraordinary partnership has endured for centuries. Artisanal fishers work alongside bottlenose dolphins, who drive schools of fish toward the shore and signal the right moment to cast the nets5, 6, 7. This cooperation benefits both species, and the knowledge behind it is passed down through generations of humans and dolphins through observation and shared practice5, 6, 7. It is a powerful example of how species can learn from one another, creating connections that challenge the idea of humans and wildlife as competitors and showing the potential for collaboration across species5, 6, 7. The LABIRINTO Lab in MMI has studied this interspecific relationship for decades, helping us learn about the patterns and endurance of these cultures.
PELD-SELA: Long-term ecological project on the Laguna Estuarine System and Adjacent Areas Projects. (n.d.). https://thelabirinto.com/projects1/
At the top of the Americas, in the Arctic, Inuit communities have hunted bowhead whales for thousands of years. These hunts are not only a source of food but also form the foundation of cultural identity and social life8. Knowledge of the ice, weather, and whale behavior is passed down through generations, and the hunt itself is embedded in ceremonies and practices that sustain the community8. Today, these traditions continue under strict quotas set through international agreements, carefully balancing cultural continuity with conservation9. The MMBEL lab in MMI studies the communication and ecology of bowhead whales to support the survival of this iconic species and the culture of Inuit people.
Emory Kristoff, National Geographic
Finally, our journey brings us to Oregon, where gray whales feed along a coastline rich with reefs, kelp beds, and sandy bottoms. These waters support a variety of human activities, from commercial fishing to recreation, creating risks such as entanglement, vessel strikes, and disturbance10, 11. Even well-intentioned actions like whale watching can cause harm if not carefully managed12, 13. Around the world, many communities have shifted from whaling to whale watching, transforming former hunting grounds into tourism destinations. While this is a positive change, it still requires monitoring. Noise can stress whales, boats can disrupt their behavior, and too much interaction can alter natural feeding and social patterns12, 13. In Oregon, research on gray whale habitat use and feeding home ranges helps inform management and conservation14.
Tradewind Charters Whale Watching and Fishing
This is where project GRANITE, Gray whale Response to Ambient Noise Informed by Technology and Ecology, comes in15. The project studies how whales respond to human activities by using drones to monitor health and behavior, photo-ID to track individuals, prey mapping to understand feeding choices, and acoustic recorders to capture the soundscape15, 16, 17. Equally important is collaborating directly with fishers and resource managers to reduce risks and develop solutions that benefit both whales and people. Healthy whale populations support communities too, through ecotourism, cultural continuity, education, and the ecological services whales provide. Conservation is reciprocal: caring for whales strengthens the ocean systems that sustain us all.
The tools and techniques developed by GRANITE, including drones, acoustic monitoring, and prey mapping, are not limited to Oregon. They can be applied globally, contributing to the protection of cetaceans in diverse habitats15. In this way, Oregon becomes more than the final stop on our tour. It is a place where centuries of human–whale relationships, lessons from around the world, and modern science converge. These examples across the world remind us that conservation is about more than preventing harm. It is about fostering a future where humans and whales thrive together, as they have shared the ocean for millennia.
Did you enjoy this blog? Want to learn more about marine life, research, and conservation? Subscribe to our blog and get a monthly message when we post a new blog. Just add your name and email into the subscribe box below.
References
1 Sinha, R. K., & Kannan, K. (2014). Ganges river dolphin: An overview of biology, ecology, and conservation status in India. AMBIO, 43(8), 1029–1046. https://doi.org/10.1007/s13280-014-0534-7
4 McAllister, T., Hikuroa, D., & Macinnis‑Ng, C. (2023). Connecting science to Indigenous knowledge: Kaitiakitanga, conservation, and resource management. New Zealand Journal of Ecology, 47(1), 3521. https://doi.org/10.20417/nzjecol.47.3521
5 Simões‑Lopes, P. C., Fabián, M. E., & Menegheti, J. O. (1998). Dolphin interactions with the mullet artisanal fishing on southern Brazil: A qualitative and quantitative approach. Revista Brasileira de Zoologia, 15(3), 709–726. https://doi.org/10.1590/S0101-81751998000300008
6 Daura Jorge, F. G., Cantor, M., Ingram, S. N., Lusseau, D., & Simões Lopes, P. C. (2012). The structure of a bottlenose dolphin society is coupled to a unique foraging cooperation with artisanal fishermen. Biology Letters, 8(5), 702–705. https://doi.org/10.1098/rsbl.2012.0174
7 Cantor, M., Farine, D. R., & Daura‑Jorge, F. G. (2023). Foraging synchrony drives resilience in human–dolphin mutualism. Proceedings of the National Academy of Sciences, 120(6), e2207739120. https://doi.org/10.1073/pnas.2207739120
8 Jensen, A. M. (2012). The material culture of Iñupiat whaling: An ethnographic and ethnohistorical perspective. Arctic Anthropology, 49(2), 143–161. https://doi.org/10.1353/arc.2012.0020
10 Derville, S., Buell, T. V., Corbett, K. C., Hayslip, C., & Torres, L. G. (2023). Exposure of whales to entanglement risk in Dungeness crab fishing gear in Oregon, USA. Biological Conservation, 281, 109989. https://doi.org/10.1016/j.biocon.2023.109989
11 Silber, G. K., Weller, D. W., Reeves, R. R., Adams, J. D., & Moore, T. J. (2021). Co‑occurrence of gray whales and vessel traffic in the North Pacific Ocean. Endangered Species Research, 44, 177–201. https://doi.org/10.3354/esr01093
12 Sullivan, F. A., & Torres, L. G. (2018). Assessment of vessel disturbance to gray whales to inform sustainable ecotourism. Journal of Wildlife Management, 82(5), 896–905. https://doi.org/10.1002/jwmg.21462
13 Sprogis, K. R., Videsen, S., & Madsen, P. T. (2020). Vessel noise levels drive behavioural responses of humpback whales with implications for whale‑watching. eLife, 9, e56760. https://doi.org/10.7554/eLife.56760
14 Lagerquist, B. A., Palacios, D. M., Winsor, M. H., Irvine, L. M., Follett, T. M., & Mate, B. R. (2019). Feeding home ranges of Pacific Coast Feeding Group gray whales. Journal of Wildlife Management, 83(4), 925–937. https://doi.org/10.1002/jwmg.21642
16 Pirotta, E., Bierlich, K. C., New, L., Bird, C. N., Fernandez Ajó, A., Hildebrand, L., Buck, C. L., Hunt, K. E., Calambokidis, J., & Torres, L. G. (2025). Body size, nutritional state and endocrine state are associated with calving probability in a long‑lived marine species. Journal of Animal Ecology. Advance online publication. https://doi.org/10.1111/1365-2656.70068
17 Bierlich, K. C., Kane, A., Hildebrand, L., Bird, C. N., Fernandez Ajó, A., Stewart, J. D., Hewitt, J., Hildebrand, I., Sumich, J., & Torres, L. G. (2023). Downsized: Gray whales using an alternative foraging ground have smaller morphology. Biology Letters, 19(7), 20230043. https://doi.org/10.1098/rsbl.2023.0043
This summer, Rep. Nick Begich of (R-AK), submitted a draft bill that proposes to roll back key features of the 1972 U.S. Marine Mammal Protection Act (MMPA). The MMPA has been the centerpiece legislation protecting whales, dolphins, sea otters, manatees, polar bears and seals for over 50 years, bringing many species back from the brink of extinction and setting a benchmark that has been replicated worldwide. Among the changes proposed, the draft bill explicitly bars the use of the precautionary principle in marine mammal management. For example, the draft bill includes these changes:
changing wording from “has the potential to injure/disturb” to “injures or disturbs” when considering threats that need to be mitigated.
instead of managing marine mammal populations to “result in maximum productivity”, the draft bill would manage species at the size “necessary to support the continued survival”.
The draft bill also includes changes to how allowable levels of injury and mortality to marine mammal populations (called a “take”) in the MMPA are calculated. Until now, these take levels were calculated using safety factors that correct for scientific uncertainty and bias. The proposal removes these safety factors, which would essentially increase the number of allowable takes from each population before management intervention is required. The proposed changes also require a much higher burden of proof before populations can be considered “depleted” or “strategic”, which are identifiers that trigger conservation action.
Proponents of the draft bill say the current MMPA has been too precautionary, unnecessarily increasing burdens on fishers and other resource users. Here, I argue that the precautionary principle is not a subjective judgement that favors marine mammals over people’s livelihoods. Instead, it is a rational decision-making tool, essential for making management decisions when information is uncertain.
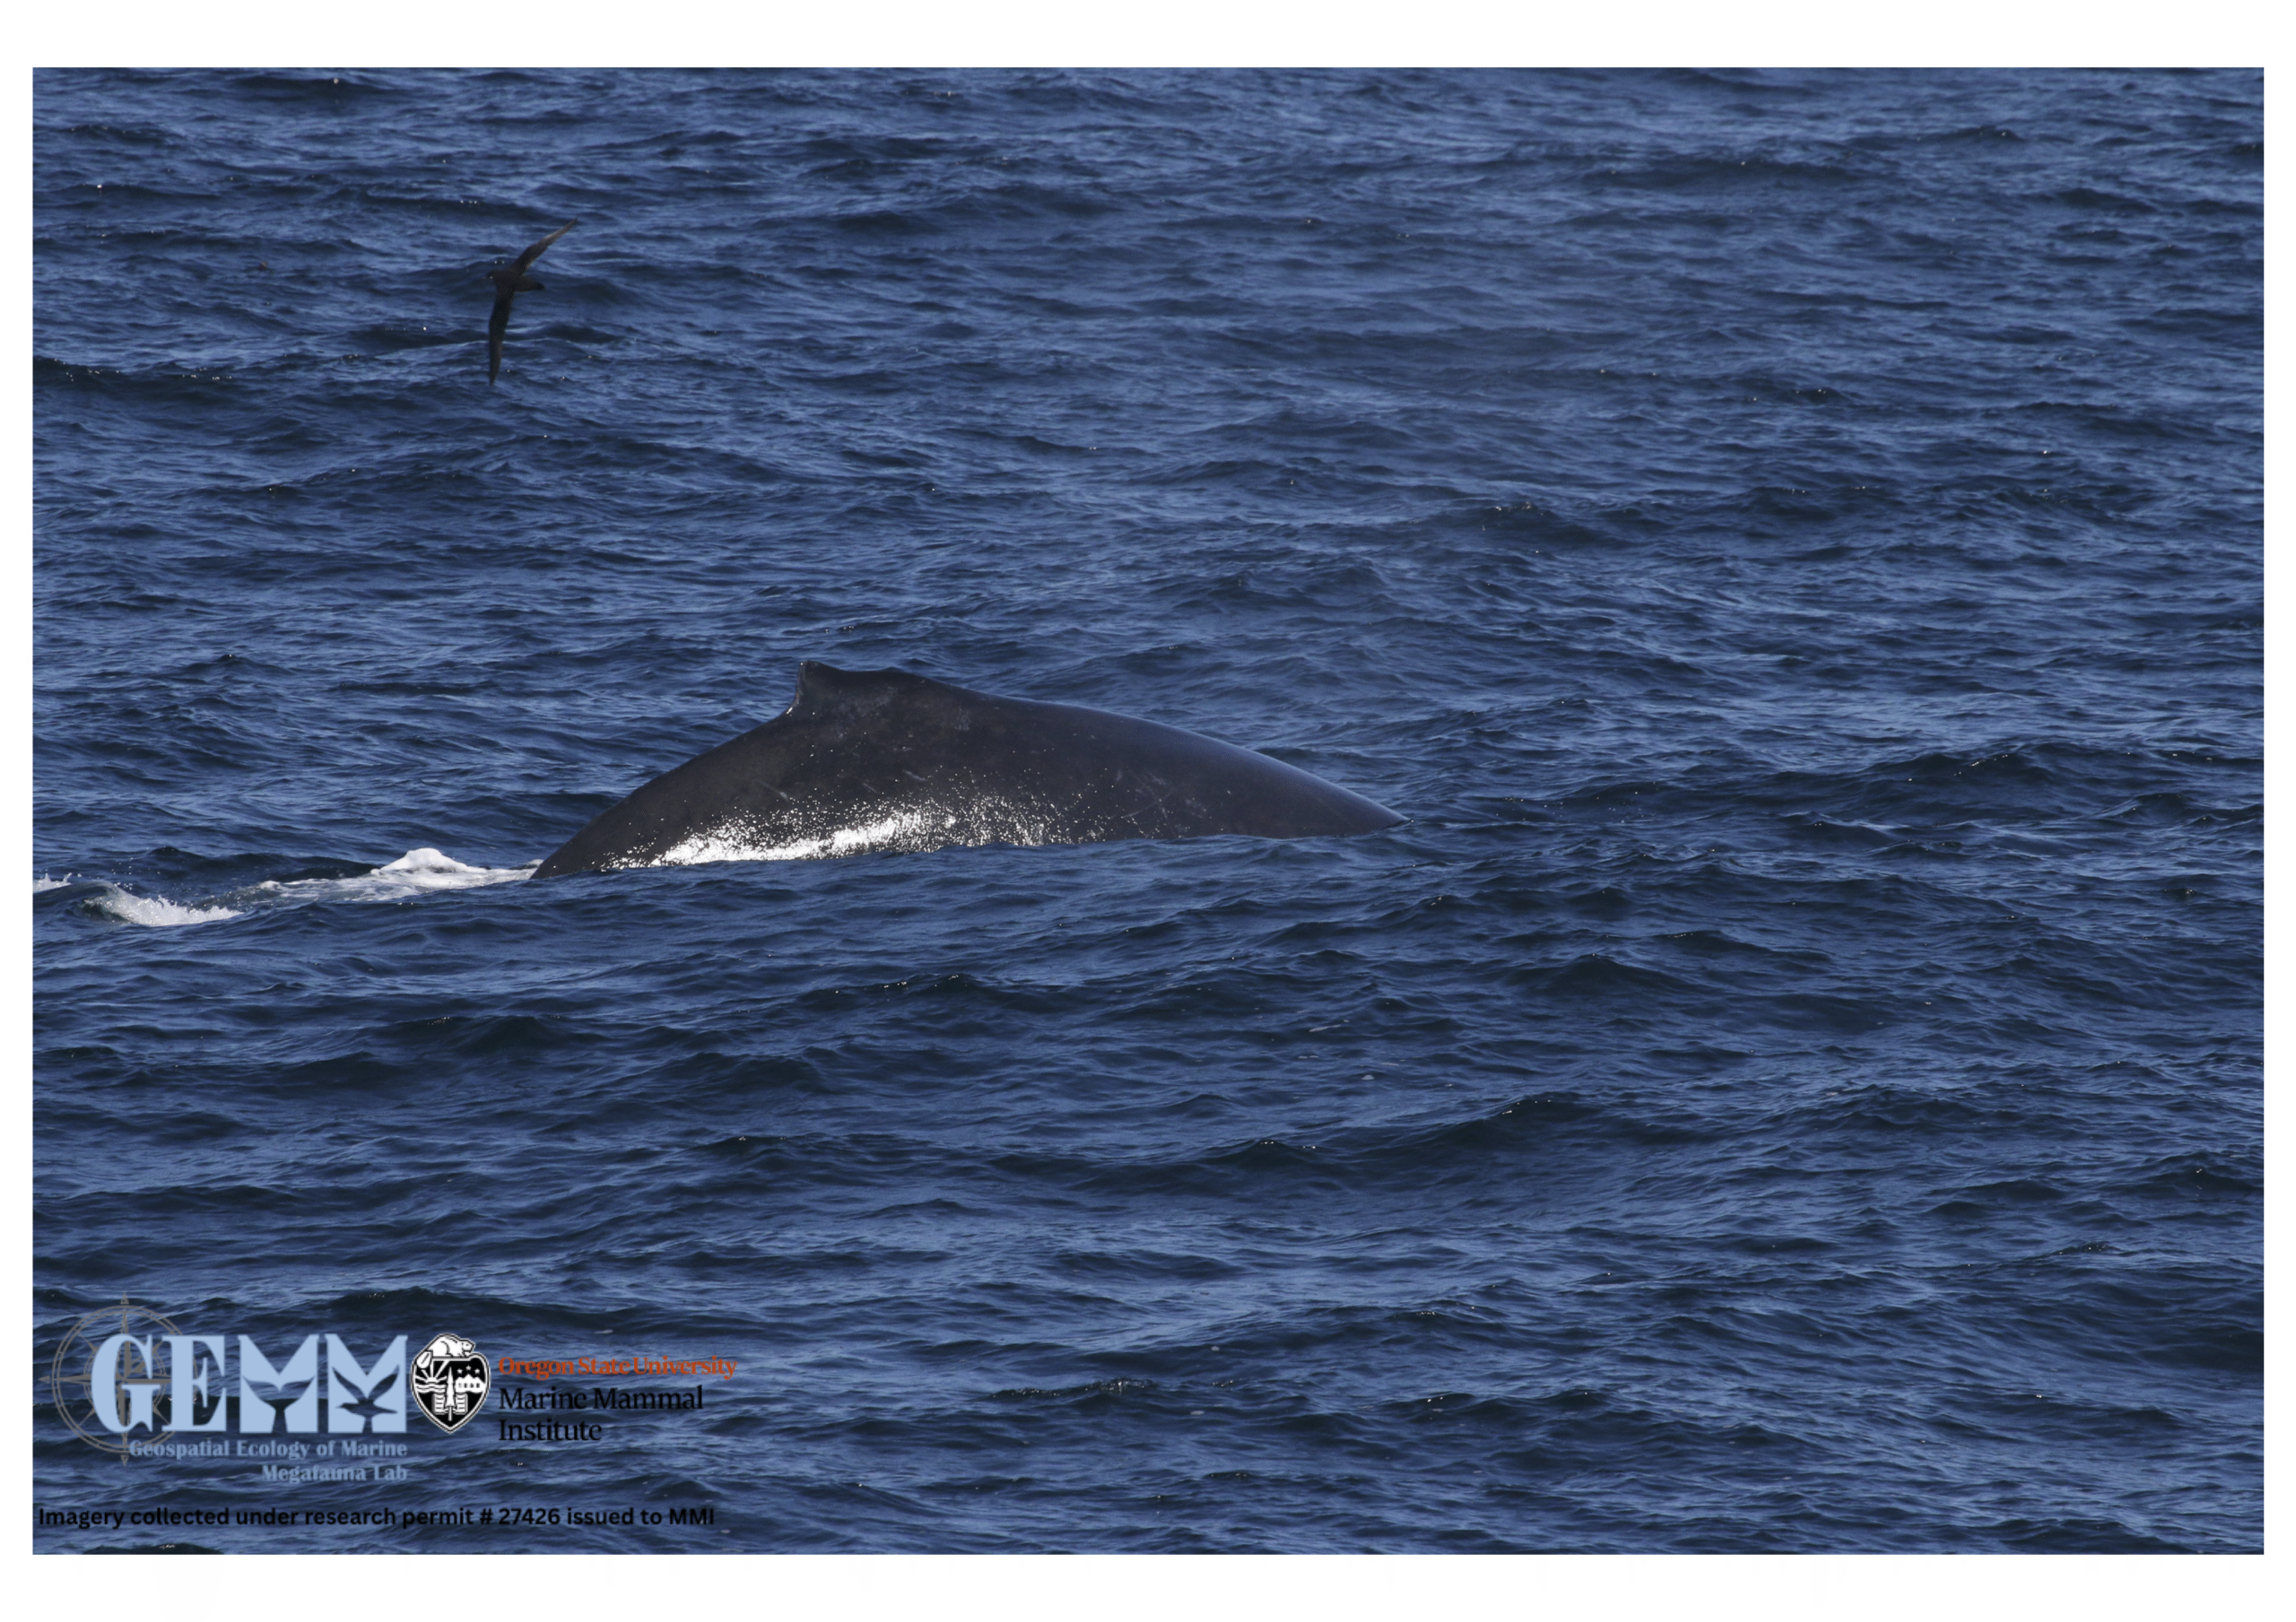
A humpback whale (Megaptera novaeangliae) surfaces during a recent research survey. Humpback whales along the U.S. West Coast have increased in abundance since the end of commercial whaling and MMPA protections. Imagery collected under research permit #27426 issued to MMI.
What is the precautionary principle?
In practice, it means that a lack of data or uncertainty in statistical estimates or trends should not be used as an excuse for inaction in the face of a valid threat (Raffensperger and Tickner, 1999). Instead, decision-makers should incorporate “safety factors” that account for limited knowledge or imperfect science. As said by Holt and Talbot (1978), “the magnitude of the safety factor should be proportional to the magnitude of risk.” So, if the goal is to prevent extinction, severely depleted populations may require bigger safety factors than healthy populations.
How does the U.S. MMPA apply the precautionary principle?
During the first few decades the MMPA, actions to protect marine mammals were primarily reactionary, in response to highly publicized issues like the dolphin-tuna problem (Taylor et al., 2000). Conservation actions were supposed to be triggered when scientists detected a declining trend in a population’s abundance, but obtaining precise estimates of population size is notoriously difficult for marine mammals. The amount of data required to prove a population was declining due to human activities was so high that protection was continually stalled due to uncertainty in statistical trends (e.g., Marine Mammal Commission 1982; Wade 1993; Taylor et al., 2000).
In 1994, the U.S. MMPA was amended, implementing a new way to determine which marine mammal populations were at risk. Instead of requiring a statistical trend in population abundance, the new method calculates the number of sustainable takes without putting the population at risk of decline. The 1994 amendments also explicitly applied the precautionary principle by incorporating safety factors into this calculation of this number of allowable takes, known as the Potential Biological Removal (PBR; Wade 1998), which increases the likelihood that the management goals stated by the MMPA are achieved (Taylor et al., 2000).
Three reasons why the precautionary principle matters:
1. It accounts for uncertainty and potential bias
Consider air travel for a moment: Given the uncertainty in the amount of time it takes to arrive at the airport (e.g., traffic, parking) and the unknown possibilities for extra delays once there (e.g., security), most travelers shoot for airport arrival times significantly earlier than the flight boards. However, what if instead of an exact flight time, you are told the plane leaves sometime between 9 and 11 am? Also, although you have some experience travelling, you have never used this particular airport, and you have no idea how long security and check-in might take. Given these hypothetical circumstances, how would you plan your travel?
When applying marine mammal science to management goals, decision-makers must contend with a similarly uncertain set of information. Marine mammals are wide-ranging and spend most of their lives underwater, making them particularly challenging to study. It is impossible to get exact estimates of population size for these animals, and even the best designed research produces abundance estimates with significant levels uncertainty (e.g., Taylor et al., 2000; Taylor et al. 2007). After decades of researching marine mammals, we also still have significant knowledge gaps about their population dynamics, space-use, and behaviors.
Currently, the MMPA accounts for scientific uncertainty by using minimum estimated population size (the lower 20th percentile) when calculating sustainable levels of human takes (Wade 1998; Taylor et al. 2000). This safety factor makes it more likely that calculations of allowable takes are at or below safe levels (Wade 1998; Taylor et al. 2000).
Relating back to the airport example, if you were told your flight could leave between 9 and 11 am, using minimum population size (instead of the maximum or center of the estimate) is analogous to planning for the flight to leave closer to 9 am. However, you still need to add in time for extra factors that may cause other possible delays in addition to the uncertain departure time.
So, in addition to minimum population size, the MMPA also uses another safety factor in its calculation of allowable takes, called the recovery factor (FR). FR scales the number of allowable takes relative to the level of risk to the population and the potential for biased or uncertain information (Wade 1998; Taylor et al. 2000). A lower FR is given to depleted, high risk populations, while FR can be increased for well-studied populations at lower risk (Wade 1998; Taylor et al. 2000). In the travel analogy, FR is the amount of padding needed to ensure a passenger makes their flight, accounting for potentially unknown security lines and traffic.
2. It incentivizes the public and industry to collect more data to “fine-tune” management
The more experienced you are with a particular airport and the more certain you are of the departure time, the more confident you can be in your travel plans. If you know the plane leaves at 10 am, and security takes 15 minutes, you don’t need to add nearly as much extra travel time as if your travel details were more uncertain.
Importantly, as the scientific knowledge of a population increases, the magnitude of the safety factors in the calculation of allowable mortalities decreases. For example, as the number of surveys of a population increases and an abundance estimate gets more precise, the range of the abundance estimate gets smaller. So, getting a more precise abundance estimate is like changing your uncertain flight time from being between 9 – 11 am, to being between 9:30 – 10 am. While you still have some uncertainty, you can be confident that leaving a little later than originally planned would be ok.
Since better knowledge results in more targeted management, both the public and industry are motivated to invest in continued research. Fine-tuning management means that necessary precautions can be kept, but unnecessary burdens on industries are removed. Ultimately, the strategy of a precautionary approach is to “act now, fine-tune later,” instead of “delay action until we get detailed information.” In addition to potentially delaying urgent action, the latter approach also disincentivizes industry to invest in research or develop solutions. As explained below, delaying conservation due to uncertainty has led to past pitfalls in marine mammal conservation, necessitating the need for a more proactive approach.
3. It prevents unnecessary delays in conservation action
If you had an important flight to catch on Wednesday, but did not know the departure time, would you decide to not go to the airport at all? Would it be worth it to just get to the airport early, or would you wait at home for more information, but at the risk of missing your flight?
The choice to not act at all in the face of uncertain data is inherently risky. For the first couple of decades of the MMPA, managers attempted to prove a population was declining before conservation action could be taken. The problem is, determining population trends of marine mammals with any certainty can take decades (Taylor and Gerrodette, 1993; Wade 1993; Taylor et al., 2000). In the case of some species, by the time scientists have the statistical power to detect a trend, the population could already be in a catastrophic decline. For example, in the case of eastern tropical Pacific dolphins killed as bycatch by the tuna industry during the 1970s, proving their population decline led to a 14-year protection delay from the first abundance estimate of the population (Wade et al., 1994; Taylor et al., 2000).
The purpose of the 1994 MMPA amendments was to correct for these unnecessary delays that required extensive amounts of data (Taylor et al. 2000). Instead of requiring population trend data, the MMPA now uses values that are much easier to obtain — population size and maximum population growth rates (Wade 1998). From these, the number of individuals that can sustainably be removed from the population (PBR) can be calculated. This approach is a much faster and simpler method, allowing for quick action if estimated mortality (e.g., numbers of animals killed or injured) is higher than this calculated threshold (PBR).
Lastly, the precautionary principle assumes that if a threat is valid, it should be considered, even if the effects are not 100% proven yet. This approach is essential for marine mammals, where anthropogenic injuries and mortality are not always easily detected or recorded. In the case of ship strikes and fisheries entanglement, many individuals disappear before their deaths or injuries are recorded (e.g., Cassoff et al., 2011; Pace et al. 2021). Other threats, like the effects of sound and chemical pollution, may require long-term monitoring to fully understand their population-level impacts. By using language like “has the potential to injure,” management can be implemented more proactively, allowing for research to continue, but not at the detriment of population health during the lengthy time it can take to establish statistical certainty.
Final thoughts
The precautionary principle is a way of dealing with the fact that good science can cost precious time. Results rarely give “yes or no” answers and clear-cut solutions. Instead, decision-makers must weigh study design, statistical power, and the precision (i.e., uncertainty) of scientific findings. The precautionary principle provides a framework for how to effectively use science to make decisions, increasing the likelihood that management plans meet their goals.
If this blog makes you concerned about the future of the precautionary principle in the U.S. MMPA:
Write to your congressional representatives letting them know you oppose the draft bill.
Did you enjoy this blog? Want to learn more about marine life, research, and conservation? Subscribe to our blog and get a monthly message when we post a new blog. Just add your name and email into the subscribe box below.
Pace, R.M., Williams, R., Kraus, S.D., Knowlton, A.R., Pettis, H.M. (2021). Cryptic mortality of North Atlantic right whales. Conservation Science and Practice, 3: e346.
Raffensperger C, Tickner J, eds. (1999). Protecting Public Health and the Environment: Implementing the Precautionary Principle. Washington, DC: Island Press.
Taylor, B. L., & Gerrodette, T. (1993). The Uses of Statistical Power in Conservation Biology: The Vaquita and Northern Spotted Owl. Conservation Biology, 7(3), 489–500.
Taylor, B. L., Wade, P. R., de Master, D. P., & Barlow, J. (2000). Incorporating uncertainty into management models for marine mammals. Conservation Biology, 14(5), 1243–1252.
Taylor, B. L., Martinez, M., Gerrodette, T., Barlow, J., & Hrovat, Y. N. (2007). Lessons From Monitoring Trends in Abundance of Marine Mammals. Marine Mammal Science, 23(1), 157–175.
Wade, P. R. (1993). Estimation of historical population size of the eastern spinner dolphin (Stenella longirostris orientalis). Fishery Bulletin, United States 91:775–787.
Wade, P. R. (1994). Abundance and population dynamics of two eastern Pacific dolphins, Stenella attenuata and Stenella longirostris orientalis. Ph.D. dissertation. Scripps Institution of Oceanography, University of California, San Diego.
Wade, P. R. (1998). Calculating limits to the allowable human-caused mortality of cetaceans and pinnipeds. Marine Mammal Science, 14(1), 1–37.
Alana Cary, St. Mary’s College of Maryland Undergraduate in Marine Science, 2026 NSF REU and GEMM Lab SAPPHIRE Project Intern
Hello everyone! My name is Alana Cary, and I was one of the NSF REU interns with the GEMM Lab this summer. I am currently in my senior year at St. Mary’s College of Maryland (SMCM), where I study Marine Science. Growing up along the Chesapeake Bay, I was always captivated by the connection between people and marine ecosystems. That curiosity led me to pursue marine mammal ecology, and this summer I had the amazing opportunity to travel across the country and dive into bioacoustics research with the GEMM Lab at Oregon State University’s Hatfield Marine Science Center.
My project, Daily Diel Ins: Investigating Diel and Seasonal Calling Patterns of New Zealand Blue Whales, explored how the world’s largest animals use sound over the course of the day and throughout the year. Working under the mentorship of Dawn Barlow and Leigh Torres, I spent ten weeks immersed in whale calls, coding, and a lot of matcha (shoutout to RISE cafe!).
Figure 1. Picture of me (Alana C) at Devils Punchbowl my first week in Oregon.
Why study whale voices?
Blue whales (Balaenoptera musculus) are record-breakers: the largest animals to have ever lived, producers of the loudest biological sounds, and yet, surprisingly elusive. They spend most of their lives far beneath the surface, only surfacing briefly to breathe. This lifestyle makes them difficult to study visually. But blue whales leave behind something extremely powerful — their voices.
Baleen whales rely heavily on low-frequency sounds to forage, navigate, and communicate across vast distances (Clark & Ellison 2004). New Zealand blue whales are unique since they produce a distinct regional song (Torres et al. 2013; Barlow et al. 2018), and their calls provide insight into both foraging and reproductive behavior.
Blue whales produce two main call types (Figure 3):
Songs – long, stereotyped sequences produced by males, likely used in reproduction and communication.
D calls – short, frequency-modulated downsweeps produced by both sexes, often linked to foraging or social behavior.
Previous research has described the seasonal calling patterns of New Zealand blue whales (Barlow et al. 2023), but until now, diel (day–night) patterns had not been studied. This is important because blue whales’ primary prey, krill, perform diel vertical migration (DVM) in many parts of the ocean — ascending at night and descending during the day. If whale calls are tied to foraging or social interactions, they might vary depending on these light-driven prey movements.
Listening to giants: methods and workflow
Figure 2. Map of Rockhopper hydrophone deployments in the South Taranaki Bight, New Zealand. Stars mark the Rockhopper east (RH-east) and west (RH-west) recording sites. Bathymetric contours are drawn at 100 m intervals.
My study focused on the South Taranaki Bight (STB), a productive upwelling region between New Zealand’s North and South Islands. The STB supports a unique population of blue whales year-round, providing foraging and reproductive opportunities (Torres et al. 2013; Barlow et al. 2018), but it is also an area with heavy human activity, including shipping, oil and gas, and fishing. Understanding when and how whales call here helps identify times of overlap with disturbance.
Here’s how I studied their voices:
Hydrophones in the field – We used Rockhopper autonomous hydrophones, which are compact devices designed to record low-frequency sound for long periods (Klinck et al. 2020). These instruments collected a year of acoustic data in the STB (January 2024–January 2025).
Manual annotation – From this massive dataset, one day was randomly selected from every two weeks (24 days total) and I manually annotated spectrograms of songs and D calls in Raven Pro. I identified songs in the 0–75 Hz band and D calls up to 150 Hz, following published criteria.
Machine learning classification – These manual annotations were used to evaluate a BirdNET machine learning model (Kahl et al. 2021) trained to detect whale calls. The model then predicted calls across the entire year-long dataset.
Validation – Because D calls are harder to classify, I manually reviewed all predicted D calls to remove false positives. Song detections, which had extremely high precision and recall, were kept without this extra step.
Binning into diel phases – I aggregated call detections by hour and used the suncalc R package (Thieurmel et al. 2022) to assign diel phases (day or night). I also grouped calls by month and season to evaluate seasonal trends.
Statistics in RStudio – To test whether month, diel phase, or their interaction influenced call rates, I ran two-way ANOVAs with post hoc Tukey’s HSD tests for pairwise comparisons
Figure 3. A spectrogram showing two distinct call types produced by New Zealand blue whales. The green box highlights the repetitive, low-frequency song, while the blue box highlights a short, frequency-modulated D call. Time is on the x-axis (hh:mm:ss) and frequency (Hz) on the y-axis
Results: different rhythms for different calls
The results revealed that songs and D calls follow very different patterns.
Songs – Seasonal, weakly diel:
Songs showed strong seasonal variation, peaking in late summer and autumn (February–May).
Diel effects were weaker but significant: slightly more daytime calling, consistent across months.
This suggests that songs are driven mainly by reproductive cycles, not daily light cues.
Figure 4. Monthly variation in New Zealand blue whale song detections from January 2024 to January 2025, separated by diel phase (day vs. night). Songs peaked in late summer and autumn, consistent with reproductive timing. Diel differences were minimal, with slightly more daytime calling
D calls – Both seasonal and diel:
D calls showed highly significant effects of month, diel phase, and their interaction.
Calling rates peaked in spring and summer, with more D calls during daytime hours.
The diel effect varied by month: some months showed strong differences between day and night, while others showed none.
This suggests that D calls track foraging, responding to increased krill availability during spring and summer months, and krill’s diel vertical migration
Figure 5. Monthly variation in New Zealand blue whale D call detections from January 2024 to January 2025, separated by diel phase (day vs. night). Peaks occur during spring and summer, with more daytime calling during these seasons. This pattern suggests D calls are closely tied to foraging opportunities on krill.
Why does this matter?
Understanding when whales call is more than an academic exercise. The South Taranaki Bight is not only an important whale habitat, it’s also a busy human space. By identifying when whales are most acoustically active, we can better understand potential conflicts with anthropogenic noise from shipping or industrial activities. For example, the fact that daytime D calls peak in spring and summer, times of high foraging effort, means that increased vessel noise during these periods could disrupt critical feeding-related communication. This kind of fine-scale temporal knowledge can inform management strategies to reduce human impacts on a vulnerable whale population. These insights also feed into the GEMM Lab’s SAPPHIRE project goal: linking oceanography, prey dynamics, physiology, and acoustics to understand how blue whales respond to a rapidly changing ocean (Barlow & Torres, 2021; Barlow et al., 2023).
Reflections on my REU journey
When I first arrived at Hatfield, I had never worked with passive acoustic data before. At first, spectrograms just looked like fuzzy TV static. But every day I learned to trust the process. Soon, I was able to fly through annotations and recognize calls without even seeing them on the spectrogram— just listening. I remember creating my plots and seeing the clear diel patterns, I couldn’t help but grin.
Figure 6. Dawn, Leigh, and I at the Coastal Intern symposium after I finished presenting my final research poster.
There were some moments that were frustrating as well, like when my entire selection table would delete and I’d have to start over, or debugging the same error message with no hope of figuring it out. But these frustrations taught me to be patient, persistent, and to not be afraid to ask for help. Weekly check-ins with Dawn pushed me to put my critical thinking to the test to decipher what my results meant. My co-interns and lab mates provided laughter, support, and encouragement that made the work even more rewarding. Beyond the data, I also learned how science is built on community. Research isn’t just all about running tests and analyzing plots, it’s about sharing ideas, collaboration, and building on each other’s work.
Figure 7. Alana and Bennie the Banana Slug at Cape Perpetua after a hike.
As a first-generation college student, this opportunity showed me that I can belong in marine science. I leave this summer with new skills in bioacoustics, statistics, and science communication, but also with a deeper sense of confidence and belonging in research.
Did you enjoy this blog? Want to learn more about marine life, research, and conservation? Subscribe to our blog and get a weekly alert when we make a new post! Just add your name into the subscribe box below!
References
Barlow, D. R., Klinck, H., Ponirakis, D., Branch, T. A., & Torres, L. G. (2023). Environmental conditions and marine heatwaves influence blue whale foraging and reproductive effort. Ecology and Evolution, 13(2), e9770.https://doi.org/10.1002/ece3.9770
Barlow, D. R., & Torres, L. G. (2021). Planning ahead: Dynamic models forecast blue whale distribution with applications for spatial management. Journal of Applied Ecology, 58(11), 2493–2504.https://doi.org/10.1111/1365-2664.13992
Barlow, D. R., Torres, L. G., Hodge, K. B., Steel, D., Baker, C. S., Chandler, T. E., Bott, N., Constantine, R., Double, M. C., Gill, P., Glasgow, D., Hamner, R. M., Lilley, C., Ogle, M., Olson, P. A., Peters, C., Stockin, K. A., Tessaglia-Hymes, C. T., & Klinck, H. (2018). Documentation of a New Zealand blue whale population based on multiple lines of evidence. Endangered Species Research, 36, 27–40.https://doi.org/10.3354/esr00891
Clark, C. W., & Ellison, W. T. (2004). Potential use of low-frequency sounds by baleen whales for probing the environment: Evidence from models and empirical measurements. In Echolocation in Bats and Dolphins (Vol. 1–1, pp. 564–589). Univeristy of Chicago Press.
Kahl, S., Wood, C. M., Eibl, M., & Klinck, H. (2021). BirdNET: A deep learning solution for avian diversity monitoring. Ecological Informatics, 61, 101236.https://doi.org/10.1016/j.ecoinf.2021.101236
Klinck, H., Winiarski, D., Mack, R. C., Tessaglia-Hymes, C. T., Ponirakis, D. W., Dugan, P. J., Jones, C., & Matsumoto, H. (2020). The Rockhopper: A compact and extensible marine autonomous passive acoustic recording system. Global Oceans 2020: Singapore – U.S. Gulf Coast, 1–7.https://doi.org/10.1109/IEEECONF38699.2020.9388970
Thieurmel, B., & Elmarhraoui, A. (2022). suncalc: Compute sun position, sunlight phases, moon position and lunar phase (Version 0.5.1) [R package]. Comprehensive R Archive Network (CRAN). https://CRAN.R-project.org/package=suncalc
Torres, L. (2013). Evidence for an unrecognised blue whale foraging ground in New Zealand. New Zealand Journal of Marine and Freshwater Research, 47(2), 235–248.https://doi.org/10.1080/00288330.2013.773919
Maddie Honomichl, CSUMB Undergraduate in Marine Science, 2025 NSF REU and TOPAZ/JASPER Intern
Hi everyone, my name is Maddie Honomichl, and I was one of the two NSF REU interns with the GEMM lab this summer. This fall will be my last semester at California State University, Monterey Bay (CSUMB), where I will receive my undergraduate degree in Marine Science. Growing up in the Arizona desert limited my exposure to large bodies of water but led to memorable family trips to San Diego. With each trip my adoration for the ocean and the vast marine ecosystem emerged, resulting in my choice to go to college at CSU Monterey Bay. During my time at CSUMB, I learned of what internships were and the magnitude of impact these experiences had on my peers. Naturally, I searched online for weeks for future summer internship openings available—eventually leading me to none other than the GEMM Lab’s TOPAZ/JASPER project.
Figure 1. A picture of me, Maddie Honomichl, in Redding, CA.
Celest Sorrentino, my amazing mentor, took me under her wing and helped me complete my very first research project: In sync? Studying blow synchrony in blue and gray whale mother-calf pairs using drone footage. The aim of my project is to understand more about calf development in gray and blue whales by investigating changes in mother-calf blow synchrony. But what is synchrony?
Synchrony can be defined as two individuals attempting to match each other’s behavior (Novotny & Bente 2022) and promote mimicry and learning. For example, humpback whales teaching their calves vocalizations and song patterns to communicate is an instance of synchrony and social learning (Anjara 2018). Another example of synchrony in wildlife is energetic transfer, where a whale calf will swim in alignment with its mother’s slipstream to expend less energy (Norris & Prescott 1961). Just like these behaviors, blow synchrony is a measure we can use in marine mammal mother-calf pairs to evaluate their relationship with each other.
Aside from the TOPAZ/JASPER project, you might already be familiar with two other incredible GEMM lab projects GRANITE and SAPPHIRE. During the years of 2016-2023, drone footage of the Pacific Coast Feeding Group of gray whales was collected along the Oregon coast for the GRANITE project. In 2016, 2017, 2024, and 2025, drone footage for the pygmy blue whales was collected in South Taranaki Bight, New Zealand, for the SAPPHIRE project. Large marine mammals, especially whales, are difficult to study for many reasons including their brief occurrences at the surface and the challenges of studying aquatic animals. However, the use of drones allows for a safer and non-invasive alternative method for marine mammal monitoring in their natural habitat (Álvarez-González et al., 2023).
Figure 2. Two still images taken from GRANITE drone footage. The left is of a mother gray whale blowing and the right is of a gray whale calf blowing
Baleen whale calves only have 6-8 months to learn everything they need to know before they wean and are sent off on their own (Lockyer 1984). I don’t know about you, but if my mom kicked me out after I turned 5 years old, I would be pretty lost. In American culture, the golden age for humans to be considered an adult is around 18 years old, when they finally leave the house and venture on their own. For humans, age is a cultural sign of independence, but not much is known about what factors influence what makes a calf ready to be independent. Blow synchrony between mother-calf pairs during the calf’s weaning period can be used as a metric for calf development, which is important to know more about as calf development and survival rates are critical factors to consider in population dynamics and management efforts.
When do whales eventually leave their mother? We frequently don’t know how old a calf is, so we use three different metrics as proxies of calf maturity. First, we use Total Length (TL), which is the length of the whale from rostrum to fluke (or nose to tail) (Pirotta et. al., 2023) and serves as an indicator of growth. Our next metric is Body Area Index (BAI), similar to BMI in humans, which is a score of body condition to understand how fat or skinny the whale calf is (Burnett et. al., 2019). Total Length and BAI measurements are derived from drone photogrammetry work conducted by the GEMM Lab and CODEX. Our last proxy is Day of Year (DOY), which is the day in the year we sighted the whales.
Figure 3. Demonstrating photogrammetry methods used to measure Total Length and Body Area Index (BAI). On the left is a drone image of a gray whale showing how we calculate Total Length (TL) from rostrum to fluke. This image is also divided into increments which are used to calculate Surface Area (SA), depicted by the green dashed box, and using the equation on the right with TL, BAI is calculated.
The specific question I addressed was: Does mother-calf blow rate synchrony change as the calf’s Total Length and Body Area Index increase, and Day of Year increases? In other words, does synchrony change as calves become longer, healthier, and the year progresses. Meaning, as the calf grows in length, increases its body condition, and the day of year progresses, the calf will gain independence from its mother and become out of sync.
I analyzed blowhole rates of mother-calf gray and blue whales using a program called BORIS (Friard & Gamba 2016). BORIS (Behavioral Observation Research Interactive Software) is an online free program where researchers can assign behavior states to animals in video. In BORIS, I watched the drone footage and marked a “blow” event for the mom and calf, recording a specific time stamp per event. I repeated this workflow for each video of both gray and blue whale mom-calf pairs. Once completed, I calculated the average difference of the calf’s timestamp from the mother’s timestamp per pair. The reason behind this approach is that the larger the average difference, the more asynchronous the calf is with its mother, and the smaller the average difference the more synchronous they will become.
To evaluate the effect of our proxies for age, Total Length, BAI, and Day of Year, on mother-calf blow rate synchrony, I turned to my good friend RStudio. I created a scatterplot and regressions for these relationships (Figure 4). These results indicate that body condition (BAI) may be a better proxy of calf maturity and preparation for weaning in gray whales (p-value = 0.0064), whereas calf Total Length (TL) is more indicative of calf maturity in blue whales (p-value = 0.00097).
Figure 4. Scatterplot describing the relationship between the average difference in breath rate in seconds across our three proxies: (i) Average total length, (ii) Average BAI, (iii) Day of Year. The black line in the linear regression fit to the data produced by the linear model. The error bars around each point are the standard deviation or the variability in their blow synchrony. The bigger the error bars mean the more variation the mother and calf had in their blow rates, and the smaller the error bars means the less variation the mother and calf had in their blow rates. Ultimately to answer my question, for gray whales, blow synchrony between mother and calf decreases with increasing calf Body Area Index (BAI). For our blue whales, mother-calf blow synchrony decreases with increasing calf Total Length (TL).
As I end my 10-week internship summer filled with data collection and analysis, lots of laughs and inside jokes, I am proud to say I have learned so much about the research that goes into a project like mine. As someone who loves marine animals, especially whale sharks, I now have a newfound love for whales that will forever be in my heart. I am so incredibly grateful that I was able to work with the GEMM lab and the amazing team of researchers and scientists it encompasses. Being a first-generation college student comes with its challenges of learning how to navigate higher education without direct guidance of family who had been through the experience. But if there’s one thing I always tell myself, it’s that with a little bit of grit and hard work, you can do anything you put your mind to! Whatever my future holds for me, I hope it is filled with more research opportunities and the chance to work with marine mammals!
Figure 5. An image of Maddie Honomichl, presenting her research poster at the Hatfield summer coastal intern symposium remotely from Port Orford!
References:
Álvarez-González, M., Suarez-Bregua, P., Pierce, G. J., & Saavedra, C. (2023). Unmanned Aerial Vehicles (UAVs) in Marine Mammal Research: A Review of Current Applications and Challenges. Drones, 7(11), 667. https://doi.org/10.3390/drones7110667
Burnett, J. D., Lemos, L., Barlow, D., Wing, M. G., Chandler, T., & Torres, L. G. (2019). Estimating morphometric attributes of baleen whales with photogrammetry from small UASs: A case study with blue and gray whales. Marine Mammal Science, 35(1), 108–139. https://doi.org/10.1111/mms.12527
Friard, O., & Gamba, M. (2016). BORIS: A free, versatile open‐source event‐logging software for video/audio coding and live observations. Methods in Ecology and Evolution, 7(11), 1325–1330. https://doi.org/10.1111/2041-210X.12584
Huetz, C., Saloma, A., Adam, O., Andrianarimisa, A., & Charrier, I. (2022). Ontogeny and synchrony of diving behavior in Humpback whale mothers and calves on their breeding ground. Journal of Mammalogy, 103(3), 576–585. https://doi.org/10.1093/jmammal/gyac010
Lockyer, Christina. (1984). Review of Baleen Whale (Mysticeti) Reproduction and Implications for Management. Reproduction in whales, dolphins and porpoises. Proc. conference, La Jolla, CA, 1981. 6. 27-50.
Norris, K.S., & Prescott, J.H. (1961). Observations of Pacific cetaceans of Californian and Mexican waters. University of California Publications in Zoology, 63, 291- 402.
Novotny, E., & Bente, G. (2022). Identifying Signatures of Perceived Interpersonal Synchrony. Journal of nonverbal behavior, 46(4), 485–517. https://doi.org/10.1007/s10919-022-00410-9
Pirotta, E., Fernandez Ajó, A., Bierlich, K. C., Bird, C. N., Buck, C. L., Haver, S. M., Haxel, J. H., Hildebrand, L., Hunt, K. E., Lemos, L. S., New, L., & Torres, L. G. (2023). Assessing variation in faecal glucocorticoid co
Smultea, M. A., Fertl, D., Bacon, C. E., Moore, M. R., James, V. R., & Würsig, B. (2017). Cetacean mother-calf behavior observed from a small aircraft off Southern California. Animal Behavior and Cognition, 4(1), 1–23. https://doi.org/10.12966/abc.01.02.2017