Updates from the 2022 Port Orford Gray Whale Foraging Ecology Project

Allison Dawn, GEMM Lab Master’s student, OSU Department of Fisheries, Wildlife and Conservation Sciences, Geospatial Ecology of Marine Megafauna Lab 

Hello, GEMM Lab blog readers! I am writing to you from the Port Orford Field Station, aka the “South Coast Outpost” as our esteemed field station manager, Tom Calvanese, calls it. I am so excited to be back this year leading a new group of interns into our 8th consecutive year of the integrated TOPAZ and JASPER projects. The field station is much busier than last year, as it houses not only our team of five, but an additional five other interns representing OSU, either through NSF REU projects or MSI internships. I continue to be amazed at the depth and breadth of work that is facilitated by the field station, from our gray whale foraging observations to urchin gonad analysis to creative community engagement efforts and even sustainable seafood distribution. The Port Orford Field Station is truly a haven for those passionate about coastal Oregon conservation.  

The whale team has just wrapped up our first full week of training and I am excited to share a few updates. For those who are not familiar with the project, in addition to our busy field work projects in Newport (GRANITE & HALO), the GEMM lab has also been anchored in Port Orford every summer for the past eight years. With Leigh at the metaphorical helm, and a master’s student as first Mate (previously Florence Sullivan followed by Lisa Hildebrand), we have established a legacy of gray whale research, local collaborations, science communication and hands-on learning for budding young scientists. From this work we have investigated vessel disturbance, prey preference and potential trophic cascades, and now my research aims to investigate the environmental drivers of prey abundance. Many exciting developments are underway that you will learn more about in the coming weeks, but first I’d like to introduce the interns that are helping make this year possible! 

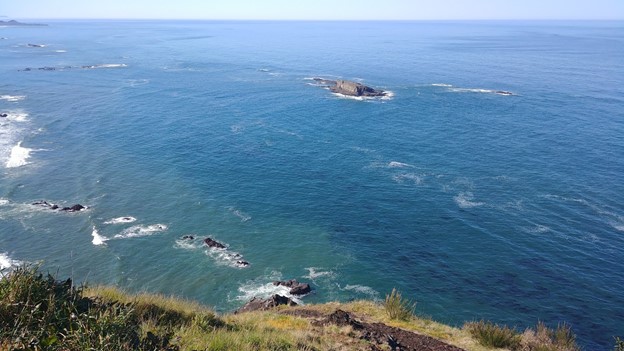
Figure 1. Zoe takes her first peek at Redfish Rocks Marine Reserve through the theodolite. 

First, I’d like to introduce you to Zoe Sax. Zoe is the first REU student to intern on the whale team for the Port Orford Project. She is a rising senior at Drake University majoring in Environmental Science with a Zoology and Conservation Science minor. Last spring, Zoe interned at the Blank Park Zoo where she worked with a range of mammals – even rhinos! This is her first marine mammal internship, but in just a few short weeks, Zoe has demonstrated enthusiasm for fieldwork’s most challenging tasks as well as perseverance through tricky Python/R code. Prior to our arrival at the Field Station, she has been working with me in Newport investigating whether our secchi disk data can serve as a proxy for chlorophyll-a, to ultimately understand patterns of visibility and nutrient abundance. I will let her tell you more about her project’s journey and preliminary results in her blog next week!   

Figure 2. Nichola smiles through kayak sampling training day while learning how to use the GPS to navigate and stay on station in Tichenor Cove.  

Next up is Nichola Gregory. Nichola is an OSU alumni with a bachelors in Ocean Science and a minor in Biology and Ecology. She is currently taking a self-paced certification course in GIS at Portland Community College and is preparing to apply for graduate schools this fall. With a background in phytoplankton identification using the Imaging Flow Cytobot (IFCb) in the Seascape Ecology Lab at OSU, Nichola has a passion for the tools that allow us to investigate smaller marine organisms. She is particularly excited to explore data from our new oceanographic sensor and strengthen her coding skills to help understand the relationships between nutrients and zooplankton. Once a competitive swimmer, she is also excited to be strengthening her water sport skillset and has met every new on-the-water task with a great attitude, humor, and attention to detail. 

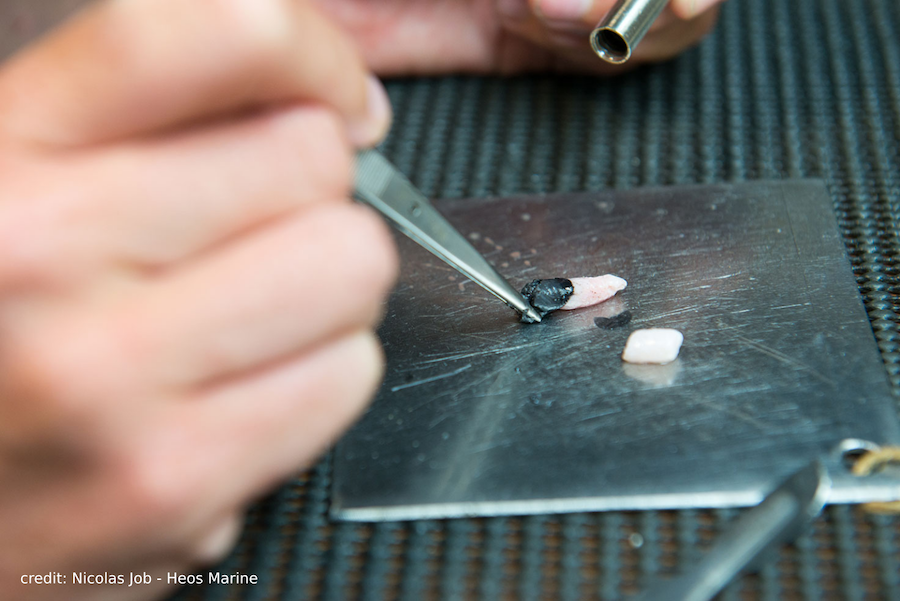
Figure 3. Luke investigates the season’s first gammarid prey under a microscope during zooplankton ID training. 

Luke Donaldson is one of the team’s two interns who grew up on the southern Oregon Coast, where he recently graduated from Coquille High School. He is eager for new challenges before he enters his freshman year at the OSU-Cascades campus as a major in Natural Resources. Luke has already established himself as a keen observer. First, he spotted a river otter running into the surf on our team bonding beach walk, and then he spotted the first blow of the season during our kayak sampling training day! From bush-whacking in search of lamprey populations at South Slough Reserve, green crab trapping, and even hay-baling, Luke’s previous volunteer and internship work has equipped him with transferable skills that I know will be integral in the weeks to come.

Figure 4. Charlie looks toward MR17 where we had just observed the first gray whale of the season surface. 

Last, but certainly not least – our other “coastie” intern is Charlie Ells. Charlie graduated from Bandon High School this past spring and plans to attend the University of Oregon as an Environmental Science major. He has earned the nickname “Mr. Safety” from his peers due to his commitment to fieldwork best practices and his catchphrase “Never turn your back on the ocean”. He has taken great initiative in learning every new task, and his familiarity with the water has made him an essential part of the team as an excellent kayak navigator. Charlie already has a demonstrated passion for conservation and is eager to gain experiences that will help him explore his future career pathways. 

Figure 5. The 2022 TOPAZ / JASPER team after a long yet rewarding morning of kayak sampling training. 

With week one under our belts, I know I speak for the whole team when I say we are as excited as ever for the season. With the exception of one foggy day, we have been fortunate to have favorable weather conditions that I hope will continue. Collaborators in Port Orford and I have noticed there have been new kelp patches in Mill Rocks where we spotted our first whale of the season, which makes us hopeful there will be some quality zooplankton prey in the area for our PCFG whales. This week, the team will tackle Basic Life Safety Training (BLS) and complete several more cliff/kayak practice days to prepare us for the first week of August where we will officially begin data collection. Stay tuned for more exciting updates from the Port Orford team! 

Did you enjoy this blog? Want to learn more about marine life, research and conservation? Subscribe to our blog and get weekly updates and more! Just add your name into the subscribe box below! 

Loading

A Hundred and One Data Visualizations: What We Can Infer about Gray Whale Health Using Public Data

By Braden Adam Vigil, Oregon State University Undergraduate, GEMM Lab NSF REU Intern

Introduction

My name is Braden Vigil, and I am enjoying this summer with the company of Lisa Hildebrand and Dr. Leigh Torres as a National Science Foundation (NSF) Research Experience for Undergraduates (REU) intern. By slicing off a manageable chunk of the GRANITE project to focus on, I’ve had the chance to explore my passion for data visualization. My excitement for biological research was instilled in me by an impactful high school biology teacher (thank you Mr. Villalobos!) and was narrowed to marine biology research after a chance visit to Oregon State University’s Hatfield Marine Science Center. I’ve come all the way from Southern New Mexico to explore this passion of mine, and the REU program has been one of my first chances to get my feet wet. My advice for any students debating taking big leaps for the sake of passion is to do it – it’s scary, but I’d say there’s nothing better than living out what you want to do (and hopefully getting paid for it!). For this project, the GEMM Lab has saved me the trouble of collecting data – this summer, I’m all action. 

Where Gray Whales Are and Why It Matters

Just as you might find yourself at a grocery store to buy food or at a coffee shop catching up with an old friend, so too do whales have places to go and reasons for being there. Research concerning gray whale ecology – understanding the who, what, when, where, whys – should then have a lot to do with the “where?” and “why?” That’s what my project is about: investigating where the gray whales off the Oregon coast are, and what features of the environment are related to their presence and other aspects of the population. After all, distribution is considered the foundational unit for the biogeographical understanding of a population’s location and its interactions with other species. An example of an environmental driver may be phytoplankton and – subsequently – zooplankton abundance. It’s been shown that bottom-up trophic cascades based on primary productivity directly influence predator and prey populations in both terrestrial and marine ecosystems (Sinclair and Krebs 2002; Benoit-Bird and McManus 2012). This driver specifically could then inform something as significant as population abundance of a predator, though that’s out of the scope of my project. Instead, I’m studying how these environmental drivers, specifically sea water temperature, affects the variation of the thyroid hormone (tri-iodothyronine, T3) in gray whales, which the GEMM Lab quantifies from fecal samples that they non-invasively and opportunistically collect. In terrestrial mammals, T3 is believed to be associated with thermoregulation, yet it is unclear if T3 has the same function in baleen whales who use blubber insulation to thermoregulate. To estimate blubber insulation, we use a proxy, called body area index (BAI) collected via drone footage (Burnett et al. 2018), which you can read more about in Clara’s blog. Insights into variations in T3 hormone levels as related to changes in the environment may allow researchers to better understand thermoregulatory challenges whales face in warming oceans.

This Sounds Like a Lot of Data About the Environment, Where’s it Coming From?

Not only has the GEMM Lab relieved me of the hassle that data collection and fieldwork can be, so too has the Ocean Observatories Initiative (OOI). Starting in 2014, the OOI has set up several buoys off the U.S. West Coast, each equipped with numerous sensors and data-collecting devices. These have been extracting data from the nearby environment since then, including aspects such as dissolved oxygen, pH, and most important to this study, sea temperature. These buoys run deep too! Some devices reach as low as 25 m, which is where we often expect to see whales foraging during surveys. For our interest, there is one specific buoy that is within the GRANITE project’s survey region, the Oregon Inshore Surface Mooring.

Figure 1. Locations of OOI buoys. Blue dots represent buoys, while the yellow dot represents our buoy of interest, the Oregon Inshore Surface Mooring. 

Expectations

The OOI has published, and continues to publish, an unbelievable amount of data. There are many things that would be interesting to investigate, but until we know how much we can bite off versus how much we can chew, we’ve narrowed it down to a few hypotheses we’re currently investigating. 

Table 1. Hypotheses and Expected Results.

A Hundred and One Data Visualizations

As fun as I find testing correlations between variables and creating satisfying looking plots, I must admit that I’m not even halfway into this project and I’ve made a LOT of plots. Plots can be an easy way to understand big datasets and observations. Since not all of the data-collecting devices on the OOI data are continuously running, I first needed to get an idea of how much data we have to work with, and how much of that data overlaps in time with our annual gray whale survey period (June 1 – October 15). Some of these preliminary plots look like Figure 2. In addition, these plots grant us an idea of how variable sea surface temperatures have been in these past few years. Marine heatwaves have occurred recently in the Pacific Ocean and off the U.S. West Coast, and it is important to know if their effects continue to linger to the present. Other, unexplained peaks might also be worth investigating. 

Figure 2. Preliminary plot comparing sea surface temperature data over time, from around June 2016 to December 2021. Straight lines between December to June each year indicates no data, as we have removed these periods from our analysis. 

The goal here is to eventually compare the variables of sea temperature to the T3 hormone levels in gray whales foraging off the Oregon coast. Before this step, it is important to decide what depth of temperature readings are most appropriate to assess. I’ve made several correlation plots of sea  temperature between varying depths of 1 m, 7 m, and 25 m. One such plot is included below (Figure 3). This plot shows variation of temperature between different depths. If there is strong variation between the depths of 1 m and 25 m, then the water column may be well stratified, meaning that gray whale response to environmental temperature may be distinct between these distances, possibly even between 1 m and 7 m. 

Figure 3. Sea surface temperature at 1 m versus 25 m in degrees Celsius, with points color coded by year. 

Conclusion

As previously described, this study plays part into the larger GRANITE project with the goal to understand and make predictions about the ecology and physiology of the gray whale population off of the U.S. West Coast. This study will investigate the significance of sea temperature on aspects of whale health – so far including BAI and T3 hormone level. I will be pursuing a stronger grasp on the variation of these relationships through ongoing analysis. My results should be used to clarify nodes and the correlation between them in the web of dynamics encircling the population. This project has given me great insight into how raw data can be turned into meaningful understandings and subsequent impacts. The public OOI data is a scattershot of many different measurements using many different devices constantly. The answers/solutions to the conservation of species threatened by the Anthropocene are out there, all that’s required is that we harness them. 

References

Benoit-Bird, K. J., & McManus, M. A. (2012). Bottom-up regulation of a pelagic community through spatial aggregations. Biology Letters8(5), 813–816. https://doi.org/10.1098/rsbl.2012.0232

Burnett, J. D., & Wing, M. G. (2018). A low-cost near-infrared digital camera for fire detection and monitoring. International Journal of Remote Sensing39(3), 741–753. https://doi.org/10.1080/01431161.2017.1385109

Sinclair, A. R. E., & Krebs, C. J. (2002). Complex numerical responses to top–down and bottom–up processes in vertebrate populations. Philosophical Transactions of the Royal Society of London. Series B: Biological Sciences357(1425), 1221–1231.https://doi.org/10.1098/rstb.2002.1123.

To biopsy or not to biopsy? Reflecting on the impact of research activities on marine mammals in the wild

By Solène Derville, Postdoc, OSU Department of Fisheries, Wildlife, and Conservation Science, Geospatial Ecology of Marine Megafauna Lab

This blog is motivated by the recent publication I co-authored with my former PhD supervisor in New Caledonia (Garrigue & Derville 2022). As I am about to present our study entitled “Behavioral responses of humpback whales to biopsy sampling on a breeding ground: the influence of age-class, reproductive status, social context, and repeated sampling” as part of the Society for Marine Mammalogy Seminar Editor’s Selected Series, I have been reflecting on how my research impacts the animals I study.

The overwhelming majority of marine mammal scientists around the world agree that lethal sampling of whales and other marine mammals is unnecessary to fill current knowledge gaps and deplorable in a context of global biodiversity loss and habitat degradation (e.g., Clapham et al. 2003; Cote and Favaro 2016). More so, the academic community consistently seeks to improve the ethical framework within which research on live animals is conducted. While the study of free-living marine mammals poses challenges that are quite different than laboratory experiments, these practices are nonetheless discussed and questioned by the general public, managers, and the scientists themselves.

Among the field methods used to collect data from cetaceans, biopsy sampling is perhaps one of the most common. While it is sometimes possible to skim the water to collect the dead skin that individuals may shed during surface activities, cetaceans are most often biopsied remotely, using a veterinary rifle or a crossbow (Figure 1). The devices propel an arrow or a dart towards the animals to remove a small piece of skin and blubber inside a tip. These pieces can be a few centimeters to less than a centimeter long depending on the size of the species that is targeted (e.g., smaller darts are typically used for dolphins compared to large whales). The tissues sampled in this way are essential to address many biological, ecological, and behavioral questions that can ultimately inform conservation. Yet, biopsy sampling is invasive and a few studies have investigated its potential impact on humpback whales (Cantor et al., 2010; Clapham & Mattila, 1993), among other cetaceans (see review in Noren & Mocklin, 2012).

Figure 1: Conducting biopsy sampling of a humpback whale with a crossbow (above), and sample of skin and blubber collected during biopsy sampling (below). Photo credit: Nicolas Job – Heos Marine (MARACAS expeditions 2017, New Caledonia)

When presenting biopsy sampling to the general public, who hasn’t had to answer the tricky question “but does it hurt?”? Well I wish the whale could pop its head out the water and just tell me if it did! Measuring disturbance or pain is unfortunately extremely challenging in the case of cetaceans. Sophisticated methods that rely on new technologies (hormone analysis, drone video footages etc.) are being developed by the GEMM lab and other research groups to assess the impact of human activities around whales and should allow a better understanding of acute and chronic stress in the near future.

The strength of our study that was just published in the Marine Mammal Science journal is not technology, but rather the application of very standard approach over many years of consistent field work. In New Caledonia, in the southwest Pacific, humpback whales have been monitored as part of a long-term program initiated in the mid ‘90s by Dr. Claire Garrigue. Every austral winter, when whales regroup in these warm subtropical waters to breed and nurse their calves, biopsy samples were collected on individuals of all age-classes: adults, juveniles, and calves. During each of the 2,249 biopsies conducted throughout 20 years of research, the behavioral response of individual whales was qualitatively assessed and recorded. First, the response to the boat approach was recorded (whether the whale avoided the boat or not), then the response to the biopsy immediately after the shot, which was categorized as none, weak, moderate, or strong, based on general definitions provided by Weinrich et al. 1991. We investigated the frequency of these behavioral responses according to age-class, sex, female reproductive status, and social context, as well as the sampling system and habitat. We also assessed the effect of repeated biopsy sampling over time at the individual level.

We found that humpback whales did not show observable behavioral responses in over half of the cases (58.7%). Interestingly, we also discovered that calves did not respond more than adult whales, whereas juveniles stood out as the most sensitive age-class (Figure 2). Mothers with a calf reacted more often to the boat compared to non-lactating females and males, but paradoxically had the weakest responses to the biopsy sampling itself. We interpreted this dual response as the result of individually varying baseline stress levels, with some very shy mothers actively avoiding boats and others displaying a very oblivious attitude to both the boat’s proximity and to the brief impact of the biopsy sampling.

Figure 2: Responses of humpback whales to biopsy sampling according to age-class. Sample sizes are reported on the bar plot, except for strong responses (adults: 7, juveniles: 3, calves: 2). Figure reproduced from Garrigue & Derville 2022.

Although biopsies could have stressed animals in a way that was not measurable with our simple behavioral approach, it is still reassuring to see that most whales did not show a response, which allows us to assume that the impact of the biopsy was very minimal. This sort of methodological research is needed to inform managers responsible for the delivery of research permits and for researchers themselves to keep questioning their practices.

As I was analyzing this data and writing the paper, I became more aware of the value each of these tissue samples had. In the case of biopsy sampling, I believe that the gain in knowledge is ultimately worth the cost, but we should always bear in mind that this conclusion comes from a human perspective. From when I am in the field approaching whales, to when I analyze the hard-won data in my office, I think about the ethics of our work. As a supporter of open science, my take-away message from this research journey was that we have responsibility to use and share this biological data as much as possible. We should always aim at making the most out of data, but even more so when it is acquired by working with live animals. The cost is never null, so let’s make it worth it!

Ethics statement

Research was conducted under annual permits delivered by the competent authorities of the government of New Caledonia, and the Northern Province and Southern Province of New Caledonia. This study was carried out following the marine mammal treatment guidelines of the Society for Marine Mammalogy. The data that support the findings of this study are openly available here (DataSuds repository, doi: 10.23708/QYWDPO).

Did you enjoy this blog? Want to learn more about marine life, research, and conservation? Subscribe to our blog and get a weekly message when we post a new blog. Just add your name and email into the subscribe box below.

Loading

References

Cantor, M., Cachuba, T., Fernandes, L., & Engel, M. H. (2010). Behavioural reactions of wintering humpback whales (Megaptera novaeangliae) to biopsy sampling in the western South Atlantic. Journal of the Marine Biological Association of the United Kingdom, 90(8), 1701–1711. https://doi.org/10.1017/S0025315409991561

Clapham, P. J., & Mattila, D. K. (1993). Reactions of humpback whales to skin biopsy sampling on a West Indies breeding ground. Marine Mammal Science, 9(4), 382–391. https://doi.org/10.1111/j.1748-7692.1993.tb00471.x

Cote, Isabelle M., and Corinna Favaro. “The scientific value of scientific whaling.” Marine Policy 74 (2016): 88-90.

Garrigue, C., & Derville, S. (2022). Behavioral responses of humpback whales to biopsy sampling on a breeding ground : the influence of age-class , reproductive status , social context , and repeated sampling. Marine Mammal Science, 38, 102–117. https://doi.org/10.1111/mms.12848

Noren, D. P., & Mocklin, J. A. (2012). Review of cetacean biopsy techniques: Factors contributing to successful sample collection and physiological and behavioral impacts. Marine Mammal Science, 28(1), 154–199. https://doi.org/10.1111/ j.1748-7692.2011.00469.x

Phillip J. Clapham, Per Berggren, Simon Childerhouse, Nancy A. Friday, Toshio Kasuya, Laurence Kell, Karl-Hermann Kock, Silvia Manzanilla-Naim, Giuseppe Notabartolo Di Sciara, William F. Perrin, Andrew J. Read, Randall R. Reeves, Emer Rogan, Lorenzo Rojas-Bracho, Tim D. Smith, Michael Stachowitsch, Barbara L. Taylor, Deborah Thiele, Paul R. Wade, Robert L. Brownell, Whaling as Science, BioScience, Volume 53, Issue 3, March 2003, Pages 210–212, https://doi.org/10.1641/0006-3568(2003)053[0210:WAS]2.0.CO;2

Weinrich, M. T., Lambertsen, R. H., Baker, C. S., Schilling, M. R., & Belt, C. R. (1991). Behavioural responses of humpback whales (Megaptera novaeangliae) in the southern gulf of Maine to biopsy sampling. Reports of the International Whaling Commission, Special Issue 13,91–97

Harbor porpoise and gray whale distribution over three decades: introducing the EMERALD project

By Dawn Barlow, Postdoctoral Scholar, OSU Department of Fisheries, Wildlife, and Conservation Sciences, Geospatial Ecology of Marine Megafauna Lab

Throughout the world, humans rely on coastal regions for shipping and commerce, fisheries, industrial development, and increasingly for the development of marine renewable energy such as wind and wave energy [1]. Nearshore environments, including the coastal waters of the Northern California Current (NCC), are therefore coupled social-ecological systems, at the intersection of human and biological productivity [2].

The NCC supports a diverse food web of ecologically and commercially important species [3]. The nearshore region of the NCC is further shaped by a rich mosaic of complex features including rocky reefs, kelp forests, and sloping sandy bottom substrate [4], creating habitat for numerous species of conservation interest, including invertebrates, fish, seabirds, and marine mammals [5]. Despite its importance, this realm poses significant challenges for vessel-based data collection, and therefore it remains relatively poorly monitored and understood.

The view from Cape Foulweather, showing the complex mosaic of nearshore habitat features. Photo: D. Barlow.

I am excited to introduce a new project focused on these important nearshore waters, in which we will be Examining Marine mammal Ecology through Region-wide Assessment of Long-term Data (EMERALD). Since 1992, standardized surveys have been conducted between San Francisco Bay, CA, and the Columbia River, OR, to monitor the abundance of marbled murrelets, a seabird of conservation concern. Each spring and summer, researchers have simultaneously been diligently documenting the locations of harbor porpoise and gray whale sightings—two iconic marine mammal species that rely on the nearshore waters of the NCC. This rich and extensive record is rare for marine mammal data, particularly in the challenging, turbulent nearshore environment. Furthermore, harbor porpoises are cryptic, making visual sampling particularly challenging, and gray whales can be sparsely distributed, yielding low sample sizes in the absence of long-term data collection.

Left: The survey team collecting data; Right: Marbled murrelet floating on the water.

For the EMERALD project, we will investigate spatial and temporal distribution patterns of harbor porpoises and gray whales in relation to fluctuations in key environmental drivers. The primary goals of the project are to (1) Identify persistent hotspots in harbor porpoise and gray whale sightings over time, and (2) Examine the environmental drivers of sighting hotspots through spatial and temporal analyses.

A harbor porpoise surfacing off the central Oregon coast. Photo: L. Torres.

From a first look at the data, we are already excited by some emerging patterns. In total, the dataset contains sightings of 6,763 harbor porpoise (mean 233 per year) and 530 gray whales (mean 18 per year). Preliminary data exploration reveals that harbor porpoise sightings increased in 2011-2012, predominantly between Cape Blanco, OR, and Cape Mendocino, CA. Gray whale sightings appear to follow an oscillating, cyclical pattern with peaks approximately every three years, with notable disruption of this pattern during the marine heatwave of 2014-2015. What are the drivers of sighting hotspots and spatial and temporal fluctuations in sighting rates? Time—and a quantitative analytical approach involving density estimation, timeseries analysis, and species distribution modeling—will tell.

A gray whale forages in kelp forest habitat over a nearshore rocky reef. Photo: T. Chandler.

I recently completed my PhD on the ecology and distribution of blue whales in New Zealand (for more information, see the OBSIDIAN project). Now, I am excited to apply the spatial analysis skills have been honing to a new study system and two new study species as I take on a new role in the GEMM Lab as a Postdoctoral Scholar. The EMERALD project will turn my focus to the nearshore waters close to home that I have grown to love over the past six years as a resident of coastal Oregon. The surveys I will be working with began before I was born, and I am truly fortunate to inherit such a rich dataset—a rare treat for a marine mammal biologist, and an exciting prospect for a statistical ecologist.

Dawn and Quin the dog, enjoying views of Oregon’s complex and important nearshore waters. Both are thrilled to remain in Oregon for the EMERALD project. Photo: R. Kaplan.

So, stay tuned for our findings as the project unfolds. In the meantime, I want express gratitude to Craig Strong of Crescent Coastal Research who has led the dedicated survey effort for the marbled murrelet monitoring program, without whom none of the data would exist. This project is funded by the Oregon Gray Whale License Plate funds, and we thank the gray whale license plate holders for their support of marine mammal research.

Did you enjoy this blog? Want to learn more about marine life, research, and conservation? Subscribe to our blog and get a weekly alert when we make a new post! Just add your name into the subscribe box below!

Loading

References:

1.        Jouffray, J.-B., Blasiak, R., Norström, A. V., Österblom, H., and Nyström, M. (2020). The Blue Acceleration: The Trajectory of Human Expansion into the Ocean. One Earth 2, 43–54.

2.        Sjostrom, A.J.C., Ciannelli, L., Conway, F., and Wakefield, W.W. (2021). Gathering local ecological knowledge to augment scientific and management understanding of a living coastal resource: The case of Oregon’s nearshore groundfish trawl fishery. Mar. Policy 131, 104617.

3.        Bograd, S.J., Schroeder, I., Sarkar, N., Qiu, X., Sydeman, W.J., and Schwing, F.B. (2009). Phenology of coastal upwelling in the California Current. Geophys. Res. Lett. 36, 1–5.

4.        Romsos, G., Goldfinger, C., Robison, R., Milstein, R., Chaytor, J., and Wakefield, W. (2007). Development of a regional seafloor surficial geologic habitat map for the continental margins of Oregon and Washington, USA. Mapp. Seafloor Habitat Charact. Geol. Assoc. Canada, Spec. Pap., 219–243.

5.        Oregon Department of Fish and Wildlife (2016). Oregon Nearshore Strategy. Available at: https://oregonconservationstrategy.org/oregon-nearshore-strategy/ [Accessed January 10, 2022].