By Braden Adam Vigil, Oregon State University Undergraduate, GEMM Lab NSF REU Intern
Introduction
My name is Braden Vigil, and I am enjoying this summer with the company of Lisa Hildebrand and Dr. Leigh Torres as a National Science Foundation (NSF) Research Experience for Undergraduates (REU) intern. By slicing off a manageable chunk of the GRANITE project to focus on, I’ve had the chance to explore my passion for data visualization. My excitement for biological research was instilled in me by an impactful high school biology teacher (thank you Mr. Villalobos!) and was narrowed to marine biology research after a chance visit to Oregon State University’s Hatfield Marine Science Center. I’ve come all the way from Southern New Mexico to explore this passion of mine, and the REU program has been one of my first chances to get my feet wet. My advice for any students debating taking big leaps for the sake of passion is to do it – it’s scary, but I’d say there’s nothing better than living out what you want to do (and hopefully getting paid for it!). For this project, the GEMM Lab has saved me the trouble of collecting data – this summer, I’m all action.
Where Gray Whales Are and Why It Matters
Just as you might find yourself at a grocery store to buy food or at a coffee shop catching up with an old friend, so too do whales have places to go and reasons for being there. Research concerning gray whale ecology – understanding the who, what, when, where, whys – should then have a lot to do with the “where?” and “why?” That’s what my project is about: investigating where the gray whales off the Oregon coast are, and what features of the environment are related to their presence and other aspects of the population. After all, distribution is considered the foundational unit for the biogeographical understanding of a population’s location and its interactions with other species. An example of an environmental driver may be phytoplankton and – subsequently – zooplankton abundance. It’s been shown that bottom-up trophic cascades based on primary productivity directly influence predator and prey populations in both terrestrial and marine ecosystems (Sinclair and Krebs 2002; Benoit-Bird and McManus 2012). This driver specifically could then inform something as significant as population abundance of a predator, though that’s out of the scope of my project. Instead, I’m studying how these environmental drivers, specifically sea water temperature, affects the variation of the thyroid hormone (tri-iodothyronine, T3) in gray whales, which the GEMM Lab quantifies from fecal samples that they non-invasively and opportunistically collect. In terrestrial mammals, T3 is believed to be associated with thermoregulation, yet it is unclear if T3 has the same function in baleen whales who use blubber insulation to thermoregulate. To estimate blubber insulation, we use a proxy, called body area index (BAI) collected via drone footage (Burnett et al. 2018), which you can read more about in Clara’s blog. Insights into variations in T3 hormone levels as related to changes in the environment may allow researchers to better understand thermoregulatory challenges whales face in warming oceans.
This Sounds Like a Lot of Data About the Environment, Where’s it Coming From?
Not only has the GEMM Lab relieved me of the hassle that data collection and fieldwork can be, so too has the Ocean Observatories Initiative (OOI). Starting in 2014, the OOI has set up several buoys off the U.S. West Coast, each equipped with numerous sensors and data-collecting devices. These have been extracting data from the nearby environment since then, including aspects such as dissolved oxygen, pH, and most important to this study, sea temperature. These buoys run deep too! Some devices reach as low as 25 m, which is where we often expect to see whales foraging during surveys. For our interest, there is one specific buoy that is within the GRANITE project’s survey region, the Oregon Inshore Surface Mooring.

Expectations
The OOI has published, and continues to publish, an unbelievable amount of data. There are many things that would be interesting to investigate, but until we know how much we can bite off versus how much we can chew, we’ve narrowed it down to a few hypotheses we’re currently investigating.

A Hundred and One Data Visualizations
As fun as I find testing correlations between variables and creating satisfying looking plots, I must admit that I’m not even halfway into this project and I’ve made a LOT of plots. Plots can be an easy way to understand big datasets and observations. Since not all of the data-collecting devices on the OOI data are continuously running, I first needed to get an idea of how much data we have to work with, and how much of that data overlaps in time with our annual gray whale survey period (June 1 – October 15). Some of these preliminary plots look like Figure 2. In addition, these plots grant us an idea of how variable sea surface temperatures have been in these past few years. Marine heatwaves have occurred recently in the Pacific Ocean and off the U.S. West Coast, and it is important to know if their effects continue to linger to the present. Other, unexplained peaks might also be worth investigating.

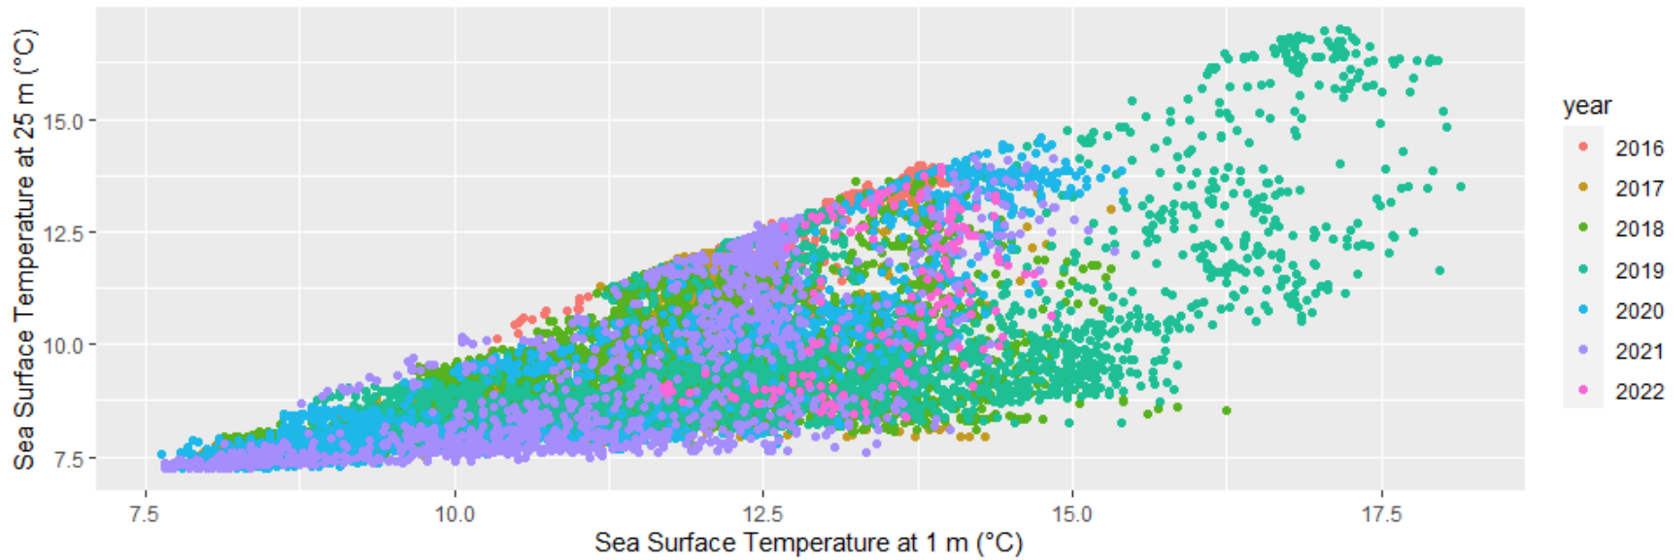
The goal here is to eventually compare the variables of sea temperature to the T3 hormone levels in gray whales foraging off the Oregon coast. Before this step, it is important to decide what depth of temperature readings are most appropriate to assess. I’ve made several correlation plots of sea temperature between varying depths of 1 m, 7 m, and 25 m. One such plot is included below (Figure 3). This plot shows variation of temperature between different depths. If there is strong variation between the depths of 1 m and 25 m, then the water column may be well stratified, meaning that gray whale response to environmental temperature may be distinct between these distances, possibly even between 1 m and 7 m.
Conclusion
As previously described, this study plays part into the larger GRANITE project with the goal to understand and make predictions about the ecology and physiology of the gray whale population off of the U.S. West Coast. This study will investigate the significance of sea temperature on aspects of whale health – so far including BAI and T3 hormone level. I will be pursuing a stronger grasp on the variation of these relationships through ongoing analysis. My results should be used to clarify nodes and the correlation between them in the web of dynamics encircling the population. This project has given me great insight into how raw data can be turned into meaningful understandings and subsequent impacts. The public OOI data is a scattershot of many different measurements using many different devices constantly. The answers/solutions to the conservation of species threatened by the Anthropocene are out there, all that’s required is that we harness them.
References
Benoit-Bird, K. J., & McManus, M. A. (2012). Bottom-up regulation of a pelagic community through spatial aggregations. Biology Letters, 8(5), 813–816. https://doi.org/10.1098/rsbl.2012.0232
Burnett, J. D., & Wing, M. G. (2018). A low-cost near-infrared digital camera for fire detection and monitoring. International Journal of Remote Sensing, 39(3), 741–753. https://doi.org/10.1080/01431161.2017.1385109
Sinclair, A. R. E., & Krebs, C. J. (2002). Complex numerical responses to top–down and bottom–up processes in vertebrate populations. Philosophical Transactions of the Royal Society of London. Series B: Biological Sciences, 357(1425), 1221–1231.https://doi.org/10.1098/rstb.2002.1123.