Dolphin Diets: Common bottlenose dolphin prey preferences off California

By: Alexa Kownacki, Ph.D. Student, OSU Department of Fisheries and Wildlife, Geospatial Ecology of Marine Megafauna Lab 

Humans are fascinated by food. We want to know its source, its nutrient content, when it was harvested and by whom, and so much more. Since childhood, I was the nagging child who interrogated wait staff about the seafood menu because I cared about the sustainability aspect as well as consuming ethically-sourced seafood. Decades later I still do the same: ask a myriad of questions from restaurants and stores in order to eat as sustainably as possible. But in addition to asking these questions about my food, I also question what my study species eats and why. My study populations, common bottlenose dolphins, are described as top opportunistic predators (Norris and Prescott 1961, Shane et al. 1986, Barros and Odell 1990). In my study area off of California, this species exists in two ecotypes. The coastal ecotype off of California, USA are generalist predators, feeding on many different species of fish using different foraging techniques (Ballance 1992, Shane 1990). The offshore ecotype, on the other hand, is less well-studied, but is frequently observed in association with sperm whales, although the reason is still unknown (Díaz-Gamboa et al. 2018). Stable isotope analysis from skin samples from the two ecotypes indicates that the ecotypes exhibit different foraging strategies based on different isotopic carbon and nitrogen levels (Díaz-Gamboa et al. 2018).

Growing up, I kept the Monterey Bay Aquarium’s Seafood Watch Guide with me to choose the most sustainably-sourced seafood at restaurants. Today there is an easy-to-use application for mobile phones that replaced the paper guide. (Image Source: https://www.seafoodwatch.org/)

Preliminary and historical data on common bottlenose dolphins (Tursiops truncatus) suggest that the coastal ecotype spend more time near estuary mouths than offshore dolphins (Ballance 1992, Kownacki et al. unpublished data). Estuaries contain large concentrations of nutrients from runoff, which support zooplankton and fishes. It is for this reason that these estuaries are thought to be hotspots for bottlenose dolphin foraging. Some scientists hypothesize that these dolphins are estuarine-based prey specialists (Barros and Odell 1990), or that the dolphins simply aggregate in estuaries due to higher prey abundance (Ballance 1992).

Coastal bottlenose dolphins traveling near an estuary mouth in San Diego, CA. (Photographed under NOAA NMFS Permit # 19091).

In an effort to understand diet compositions of bottlenose dolphins, during coastal surveys seabirds were recorded in association with feeding groups of dolphins. Therefore, it is reasonable to believe that dolphins were feeding on the same fishes as Brown pelicans, blue-footed and brown boobies, double-crested cormorants, and magnificent frigatebirds, seeing as they were the most common species associated with bottlenose dolphin feeding groups (Ballance 1992). A shore-based study by Hanson and Defran (1993) found that coastal dolphins fed more often in the early morning and late afternoon, as well as during periods of high tide current. These patterns may have to do with the temporal and spatial distribution of prey fish species. From the few diet studies conducted on these bottlenose dolphins in this area, 75% of the prey were species from the families Ebiotocidae (surf perches) and Sciaendae (croakers) (Norris and Prescott 1961, Walker 1981). These studies, in addition to optimal foraging models, suggest this coastal ecotype may not be as much of a generalist as originally suggested (Defran et al. 1999).
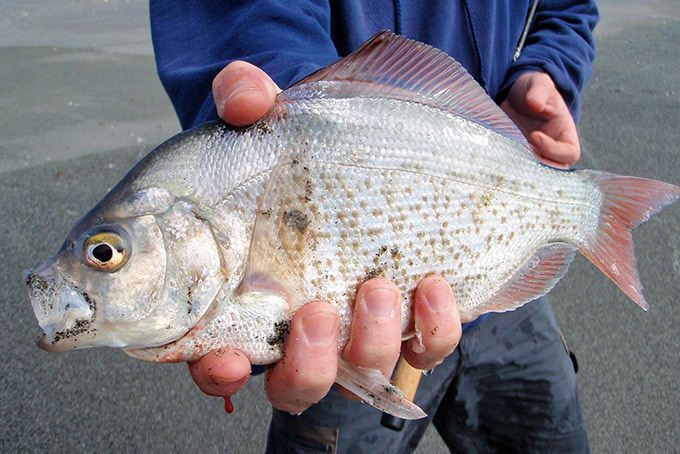
A redtail surfperch caught by a fisherman from a beach in San Diego, CA. These fish are thought to be common prey of coastal bottlenose dolphins. (Image Source: FishwithJD)

Diet studies on the offshore ecotype of bottlenose dolphins worldwide show a preference for cephalopods, similar to other toothed cetaceans who occupy similar regions, such as Risso’s dolphin, sperm whales, and pilot whales (Clarke 1986, Cockcroft and Ross 1990, Gonzalez et al. 1994, Barros et al. 2000, Walker et al. 1999). Because these animals seldom strand on accessible beaches, stomach contents analyses are limited to few studies and isotope analysis is more widely available from biopsies. We know these dolphins are sighted in deeper waters than the habitat of coastal dolphins where there are fewer nutrient plumes, so it is reasonable to hypothesize that the offshore ecotype consumes different species and may be more specialized than the coastal ecotype.
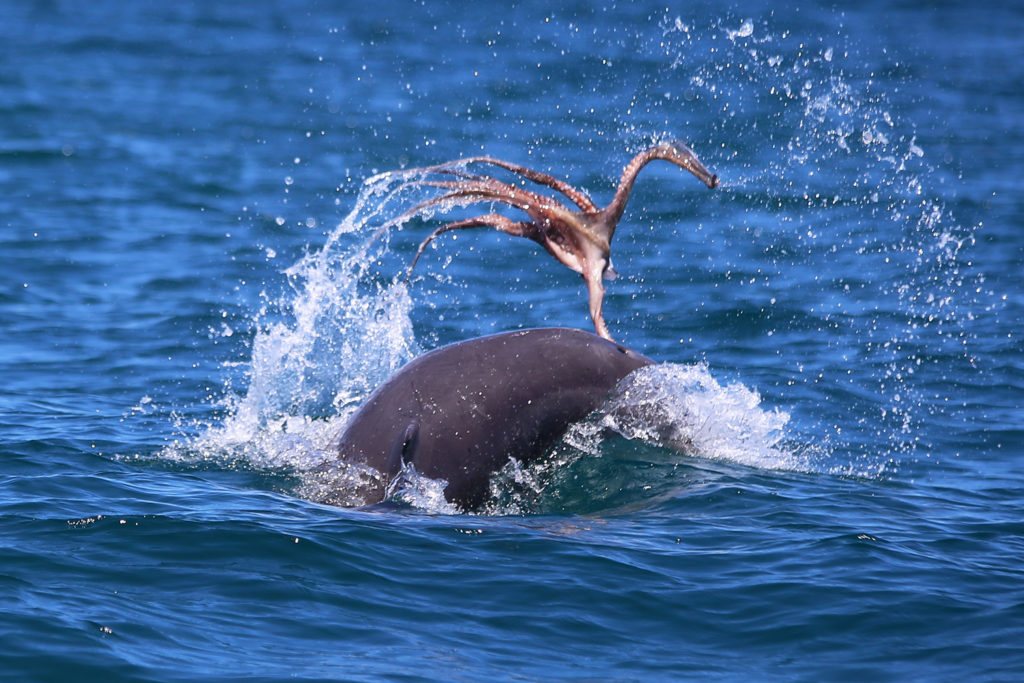
An bottlenose dolphin forages on an octopus. (Image source: Mandurah Cruises)

For a species that is so often observed from shore and boats, and is known for its charisma, it may be surprising that the diets of both the coastal and offshore bottlenose dolphins are still largely unknown. Such is the challenge of studying animals that live and feed underwater. I wish I could simply ask a dolphin, much like I would ask staff at restaurants: what is on the menu today? But, unfortunately, that is not possible. Instead, we must make educated hypotheses about the diets of both ecotypes based on necropsies and stable isotope studies, and behavioral and spatial surveys. And, I will continue to look to new technologies and creative thinking to provide the answers we are seeking.

Literature cited:

Ballance, L. T. (1992). Habitat use patterns and ranges of the bottlenose dolphin in the Gulf of California, Mexico. Marine Mammal Science8(3), 262-274.

Barros, N.B., and D. K. Odell. (1990). Food habits of bottlenose dolphins in the southeastern United States. Pages 309-328 in S. Leatherwood and R. R. Reeves, eds. The bottlenose dolphin. Academic Press, San Diego, CA.

Barros, N., E. Parsons and T. Jefferson. (2000). Prey of bottlenose dolphins from the South China Sea. Aquatic Mammals 26:2–6.

Clarke, M. 1986. Cephalopods in the diet of odontocetes. Pages 281–321 in M. Bryden and R. Harrison, eds. Research on dolphins. Clarendon Press, Oxford, NY.

Cockcroft, V., and G. Ross. (1990). Food and feeding of the Indian Ocean bottlenose dolphin off southern Natal, South Africa. Pages 295–308 in S. Leatherwood and R. R. Reeves, eds. The bottlenose dolphin. Academic Press, San Diego, CA.

Defran, R. H., Weller, D. W., Kelly, D. L., & Espinosa, M. A. (1999). Range characteristics of Pacific coast bottlenose dolphins (Tursiops truncatus) in the Southern California Bight. Marine Mammal Science15(2), 381-393.

Díaz‐Gamboa, R. E., Gendron, D., & Busquets‐Vass, G. (2018). Isotopic niche width differentiation between common bottlenose dolphin ecotypes and sperm whales in the Gulf of California. Marine Mammal Science34(2), 440-457.

Gonzalez, A., A. Lopez, A. Guerra and A. Barreiro. (1994). Diets of marine mammals stranded on the northwestern Spanish Atlantic coast with special reference to Cephalopoda. Fisheries Research 21:179–191.

Hanson, M. T., and Defran, R. H. (1993). The behavior and feeding ecology of the Pacific coast bottlenose dolphin, Tursiops truncatus. Aquatic Mammals19, 127-127.

Norris, K. S., and J. H. Prescott. (1961). Observations on Pacific cetaceans of Californian and Mexican waters. University of California Publications of Zoology 63:29, 1-402.

Shane, S. H. (1990). Comparison of bottlenose dolphin behavior in Texas and Florida, with a critique of methods for studying dolphin behavior. Pages 541-558 in S. Leatherwood and R. R. Reeves, eds. The bottlenose dolphin. Academic Press, San Diego, CA.

Shane, S., R. Wells and B. Wursig. (1986). Ecology, behavior and social organization of bottlenose dolphin: A review. Marine Mammal Science 2:34–63.

Walker, W.A. (1981). Geographical variation in morphology and biology of the bottlenose dolphins (Tursiops) in the eastern North Pacific. NMFS/SWFC Administrative Report. No, LJ-91-03C.

Walker, J., C. Potter and S. Macko. (1999). The diets of modern and historic bottlenose dolphin populations reflected through stable isotopes. Marine Mammal Science 15:335–350.
“Do Dolphins Get Hives?”: The Skinny on Allergies in Cetaceans

By: Alexa Kownacki, Ph.D. Student, OSU Department of Fisheries and Wildlife, Geospatial Ecology of Marine Megafauna Lab 

While sitting on my porch and watching the bees pollinate the blooming spring flowers, I intermittently pause to scratch the hives along my shoulders and chest. In the middle of my many Zoom calls, I mute myself and stop my video because a wave of pollen hits my face and I immediately have to sneeze. With this, I’m reminded: Welcome to prime allergy season in the Northern Hemisphere. As I was scratching my chronic idiopathic urticaria (hives caused by an overactive immune system), I asked myself “Do dolphins get hives?” I had no idea. I know most terrestrial mammals can and do—just yesterday, one of the horses in the nearby pasture was suffering from a flare of hives. But, what about aquatic and marine mammals? 

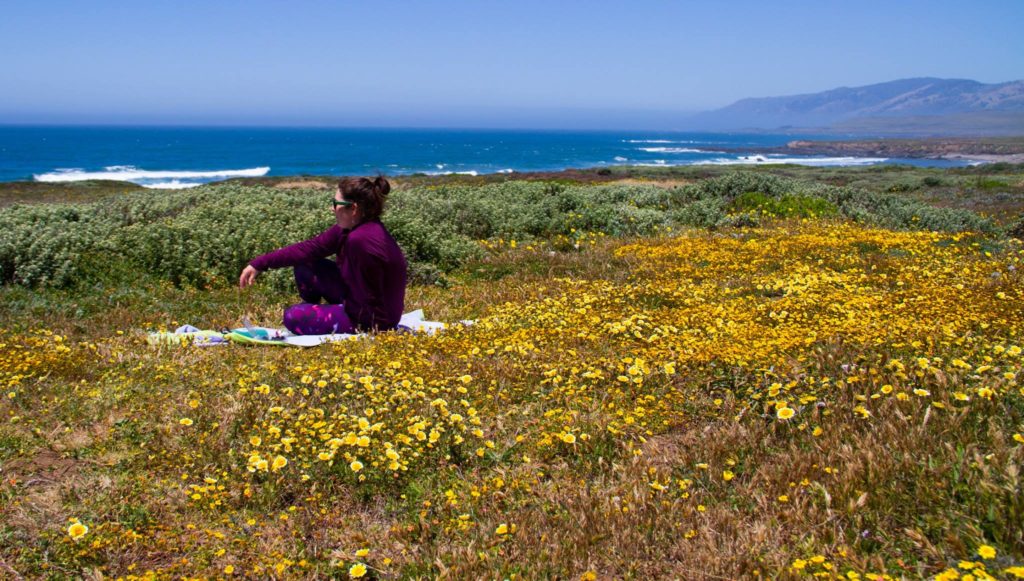
Springtime flowers blooming on the Central California Coast 2017. (Image Source: A. Kownacki)

As with most research on marine mammal health, knowledge is scare and is frequently limited to studies conducted on captive and stranded animals. Additionally, most of the current theories on allergic reactions in marine mammals are based on studies from terrestrial wildlife and humans. Because nearly all research on histamine pathways centers on terrestrial animals, I wanted to see what information exists the presence of skin allergies in marine mammals.  

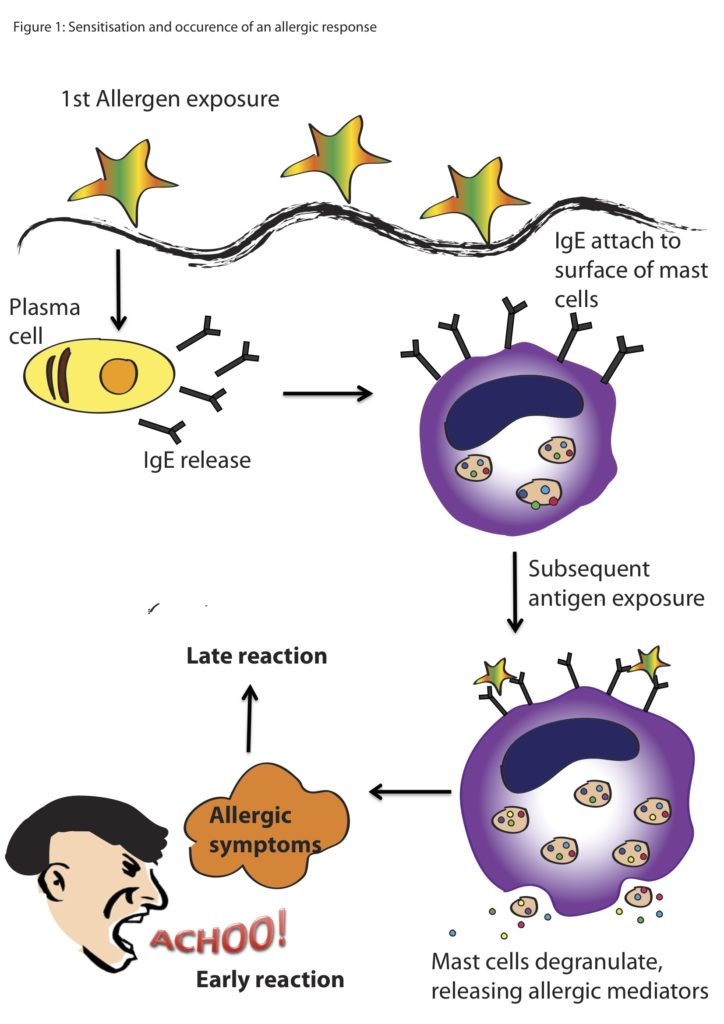
Allergic reactions trigger a cascade within the body, beginning with the introduction of a foreign body, which for many people is pollen. The allergen binds to antibodies that are produced to fight potentially harmful substances. Once this allergen binds to different types of cells, including mast cells, chemicals like histamines are released. Histamines cause the production of mucus and constriction of blood vessels, and thus are the reason your eyes water, your nose runs, or you start coughing. 

Basic cartoon of an allergic reaction from exposure to the allergen to the reaction from the animal. (Image Source: Scientific Malaysian)

As you probably can tell just by looking at a marine mammal, they have thicker skin and fewer mucus membranes that humans, due to the fact that they live in the water. However, mast cells or mast cell-like cells have been described in most vertebrate lineages including mammals, birds, reptiles, amphibians, and bony fishes (Hellman et al. 2017, Reite and Evenson 2006). Mast cell-like cells have also been described in an early ancestor of the vertebrates, the tunicate, or sea squirt (Wong et al. 2014). Therefore, allergic-reaction cascades that may present as hives, red and itchy eyes or nose in humans, also exist in marine mammals, but perhaps cause different or less visible symptoms.  

Skin conditions in cetaceans are gathering interest within the marine mammal health community. Even our very own Dawn BarlowDr. Leigh Torres, and Acacia Pepper assessed the skin conditions in New Zealand blue whales in their recent publication. Most visible skin lesions or markings on cetaceans are caused by parasites, shark bits, fungal infections, and fishery or boat interactions (Leone et al. 2019, Sweeney and Ridgway 1985). However, there is very little scientific literature about allergic reactions in marine mammals, let alone cetaceans. That being said, I managed to find a few critical pieces of information supporting the theory that marine mammals do in fact have allergies that can produce dermal reactions similar to hives in humans.  

In one study, three captive bottlenose dolphins developed reddened skin, sloughing, macules, and wheals on their ventral surfaces (Monreal-Pawlowsky et al. 2017). The medical staff first noticed this atopic dermatitis in 2005 and observed the process escalate over the next decade. Small biopsy samples from the affected areas on the three dolphins coincided with the appearance of four pollens in the air within the geographic region: Betula, Pistacia, Celtis, and Fagus (Monreal-Pawlowsky et al. 2017). Topical prednisone treatments were applied to the affected areas at various dosages that slowly resolved the skin irritations. Researchers manufactured an allergy vaccine using a combination of the four pollens in hopes that it would prevent further seasonal outbreaks, but it was unsuccessful. In the coming years, the facility intends to adjust the dosages to create a successful vaccine.  

In the three top images, visible skin irritation including redness, macules, wheals, and sloughing are present. In the image below, the above animal was treated with methylprednisolone and the skin irritation subsides. (Monreal-Pawlowsky et al. 2017)

In addition to the above study, there is an unpublished case of suspected allergic reaction to another pollen that produces a pruritic reaction on the ventral areas of dolphins on a seasonal basis (Vicente Arribes, personal communication). Although there are only a few documented cases of environmentally-triggered allergic reactions that are visible on the dermal layer of cetaceans, I believe this evidence makes the case that some cetaceans suffer from allergies much like us. So, next time you’re enjoying the beautiful blooms and annoyingly scratch your eyes, know that you are not alone. 

Image Source: FurEver Family

Citations: 

Barlow DR, Pepper AL and Torres LG (2019) Skin Deep: An Assessment of New Zealand Blue Whale Skin Condition. Front. Mar. Sci. 6:757.doi: 10.3389/fmars.2019.00757 

Hellman LT, Akula S, Thorpe M and Fu Z (2017) Tracing the Origins of IgE, Mast Cells, and Allergies by Studies of Wild Animals. Front. Immunol. 8:1749. doi: 10.3389/fimmu.2017.01749 

Leone AB, Bonanno Ferraro G, Boitani L, Blasi MF. Skin marks in bottlenose dolphins (Tursiops truncatus) interacting with artisanal fishery in the central Mediterranean Sea. PLoS One. 2019;14(2):e0211767. Published 2019 Feb 5. doi:10.1371/journal.pone.0211767 

Monreal-Pawlowsky T, Fernández-Bellon H, Puigdemont A (2017) Suspected Allergic Reaction in Bottlenose Dolphins (Tursiops truncatus). J Vet Sci Ani Husb 5(1): 108. doi: 10.15744/2348-9790.5.108 

Reite OB, Evensen O. Inflammatory cells of teleostean fish: a review focusing on mast cells/eosinophilic granule cells and rodlet cells. Fish Shellfish Immunol (2006) 20:192–208. doi:10.1016/j.fsi.2005.01.012 

Sweeney, J. C., & Ridgway, S. H. (1975). Common diseases of small cetaceans. J. Am. Vet. Med. Assoc167(7), 533-540. 

Wong GW, Zhuo L, Kimata K, Lam BK, Satoh N, Stevens RL. Ancient originof mast cells. Biochem Biophys Res Commun (2014) 451:314–8. doi:10.1016/j.bbrc.2014.07.124 

Humans Hide and Wildlife Thrive: Human-mediated ecosystem changes during a pandemic

By: Alexa Kownacki, Ph.D. Student, OSU Department of Fisheries and Wildlife, Geospatial Ecology of Marine Megafauna Lab

We live in an interesting time. Many of us academic scientists sit in the confines of our homes, reading scientific papers, analyzing years-worth of data, working through a years-worth of house projects, or simply watching Netflix. While we are confined to a much smaller area, wildlife is not.  

During this challenging situation we have unique opportunities to study what happens when people are not outside for recreation. All of us who feel trapped inside our homes are not only saving human lives, we are changing ecosystems. Humans are constantly molding our ecosystems on fine and grand scales, from xeriscaping our lawns with native, drought-resistant plants to developing large plots of land for new homes. We manipulate nature, for better or for worse.

So, what happens when we change our behavior? Rather than driving, we’re gardening, instead of playing at parks, we’re playing board games at our kitchen tables; we as a society are completely changing our habitat-use patterns. When any top predator changes its habitat-use, switches niches, or drastically changes its behaviors, there are top-down ecosystem effects. When one species changes its behavior, there are major downstream impacts on predation, foraging, diet, and habitat use. For example, when bluegill sunfish underwent large shifts in both diet and habitat, major predator-mediated habitat use changes in other species occurred (Mittelbach 1986). There are multiple studies describing the impacts of human-mediated drivers on ecosystems worldwide. In coastal environments, anthropogenic activities, specifically shipping, industry, and urban development, dramatically change both the coastal and marine ecosystems (Mead et al. 2013).

The highly developed coastline along Los Angeles, CA is a prime example of urban development. (Image source: LA Magazine.)

By far the most pronounced example of how an international halt on travel can alter ecosystems comes from the tragic terrorist attacks on September 11, 2001. Prior to this current, viral pandemic, the events following 9/11 were the first time that nearly all major transit stopped in the USA—including airplanes and major shipping traffic. This halt created a unique opportunity to study some of the secondary impacts, such as a reduction in shipping traffic noise, on cetaceans. Following 9/11, there was a six decibel decrease in underwater noise that co-occurred with a decrease in stress hormones of endangered North Atlantic right whales (Rolland et al. 2012). When I first read about this study, my first thought was “leave it to scientists to make the best out of a terrible situation.” Truly, learning from nature, even in the darkest of days, is an incredible skillset. Research like this inspires me to ask questions about what changes are happening in ecosystems now because of recent events. For example, the entire port of San Diego, its beaches and bays, are closed for all recreational activity and I wonder how this reduction in traffic is similar to the post-9/11 study but on bottlenose dolphins, gray whales, and pinnipeds that are coast-associated. Are urban and suburban neighborhoods slowly becoming more rural and making space for wildlife again?

My dad lives in a suburban neighborhood of San Diego, CA. In the past few weeks, his “Ring doorbell camera” captured a bobcat walking along the raised brick path multiple times. (Media source: Eric Kownacki)

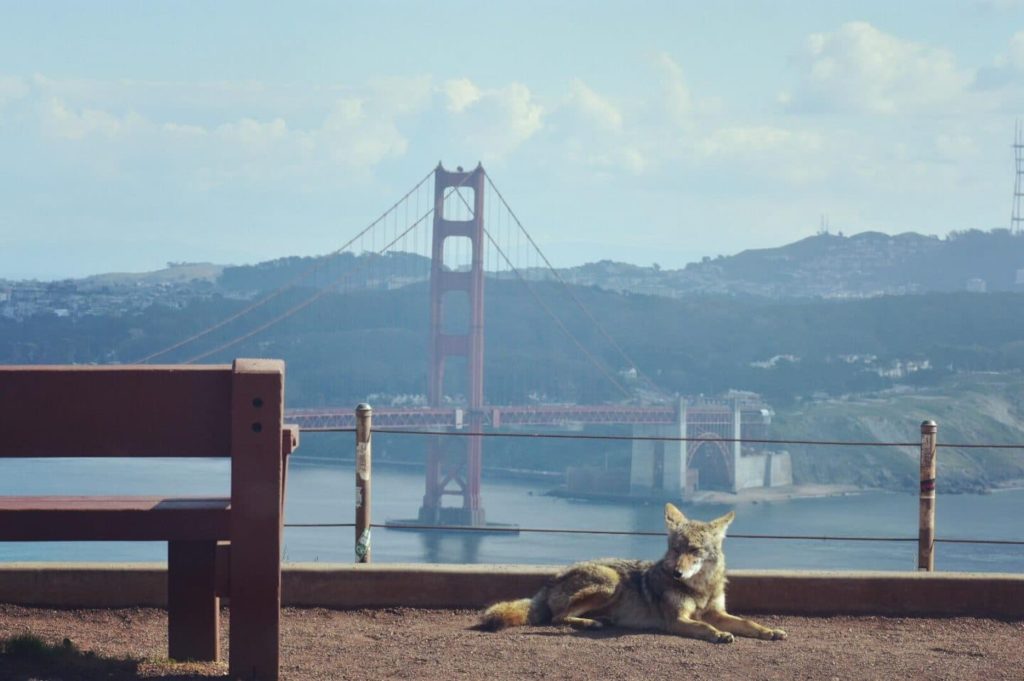
There is increasing news coverage on wild animals “taking over” cities. Dr. Leila Lemos touched on this earlier with her blog post centering on how academics are changing their means of teaching, conferencing, and learning. There are photos of wild goats running through the streets of Wales, UK, coyotes roaming the streets of San Francisco, CA, USA, monkeys swarming the streets in Thailand, pumas wandering the streets of Santiago, Chile, and Sika deer peering into empty restaurants in Nara, Japan (Colarossi 2020). In reality, this wildlife was likely part of the ecosystem prior to the formation of these cities but was forced out of the more urban centers. As we sit in our homes, rather than looking bleakly onto empty streets, we can search for wildlife, create a backyard birding competition with your friends, guess which flowers will bloom first, and ask questions of our changing ecosystems.

Coyote at a park in northern California with the San Francisco Golden Gate Bridge in the background. (Image source: u/beccatravels via Reddit)

Citations:

Colarossi, Natalie. “Photos Show Wild Animals Roaming Empty Streets as Coronavirus Lockdowns Keep Humans Inside.” Insider, Insider, 2 Apr. 2020, www.insider.com/photos-show-animals-roaming-empty-streets-during-coronavirus-lockdowns-2020-4#in-santiago-chile-a-wild-puma-was-seen-pacing-through-the-quiet-streets-according-to-the-chilean-agricultural-and-livestock-service-the-puma-came-down-from-the-mountains-after-seeing-the-streets-were-largely-empty-6.

Mead, A., Griffiths, C.L., Branch, G.M., McQuaid, C.D., Blamey, L.K., Bolton, J.J., Anderson, R.J., Dufois, F., Rouault, M., Froneman, P.W. and Whitfield, A.K., 2013. Human-mediated drivers of change—impacts on coastal ecosystems and marine biota of South Africa. African Journal of Marine Science35(3), pp.403-425.

Mittelbach, Gary. 1986. Predator-mediated habitat use: some consequences for species interactions. Environ Biol Fish 16, 159–169. https://doi.org/10.1007/BF00005168

Rolland, R.M., Parks, S.E., Hunt, K.E., Castellote, M., Corkeron, P.J., Nowacek, D.P., Wasser, S.K. and Kraus, S.D., 2012. Evidence that ship noise increases stress in right whales. Proceedings of the Royal Society B: Biological Sciences279(1737), pp.2363-2368.

Cooperative Fishing: Symbiotic Relationships between People and Dolphins

By: Alexa Kownacki, Ph.D. Student, OSU Department of Fisheries and Wildlife, Geospatial Ecology of Marine Megafauna Lab

Human-wildlife interactions have occurred since people first inhabited the Earth. However, today, when describing human-wildlife interactions specifically in relation to dolphins, frequently we hear about ‘conflicts’. Interactions between fisheries and dolphins that lead to bycatch or depredation (stealing bait/catching from gear) are particularly common. But, symbiotic relationships with dolphin species and certain human groups can also be mutualistic, with both groups benefitting. These symbiotic relationships have been around for hundreds, if not thousands of years.

A depiction of Aboriginal Australians using nets to catch fish in a small inlet with the assistance of coastal dolphins. (Image source: Our Pacific Ocean)

In eastern Australia, cooperative fishing interactions occur between Aboriginal Australians and dolphins—both bottlenose dolphins and orcas. In Burleigh Heads National Park, Queensland, AUS, the dolphins are thought to help the local indigenous Kombemerri (saltwater) people hunt for fish. Indigenous stories recall men wading into the water with their spears and nets. Then, many of the men would hit the surface waters to make noises with the splashes. Underwater, this sound was amplified and then the dolphins would begin chasing the fish toward the men and their nets (Neil 2002). Aboriginal Australians, especially those in eastern Australia have an emotional and spiritual connection to both dolphins and orcas. There are widespread accounts of cooperation between indigenous people and small cetaceans on the eastern Australian coastline, which create both context and precedent for the economic and emotional objectives to contemporary human-dolphin interactions such as dolphin provisioning (Neil 2002).

Dolphins and fishermen work together in Laguna, Brazil, to catch mullet. (Image Source: Fábio Daura-Jorge)

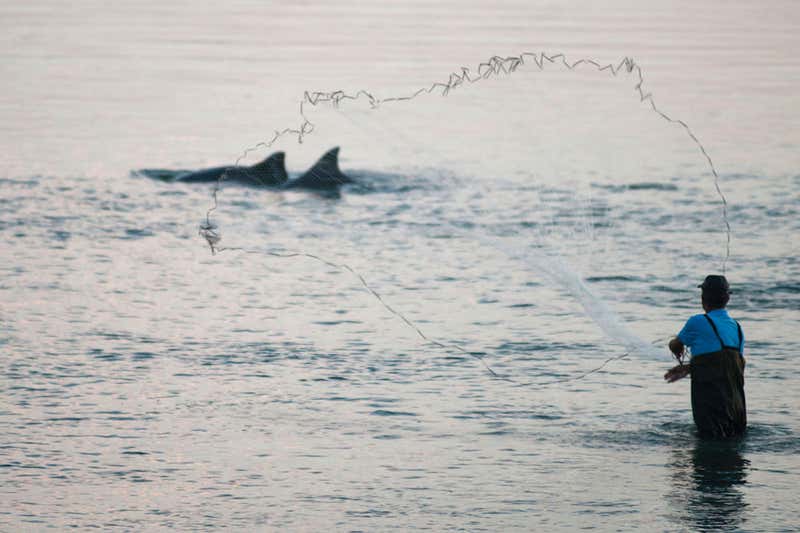
In the coasts off of Laguna, Brazil, bottlenose dolphins and local fishermen cooperatively fish while tourists gather to watch. Previously, PhD candidate Leila Lemos wrote about these interactions in a blog post. Like many groups of socializing dolphins, these dolphins have a unique whistle to recognize each other. The waters surrounding Laguna, Brazil are murky, turbid and dark green to the point where the fisherman cannot see any of the fish in the water. As the fishermen wade into the murky waters, bottlenose dolphins chase shoals of mullet toward the shore. Then the dolphins tail slap or abruptly dive, “signaling” the fishermen to cast their nets. Research has shown that when the fishermen “work with” the dolphins, both the dolphins and the people catch more, larger fish (Roman 2013). One fisherman claims it is not worth fishing unless the dolphins are around (Roman 2013). Here, the fishermen know the dolphins based on their markings. They know which dolphins participate in the different parts of hunting as well—which dolphin initiates the tail slap, which dolphin usually circles the fish, and which drive the fish towards the coastline. After the dolphins round up and chase the fish for the fishermen and themselves, there is no “reward” from the fishermen for the dolphins—no fish tossed their way. Scientists also found there is a difference in whistle structure between cooperative and non-cooperative dolphin groups (Preston 2017).

A fisherman in Brazil throws a net after dolphins chase mullet into the shore. (Image Source: Leo Francini:Alamy Stock Photo)

Along most coastlines worldwide, humans and dolphins are competitors. Dolphins are seen as thieves who steal fish out of nets, or get caught in their gear and ruin fishing opportunities. Thus, dolphins are often unwelcome near fishing communities. Such negative interactions sometimes lead to human-caused fatalities of dolphin from gunshots or stabbings, thought to be from angry fishermen.  Yet, in this same world, fishermen thank the dolphins for bringing their catch to them. Clearly, both humans and dolphins share high intelligence levels and skills in fishing. If it is a matter of two minds are better than one, then I think indigenous communities figured this equation out first: working with the dolphins, and not against, can better feed their people.

Citations:

Neil, David. (2002). Cooperative fishing interactions between Aboriginal Australians and dolphins in eastern Australia. Anthrozoos: A Multidisciplinary Journal of The Interactions of People & Animals. 15. 10.2752/089279302786992694.

Preston, Elizabeth. “Dolphins That Work with Humans to Catch Fish Have Unique Accent.” New Scientist, 2 Oct. 2017, www.newscientist.com/article/2149139-dolphins-that-work-with-humans-to-catch-fish-have-unique-accent/.

Roman, Joe. “Fishing with Dolphins: An astonishing cooperative venture in which every species wins but the fish.” Slate Magazine, 31 Jan. 2013, slate.com/technology/2013/01/fishing-with-dolphins-symbiosis-between-humans-and-marine-mammals-to-catch-more-fish.html.

Toxins in Marine Mammals: a Story

By: Alexa Kownacki, Ph.D. Student, OSU Department of Fisheries and Wildlife, Geospatial Ecology of Marine Megafauna Lab

As technology has developed over the past ten years, toxins in marine mammals have become an emerging issue. Environmental toxins are anything that can pose a risk to the health of plants or animals at a dosage. They can be natural or synthetic with varying levels of toxicity based on the organism and its physiology. Most prior research on the impacts toxins before the 2000s was conducted on land or in streams because of human proximity to these environments. However. with advancements in sampling methods, increasing precision in laboratory testing, and additional focus from researchers, marine mammals are being assessed for toxin loads more regularly.

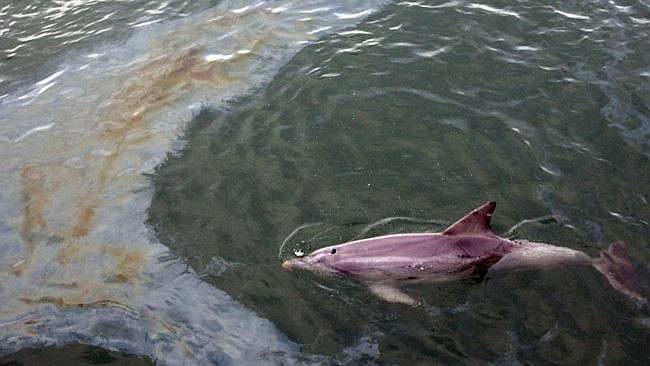
A dolphin swims through a diesel slick caused by a small oil spill in a port. (Image Source: The Ocean Update Blog)

Marine mammals live most of their lives in the ocean or other aquatic systems, which requires additional insulation for protection from both cold temperatures and water exposure. This added insulation can take the form of lipid rich blubber, or fur and hair. Many organic toxins are lipid soluble and therefore are more readily found and stored in fatty tissues. When an organic toxin like a polychlorinated biphenyl (PCB) is released into the environment from an old electrical transformer, it persists in sediments. As these sediments travel down rivers and into the ocean, these toxic substances slowly degrade in the environment and are lipophilic (attracted to fat). Small marine critters eat the sediment with small quantities of toxins, then larger critters eat those small critters and ingest larger quantities of toxins. This process is called biomagnification. By the time a dolphin consumes large contaminated fishes, the chemical levels may have reached a toxic level.

The process by which PCBs accumulate in marine mammals from small particles up to high concentrations in lipid layers. (Image Source: World Ocean Review)

Marine mammal scientists are teaming with biochemists and ecotoxicologists to better understand which toxins are more lethal and have more severe long-term effects on marine mammals, such as decreased reproduction rates, lowered immune systems, and neurocognitive delays. Studies have already shown that higher contaminant loads in dolphins cause all three of these negative effects (Trego et al. 2019). As a component of my thesis work on bottlenose dolphins I will be measuring contaminant levels of different toxins in blubber.  Unfortunately, this research is costly and time-consuming. Many studies regarding the effects of toxins on marine mammals are funded through the US government, and this is where the public can have a voice in scientific research.

Rachel Carson examines a specimen from a stream collection site in the 1950s. (Image Source: Alfred Eisenstaedt/ The LIFE picture collection/ Getty Images.)

Prior to the 1960s, there were no laws regarding the discharge of toxic substances into our environment. When Rachel Carson published “Silent Spring” and catalogued the effects of pesticides on birds, the American public began to understand the importance of environmental regulation. Once World War II was over and people did not worry about imminent death due to wartime activities, a large portion of American society focused on what they were seeing in their towns: discharges from chemical plants, effluents from paper mills, taconite mines in the Great Lakes, and many more.

Discharge from a metallic sulfide mine collects in streams in northern Wisconsin. (Image Source: Sierra Club)

However, it was a very different book regarding pollutants in the environment that caught my attention – and that of a different generation and part of society – even more than “Silent Spring”. A book called “The Lorax”.  In this 1972 children’s illustrated book by Dr. Seuss, a character called the Lorax “speaks for the trees”. The Lorax touches upon critical environmental issues such as water pollution, air pollution, terrestrial contamination, habitat loss, and ends with the poignant message, “Unless someone like you cared a whole awful lot, nothing is going to get better. It’s not.”

The original book cover for “The Lorax” by Dr. Seuss. (Image source: Amazon.com)

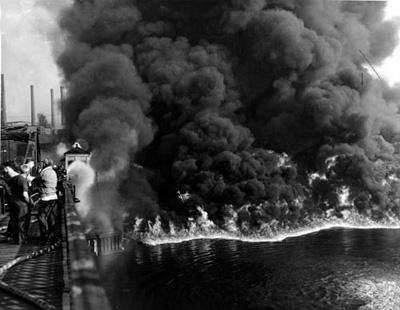
Within a decade, the US Environmental Protection Agency (EPA) was formed and multiple acts of congress were put in place, such as the National Environmental Policy Act, Clean Air Act, Clean Water Act, and Toxic Substances Control Act, with a mission to “protect human health and the environment.” The public had successfully prioritized protecting the environment and the government responded. Before this, rivers would catch fire from oil slicks, children would be banned from entering the water in fear of death, and fish would die by the thousands. The resulting legislation cleaned up our air, rivers, and lakes so that people could swim, fish, and live without fear of toxic substance exposures.

The Cuyahoga River on fire in June 1969 after oil slicked debris ignited. (Image Source: Ohio Central History).

Fast forward to 2018 and times have changed yet again due to fear. According to a Pew Research poll, terrorism is the number one issue that US citizens prioritize, and Congress and the President should address. The environment was listed as the seventh highest priority, below Medicare (“Majorities Favor Increased Spending for Education, Veterans, Infrastructure, Other Govt. Programs.”). With this societal shift in priorities, research on toxins in marine mammals may no longer grace the covers of the National Geographic, Science, or Nature, not for lack of importance, but because of the allocation of taxpayer funds and political agendas. Meanwhile, long-lived marine mammals will still be accumulating toxins in their blubber layers and we, the people, will need to care a whole lot, to save the animals, the plants, and ultimately, our planet.

The Lorax telling the reader how to save the planet. (Image Source: “The Lorax” by Dr. Seuss via the Plastic Bank)

Citations:

“Majorities Favor Increased Spending for Education, Veterans, Infrastructure, Other Govt. Programs.” Pew Research Center for the People and the Press, Pew Research Center, 11 Apr. 2019, www.people-press.org/2019/04/11/little-public-support-for-reductions-in-federal-spending/pp_2019-04-11_federal-spending_0-01-2/.

Marisa L. Trego, Eunha Hoh, Andrew Whitehead, Nicholas M. Kellar, Morgane Lauf, Dana O. Datuin, and Rebecca L. Lewison. Environmental Science & Technology 2019 53 (7), 3811-3822. DOI: 10.1021/acs.est.8b06487

Vaquita: a porpoise caught between people and money

By: Alexa Kownacki, Ph.D. Student, OSU Department of Fisheries and Wildlife, Geospatial Ecology of Marine Megafauna Lab

When I first learned of the critically endangered vaquita in early 2015, there were an estimated 97 individuals remaining as reported by CIRVA* (Morell 2014). I was a recent graduate with a bachelor’s degree in Wildlife, Fish, and Conservation Biology, and I, of all people, had never heard of the vaquita. Today, there are an estimated 19 vaquita left (Roth 2019).

Digital painting of a vaquita mother with her calf (Image Source: Aquarium of the Pacific).

The vaquita (Phocoena sinus) is a small porpoise endemic to the Sea of Cortez in the northern region of the Gulf of California, Mexico. It is the most endangered marine mammal and has been for many years, and yet, I had not heard of the vaquita. It wasn’t until I listened to a lunchtime seminar hosted by NOAA Fisheries, that I heard about the porpoise. As a young scientist, “in the field”, I was shocked to realize that I was just learning about an animal, let alone a cetacean, actively going extinct in my lifetime. I believe it’s our job to inform those around us of news in our expertise, and I had failed. I wasn’t informed. As much as I tried in the past four years to describe the decline of the smallest cetacean to anyone who’d listen, I was only reaching a few people at a time. But, today, the vaquita is finally capturing the public’s eye thanks to celebrity support and a feature-length film.

A rare photo of a vaquita (Image Source: Tom Jefferson via the Marine Mammal Center)

From executive producer, Leonardo DiCaprio, comes the Sundance Film Festival Audience Award winner, “Sea of Shadows”. The story of the vaquita truly is an “eco-thriller” and one worth watching. This is not your typical plot line of an endangered species tragically going extinct without action. The vaquita’s story boasts big-name players, such as the Mexican Navy, internationally recognized scientists, Mexican cartels, Chinese mafia, celebrities, the National Marine Mammal Foundation, and Sea Shepherd. At the center of this documentary is the elusive vaquita. The vaquita is not hunted, in fact, this species is not desirable for fisherman. The animal is not aggressive and, in contrast, is notoriously shy, only surfacing to breathe. Furthermore, its name roughly translates into “little cow” because of the rings around its eyes and its docile nature. So, why is this cute creature on the road to extinction? The answer: the wrong place at the wrong time.

“Sea of Shadows” official trailer by National Geographic

The vaquita occupy a small part of the Sea of Cortez where totoaba (Totoaba macdonaldi), a large fish in the drum family, is also endemic. If you’re wondering what a small porpoise and a large fish have in common, then you’d be close to recognizing that is the key to understanding this tragedy. Both species are roughly the same size, one to two meters in length with similar girths. The totoaba, although said to have tender meat, is caught for only one organ: the swim bladder. Now referred to as the “cocaine of the sea”, the dried swim bladders of the totoaba are sold to Mexican cartels who then export the product to China. Once in China, illegal markets sell the swim bladders for up to $100,000USD. Unfortunately, the nets used to illegally catch totoaba, also catch the vaquita. The porpoise has no economic value to the fishermen and therefore are tossed as bycatch. The vaquita is the innocent bystander in a war for money and power.

A man displays the catch from an illegal gillnet, including the totoaba in his arms, and a vaquita, below, that was bycatch (Image Source: Omar Vidal via Aquarium of the Pacific/NOAA Fisheries).

Watching a charismatic species severely decline because of human greed is horrific. The film, however, focuses on the effort of a few incredible organizations that band together in the fight to save the vaquita. Moreover, the multimillion-dollar project, Vaquita CPR, is still ongoing. On a more positive note, in October of 2019, scientists spotted six vaquita during continued conservation and monitoring efforts (Blust & Desk 2019). The path to saving a critically endangered species, especially one that is thought not to do well in captivity, is challenging. The vaquita’s recovery path has many complicated connections which for what appears to be an uphill battle. But, we, the people, are responsible for this. We must support research and conservation by using our voice to share what is happening, for a porpoise and for the world.

*Comité Internacional para la Recuperación de la Vaquita (International Committee for the Recovery of the Vaquita)

Citations:

Blust, Kendal, and Fronteras Desk. “Photo Sparks Increased Concern over Fishing in Vaquita Refuge.” Arizona Public Media, 25 Oct. 2019, https://news.azpm.org/p/news-topical-nature/2019/10/25/160806-photo-sparks-increased-concern-over-fishing-in-vaquita-refuge/.

Morell, Virginia. “Vaquita Porpoise Faces Imminent Extinction-Can It Be Saved?” National Geographic, 15 Aug. 2014, https://www.nationalgeographic.com/news/2014/8/140813-vaquita-gulf-california-mexico-totoaba-gillnetting-china-baiji/.

Roth, Annie. “The ‘Little Cow’ of the Sea Nears Extinction.” National Geographic, 17 Sept. 2019, https://www.nationalgeographic.com/animals/2019/09/vaquita-the-porpoise-familys-smallest-member-nears-extinction/#close.

The significance of blubber hormone sampling in conservation and monitoring of marine mammals

By: Alexa Kownacki, Ph.D. Student, OSU Department of Fisheries and Wildlife, Geospatial Ecology of Marine Megafauna Lab

Marine mammals are challenging to study for many reasons, and specifically because they inhabit the areas of the Earth that are uninhabited by people: the oceans. Monitoring marine mammal populations to gather baselines on their health condition and reproductive status is not as simple as trap and release, which is a method often conducted for terrestrial animals. Marine mammals are constantly moving in vast areas below the surface. Moreover, cetaceans, which do not spend time on land, are arguably the most challenging to sample.

One component of my project, based in California, USA, is a health assessment analyzing hormones of the bottlenose dolphins that frequent both the coastal and the offshore waters. Therefore, I am all too familiar with the hurdles of collecting health data from living marine mammals, especially cetaceans. However, the past few decades have seen major advancements in technology both in the laboratory and with equipment, including one tool that continues to be critical in understanding cetacean health: blubber biopsies.

Biopsy dart hitting a bottlenose dolphin below the dorsal fin. Image Source: NMFS

Blubber biopsies are typically obtained via low-powered crossbow with a bumper affixed to the arrow to de-power it once it hits the skin. The arrow tip has a small, pronged metal attachment to collect an eraser-tipped size amount of tissue with surface blubber and skin. I compare this to a skin punch biopsies in humans; it’s small, minimally-invasive, and requires no follow-up care. With a small team of scientists, we use small, rigid-inflatable vessels to survey the known locations of where the bottlenose dolphins tend to gather. Then, we assess the conditions of the seas and of the animals, first making sure we are collecting from animals without potentially lowered immune systems (no large, visible wounds) or calves (less than one years old). Once we have photographed the individual’s dorsal fin to identify the individual, one person assembles the biopsy dart and crossbow apparatus following sterile procedures when attaching the biopsy tips to avoid infection. Another person prepares to photograph the animal to match the biopsy information to the individual dolphin. One scientist aims the crossbow for the body of the dolphin, directly below the dorsal fin, while the another photographs the biopsy dart hitting the animal and watches where it bounces off. Then, the boat maneuvers to the floating biopsy dart to recover the dart and the sample. Finally, the tip with blubber and skin tissue is collected, again using sterile procedures, and the sample is archived for further processing. A similar process, using an air gun instead of a crossbow can be viewed below:

GEMM Lab members using an air gun loaded with a biopsy dart to procure marine mammal blubber from a blue whale in New Zealand. Video Source: GEMM Laboratory.

Part of the biopsy process is holding ourselves to the highest standards in our minimally-invasive technique, which requires constant practice, even on land.

Alexa practicing proper crossbow technique on land under supervision. Image Source: Alexa Kownacki

Blubber is the lipid-rich, vascularized tissue under the epidermis that is used in thermoregulation and fat storage for marine mammals. Blubber is an ideal matrix for storing lipophilic (fat-loving) steroid hormones because of its high fat content. Steroid hormones, such as cortisol, progesterone, and testosterone, are naturally circulating in the blood stream and are released in high concentrations during specific events. Unlike blood, blubber is less dynamic and therefore tells a much longer history of the animal’s nutritional state, environmental exposure, stress level, and life history status. Blubber is the cribs-notes version of a marine mammal’s biography over its previous few months of life. Blood, on the other hand, is the news story from the last 24 hours. Both matrices serve a specific purpose in telling the story, but blubber is much more feasible to obtain from a cetacean and provides a longer time frame in terms of information on the past.

A simplified depiction of marine mammal blubber starting from the top (most exterior surface) being the skin surface down to the muscle (most interior). Image Source: schoolnet.org.za

I use blubber biopsies for assessing cortisol, testosterone, and progesterone in the bottlenose dolphins. Cortisol is a glucocorticoid that is frequently associated with stress, including in humans. Marine mammals utilize the same hypothalamic-pituitary-adrenal (HPA) axis that is responsible for the fight-or-flight response, as well as other metabolic regulations. During prolonged stressful events, cortisol levels will remain elevated, which has long-term repercussions for an animal’s health, such as lowered immune systems and decreased ability to respond to predators. Testosterone and progesterone are sex hormones, which can be used to indicate sex of the individual and determine reproductive status. This reproductive information allows us to assess the population’s composition and structure of males and females, as well as potential growth or decline in population (West et al. 2014).

Alexa using a crossbow from a small boat off of San Diego, CA. Image Source: Alexa Kownacki

The coastal and offshore bottlenose dolphin ecotypes of interest in my research occupy different locations and are therefore exposed to different health threats. This is a primary reason for conducting health assessments, specifically analyzing blubber hormone levels. The offshore ecotype is found many kilometers offshore and is most often encountered around the southern Channel Islands. In contrast, the coastal ecotype is found within 2 kilometers of shore (Lowther-Thieleking et al. 2015) where they are subjected to more human exposure, both directly and indirectly, because of their close proximity to the mainland of the United States. Coastal dolphins have a higher likelihood of fishery-related mortality, the negative effects of urbanization including coastal runoff and habitat degradation, and recreational activities (Hwang et al. 2014). The blubber hormone data from my project will inform which demographics are most at-risk. From this information, I can provide data supporting why specific resources should be allocated differently and therefore help vulnerable populations. Further proving that the small amount of tissue from a blubber biopsy can help secure a better future for population by adjusting and informing conservation strategies.

Literature Cited:

Hwang, Alice, Richard H Defran, Maddalena Bearzi, Daniela. Maldini, Charles A Saylan, Aime ́e R Lang, Kimberly J Dudzik, Oscar R Guzo n-Zatarain, Dennis L Kelly, and David W Weller. 2014. “Coastal Range and Movements of Common Bottlenose Dolphins (Tursiops Truncatus) off California and Baja California, Mexico.” Bulletin of the Southern California Academy of Sciences 113 (1): 1–13. https://doi.org/10.3390/toxins6010211.

Lowther-Thieleking, Janet L., Frederick I. Archer, Aimee R. Lang, and David W. Weller. 2015. “Genetic Differentiation among Coastal and Offshore Common Bottlenose Dolphins, Tursiops Truncatus, in the Eastern North Pacific Ocean.” Marine Mammal Science 31 (1): 1–20. https://doi.org/10.1111/mms.12135.

West, Kristi L., Jan Ramer, Janine L. Brown, Jay Sweeney, Erin M. Hanahoe, Tom Reidarson, Jeffry Proudfoot, and Don R. Bergfelt. 2014. “Thyroid Hormone Concentrations in Relation to Age, Sex, Pregnancy, and Perinatal Loss in Bottlenose Dolphins (Tursiops Truncatus).” General and Comparative Endocrinology 197: 73–81. https://doi.org/10.1016/j.ygcen.2013.11.021.

Zooming in: A closer look at bottlenose dolphin distribution patterns off of San Diego, CA

By: Alexa Kownacki, Ph.D. Student, OSU Department of Fisheries and Wildlife, Geospatial Ecology of Marine Megafauna Lab

Data analysis is often about parsing down data into manageable subsets. My project, which spans 34 years and six study sites along the California coast, requires significant data wrangling before full analysis. As part of a data analysis trial, I first refined my dataset to only the San Diego survey location. I chose this dataset for its standardization and large sample size; the bulk of my sightings, over 4,000 of the 6,136, are from the San Diego survey site where the transect methods were highly standardized. In the next step, I selected explanatory variable datasets that covered the sighting data at similar spatial and temporal resolutions. This small endeavor in analyzing my data was the first big leap into understanding what questions are feasible in terms of variable selection and analysis methods. I developed four major hypotheses for this San Diego site.

The study species: common bottlenose dolphin (Tursiops truncatus) seen along the California coastline in 2015. Image source: Alexa Kownacki.

Hypotheses:

H1: I predict that bottlenose dolphin sightings along the San Diego transect throughout the years 1981-2015 exhibit clustered distribution patterns as a result of the patchy distributions of both the species’ preferred habitats, as well as the social nature of bottlenose dolphins.

H2: I predict there would be higher densities of bottlenose dolphin at higher latitudes spanning 1981-2015 due to prey distributions shifting northward and less human activities in the northerly sections of the transect.

H3: I predict that during warm (positive) El Niño Southern Oscillation (ENSO) months, the dolphin sightings in San Diego would be distributed more northerly, predominantly with prey aggregations historically shifting northward into cooler waters, due to (secondarily) increasing sea surface temperatures.

H4: I predict that along the San Diego coastline, bottlenose dolphin sightings are clustered within two kilometers of the six major lagoons, with no specific preference for any lagoon, because the murky, nutrient-rich waters in the estuarine environments are ideal for prey protection and known for their higher densities of schooling fishes.

Data Description:

The common bottlenose dolphin (Tursiops truncatus) sighting data spans 1981-2015 with a few gap years. Sightings cover all months, but not in all years sampled. The same transect in San Diego was surveyed in a small, rigid-hulled inflatable boat with approximately a two-kilometer observation area (one kilometer surveyed 90 degrees to starboard and port of the bow).

I wanted to see if there were changes in dolphin distribution by latitude and, if so, whether those changes had a relationship to ENSO cycles and/or distances to lagoons. For ENSO data, I used the NOAA database that provides positive, neutral, and negative indices (1, 0, and -1, respectively) by each month of each year. I matched these ENSO data to my month-date information of dolphin sighting data. Distance from each lagoon was calculated for each sighting.

Figure 1. Map representing the San Diego transect, represented with a light blue line inside of a one-kilometer buffered “sighting zone” in pale yellow. The dark pink shapes are dolphin sightings from 1981-2015, although some are stacked on each other and cannot be differentiated. The lagoons, ranging in size, are color-coded. The transect line runs from the breakwaters of Mission Bay, CA to Oceanside Harbor, CA.

Results: 

H1: True, dolphins are clustered and do not have a uniform distribution across this area. Spatial analysis indicated a less than a 1% likelihood that this clustered pattern could be the result of random chance (Fig. 1, z-score = -127.16, p-value < 0.0001). It is well-known that schooling fishes have a patchy distribution, which could influence the clustered distribution of their dolphin predators. In addition, bottlenose dolphins are highly social and although pods change in composition of individuals, the dolphins do usually transit, feed, and socialize in small groups.

Figure 2. Summary from the Average Nearest Neighbor calculation in ArcMap 10.6 displaying that bottlenose dolphin sightings in San Diego are highly clustered. When the z-score, which corresponds to different colors on the graphic above, is strongly negative (< -2.58), in this case dark blue, it indicates clustering. Because the p-value is very small, in this case, much less than 0.01, these results of clustering are strongly significant.

H2: False, dolphins do not occur at higher densities in the higher latitudes of the San Diego study site. The sightings are more clumped towards the lower latitudes overall (p < 2e-16), possibly due to habitat preference. The sightings are closer to beaches with higher human densities and human-related activities near Mission Bay, CA. It should be noted, that just north of the San Diego transect is the Camp Pendleton Marine Base, which conducts frequent military exercises and could deter animals.

Figure 3. Histogram comparing the latitudes with the frequency of dolphin sightings in San Diego, CA. The x-axis represents the latitudinal difference from the most northern part of the transect to each dolphin sighting. Therefore, a small difference would translate to a sighting being in the northern transect areas whereas large differences would translate to sightings being more southerly. This could be read from left to right as most northern to most southern. The y-axis represents the frequency of which those differences are seen, that is, the number of sightings with that amount of latitudinal difference, or essentially location on the transect line. Therefore, you can see there is a peak in the number of sightings towards the southern part of the transect line.

H3: False, during warm (positive) El Niño Southern Oscillation (ENSO) months, the dolphin sightings in San Diego were more southerly. In colder (negative) ENSO months, the dolphins were more northerly. The differences between sighting latitude and ENSO index was significant (p<0.005). Post-hoc analysis indicates that the north-south distribution of dolphin sightings was different during each ENSO state.

Figure 4. Boxplot visualizing distributions of dolphin sightings latitudinal differences and ENSO index, with -1,0, and 1 representing cold, neutral, and warm years, respectively.

H4: True, dolphins are clustered around particular lagoons. Figure 5 illustrates how dolphin sightings nearest to Lagoon 6 (the San Dieguito Lagoon) are always within 0.03 decimal degrees. Because of how these data are formatted, decimal degrees is the easiest way to measure change in distance (in this case, the difference in latitude). In comparison, dolphins at Lagoon 5 (Los Penasquitos Lagoon) are distributed across distances, with the most sightings further from the lagoon.

Figure 5. Bar plot displaying the different distances from dolphin sighting location to the nearest lagoon in San Diego in decimal degrees. Note: Lagoon 4 is south of the study site and therefore was never the nearest lagoon.

I found a significant difference between distance to nearest lagoon in different ENSO index categories (p < 2.55e-9): there is a significant difference in distance to nearest lagoon between neutral and negative values and positive and neutral years. Therefore, I hypothesize that in neutral ENSO months compared to positive and negative ENSO months, prey distributions are changing. This is one possible hypothesis for the significant difference in lagoon preference based on the monthly ENSO index. Using a violin plot (Fig. 6), it appears that Lagoon 5, Los Penasquitos Lagoon, has the widest variation of sighting distances in all ENSO index conditions. In neutral years, Lagoon 0, the Buena Vista Lagoon has multiple sightings, when in positive and negative years it had either no sightings or a single sighting. The Buena Vista Lagoon is the most northerly lagoon, which may indicate that in neutral ENSO months, dolphin pods are more northerly in their distribution.

Figure 6. Violin plot illustrating the distance from lagoons of dolphin sightings under different ENSO conditions. There are three major groups based on ENSO index: “-1” representing cold years, “0” representing neutral years, and “1” representing warm years. On the x-axis are lagoon IDs and on the y-axis is the distance to the nearest lagoon in decimal degrees. The wider the shapes, the more sightings, therefore Lagoon 6 has many sightings within a very small distance compared to Lagoon 5 where sightings are widely dispersed at greater distances.


Bottlenose dolphins foraging in a small group along the California coast in 2015. Image source: Alexa Kownacki.

Takeaways to science and management: 

Bottlenose dolphins have a clustered distribution which seems to be related to ENSO monthly indices, and likely, their social structures. From these data, neutral ENSO months appear to have something different happening compared to positive and negative months, that is impacting the sighting distributions of bottlenose dolphins off the San Diego coastline. More research needs to be conducted to determine what is different about neutral months and how this may impact this dolphin population. On a finer scale, the six lagoons in San Diego appear to have a spatial relationship with dolphin sightings. These lagoons may provide critical habitat for bottlenose dolphins and/or for their preferred prey either by protecting the animals or by providing nutrients. Different lagoons may have different spans of impact, that is, some lagoons may have wider outflows that create larger nutrient plumes.

Other than the Marine Mammal Protection Act and small protected zones, there are no safeguards in place for these dolphins, whose population hovers around 500 individuals. Therefore, specific coastal areas surrounding lagoons that are more vulnerable to habitat loss, habitat degradation, and/or are more frequented by dolphins, may want greater protection added at a local, state, or federal level. For example, the Batiquitos and San Dieguito Lagoons already contain some Marine Conservation Areas with No-Take Zones within their reach. The city of San Diego and the state of California need better ways to assess the coastlines in their jurisdictions and how protecting the marine, estuarine, and terrestrial environments near and encompassing the coastlines impacts the greater ecosystem.

This dive into my data was an excellent lesson in spatial scaling with regards to parsing down my data to a single study site and in matching my existing data sets to other data that could help answer my hypotheses. Originally, I underestimated the robustness of my data. At first, I hesitated when considering reducing the dolphin sighting data to only include San Diego because I was concerned that I would not be able to do the statistical analyses. However, these concerns were unfounded. My results are strongly significant and provide great insight into my questions about my data. Now, I can further apply these preliminary results and explore both finer and broader scale resolutions, such as using the more precise ENSO index values and finding ways to compare offshore bottlenose dolphin sighting distributions.

Marine Mammal Observing: Standardization is key

By: Alexa Kownacki, Ph.D. Student, OSU Department of Fisheries and Wildlife, Geospatial Ecology of Marine Megafauna Lab

For the past two years, I’ve had the opportunity to be the marine mammal observer aboard the NOAA ship Bell M. Shimada for 10 days in May. Both trips covered transects in the Northern California Current Ecosystem during the same time of year, but things looked very different from my chair on the fly bridge. This trip, in particular, highlighted the importance of standardization, seeing as it was the second replicate of the same area. Other scientists and crew members repeatedly asked me the same questions that made me realize just how important it is to have standards in scientific practices and communicating them.

Northern right whale dolphin porpoising out of the water beside the ship while in transit. May 2019. Image source: Alexa Kownacki

The questions:

  1. What do you actually do here and why are you doing it?
  2. Is this year the same as last year in terms of weather, sightings, and transect locations?
  3. Did you expect to see greater or fewer sightings (number and diversity)?
  4. What is this Beaufort Sea State scale that you keep referring to?

All of these are important scientific questions that influence our hypothesis-testing research, survey methods, expected results, and potential conclusions. Although the entire science party aboard the ship conducted marine science, we all had our own specialties and sometimes only knew the basics, if that, about what the other person was doing. It became a perfect opportunity to share our science and standards across similar, but different fields.

Now, to answer those questions:

  1. a) What do you actually do here and b) why are you doing it?

a) As the only marine mammal observer, I stand watch during favorable weather conditions while the ship is in transit, scanning from 0 to 90 degrees off the starboard side (from the front of the ship to a right angle towards the right side when facing forwards). Meanwhile, an application on an iPad called SeaScribe, records the ship’s exact location every 15 seconds, even when no animal is sighted. This process allows for the collection of absence data, that is, data when no animals are present. The SeaScribe program records the survey lines, along with manual inputs that I add, including weather and observer information. When I spot a marine mammal, I immediately mark an exact location on a hand held GPS, use my binoculars to identify the species, and add information to the sighting on the SeaScribe program, such as species, distance to the sighted animal(s), the degree (angle) to the sighting, number of animals in a group, behavior, and direction if traveling.

b) Marine mammal observing serves many different purposes. In this case, observing collects information about what species are where at what time. By piggy-backing on these large-scale, offshore oceanographic NOAA surveys, we have the unique opportunity to survey along standardized transect lines during different times of the year. From replicate survey data, we can start to form an idea of which species use which areas and what oceanographic conditions may impact species distributions. Currently there is not much consistent marine mammal data collected over these offshore areas between Northern California and Washington State, so our work is aiming to fill this knowledge gap.

Alexa observing on the R/V Shimada in May 2019, all bundled up. Image Source: Alexa Kownacki

  1. What is this Beaufort Sea State scale that you keep referring to?

Great question! It took me a while to realize that this standard measuring tool to estimate wind speeds and sea conditions, is not commonly recognized even among other sea-goers. The Beaufort Sea State, or BSS, uses an empirical scale that ranges from 0-12 with 0 being no wind and calm seas, to 12 being hurricane-force winds with 45+ ft seas. It is frequently referenced by scientists in oceanography, marine science, and climate science as a universally-understood metric. The BSS was created in 1805 by Francis Beaufort, a hydrographer in the Royal Navy, to standardize weather conditions across the fleet of vessels. By the mid-1850s, the BSS was standardized to non-naval use for sailing vessels, and in 1916, expanded to include information specific to the seas and not the sails1. We in the marine mammal observation field constantly collect BSS information while on survey to measure the quality of survey conditions that may impact our observations. BSS data allows us to measure the extent of our survey range, both in the distance that we are likely to sight animals and also the likelihood of sighting anything. Therefore, the BSS scale gives us an important indication of how much absence data we have collected, in addition to presence data.

A description of the Beaufort Sea State Scale. Image source: National Weather Service.


  1. Is this year the same as last year in terms of weather, sightings, and transect locations?

The short answer is no. Observed differences in marine mammal sightings in terms of both species diversity and number of animals between years can be normal. There are many potential explanatory variables, from differences in currents, upwelling strength, El Nino index levels, water temperatures, or, what was obvious in this case: sighting conditions. The weather in May 2019 varied greatly from that in May 2018. Last year, I observed for nearly every day because the Beaufort Sea State (BSS) was frequently less than a four. However, this year, more often than not, the BSS greater than or equal to five. A BSS of 5 equates to approximately 17-21 knots of breeze with 6-foot waves and the water appears to have many “white horses” or pronounced white caps with sea spray. Additionally, mechanical issue with winches delayed and altered our transect locations. Therefore, although multiple transects from May 2018 were also surveyed during May 2019, there were a few lines that do not have data for both cruises.

May 2018 with a BSS 1

May 2019 with a BSS 6


  1. Did you expect to see greater or fewer sightings (number and diversity)?

Knowing that I had less favorable sighting conditions and less amount of effort observing this year, it is not surprising that I observed fewer marine mammals in total count and in species diversity. Even less surprising is that on the day with the best weather, where the BSS was less than a five, I recorded the most sightings with the highest species count. May 2018 felt a bit like a tropical vacation because we had surprisingly sunny days with mild winds, and during May 2019 we had some rough seas with gale force winds. Additionally, as an observer, I need to remove as much bias as possible. So, yes, I had hoped to see beaked whales or orca like I did in May 2018, but I was still pleasantly surprised when I spotted fin whales feeding in May 2019.

Marine Mammal Species Number of Sightings
May 2018 May 2019
Humpback whale 31 6
Northern right whale dolphin 1 2
Pacific white-sided dolphin 3 6
UNID beaked whale 1 0
Cuvier’s beaked whale 1 0
Gray whale 4 1
Minke whale 1 1
Fin whale 4 1
Blue whale 1 0
Transient killer whale 1 0
Dall’s porpoise 2 0
Northern fur seal 1 0
California sea lion 0 1

Pacific white-sided dolphin. Image source: Alexa Kownacki

Standardization is a common theme. Observing between years on standard transects, at set speeds, in different conditions using standardized tools is critical to collecting high quality data that is comparable across different periods. Scientists constantly think about quality control. We look for trends and patterns, similarities and differences, but none of those could be understood without having standard metrics.

The entire science party aboard the R/V Shimada in May 2019, including a marine mammal scientist, phytoplankton scientists, zooplankton scientists, and fisheries scientists, and oceanographers. Image Source: Alexa Kownacki

Literature Cited:

1Oliver, John E. (2005). Encyclopedia of world climatology. Springer.


Data Wrangling to Assess Data Availability: A Data Detective at Work

By Alexa Kownacki, Ph.D. Student, OSU Department of Fisheries and Wildlife, Geospatial Ecology of Marine Megafauna Lab

Data wrangling, in my own loose definition, is the necessary combination of both data selection and data collection. Wrangling your data requires accessing then assessing your data. Data collection is just what it sounds like: gathering all data points necessary for your project. Data selection is the process of cleaning and trimming data for final analyses; it is a whole new bag of worms that requires decision-making and critical thinking. During this process of data wrangling, I discovered there are two major avenues to obtain data: 1) you collect it, which frequently requires an exorbitant amount of time in the field, in the lab, and/or behind a computer, or 2) other people have already collected it, and through collaboration you put it to a good use (often a different use then its initial intent). The latter approach may result in the collection of so much data that you must decide which data should be included to answer your hypotheses. This process of data wrangling is the hurdle I am facing at this moment. I feel like I am a data detective.

Data wrangling illustrated by members of the R-programming community. (Image source: R-bloggers.com)

My project focuses on assessing the health conditions of the two ecotypes of bottlenose dolphins between the waters off of Ensenada, Baja California, Mexico to San Francisco, California, USA between 1981-2015. During the government shutdown, much of my data was inaccessible, seeing as it was in possession of my collaborators at federal agencies. However, now that the shutdown is over, my data is flowing in, and my questions are piling up. I can now begin to look at where these animals have been sighted over the past decades, which ecotypes have higher contaminant levels in their blubber, which animals have higher stress levels and if these are related to geospatial location, where animals are more susceptible to human disturbance, if sex plays a role in stress or contaminant load levels, which environmental variables influence stress levels and contaminant levels, and more!

Alexa, alongside collaborators, photographing transiting bottlenose dolphins along the coastline near Santa Barbara, CA in 2015 as part of the data collection process. (Image source: Nick Kellar).

Over the last two weeks, I was emailed three separate Excel spreadsheets representing three datasets, that contain partially overlapping data. If Microsoft Access is foreign to you, I would compare this dilemma to a very confusing exam question of “matching the word with the definition”, except with the words being in different languages from the definitions. If you have used Microsoft Access databases, you probably know the system of querying and matching data in different databases. Well, imagine trying to do this with Excel spreadsheets because the databases are not linked. Now you can see why I need to take a data management course and start using platforms other than Excel to manage my data.

A visual interpretation of trying to combine datasets being like matching the English definition to the Spanish translation. (Image source: Enchanted Learning)

In the first dataset, there are 6,136 sightings of Common bottlenose dolphins (Tursiops truncatus) documented in my study area. Some years have no sightings, some years have fewer than 100 sightings, and other years have over 500 sightings. In another dataset, there are 398 bottlenose dolphin biopsy samples collected between the years of 1992-2016 in a genetics database that can provide the sex of the animal. The final dataset contains records of 774 bottlenose dolphin biopsy samples collected between 1993-2018 that could be tested for hormone and/or contaminant levels. Some of these samples have identification numbers that can be matched to the other dataset. Within these cross-reference matches there are conflicting data in terms of amount of tissue remaining for analyses. Sorting these conflicts out will involve more digging from my end and additional communication with collaborators: data wrangling at its best. Circling back to what I mentioned in the beginning of this post, this data was collected by other people over decades and the collection methods were not standardized for my project. I benefit from years of data collection by other scientists and I am grateful for all of their hard work. However, now my hard work begins.

The cutest part of data wrangling: finding adorable images of bottlenose dolphins, photographed during a coastal survey. (Image source: Alexa Kownacki).

There is also a large amount of data that I downloaded from federally-maintained websites. For example, dolphin sighting data from research cruises are available for public access from the OBIS (Ocean Biogeographic Information System) Sea Map website. It boasts 5,927,551 records from 1,096 data sets containing information on 711 species with the help of 410 collaborators. This website is incredible as it allows you to search through different data criteria and then download the data in a variety of formats and contains an interactive map of the data. You can explore this at your leisure, but I want to point out the sheer amount of data. In my case, the OBIS Sea Map website is only one major platform that contains many sources of data that has already been collected, not specifically for me or my project, but will be utilized. As a follow-up to using data collected by other scientists, it is critical to give credit where credit is due. One of the benefits of using this website, is there is information about how to properly credit the collaborators when downloading data. See below for an example:

Example citation for a dataset (Dataset ID: 1201):

Lockhart, G.G., DiGiovanni Jr., R.A., DePerte, A.M. 2014. Virginia and Maryland Sea Turtle Research and Conservation Initiative Aerial Survey Sightings, May 2011 through July 2013. Downloaded from OBIS-SEAMAP (http://seamap.env.duke.edu/dataset/1201) on xxxx-xx-xx.

Citation for OBIS-SEAMAP:

Halpin, P.N., A.J. Read, E. Fujioka, B.D. Best, B. Donnelly, L.J. Hazen, C. Kot, K. Urian, E. LaBrecque, A. Dimatteo, J. Cleary, C. Good, L.B. Crowder, and K.D. Hyrenbach. 2009. OBIS-SEAMAP: The world data center for marine mammal, sea bird, and sea turtle distributions. Oceanography 22(2):104-115

Another federally-maintained data source that boasts more data than I can quantify is the well-known ERDDAP website. After a few Google searches, I finally discovered that the acronym stands for Environmental Research Division’s Data Access Program. Essentially, this the holy grail of environmental data for marine scientists. I have downloaded so much data from this website that Excel cannot open the csv files. Here is yet another reason why young scientists, like myself, need to transition out of using Excel and into data management systems that are developed to handle large-scale datasets. Everything from daily sea surface temperatures collected on every, one-degree of latitude and longitude line from 1981-2015 over my entire study site to Ekman transport levels taken every six hours on every longitudinal degree line over my study area. I will add some environmental variables in species distribution models to see which account for the largest amount of variability in my data. The next step in data selection begins with statistics. It is important to find if there are highly correlated environmental factors prior to modeling data. Learn more about fitting cetacean data to models here.

The ERDAPP website combined all of the average Sea Surface Temperatures collected daily from 1981-2018 over my study site into a graphical display of monthly composites. (Image Source: ERDDAP)

As you can imagine, this amount of data from many sources and collaborators is equal parts daunting and exhilarating. Before I even begin the process of determining the spatial and temporal spread of dolphin sightings data, I have to identify which data points have sex identified from either hormone levels or genetics, which data points have contaminants levels already quantified, which samples still have tissue available for additional testing, and so on. Once I have cleaned up the datasets, I will import the data into the R programming package. Then I can visualize my data in plots, charts, and graphs; this will help me identify outliers and potential challenges with my data, and, hopefully, start to see answers to my focal questions. Only then, can I dive into the deep and exciting waters of species distribution modeling and more advanced statistical analyses. This is data wrangling and I am the data detective.

What people may think a ‘data detective’ looks like, when, in reality, it is a person sitting at a computer. (Image source: Elder Research)

Like the well-known phrase, “With great power comes great responsibility”, I believe that with great data, comes great responsibility, because data is power. It is up to me as the scientist to decide which data is most powerful at answering my questions.

Data is information. Information is knowledge. Knowledge is power. (Image source: thedatachick.com)