Harmful algal blooms expose southern right whales to domoic acid and can potentially cause endocrine alterations

Dr. Alejandro Fernández Ajó, OSU Department of Fisheries, Wildlife, & Conservation Sciences, Geospatial Ecology of Marine Megafauna Lab

Rises in ocean temperatures can lead to multiple alterations in marine ecosystems, including the increase and the frequency of Harmful Algal Blooms (HABs). HABs are characterized by the rapid growth of toxin-producing species of algae that can be harmful to people, animals, and the local ecology, even causing death in severe cases. Species of marine diatom within the genus Pseudo-nitzschia and Nitzschia can form HABs when they produce domoic acid (DA), a potent neurotoxin responsible for amnesic shellfish poisoning (D’Agostino et al., 2018, 2017).

Figure 1. Southern right whale (E. australis) mother and calf swimming at the gulfs of Peninsula Valdes, Argentina, during a phytoplankton bloom. Photo: Mariano Sironi / Instituto de Conservacion de Ballenas de Argentina.

During HABs, DA is transferred to higher organisms through the pelagic food web and is accumulated by intermediate vectors, such as copepods, euphausiids (i.e., krill), shellfish, and fish. As this neurotoxin affects top predators, DA poisoning poses a risk to the safety and health of humans and wildlife. This neurotoxin has caused mortality in many marine mammal species, including both pinnipeds and cetaceans (Gulland 1999; Lefebvre et al. 1999; Fire et al. 2010, 2021; Broadwater et al. 2018). In addition, the exposure to DA constitutes a stressor that may affect glucocorticoids (hormones involved in the stress response) concentrations.

The glucocorticoids (GCs; cortisol and corticosterone) are adrenal steroid hormones that maintain the essential functions of metabolism and energy balance in mammals. GCs can increase sharply in response to environmental stressors to elicit physiological and behavioral adaptations by individuals to support survival (Sapolsky et al. 2000; Bornier et al. 2009). However, with the chronic exposure to a stressor, this relationship can reverse, with GCs sometimes declining below its baseline levels (Dickens and Romero, 2013; Fernández Ajó et al., 2018). Moreover, DA can interfere with the stress response in mammals, and cause alterations in their physiological response. DA is an excitatory amino acid analog of glutamate (Pulido 2008), a well-known brain neurotransmitter that play an important role in the activation of the adrenal axis (which in turn regulate the production and secretion of the GCs) and regulate many of the pituitary hormones involved in the stress response (Brann and Mahesh 1994; Johnson et al. 2001). Hence, monitoring GC levels in marine mammals can be a potential useful metric for assessing the physiological impacts of exposure to DA.

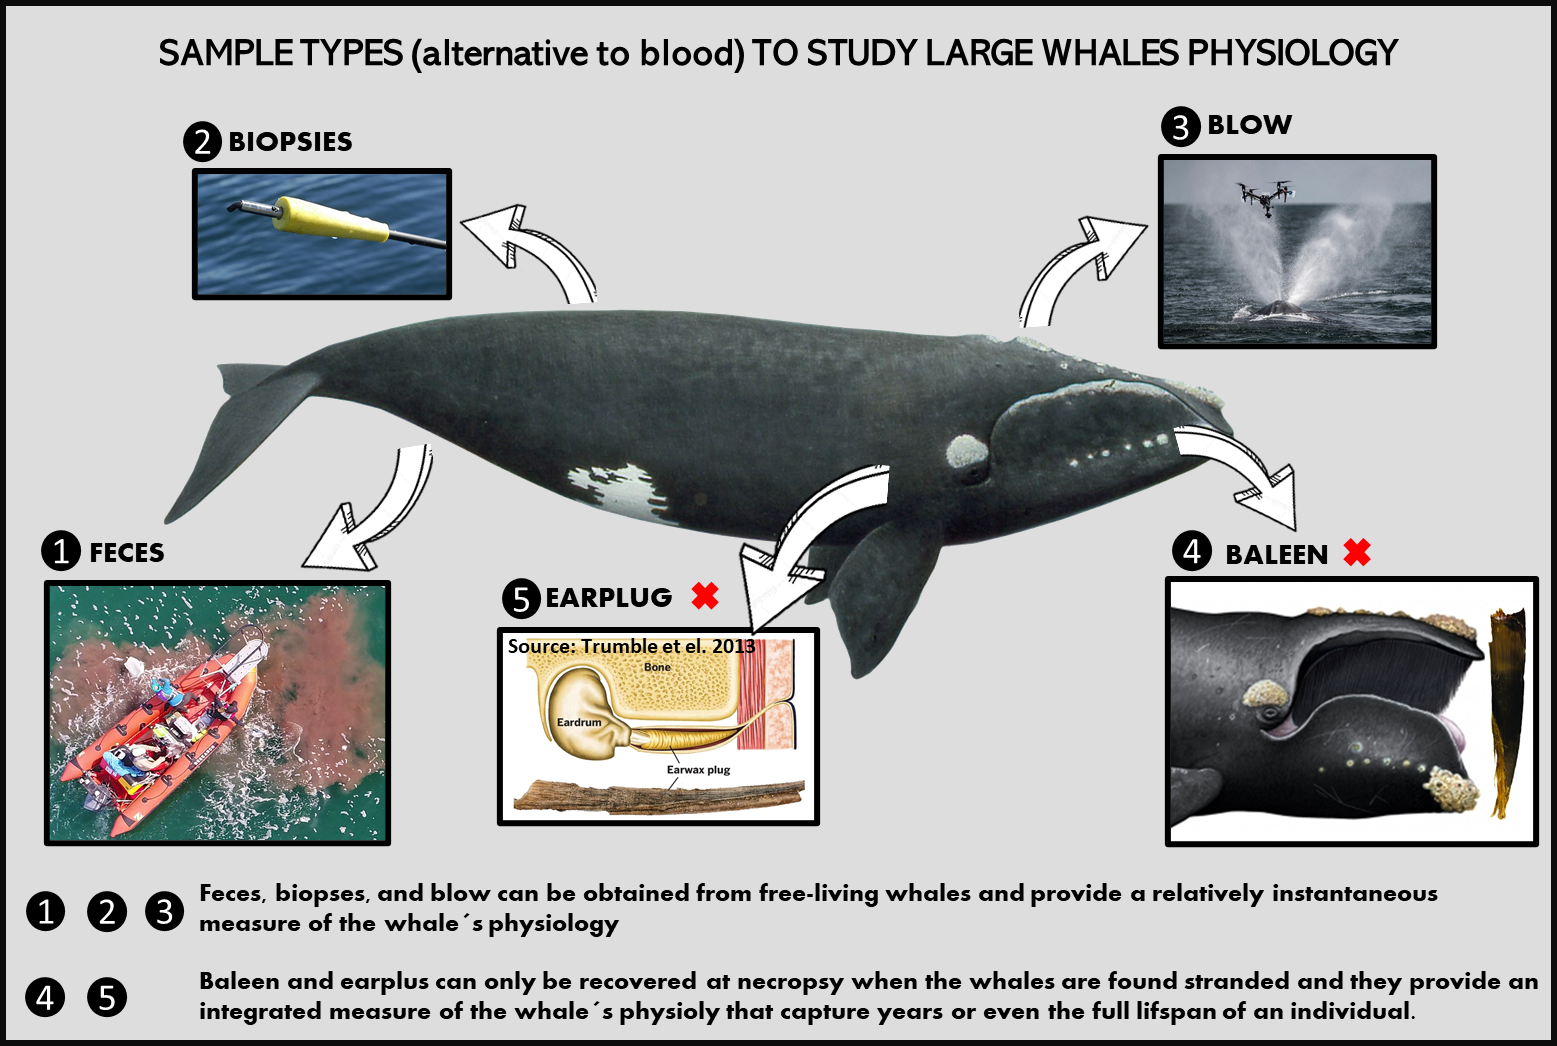
Glucocorticoids are traditionally measured in plasma, but given that plasma sampling from free-ranging large whales is currently impossible, alternative sample types such as fecal samples, among others, can be utilized to quantify GCs in large whales (Ajó et al., 2021; Burgess et al., 2018, 2016; Fernández Ajó et al., 2020, 2018; Hunt et al., 2019, 2014, 2006; Rolland et al., 2017, 2005)(Figure 2). The analyses of fecal glucocorticoid metabolites (fGCm) is particularly useful for endocrine assessments of free-swimming whales, with several studies showing that fGCm correlate in meaningful ways with presumed stressors. For example, high levels of fGCm in North Atlantic right whales (NARW, Eubalaena glacialis) and in gray whales (Eschrichtius robustus) correlate with poor body condition (Hunt et al., 2006; Lemos et al., 2021), and fGCm increases were associated with whale entanglements and ship strikes (i.e., Lemos et al., 2020; Rolland et al., 2017).

Figure 2. Alternative samples types can be used to study hormones in large whales. 1-2-3 are sample types that can be obtained from free-living whales and provide a more instantaneous and acute measurement of the whales´ physiology. 4-5 can be obtained at necropsy when the whale is found dead at the beach and provide an integrated measure of the whale physiology that can expand through years or even the lifespan of an individual.

In Península Valdés, Argentina, southern right whales (SRW, E. australis) gather in large numbers to mate and nurse their calves during the austral winter months (Bastida and Rodríguez, 2009). SRWs are capital breeders, largely fasting during the breeding season and instead relying on stored blubber fuel reserves. However, they can occasionally feed on calanoid copepods (D’Agostino et al., 2018, 2016), particularly during the phytoplankton blooms that are dominated by diatoms of the genus Pseudo-nitzschia (Sastre et al. 2007; D’Agostino et al. 2015, 2018). Therefore, feeding SRWs in Península Valdés temporally overlap with these Pseudo-nitzschia blooms (D’Agostino et al. 2018, 2015) and represents a test case for assessing the relationship of DA exposure with GC levels (Figure 3).

Figure 3. Southern right whale (E. australis) skim feeding at the Peninsula Valdes breeding ground. Photo: Lucas Beltranino.

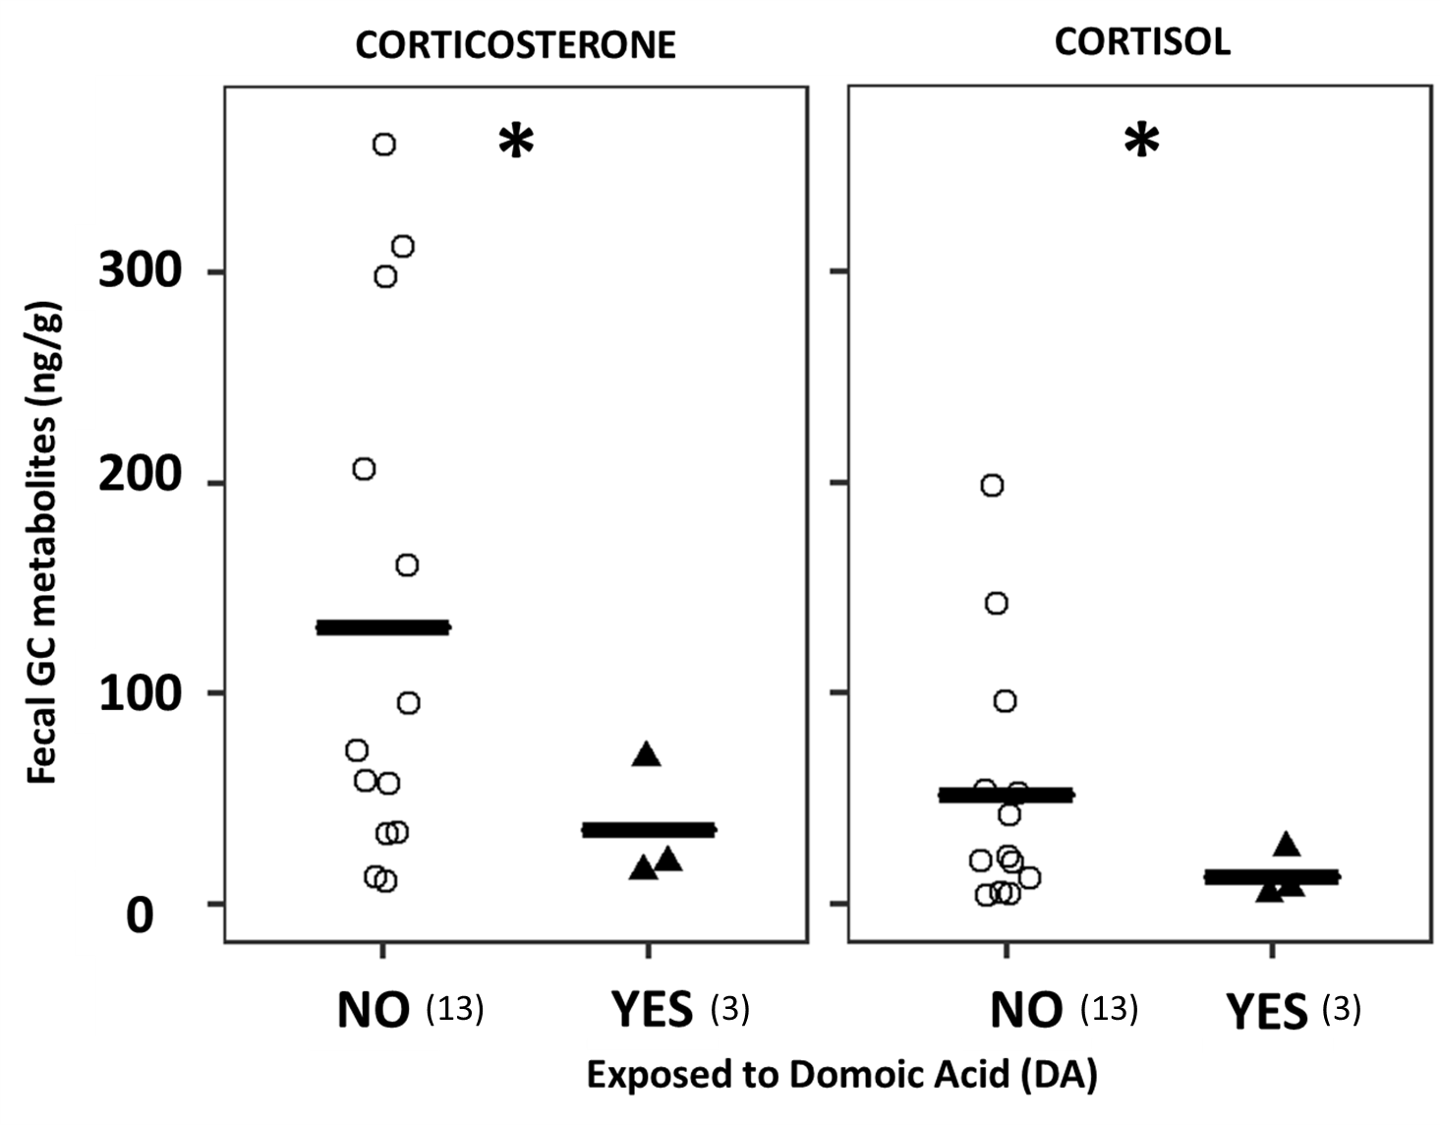
In our recent scientific publication (D’Agostino et al. 2021), we investigate SRW exposure to DA at their breeding ground in Peninsula Valdes and assessed its effects on fecal glucocorticoid concentrations. Although the sample size of this study is unavoidably small due to the difficulties of obtaining fecal samples from whales at their calving grounds where defecation is infrequent, we observed significantly lower fGCm in samples from whales exposed to DA (Figure 4). Our results agree with findings from a previous study in California sea lions (Zalophus californianus) exposed to DA, where these authors found a significant association of DA exposure with reduced serum cortisol (Gulland et al., 2009), which can be tentatively attributed to abnormal function of the adrenal axis due to the exposure.

Figure 4. Fecal glucocorticoid metabolite levels in southern right whales exposed (YES, solid triangles) and not-exposed (NO, open circles) to DA. Left panel: immunoreactive fecal corticosterone metabolites. Right panel: immunoreactive fecal cortisol metabolites. Hormone concentrations are expressed in ng of immunoreactive hormone per gram of dry fecal sample. Significant differences between groups are denoted with an asterisk (P<0.05). The black solid line indicates the mean for each group, and in parenthesis is the sample size for each group. Adapted from D’Agostino et al. 2021.

If ingestion of toxins produced by phytoplankton can result in long-term suppression of baseline GCs, whales and marine mammals in general, could suffer reduced ability to cope with additional stressors. The adrenal function is essential to maintain circulating blood glucose and other aspects of metabolism within normal bounds. Additionally, the ability to elevate GCs facilitates energy mobilization to physiologically cope with a stressful event and to initiate appropriate behavioral responses (i.e., flee from predators, heal wounds). Various toxicants have been shown to reduce adrenal function across taxa (Romero and Wingfield, 2016) and could have negative consequences on the ability of cetaceans to respond and adapt to ongoing environmental and anthropogenic changes. Compounding this problem, whales are exposed to an increasing number of stressors from multiple sources and with cumulative effects and they need to be able to physiologically respond to continue to reproduce and survive.

To our knowledge, this study provides the first quantification of fGCm levels in whales exposed to DA; and we hope this effort starts a growing dataset to which other researchers can add. Sampling and analysis of non-traditional matrices, such as feces, blubber, baleen and others, would likely increase sample sizes and thus our understanding of the interrelationships among DA exposure and age, sex, and reproductive status of cetaceans. Given that chronic exposure to DA could alter the capacity of animals to respond to stress, and indications that HABs are becoming more frequent and intense world-wide (Van Dolah 2000; Masó et al. 2006; Erdner et al. 2008), we believe that research evaluating the health status of marine mammal populations should include the assessment of stress physiology relative to natural and anthropogenic stressors including exposure to toxicants.

Did you enjoy this blog? Want to learn more about marine life, research, and conservation? Subscribe to our blog and get weekly updates and more! Just add your name into the subscribe box on the left panel.  

Loading

References

Bastida R, Rodríguez D (2009) Ballena franca austral [Southern right whale]. In: Mazzini V (ed) Mamíferos marinos de Patagonia y Antártida [Marine mammals of Patagonia and Antarctica]. Zagier & Urruty Publications, Buenos Aires, pp 72–84.

Bonier F, Moore IT, Martin PR, Robertson RJ (2009) The relationship between fitness and baseline glucocorticoids in a passerine bird. Gen Comp Endocrinol 163:208–213. https:// doi. org/ 10. 1016/j.ygcen. 2008. 12. 013.

Brann DW, Mahesh VB (1994) Excitatory amino acids: function and significance in reproduction and neuroendocrine regulation. Front Neuroendocrinol 15:3–49. https:// doi. org/ 10. 1006/ frne. 1994. 1002.

Broadwater MH, Van Dolah FM, Fire SE (2018) Vulnerabilities of marine mammals to harmful algal blooms. Harmful Algal Blooms 2:191–222.

Burgess, E.A., Hunt, K.E., Kraus, S.D., Rolland, R.M., 2016. Get the most out of blow hormones: Validation of sampling materials, field storage and extraction techniques for whale respiratory vapour samples. Conserv. Physiol. 4, cow024. https://doi.org/10.1093/conphys/cow024

Burgess, E.A., Hunt, K.E., Kraus, S.D., Rolland, R.M., 2018. Quantifying hormones in exhaled breath for physiological assessment of large whales at sea. Sci. Rep. 8, 10031. https://doi.org/10.1038/s41598-018-28200-8

D’Agostino VC, Hoffmeyer MS, Almandoz GO, Sastre V, Degrati M., 2015. Potentially toxic Pseudo-nitzschia species in plankton and fecal samples of Eubalaena australis from Península Valdés calv-ing ground, Argentina. J Sea Res 106:39–43. https:// doi. org/ 10.1016/j. seares.

D’Agostino, V.C., Degrati, M., Santinelli, N., Sastre, V., Dans, S.L., Hoffmeyer, M.S., 2018. The seasonal dynamics of plankton communities relative to the foraging of the southern right whale (Eubalaena australis) in northern Patagonian gulfs, Península Valdés, Argentina. Cont. Shelf Res. 164, 45–57. https://doi.org/10.1016/j.csr.2018.06.003

D’Agostino, V.C., Degrati, M., Sastre, V., Santinelli, N., Krock, B., Krohn, T., Dans, S.L., Hoffmeyer, M.S., 2017. Domoic acid in a marine pelagic food web: Exposure of southern right whales Eubalaena australis to domoic acid on the Península Valdés calving ground, Argentina. Harmful Algae 68, 248–257. https://doi.org/10.1016/j.hal.2017.09.001

D’Agostino, V.C., Hoffmeyer, M.S., Degrati, M., 2016. Faecal analysis of southern right whales (Eubalaena australis) in Península Valdés calving ground, Argentina: Calanus australis, a key prey species. J. Mar. Biol. Assoc. United Kingdom 96, 859–868. https://doi.org/10.1017/S0025315415001897

Dickens, M.J., Romero, L.M., 2013. A consensus endocrine profile for chronically stressed wild animals does not exist. Gen. Comp. Endocrinol. 191, 177–189. https://doi.org/10.1016/j.ygcen.2013.06.014

Erdner DL, Dyble J, Parsons ML, Stevens RC, Hubbard KA, Wrabel ML, Moore SK, Lefebvre KA, Anderson DM, Bienfang P, Bidi-gare RR, Parker MS, Moeller P, Brand LE, Trainer VL (2008) Centers for Oceans and Human Health: a unified approach to the challenge of harmful algal blooms. Environ Health 7:S2. https://doi. org/ 10. 1186/ 1476- 069X-7- S2- S2.

Fernández Ajó, A., Hunt, K.E., Dillon, D., Uhart, M., Sironi, M., Rowntree, V., Buck, C.L., 2021. Optimizing hormone extraction protocols for whale baleen: tackling questions of solvent:sample ratio and variation. Gen. Comp. Endocrinol. 113828. https://doi.org/10.1016/j.ygcen.2021.113828

Fernández Ajó, A.A., Hunt, K.E., Giese, A.C., Sironi, M., Uhart, M., Rowntree, V.J., Marón, C.F., Dillon, D., DiMartino, M., Buck, C.L., 2020. Retrospective analysis of the lifetime endocrine response of southern right whale calves to gull wounding and harassment: A baleen hormone approach. Gen. Comp. Endocrinol. 296, 113536. https://doi.org/10.1016/j.ygcen.2020.113536

Fernández Ajó, A.A., Hunt, K.E., Uhart, M., Rowntree, V., Sironi, M., Marón, C.F., Di Martino, M., Buck, C.L., 2018. Lifetime glucocorticoid profiles in baleen of right whale calves: potential relationships to chronic stress of repeated wounding by Kelp Gulls. Conserv. Physiol. 6, 1–12. https://doi.org/10.1093/conphys/coy045

Fire SE, Bogomolni A, DiGiovanni RA Jr, Early G, Leighfield TA, Matassa K, Miller GA, Moore KM, Moore M, Niemeyer M, Pugliares K (2021) An assessment of temporal, spatial and taxonomic trends in harmful algal toxin exposure in stranded marine mammals from the US New England coast. PLoS ONE 16(1):e0243570. https:// doi. org/ 10. 1371/ journ al. pone. 02435 70

Fire SE, Wang Z, Berman M, Langlois GW, Morton SL, Sekula-Wood E, Benitez-Nelson CR (2010) Trophic transfer of the harmful algal toxin domoic acid as a cause of death in a minke whale (Balaenoptera acutorostrata) stranding in southern California. Aquat Mamm 36(4):342–350. https:// doi. org/ 10. 1578/ AM. 36.4.2010. 342.

Gulland F.M., 1999. Domoic acid toxicity in California sea lions stranded along the central California Coast, May-October 1998. NOAA Tech. Memo. NMFS-OPR-8. USA National Marine Fisheries Service, US Department of Commerce.

Gulland FMD, Hall AJ, Greig DJ, Fram ER, Colegrove KM, Booth RKN, Wasser SK, S.-M.C., 2009. Gulland, Hall – 2012 – Evaluation of circulating eosinophil count and adrenal gland function in California sea lions naturally exposed t. J. Am. Vet. Med. Assoc. 241, 943–949.

Gulland, F., Pérez-Cortés, H., Urbán, J.R., Rojas-Bracho, L., Ylitalo, G., Weir, J., Norman, S., Muto, M., Rugh, D., Kreuder, C., Rowles, T., 2005. Eastern North Pacific gray whale (Eschrichtius robustus) unusual mortality event, 1999-2000. U.S. Dep. Commer. NOAA Tech. Memo. NMFS-AFSC-150. 33 pp.

Hunt, K.E., Robbins, J., Buck, C.L., Bérubé, M., Rolland, R.M., 2019. Evaluation of fecal hormones for noninvasive research on reproduction and stress in humpback whales (Megaptera novaeangliae). Gen. Comp. Endocrinol. 280, 24–34. https://doi.org/10.1016/j.ygcen.2019.04.004

Hunt, K.E., Rolland, R.M., Kraus, S.D., Wasser, S.K., 2006. Analysis of fecal glucocorticoids in the North Atlantic right whale (Eubalaena glacialis). Gen. Comp. Endocrinol. 148, 260–272. https://doi.org/10.1016/j.ygcen.2006.03.012

Hunt, K.E., Stimmelmayr, R., George, C., Hanns, C., Suydam, R., Brower, H., Rolland, R.M., 2014. Baleen hormones: a novel tool for retrospective assessment of stress and reproduction in bowhead whales (Balaena mysticetus). Conserv. Physiol. 2, cou030–cou030. https://doi.org/10.1093/conphys/cou030

Johnson MP, Kelly G, Chamberlain M (2001) Changes in rat serum corticosterone after treatment with metabotropic glutamate receptor agonists or antagonists. J Neuroendocrinol 13:670–677. https:// doi. org/ 10. 1046/j. 1365- 2826. 2001. 00678.x.

Lefebvre KA, Powell CL, Busman M, Doucette GJ, Moeller PDR, Sliver JB, Miller PE, Hughes MP, Singaram S, Silver MW, Tjeer-dema RS (1999) Detection of domoic acid in northern anchovies and California sea lions associated with an unusual mortality event. Nat Toxins 7(3):85–92. https:// doi. org/ 10. 1002/ (SICI) 1522-7189(199905/ 06)7: 3% 3C85:: AID- NT39% 3E3.0. CO;2-Q.

Lefebvre, K.A., Kendrick, P.S., Ladiges, W., Hiolski, E.M., Ferriss, B.E., Smith, D.R., Marcinek, D.J., 2017. Chronic low-level exposure to the common seafood toxin domoic acid causes cognitive deficits in mice. Harmful Algae 64, 20–29. https://doi.org/10.1016/j.hal.2017.03.003

Lemos, L.S., Olsen, A., Smith, A., Burnett, J.D., Chandler, T.E., Larson, S., Hunt, K.E., Torres, L.G., 2021. Stressed and slim or relaxed and chubby? A simultaneous assessment of gray whale body condition and hormone variability. Mar. Mammal Sci. 1–11. https://doi.org/10.1111/mms.12877

Lemos, L.S., Olsen, A., Smith, A., Chandler, T.E., Larson, S., Hunt, K., Torres, L.G., 2020. Assessment of fecal steroid and thyroid hormone metabolites in eastern North Pacific gray whales. Conserv. Physiol. 8. https://doi.org/10.1093/conphys/coaa110

Masó M, Garcés E., 2006. Harmful microalgae blooms (HAB); prob-lematic and conditions that induce them. Mar Pollut Bull 53:620–630. https:// doi. org/ 10. 1016/j. marpo lbul. 2006. 08. 006.

Pulido O.M., 2008. Domoic acid toxicologic pathology: a review. Mar Drugs 6(2):180–219. https:// doi. org/ 10. 3390/ md602 0180.

Rolland, R., McLellan, W., Moore, M., Harms, C., Burgess, E., Hunt, K., 2017. Fecal glucocorticoids and anthropogenic injury and mortality in North Atlantic right whales Eubalaena glacialis. Endanger. Species Res. 34, 417–429. https://doi.org/10.3354/esr00866

Rolland, R.M., Hunt, K.E., Kraus, S.D., Wasser, S.K., 2005. Assessing reproductive status of right whales (Eubalaena glacialis) using fecal hormone metabolites. Gen. Comp. Endocrinol. 142, 308–317. https://doi.org/10.1016/j.ygcen.2005.02.002

Romero, M.L., Wingfield, J.C., 2016. Oxford series in behavioral neuroendocrinology. Tempests, poxes, predators, and people: stress in wild animals and how they cope 1–2.

Sapolsky RM, Romero LM, Munck AU, 2000. How do glucocorti-coids influence stress response? Intergrating permissive, suppres-sive, stimulatory, and preparative actions. Endocr Rev 21:55–89. https:// doi. org/ 10. 1210/ edrv. 21.1. 0389.

Sastre V, Santinelli N, Marino G, Solís M, Pujato L, Ferrario M., 2007. First detection of domoic acid produced by Pseudo-nitzschia spe-cies, Chubut coastal waters, Patagonia, Argentina. Harmful Algae News 34:12–14.

Van Dolah FM., 2000. Marine algal toxins: origins, health effects, and their increased occurrence. Environ Health Perspect 108:133–141. https:// doi. org/ 10. 1289/ ehp. 00108 s1133

Weighing-in on scale

Allison Dawn, GEMM Lab Master’s student, OSU Department of Fisheries, Wildlife and Conservation Sciences, Geospatial Ecology of Marine Megafauna Lab 

As the first term of my master’s program comes to an end and we head toward winter break, I am excited by the course material that has already helped direct my research and development as a scientist. There have been new, challenging topics to tackle, and each assignment has fostered deeper thinking into the formation of my thesis. While I learned new methods and analysis approaches this term, a single phrase pervades throughout my studies of ecology – “it depends!”. Ecologists work to uncover patterns driven by natural processes, and this single phrase seems to answer many questions about whether the pattern always exists. A reasonable follow up to that frequently used phrase is, “depends on what?” or “when or where would this pattern change?” In the context of foraging ecology, predator-prey patterns are frequently driven by environmental processes that depend on the scale you choose for your study. 

What do we mean by scale? Simply stated, scale is a graduation from one level of measurement to another. You can imagine a ruler, for example. You can measure how tall you are in inches with a ruler or in yards with a yard stick. When we think about scale in ecology, the “ruler” can have traditional units of space (meters, kilometers, etc.), units of time (minutes, days, hours, months, years, etc.), or sometimes both!  

The ocean is dynamic and heterogeneous, which simply means there is a lot going on at once. Oceanographic processes influence predator-prey interactions but due to the inherent variability in the system, it is important to explore which factors drive processes that influence patterns at different spatial and temporal scales.  

In marine ecology, the “explanatory power” of a factors’ influence on a given process depends on which scale you choose to build your research upon. Ocean ecosystems are hierarchical, with patterns happening at many temporal and spatial scales all at once. So, we could choose to study the same predator-prey interactions at the scale of meters and minutes or 100s of km and months, and we would likely find very different drivers of patterns. The topic of scale is particularly relevant in regard to whale foraging, as marine mammals employ different sensory methods to locate prey at different spatial scales (Torres 2017). 

Among the first papers to conduct multi-scale research on whale foraging was Jaquet and Whitehead, 1996. Here, they studied sperm whale distribution in relation to various physical and environmental variables. Analysis showed that the main drivers of sperm whale distribution were secondary productivity (e.g., bacteria and zooplankton), underwater topography, and the gradient between deep water and surface water productivity. However, these drivers had a different impact depending on the spatial scale. There was no correlation between the drivers and sperm whale distribution at small scales < 320 nautical miles. However, at large scales >= 320 nautical miles, female sperm whale distribution was correlated with high secondary productivity and steep underwater topography. These important findings demonstrate that small scale distribution of prey alone does not drive the distribution of sperm whale predators in this study region, while other factors contribute to predator movement.  

Figure 1. Figure reproduced from Jaquet & Whitehead, 1996. Plots show how the Spearman correlation results between sperm whale density and environmental variables change across multiple spatial scales. (A) Prey distribution, (B) distance to shore and bathymetric contour, and (C) the three main environmental drivers (secondary productivity, topography, and the deep water productivity gradient). 

Ten years later, a study on Mediterranean fin whales tackled a similar question of how interactions between prey and predator change at multiple scales. However, their work investigated responses to both spatial and temporal scale changes. Through spatial modeling relative to oceanographic factors, Cotté et al. 2009 found that at a large-scale (year and ocean basin-wide), fin whales demonstrated two distinct distribution patterns: in the summer they were aggregated, and in the winter they were more dispersed. However, at the meso-scale (weeks -months, and 20-100 km) fin whale fidelity switched to colder, saltier waters with steeper topography and temperature gradients. Based on these results, the authors concluded that at the large scale, whale movement was driven by annually persistent prey abundance. At smaller scales, prey aggregations are less predictable, thus the authors suggest that whale movement at the meso-scale is driven by physical processes, such as frontal zones and strong currents.  

Figure 2. Figure reproduced from Cotté et. al 2009. Map shows Mediterranean fin whale distribution against oceanographic conditions. Color gradient indicates sea surface temperature (SST), fin whale observations shown in white and red circles, black arrows show current direction, with inset temperature/salinity diagram for September 28-30th 2006. 

A key takeaway from these papers is that it is important to investigate how processes and responses can vary at different scales, because results can sometimes depend on the time and space measurement applied in the analysis. For my thesis, I will explore which drivers take a front seat role in gray whale foraging at both fine and meso-scales. I am interested to compare my results on the relationships between PCFG gray whales and their zooplankton prey to the results from the above described studies. Stay tuned for more updates! 

Did you enjoy this blog? Want to learn more about marine life, research, and conservation? Subscribe to our blog and get weekly updates and more! Just add your name into the subscribe box on the left panel. 

References: 

Cotté, C., Guinet, C., Taupier-Letage, I., Mate, B., & Petiau, E. (2009). Scale-dependent habitat use by a large free-ranging predator, the Mediterranean fin whale. Deep Sea Research Part I: Oceanographic Research Papers, 56(5), 801-811. 

Jaquet, N., & Whitehead, H. (1996). Scale-dependent correlation of sperm whale distribution with environmental features and productivity in the South Pacific. Marine ecology progress series, 135, 1-9. 

​​Torres, L. G. (2017). A sense of scale: Foraging cetaceans’ use of scale‐dependent multimodal sensory systems. Marine Mammal Science, 33(4), 1170-1193.

Different blue whale populations sing different songs

By Dawn Barlow, PhD Candidate, OSU Department of Fisheries, Wildlife, and Conservation Sciences, Geospatial Ecology of Marine Megafauna Lab

In human cultures, how you sound is often an indicator of where you are from. Have you ever taken a linguistics quiz that tries to guess what part of the United States you grew up in? Questions about whether you pronounce the sugary sweet treat caramel as “carr-mul” or “care-a-mel”, whether you say “soda” or “pop”, or whether a certain type of intersection is called a “roundabout”, “rotary”, or “traffic circle” are used to make a guess at where in the country you were raised. I have spent time in the United States, Australia, and New Zealand, I was amused to learn that the shoes you might wear in summertime can be called flip flops, slippers, thongs, or jandals, depending on which English-speaking country you are in. We know that listening to how someone speaks can tell us about their heritage or culture. As it turns out, the same is true for blue whales. We can learn a lot about blue whales by listening to them.

A blue whale comes up for air in the South Taranaki Bight, New Zealand. We catch only a short glimpse of these ocean giants when they are at the surface. By listening to their vocalizations using acoustic recordings, we can gain a whole new perspective on their lives. Photo by D. Barlow.

Sound is an incredibly important sense to marine mammals, particularly since sound waves can efficiently transmit over long distances in the ocean where other senses, such as vision or smell, are limited. Therefore, passive acoustic monitoring—placing hydrophones underwater to listen for an extended period of time and record the sounds of animals and their environment—is a highly effective tool for studying marine mammals, including blue whales. Throughout the world, blue whales sing. In this case, “song” is defined as a limited number of sound types that are produced in succession to form a recognizable pattern (McDonald et al. 2006). These songs are presumed to be produced by males only, most likely used to maintain associations and mediate social interactions, and seem to play a role in reproduction (Oleson et al. 2007, Lewis et al. 2018). Furthermore, these songs are highly stereotyped, and stable over decadal scales (McDonald et al. 2006).

Figure reproduced from McDonald et al. (2006), illustrating the variation and in blue whale songs from different geographic regions, and their stability over time: Recordings from New Zealand (A), the Central North Pacific (B), Australia (C), the Northeast Pacific (D) and North Indian Ocean (E) illustrate the stable character of the blue whale song over long time periods. All song types for which long time spans of recordings are available show some frequency drift through time, but only minor change in character. These examples were chosen because recordings over a significant time span were available to the authors in raw form, and not because these song types are more stable than the others.

Fascinatingly, blue whale songs have acoustic characteristics that are distinct between geographic regions. A blue whale in the northeast Pacific sings a different song than a blue whale in the north Atlantic; the song heard around Australia is distinct from the one sung off the coast of Chile, and so on. Therefore, differences in blue whale songs between areas can be used as a provisional hypothesis about population structure (McDonald et al. 2006, Samaran et al. 2013, Balcazar et al. 2015). Vocalizations may evolve more rapidly than traditional markers such as genetics or morphology that are often used to delineate populations, particularly in long-lived mammalian species such as blue whales (McDonald et al. 2006).

Figure reproduced from McDonald et al. (2006): Blue whale residence and population divisions suggested from their song types. Arrows indicate the direction of seasonal movements.

Despite the general rule of thumb that population-specific blue whale songs occur in separate geographic regions, there are examples throughout the southern hemisphere where songs from different populations overlap and are recorded in the same location (Samaran et al. 2010, 2013, Tripovich et al. 2015, McCauley et al. 2018, Buchan et al. 2020, Leroy et al. 2021). However, these examples may be instances where the populations temporally or ecologically partition their use of the area. For example, there may be differences in the timing of peak occurrence so that overlap is minimized by alternating which population is predominantly present in different seasons (Leroy et al. 2018). Alternatively, whales from different populations may overlap in space and time, but occupy different ecological niches at the same site. In this case, an area may simultaneously be a migratory corridor for one population and a foraging ground for another (Tripovich et al. 2015).

Figure reproduced from Leroy et al. (2021): Distribution of the five blue whale acoustic populations of the Indian Ocean: the Sri Lankan—NIO (yellow); Madagascan—SWIO (orange); Australian—SEIO (blue); and Arabian Sea—NWIO (red) pygmy blue whales; the hypothesized Chagos pygmy blue whale (green); and the Antarctic blue whale (black dashed line). These distributions have been inferred from the acoustic recordings conducted in the area. The long-term recording sites used to infer these distribution areas are indicated by red stars. Blue whale illustration by Alicia Guerrero.

In the South Taranaki Bight (STB) region of New Zealand, where the GEMM lab has been studying blue whales for the past decade (Torres 2013), the New Zealand song type is recorded year-round (Barlow et al. 2018). New Zealand blue whales rely on a productive upwelling system in the STB that supports an important foraging ground (Barlow et al. 2020, 2021). Antarctic blue whales also seasonally pass through New Zealand waters, likely along their migratory pathway between polar feeding grounds and lower latitude areas (Warren et al. 2021). What does it mean in terms of population connectivity or separation when two different populations occasionally share the same waters? How do these different populations ecologically partition the space they occupy? What drives their differing occurrence patterns? These are the sorts of questions I am diving into as we continue to explore the depths of our acoustic recordings from the STB region. We still have a lot to learn about these blue whales, and there is a lot to be learned through listening.

References:

Balcazar NE, Tripovich JS, Klinck H, Nieukirk SL, Mellinger DK, Dziak RP, Rogers TL (2015) Calls reveal population structure of blue whales across the Southeast Indian Ocean and the Southwest Pacific Ocean. J Mammal 96:1184–1193.

Barlow DR, Bernard KS, Escobar-Flores P, Palacios DM, Torres LG (2020) Links in the trophic chain: Modeling functional relationships between in situ oceanography, krill, and blue whale distribution under different oceanographic regimes. Mar Ecol Prog Ser 642:207–225.

Barlow DR, Klinck H, Ponirakis D, Garvey C, Torres LG (2021) Temporal and spatial lags between wind, coastal upwelling, and blue whale occurrence. Sci Rep 11:1–10.

Barlow DR, Torres LG, Hodge KB, Steel D, Baker CS, Chandler TE, Bott N, Constantine R, Double MC, Gill P, Glasgow D, Hamner RM, Lilley C, Ogle M, Olson PA, Peters C, Stockin KA, Tessaglia-hymes CT, Klinck H (2018) Documentation of a New Zealand blue whale population based on multiple lines of evidence. Endanger Species Res 36:27–40.

Buchan SJ, Balcazar-Cabrera N, Stafford KM (2020) Seasonal acoustic presence of blue, fin, and minke whales off the Juan Fernández Archipelago, Chile (2007–2016). Mar Biodivers 50:1–10.

Leroy EC, Royer JY, Alling A, Maslen B, Rogers TL (2021) Multiple pygmy blue whale acoustic populations in the Indian Ocean: whale song identifies a possible new population. Sci Rep 11:8762.

Leroy EC, Samaran F, Stafford KM, Bonnel J, Royer JY (2018) Broad-scale study of the seasonal and geographic occurrence of blue and fin whales in the Southern Indian Ocean. Endanger Species Res 37:289–300.

Lewis LA, Calambokidis J, Stimpert AK, Fahlbusch J, Friedlaender AS, Mckenna MF, Mesnick SL, Oleson EM, Southall BL, Szesciorka AR, Širović A (2018) Context-dependent variability in blue whale acoustic behaviour. R Soc Open Sci 5.

McCauley RD, Gavrilov AN, Jolli CD, Ward R, Gill PC (2018) Pygmy blue and Antarctic blue whale presence , distribution and population parameters in southern Australia based on passive acoustics. Deep Res Part II 158:154–168.

McDonald MA, Mesnick SL, Hildebrand JA (2006) Biogeographic characterisation of blue whale song worldwide: using song to identify populations. J Cetacean Res Manag 8:55–65.

Oleson EM, Wiggins SM, Hildebrand JA (2007) Temporal separation of blue whale call types on a southern California feeding ground. Anim Behav 74:881–894.

Samaran F, Adam O, Guinet C (2010) Discovery of a mid-latitude sympatric area for two Southern Hemisphere blue whale subspecies. Endanger Species Res 12:157–165.

Samaran F, Stafford KM, Branch TA, Gedamke J, Royer J, Dziak RP, Guinet C (2013) Seasonal and Geographic Variation of Southern Blue Whale Subspecies in the Indian Ocean. PLoS One 8:e71561.

Torres LG (2013) Evidence for an unrecognised blue whale foraging ground in New Zealand. New Zeal J Mar Freshw Res 47:235–248.

Tripovich JS, Klinck H, Nieukirk SL, Adams T, Mellinger DK, Balcazar NE, Klinck K, Hall EJS, Rogers TL (2015) Temporal Segregation of the Australian and Antarctic Blue Whale Call Types (Balaenoptera musculus spp.). J Mammal 96:603–610.

Warren VE, Širović A, McPherson C, Goetz KT, Radford CA, Constantine R (2021) Passive Acoustic Monitoring Reveals Spatio-Temporal Distributions of Antarctic and Pygmy Blue Whales Around Central New Zealand. Front Mar Sci 7:1–14.

Learning to Listen for Animals in the Sea

By Rachel Kaplan, PhD student, Oregon State University College of Earth, Ocean, and Atmospheric Sciences and Department of Fisheries, Wildlife, and Conservation Sciences, Geospatial Ecology of Marine Megafauna Lab

Part of what makes being a graduate student so exciting is the way that learning can flip the world around: you learn a new framework or method, and suddenly everything looks a little different. I am experiencing this fabulous phenomenon lately as I learn to collect and process active acoustic data, which can reveal the distribution and biomass of animals in the ocean – including those favored by foraging whales off of Oregon, like the tiny shrimp-like krill.

Krill, like this Thysanoessa spinifera, play a key role in California Current ecosystems. Photo credit: Scripps Institution of Oceanography.

We know that whales seek out the dense, energy-rich swarms that krill form, and that knowing where to expect krill can give us a leg up in anticipating whale distributions. Project OPAL (Overlap Predictions About Large whales) seeks to model and provide robust predictions of whale distributions off the coast of Oregon, so that managers can make spatially discrete decisions about potential fishery closures, minimizing burdens to fishermen while also maximizing protection of whales. We hope that including prey in our ecosystem models will help this effort, and working on this aim is one of the big tasks of my PhD.

So, how do we know where to expect krill to be off the coast of Oregon? Acoustic tools give us the opportunity to flip the world upside down: we use a tool called an echosounder to eavesdrop on the ocean, yielding visual outputs like the ones below that let us “see” and interpret sound.

Echograms like these reveal features in the ocean that scatter “pings” of sound, and interpreting these signals can show life in the water column.

This is how it works. The echosounder emits pulses of sound at a known frequency, and then it listens for their return after it bounces of the sea floor or things in the water column. Based on sound experiments in the laboratory, we know to expect our krill species, Euphausia pacifica and Thysanoessa spinifera, to return those echoes at a characteristic decibel level. By constantly “pinging” the water column with this sound, we can record a continuous soundscape along the cruise track of a vessel, and analyze it to identify the animals and features recorded.

I had the opportunity to use an echosounder for the first time recently, on the first HALO cruise. We deployed the echosounder soon after sunrise, 65 miles offshore from Newport. After a little fiddling and troubleshooting, I was thrilled to start “listening” to the water; I was able to see the frothy noise at its surface, the contours of the seafloor, and the pixelated patches that indicate prey in between. Although it’s difficult to definitively identify animals only based on the raw output, we saw swarms that looked like our beloved krill, and other aggregations that suggested hake. Sometimes, at the same time that the team of visual observers on the flying bridge of the vessel sighted whales, I also saw potential prey on the echogram.

 I spent much of the HALO cruise monitoring incoming data from the transducer on the SIMRAD EK60. Photo: Marissa Garcia.

I’m excited to keep collecting these data, and grateful that I can also access acoustic data collected by others. Many research vessels use echosounders while they are underway, including the NOAA Ship Bell M. Shimada, which conducts cruises in the Northern California Current several times a year. Starting in 2018, GEMM Lab members have joined these cruises to conduct marine mammal surveys.

This awesome pairing of data types means that we can analyze the prey that was available at the time of marine mammal sightings. I’ve been starting to process acoustic data from past Northern California Current cruises, eavesdropping on the preyscape in places that were jam-packed with whales, such as this echogram from the September 2020 cruise, below.

An echogram from the September 2020 NCC cruise shows a great deal of prey at different depths.

Like a lot of science, listening to animals in the sea comes down to occasional bursts of fieldwork followed by a lot of clicking on a computer screen during data analysis. This analysis can be some pretty fun clicking, though – it’s amazing to watch the echogram unfurl, revealing the preyscape in a swath of ocean. I’m excited to keep clicking, and learn what it can tell us about whale distributions off of Oregon.

Memoirs from above: drone observations of blue, humpback, Antarctic minke, and gray whales

By KC Bierlich, Postdoctoral Scholar, OSU Department of Fisheries, Wildlife, & Conservation Sciences, Geospatial Ecology of Marine Megafauna Lab

With the GRANITE field season officially over, we are now processing all of the data we collected this summer. For me, I am starting to go through all the drone videos to take snapshots of each whale to measure their body condition. As I go through these videos, I am reflecting on the different experiences I am fortunate enough to have with flying different drones, in different environments, over different species of baleen whales: blue, humpback, Antarctic minke, and now gray whales. Each of these species have a different morphological design and body shape (Woodward et al., 2006), which leads to different behaviors that are noticeable from the drone. Drones create immense opportunity to learn how whales thrive in their natural environments [see previous blog for a quick history], and below are some of my memories from above. 

I first learned how drones could be used to study the morphology and behavior of large marine mammals during my master’s degree at Duke University, and was inspired by the early works of John Durban (Durban et al., 2015, 2016) Fredrick Christiansen (Christiansen et al., 2016) and Leigh Torres (Torres et al., 2018). I immediately recognized the value and utility of this technology as a new tool to better monitor the health of marine mammals. This revelation led me to pursue a PhD with the Duke University Marine Robotics and Remote Sensing (MaRRS) Lab led by Dr. Dave Johnston where I helped further develop tools and methods for collecting drone-based imagery on a range of species in different habitats. 

When flying drones over whales, there are a lot of moving parts; you’re on a boat that is moving, flying something that is moving, following something that is moving. These moving elements are a lot to think about, so I trained hard, so I did not have to think about each step and flying felt intuitive and natural. I did not grow up playing video games, so reaching this level of comfort with the controls took a lot of practice. I practiced for hours over the course of months before my first field excursion and received some excellent mentorship and training from Julian Dale, the lead engineer in the MaRRS Lab. Working with Julian and the many hours of training helped me establish a solid foundation in my piloting skills and feel confident working in various environments on different species. 

Blue whales offshore of Monterey, California. 

In 2017 and 2018 I was involved in collaborative project with the MaRRS Lab and Goldbogen Lab at Stanford University, where we tagged and flew drones over blue whales offshore of Monterey, California. We traveled about an hour offshore and reliably found groups of blue whales actively feeding. Working offshore typically brought a large swell, which can often make landing the drone back into your field partner’s hands tricky as everything is bobbing up and down with the oscillations of the swell. Fortunately, we worked from a larger research vessel (~56 ft) and quickly learned that landing the drone in the stern helped dampen the effects of bobbing up and down. The blue whales we encountered often dove to a depth of around 200 m for about 20-minute intervals, then come to the surface for only a few minutes. This short surface period provided only a brief window to locate the whale once it surfaced and quickly fly over it to collect the imagery needed before it repeated its dive cycle. We learned to be patient and get a sense of the animal’s dive cycle before launch in order to time our flights so the drone would be in the air a couple of minutes before the whale surfaced. 

Once over the whales, the streamlined body of the blue whales was noticeable, with their small, high aspect ratio flippers and fluke that make them so well adapted for fast swimming in the open ocean (Fig. 1) (Woodward et al., 2006). I also noticed that because these whales are so large (often 21 – 24 m), I often flew at higher altitudes to be able fit them within the field of view of the camera. It was also always shocking to see how small the tagging boat (~8 m) looked when next to Earth’s largest creatures. 

Figure 1. Two blue whales surface after a deep dive offshore of Monterey, Ca. (Image credit: Duke University Marine Robotics and Remote Sensing under NOAA permit 14809-03)

Antarctic minke whales and humpback whales along the Western Antarctic PeninsulaA lot of the data included in my dissertation came from work along the Western Antarctic Peninsula (WAP), which had a huge range of weather conditions, from warm and sunny days to cold and snowy/foggy/rainy/windy/icy days. A big focus was often trying to keep my hands warm, as it was often easier to fly without gloves in order to better feel the controls. One of the coldest days I remember was late in the season in mid-June (almost winter!) in Wilhemina Bay where ice completely covered the bay in just a couple hours, pushing the whales out into the Gerlache Strait; I suspect this was the last ice-free day of the season. Surprisingly though, the WAP also brought some of the best conditions I have ever flown in. Humpback and Antarctic minke whales are often found deep within the bays along the peninsula, which provided protection from the wind. So, there were times where it would be blowing 40 mph in the Gerlache Strait, but calm and still in the bays, such as Andvord Bay, which allowed for some incredible conditions for flying. Working from small zodiacs (~7 m) allowed us more maneuverability for navigating around or through the ice deep in the bays (Fig. 2) 

Figure 2. Navigating through ice-flows along the Western Antarctic Peninsula. (Image credit: Duke University Marine Robotics and Remote Sensing under NOAA permit 14809-03 and ACA permits 2015-011 and 2020-016.)

Flying over Antarctic minke whale was always rewarding, as they are very sneaky and can quickly disappear under ice flows or in the deep, dark water. Flying over them often felt like a high-speed chase, as their small streamlined bodies makes them incredibly quick and maneuverable, doing barrel rolls, quick banked turns, and swimming under and around ice flows (Fig. 3). There would often be a group between 3-7 individuals and it felt like they were playing tag with each other – or perhaps with me!  

Figure 3. Two Antarctic minke whales swimming together along the Western Antarctic Peninsula. (Image credit: Duke University Marine Robotics and Remote Sensing under NOAA permit 14809-03 and ACA permits 2015-011 and 2020-016.)

Humpbacks displayed a wide range of behaviors along the WAP. Early in the season they continuously fed throughout the entire day, often bubble net feeding in groups typically of 2-5 animals (Fig. 4). For as large as they are, it was truly amazing to see how they use their pectoral fins to perform quick accelerations and high-speed maneuvering for tight synchronized turns to form bubble nets, which corral and trap their krill, their main food source (Fig. 4) (Woodward et al., 2006). Later in the season, humpbacks switched to more resting behavior in the day and mostly fed at night, taking advantage of the diel vertical migration of krill. This behavior meant we often found humpbacks snoozing at the surface after a short dive, as if they were in a food coma. They also seemed to be more curious and playful with each other and with us later in the season (Fig. 5).

We also encountered a lot of mom and calf pairs along the WAP. Moms were noticeably skinny compared to their plump calf in the beginning of the season due to the high energetic cost of lactation (Fig. 6). It is important for moms to regain this lost energy throughout the feeding season and begin to wean their calves. I often saw moms refusing to give milk to their nudging calf and instead led teaching lessons for feeding on their own.

Figure 4. Two humpback whales bubble-net feeding early in the feeding season (December) along the Western Antarctic Peninsula. (Image credit: Duke University Marine Robotics and Remote Sensing under NOAA permit 14809-03 and ACA permits 2015-011 and 2020-016.)
Figure 5. A curious humpback whale dives behind our Zodiac along the Western Antarctic Peninsula. (Image credit: Duke University Marine Robotics and Remote Sensing under NOAA permit 14809-03 and ACA permits 2015-011 and 2020-016.)
Figure 6. A mom and her calf rest at the surface along the Western Antarctic Peninsula. Note how the mom looks skinnier compared to her plump calf, as lactation is the most energetically costly phase of the reproductive cycle. (Image credit: Duke University Marine Robotics and Remote Sensing under NOAA permit 14809-03 and ACA permits 2015-011 and 2020-016.)

Gray whales off Newport, Oregon

All of these past experiences helped me quickly get up to speed and jump into action with the GRANITE field team when I officially joined the GEMM Lab this year in June. I had never flown a DJI Inspire quadcopter before (the drone used by the GEMM Lab), but with my foundation piloting different drones, some excellent guidance from Todd and Clara, and several hours of practice to get comfortable with the new setup, I was flying over my first gray whale by day three of the job. 

The Oregon coast brings all sorts of weather, and some days I strangely found myself wearing a similar number of layers as I did in Antarctica. Fog, wind, and swell could all change within the hour, so I learned to make the most of weather breaks when they came. I was most surprised by how noticeably different gray whales behave compared to the blue, Antarctic minke, and humpback whales I had grown familiar with watching from above. For one, it is absolutely incredible to see how these huge whales use their low-aspect ratio flippers and flukes (Woodward et al., 2006) to perform low-speed, highly dynamic maneuvers to swim in very shallow water (5-10 m) so close to shore (<1m sometimes!) and through kelp forest or surf zones close to the beach. They have amazing proprioception, or the body’s ability to sense its movement, action, and position, as gray whales often use their pectoral fins and fluke to stay in a head standing position (see Clara Bird’s blog) to feed in the bottom sediment layer, all while staying in the same position and resisting the surge of waves that could smash them against the rocks (Video 1) . It is also remarkable how the GEMM Lab knows each individual whale based on natural skin marks, and I started to get a better sense of each whale’s behavior, including where certain individuals typically like to feed, or what their dive cycle might be depending on their feeding behavior. 

Video 1. Two Pacific Coast Feeding Group (PCFG) gray whales “head-standing” in shallow waters off the coast of Newport, Oregon. NOAA/NMFS permit #21678

I feel very fortunate to be a part of the GRANITE field team and to contribute to data collection efforts. I look forward to the data analysis phase to see what we learn about how the morphology and behavior of these gray whales to help them thrive in their environment. 

References: 

Christiansen, F., Dujon, A. M., Sprogis, K. R., Arnould, J. P. Y., and Bejder, L. (2016).Noninvasive unmanned aerial vehicle provides estimates of the energetic cost of reproduction in humpback whales. Ecosphere 7, e01468–18.

Durban, J. W., Fearnbach, H., Barrett-Lennard, L. G., Perryman, W. L., & Leroi, D. J. (2015). Photogrammetry of killer whales using a small hexacopter launched at sea. Journal of Unmanned Vehicle Systems3(3), 131-135.

Durban, J. W., Moore, M. J., Chiang, G., Hickmott, L. S., Bocconcelli, A., Howes, G., et al.(2016). Photogrammetry of blue whales with an unmanned hexacopter. Mar. Mammal Sci. 32, 1510–1515.

Torres, L. G., Nieukirk, S. L., Lemos, L., & Chandler, T. E. (2018). Drone up! Quantifying whale behavior from a new perspective improves observational capacity. Frontiers in Marine Science5, 319.

Woodward, B. L., Winn, J. P., and Fish, F. E. (2006). Morphological specializations of baleen whales associated with hydrodynamic performance and ecological niche. J. Morphol. 267, 1284–1294.