By Rachel Kaplan, PhD student, Oregon State University College of Earth, Ocean, and Atmospheric Sciences and Department of Fisheries, Wildlife, and Conservation Sciences, Geospatial Ecology of Marine Megafauna Lab
Part of what makes being a graduate student so exciting is the way that learning can flip the world around: you learn a new framework or method, and suddenly everything looks a little different. I am experiencing this fabulous phenomenon lately as I learn to collect and process active acoustic data, which can reveal the distribution and biomass of animals in the ocean – including those favored by foraging whales off of Oregon, like the tiny shrimp-like krill.

We know that whales seek out the dense, energy-rich swarms that krill form, and that knowing where to expect krill can give us a leg up in anticipating whale distributions. Project OPAL (Overlap Predictions About Large whales) seeks to model and provide robust predictions of whale distributions off the coast of Oregon, so that managers can make spatially discrete decisions about potential fishery closures, minimizing burdens to fishermen while also maximizing protection of whales. We hope that including prey in our ecosystem models will help this effort, and working on this aim is one of the big tasks of my PhD.
So, how do we know where to expect krill to be off the coast of Oregon? Acoustic tools give us the opportunity to flip the world upside down: we use a tool called an echosounder to eavesdrop on the ocean, yielding visual outputs like the ones below that let us “see” and interpret sound.

This is how it works. The echosounder emits pulses of sound at a known frequency, and then it listens for their return after it bounces of the sea floor or things in the water column. Based on sound experiments in the laboratory, we know to expect our krill species, Euphausia pacifica and Thysanoessa spinifera, to return those echoes at a characteristic decibel level. By constantly “pinging” the water column with this sound, we can record a continuous soundscape along the cruise track of a vessel, and analyze it to identify the animals and features recorded.
I had the opportunity to use an echosounder for the first time recently, on the first HALO cruise. We deployed the echosounder soon after sunrise, 65 miles offshore from Newport. After a little fiddling and troubleshooting, I was thrilled to start “listening” to the water; I was able to see the frothy noise at its surface, the contours of the seafloor, and the pixelated patches that indicate prey in between. Although it’s difficult to definitively identify animals only based on the raw output, we saw swarms that looked like our beloved krill, and other aggregations that suggested hake. Sometimes, at the same time that the team of visual observers on the flying bridge of the vessel sighted whales, I also saw potential prey on the echogram.

I’m excited to keep collecting these data, and grateful that I can also access acoustic data collected by others. Many research vessels use echosounders while they are underway, including the NOAA Ship Bell M. Shimada, which conducts cruises in the Northern California Current several times a year. Starting in 2018, GEMM Lab members have joined these cruises to conduct marine mammal surveys.
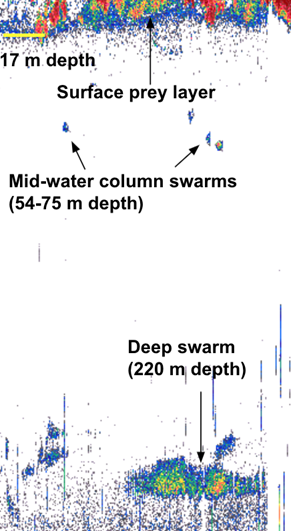
This awesome pairing of data types means that we can analyze the prey that was available at the time of marine mammal sightings. I’ve been starting to process acoustic data from past Northern California Current cruises, eavesdropping on the preyscape in places that were jam-packed with whales, such as this echogram from the September 2020 cruise, below.
Like a lot of science, listening to animals in the sea comes down to occasional bursts of fieldwork followed by a lot of clicking on a computer screen during data analysis. This analysis can be some pretty fun clicking, though – it’s amazing to watch the echogram unfurl, revealing the preyscape in a swath of ocean. I’m excited to keep clicking, and learn what it can tell us about whale distributions off of Oregon.