How much energy does that mouthful cost?

By Lisa Hildebrand, PhD student, OSU Department of Fisheries, Wildlife, & Conservation Sciences, Geospatial Ecology of Marine Megafauna Lab

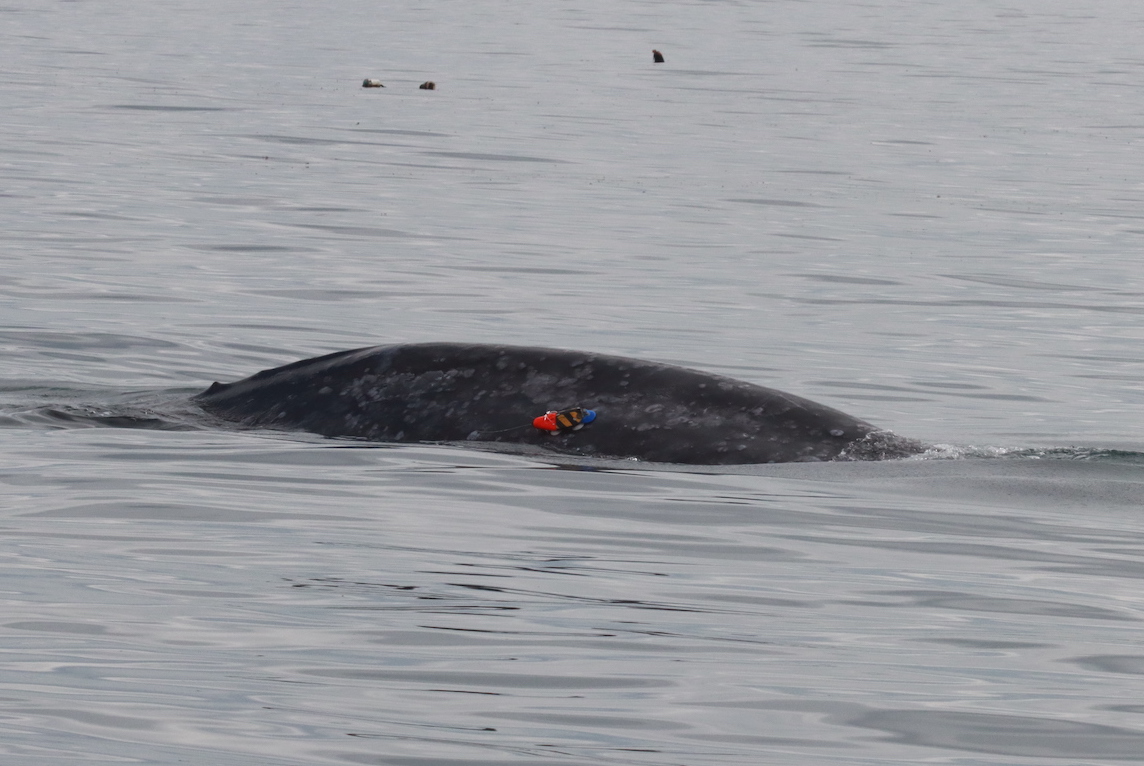
Tagging a whale is no easy feat, nor is it without some impact to the whale – no matter how minimized through the use of non-penetrating suction cup tags. Yet, in August 2021 the GEMM Lab initiated a new phase in our research on gray whales, aimed at obtaining a better understanding of the underwater lives and energetics of a gray whale (Figure 1, top image). We captured some amazing data through these specialized, non-invasive tags that provide a brief window into their world and physiology. The video recordings from the tags showed us whales digging their heads into the benthos generating billowing clouds of sediment, likely exploiting desirable prey patches (Figure 1, middle images). We also saw foraging whales undertake dizzying spins and headstands for hours, demonstrating the fascinating maneuverability and flexibility of gray whales (Figure 1, bottom image). But what is motivating us to capture this information?

The GEMM Lab has researched the ecology and physiology of Pacific Coast Feeding Group (PCFG) gray whales since 2015. Our efforts have filled crucial knowledge gaps to better understand this sub-group of the Eastern North Pacific (ENP) gray whale population. We now know that gray whale body condition increases throughout a foraging season and can fluctuate considerably between years (Soledade Lemos et al. 2020). Additionally, body condition varies significantly by reproductive state, with calves and pregnant females displaying higher body conditions (Soledade Lemos et al. 2020). We have also validated and quantified fecal steroid and thyroid hormone metabolite concentrations, providing us with thresholds to identify a stressed vs. a not stressed whale based on its hormone levels (Lemos et al. 2020). These validations have allowed us to make correlations between poor body condition and the steroid hormone cortisol which confirm that slim whales are stressed, while chubby whales are relaxed (Lemos et al. 2021). These physiological results are particularly salient in the light of our recent findings that PCFG gray whales select prey quality over prey quantity when foraging (Hildebrand et al. in review) and that the caloric content of available prey species in the PCFG range vary significantly (Hildebrand et al. 2021).

While we have addressed several fundamental questions about the PCFG in the last 7 years, answering one question has led to asking 10 more questions – a common pattern in science. Given that we know (1) PCFG whales improve their body condition over the course of the foraging season (Soledade Lemos et al. 2020), (2) PCFG females are able to successfully give birth to and wean calves (Calambokidis & Perez 2017), and (3) certain prey in the PCFG region are of higher caloric value than prey in the ENP Arctic foraging grounds (Hildebrand et al. 2021), a big question that we continue to scratch our heads about is why does the PCFG sub-group have such a small abundance (~250 individuals; Calambokidis et al. 2017) in comparison to the much larger ENP population (~21,000 individuals; Stewart & Weller 2021). Several hypotheses have been suggested including that the energetic costs of feeding may differ between ENP and PCFG whales, with the latter having to expend more energy to obtain prey due to the different foraging behaviors employed (Torres et al. 2018) to obtain diverse prey types, thus justifying the larger abundance of the ENP (Hildebrand et al. 2021). 

Quantifying the energetic cost of baleen whale behaviors is not simple. However, the development of animal-borne tags has allowed scientists to make big strides regarding behavioral cost quantification. The majority of this work has focused on rorqual whales (i.e., blue, humpback, fin whales; e.g., Goldbogen et al. 2013; Cade et al. 2016) as their characteristic lunge-feeding strategy produces a distinct signal in the accelerometer sensors integrated within the tags, making feeding events easier to identify. Gray whales, unlike rorquals, do not lunge-feed. ENP gray whales predominantly feed benthically; diving down to the benthos where they turn onto their side and suction mouthfuls of soft sediment (mud) that contains amphipods that they filter out of the mud (Nerini & Oliver 1983). PCFG whales feed benthically as well, but they also use a number of other feeding behaviors to obtain a variety of prey in a variety of benthic habitats, including headstands, bubble blasts, and sharking (Torres et al. 2018). The above-mentioned gray whale feeding behaviors involve much subtler movements than the powerful, distinctive lunges displayed by rorquals, yet they undoubtedly still incur some energetic cost to the whales. However, exactly how energetically costly the various gray whale feeding behaviors are remains unknown.

One of the three suction cup tags we deployed on gray whales. Dr. Cade printed special “kelp shields” (blue part of the tag) to prevent kelp from potentially getting caught underneath the tag since PCFG whales often forage on reefs with a lot of kelp. This tag includes a video camera (the lens can be seen in the center of the tag) to record video of the whale’s underwater behavior. Source: L. Torres.

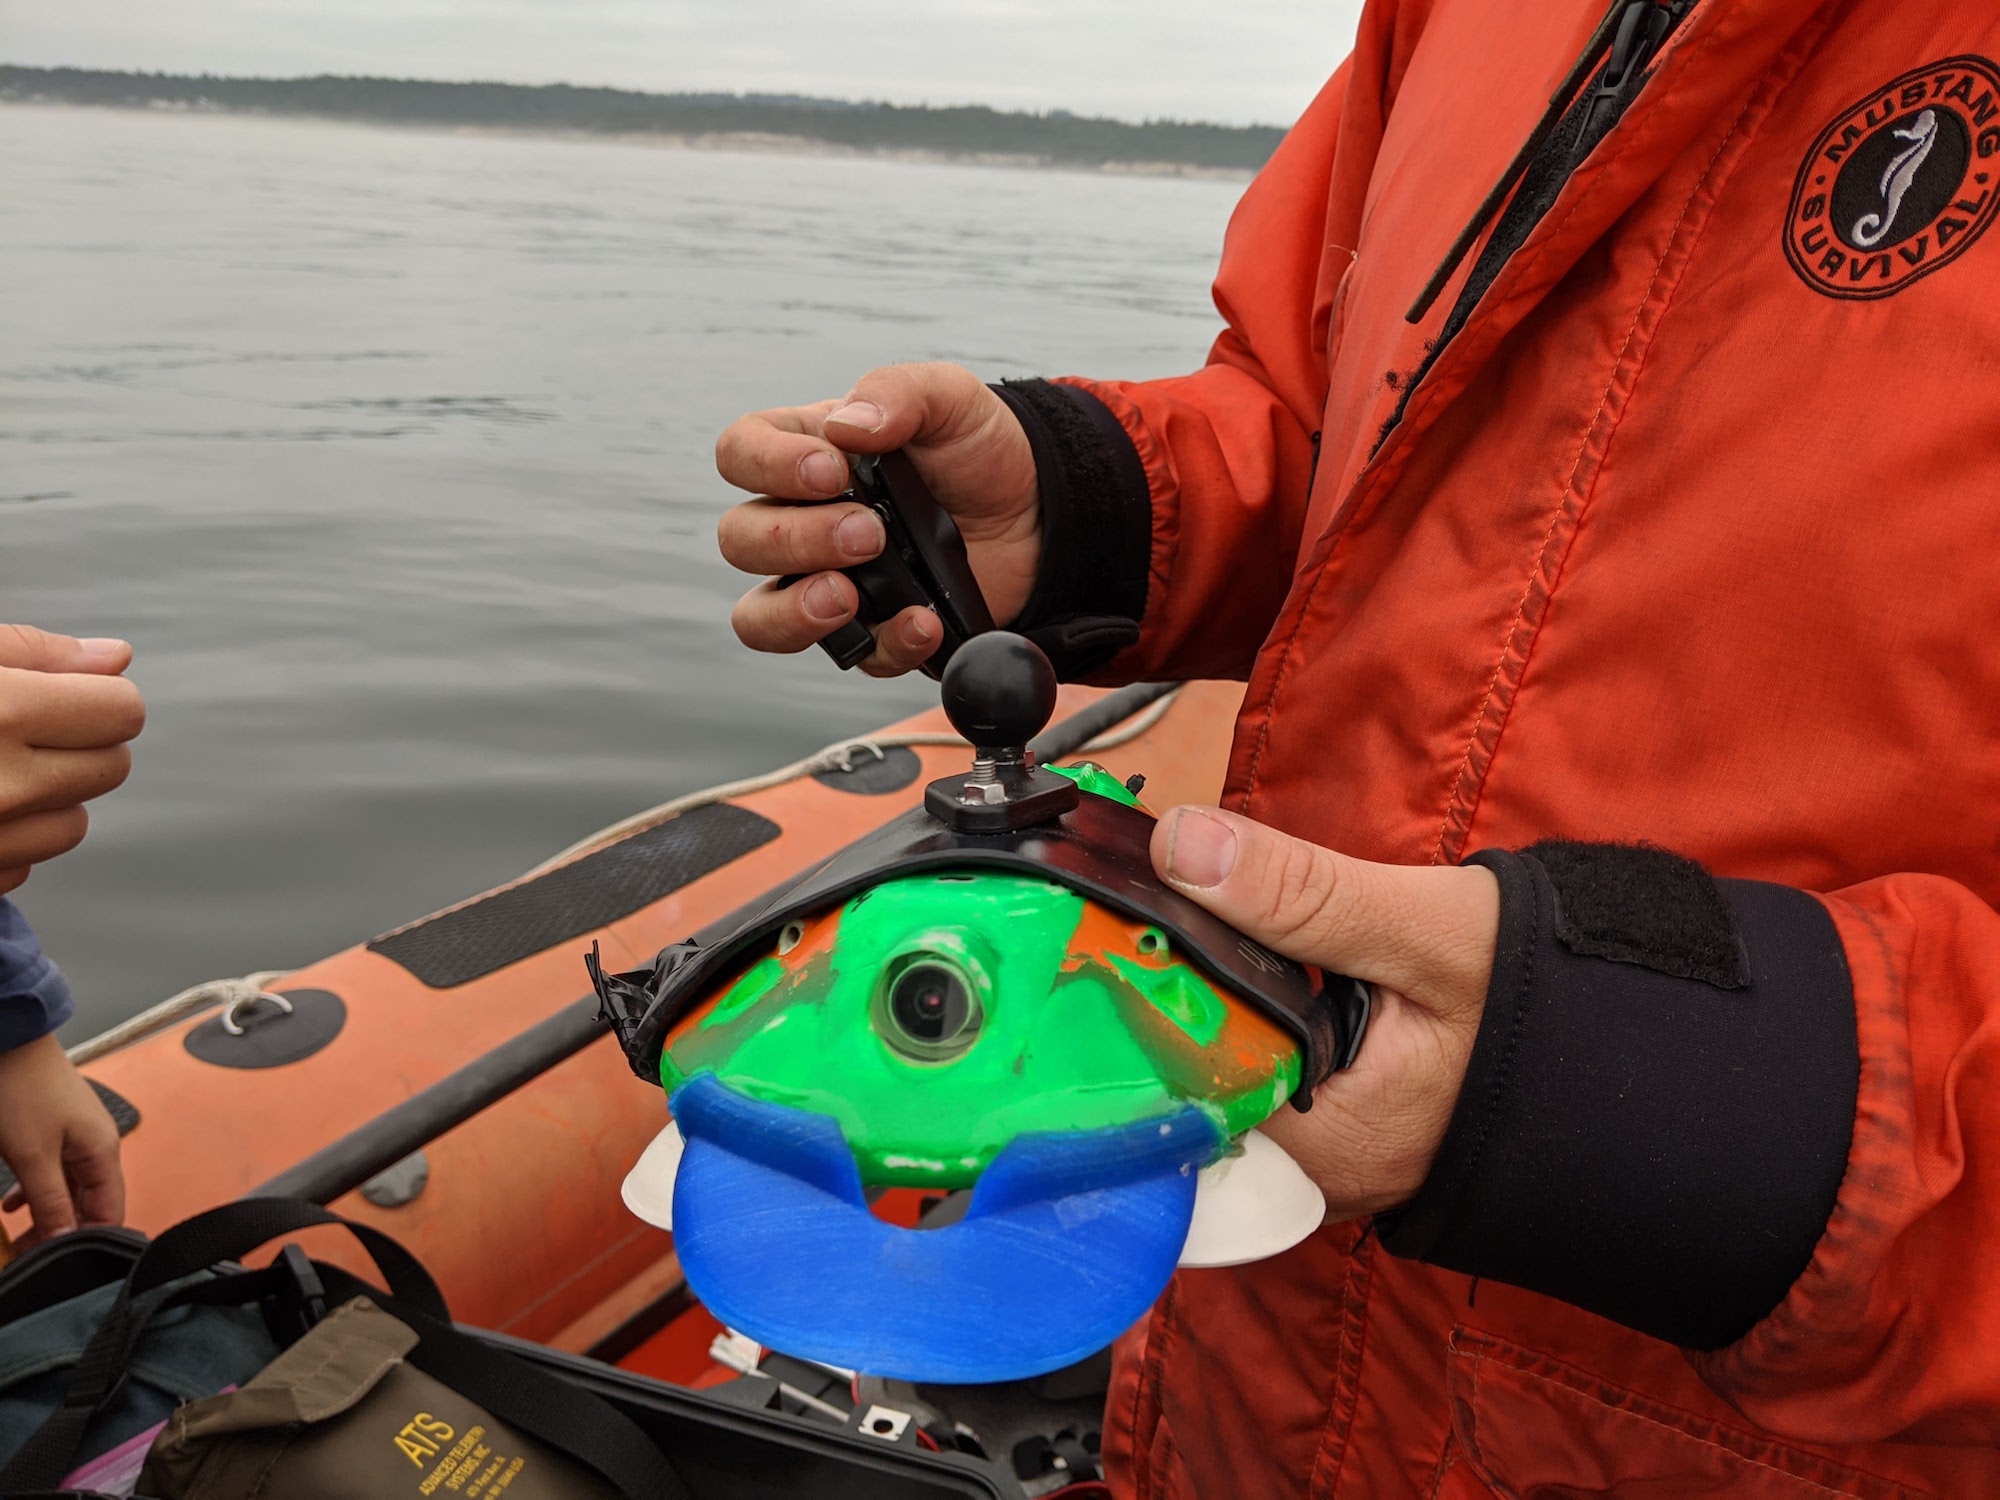
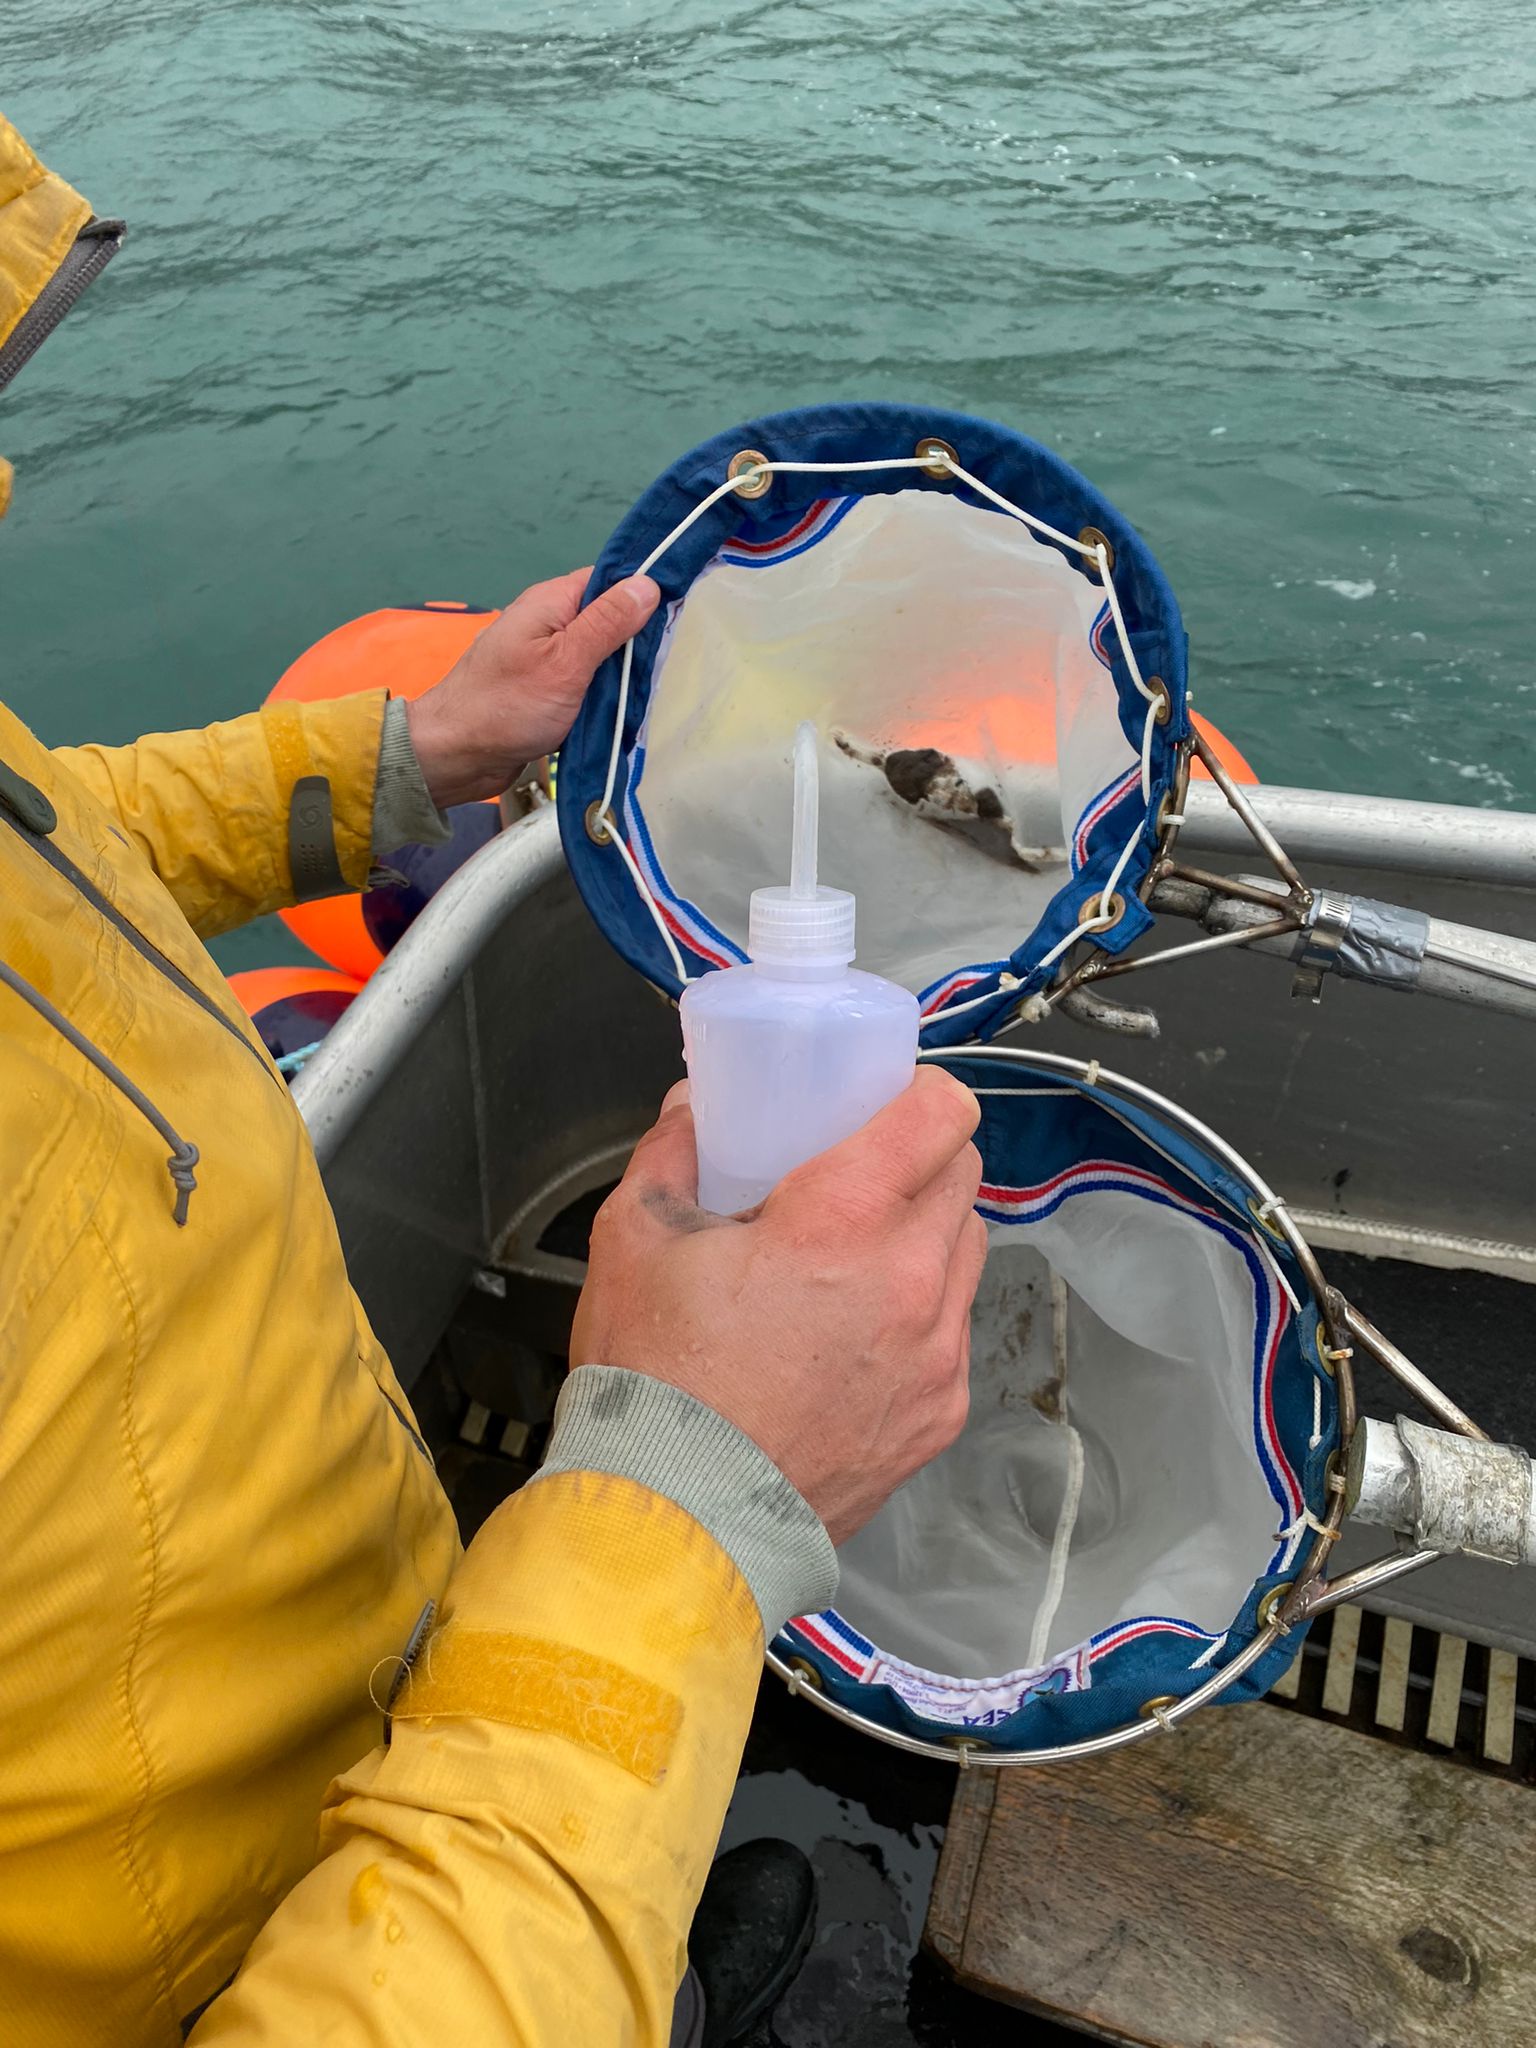
This knowledge gap is one of the reasons why the GEMM Lab initiated a new project in close collaboration with Dr. Dave Cade from Stanford University and John Calambokidis from Cascadia Research Collective to quantify and understand the energetics and underwater behavior of gray whales using suction-cup tags. The project was kick-started with a very successful pilot effort the week of August 16th this year. Tags were placed on the backs of three different PCFG gray whales with a long carbon fiber pole and attached to the whales with four suction cups. The tags recorded video, position, accelerometry, and magnetometry data, which we will use to recreate the animal’s movements (pitch, roll), heading, trackline, and environment. Although the weather forecast did not look promising for most of the week, we lucked out with perfect conditions for one day during which we managed to deploy three tags on three different gray whales that are well-known, long-term study animals of the GEMM Lab. The tags stayed on the whales for 1-6 hours and were all recovered (including an adventurous trip up the Alsea River which involved a kayak deployment!). 

Dr. Cade spent the rest of the week teaching GEMM Lab PI Leigh Torres, University of British Columbia Master’s student Kate Colson (who is co-advised by Leigh and Dr. Andrew Trites), and myself the intricacies of data download, processing, and preliminary analysis of the tag data. For her Master’s research, Kate will develop a bioenergetics model for the PCFG sub-group that includes data on foraging energetics (estimated from the tag data) and prey availability in the PCFG foraging range. I plan on using the tag data to assess behavior patterns of PCFG whales relative to habitat as part of my PhD research. All together analysis of the data from these short-term tag deployments will help us get closer to understanding the behavioral choices, habitat needs, and energetic trade-offs of whales living in a rapidly changing ocean. With the success of this pilot effort, we plan to conduct another suction-cup tagging effort next summer to hopefully capture and explore more mysterious underwater behaviors of the PCFG.

An ecstatic team at the end of a very long yet successful day of suction cup tagging. Bottom (from left): Leigh Torres, Lisa Hildebrand, Clara Bird, Dave Cade, KC Bierlich. Top: John Calambokidis.

This project was funded by sales and renewals of the special Oregon whale license plate, which benefits MMI. We gratefully thank all the gray whale license plate holders, who made this research effort possible.

Literature cited

Cade, D. E., Friedlaender, A. S., Calambokidis, J., & Goldbogen, J. A. 2016. Kinematic diversity in rorqual whale feeding mechanisms. Current Biology 26(19):2617-2624. doi:10.1016/j.cub.2016.07.037.

Calambokidis, J., & Perez, A. 2017. Sightings and follow-up of mothers and calves in the PCFG and implications for internal recruitment. IWC Report SC/A17/GW/04 for the Workshop on the Status of North Pacific Gray Whales (La Jolla: IWC). 

Calambokidis, J., Laake, J., & Perez, A. 2017. Updated analysis of abundance and population structure of seasonal gray whales in the Pacific Northwest, 1996-2015. IWC Report SC/A17/GW/05 for the Workshop on the Status of North Pacific Gray Whales (La Jolla: IWC).

Goldbogen, J. A., Friedlaender, A. S., Calambokidis, J., McKenna, M. F., Simon, M., & Nowacek, D. P. 2013. Integrative approaches to the study of baleen whale diving behavior, feeding performance, and foraging ecology. BioScience 63(2):90-100. doi:10.1525/bio.2013.63.2.5.

Hildebrand, L., Bernard, K. S., & Torres, L. G. 2021. Do gray whales count calories? Comparing energetic values of gray whale prey across two different feeding grounds in the eastern North Pacific. Frontiers in Marine Science 1008. doi:10.3389/fmars.2021.683634.

Lemos, L. S., Olsen, A., Smith, A., Burnett, J. D., Chandler, T. E., Larson, S., Hunt, K. E., & Torres, L. G. 2021. Stressed and slim or relaxed and chubby? A simultaneous assessment of gray whale body condition and hormone variability. Marine Mammal Science. doi:10.111/mms.12877.

Lemos, L.S., Olsen, A., Smith, A., Chandler, T.E., Larson, S., Hunt, K., and L.G. Torres. 2020. Assessment of fecal steroid and thyroid hormone metabolites in eastern North Pacific gray whales. Conservation Physiology 8:coaa110.

Nerini, M. K., & Oliver, J. S. 1983. Gray whales and the structure of the Bering Sea benthos. Oecologia 59:224-225. doi:10.1007/bf00378840.

Soledade Lemos, L., Burnett, J. D., Chandler, T. E., Sumich, J. L., & Torres, L. G. 2020. Intra- and inter-annual variation in gray whale body condition on a foraging ground. Ecosphere 11(4):e03094.

Stewart, J. D., & Weller, D. W. 2021. Abundance of eastern North Pacific gray whales 2019/2020. Department of Commerce, NOAA Technical Memorandum NMFS-SWFSC-639. United States: NOAA. doi:10.25923/bmam-pe91.

Torres, L.G., Nieukirk, S.L., Lemos, L., and T.E. Chandler. 2018. Drone Up! Quantifying Whale Behavior From a New Perspective Improves Observational Capacity. Frontiers in Marine Science: https://doi.org/10.3389/fmars.2018.00319.


The first voyage of the HALO project

Imogen Lucciano, Graduate Student, OSU Department of Fisheries, Wildlife, & Conservation Sciences, Geospatial Ecology of Marine Megafauna Lab. Marissa Garcia, Graduate Student, Cornell Department of Ornithology Center for Conservation Bioacoustics.

There is nothing quite like the excitement of starting a fresh project, and the newly organized Holistic Assessment of Living marine resources off the Oregon coast (HALO) project team was alive with it on 8 October as we prepared our various elements of research gear aboard the R/V Pacific Storm in the Newport bayfront (Fig 1). The weather was predicted suitable enough for our 24-hour trip out along the Newport Hydrographic line (NHL; Fig 2), and so we focused on the questions of whether we had remembered to pack each necessary piece of equipment, whether we had sufficiently charged and calibrated each bit of gear, whether we had enough snacks, and the most looming question of all, what would we see and hear when we get out there? The species guessing game only enhanced the thrill of our departure.

Figure 1. The R/V Pacific Storm docked at the Newport bayfront. Photo: Rachel Kaplan.

The HALO project aims to fill gaps in knowledge on the abundance and distribution of cetaceans off the Oregon coast, and relative to ongoing climate change and marine renewable energy development projects along the Oregon coast. The core of the HALO project is deployment of three hydrophones to record year-round cetacean vocalizations in the same area where we will conduct visual line surveys for cetaceans monthly in addition to mapping prey. Needless to say, we (the grad student authors of this blog) feel humbled and grateful to be on the project – not to mention, eager to gain our sea legs like the rest of the pros on the team and boat crew (much sea sickness meds were at the ready!).

This HALO team is well stacked, engaging the expertise and specialties of researchers from three different schools of science. Leigh Torres of the Marine Mammal Institute (MMI)’s GEMM lab (assisted by newcomer graduate student, Miranda Mayhall/coauthor of this post) brings to the project the knowledge of visual survey distance sampling data collection and analysis and will work alongside Craig Hayslip of MMI who will serve as lead visual observer. The visual sightings will inform us on cetacean occurrence patterns in the region. Since cetaceans also spend a great deal of time underwater, Holger Klinck, an expert bioacoustician from Cornell University and affiliate MMI professor (with graduate student Marissa Garcia, also a coauthor of this blog) will oversee the deployment of specialized hydrophones along our research line to record acoustic data. After the hydrophones are deployed, and while we are on-survey looking for cetaceans, we will also run a EK60 transducer (A.K. echosounder) to record backscatter data on prey in the area. This aspect of HALO brings in the third element of research from OSU’s College of Earth, Ocean, and Atmospheric Sciences (CEOAS) Zooplankton Ecology Lab, Kim Bernard who is leading the effort to collect and analyze prey data. During this first voyage, Rachel Kaplan, a grad student of both the GEMM lab and Zooplankton Ecology Labs, came along to run the echosounder and ensure data quality.

Figure 2. HALO’s research track-line: a 40-mile stretch along the Newport Hydrographic Line (NHL) from NH65 to NH25. The three points indicate the locations of the three deployed hydrophones.

With the sun nearly set, the R/V Pacific Storm left the dock at 7pm, pushing from Yaquina Bay out to the Pacific along the NHL hopping over swells that rocked the boat. Despite our strong-willed confidence, it was tough then to focus on anything but maintaining personal physiological equilibrium. Darkness surrounded the vessel, and we wouldn’t be able to see much of the Pacific Ocean until morning. It would take us nearly eleven hours to reach our first destination, 65 miles offshore (NH65) at which point all the activities would begin. All we could do was brace through the evening and hope that by dawn the dizziness would subside. We had field work adventures ahead! So, the focus went from extreme high energy to tucking in and allowing the Storm’s highly experienced crew to maintain watch and bring us to our first destination.   

Figure 3. The research lab room on the R/V Pacific Storm with four eager scientists just as team HALO departed Yaquina Bay; from the left Holger Klinck, Marissa Garcia, Rachel Kaplan & Leigh Torres. Photo: Miranda Mayhall.

At sunrise, the team rose to their feet, and we (the grad students) did what we could to muster the energy to crawl up the stairs, snap on lifejackets and ample out on the boat deck. Despite our condition, we looked out to a sight unlike anything we had ever seen before. The ocean was a deep purple, with flecks of orange bordering the horizon behind fluffy, indigo clouds. We were at NH65, and at this point it was time to deploy the first Rockhopper, a specialized hydrophone developed at Cornell lab of Ornithology, with the capability of recording at a high sampling rate (394 kHz), which allows it to detect and record most marine mammal species. In this case, we were recording at 197 kHz, only leaving our porpoises from the recordings.

Although the acoustic team has extensively prepared the hydrophones for deployment, nothing quite prepared us for focusing on the final connections and tests on the back deck while the boat rocked back and forth. The team initiated the Rockhopper for recording, and then we proceeded with setting up the mooring — connecting the Rockhopper to the acoustic release, float, and weights. We then slowly slid it off the edge of the boat, and there it went into the ocean, where it will record for six months, approximately 3,000 meters under the surface.

Figure 4. The HALO team prepared the Rockhopper (the orange orb-like device) for deployment; from the left, Craig Hayslip, Holger Klinck, and Marissa Garcia. Photo: Rachel Kaplan.

 Once the first Rockhopper was deployed, making its way to the ocean floor, the “transducer pole” was deployed off the side of the vessel to collect echosounder data and the long endeavor of conducting visual survey for the length of the research line began. Observers were glued to binoculars, scouring the sea for the presence of cetaceans, as the ocean swell rocked the boat on our journey eastward. Those with an appetite nibbled on Tony’s Chocoloney chocolate bars (Thanks, Leigh!), breaking off pieces and passing around the bar to each visual observer — an optimal fuel for remaining attentive.

Figure 5. HALO team up on the flying bridge; Observers clockwise from the lower left: Leigh Torres, Marissa Garcia, Craig Hayslip, Miranda Mayhall, Holger Klinck.

During visual survey effort, we observe from the flying bridge the entire front 180 degrees of the vessel trackline, all the while recording data on where we do and don’t see cetaceans (presence and absence data). During this survey effort we record the sighting conditions (visibility, sea state, glare), and when we see cetaceans we record the distance to the marine mammals from the boat, the species identification, and the number of animals in the sighting. We use a program called SeaScribe to collect our data. As we use the data collection protocols on each of the 12 planned monthly surveys, we will obtain a valuable, standardized dataset that can be analyzed relative to environmental conditions and in comparison, to the acoustic data to understand cetacean distribution patterns. The survey pressed on, and all the while the echosounder was actively recording prey availability data, with Rachel Kaplan at the control. 

Figure 6. Rachel Kaplan monitoring the incoming data from the transducer on the SIMRAD EK60. Photo: Marissa Garcia.

Over the course of the survey, the visual team spotted northern right whale dolphins, a fin whale, a small group of killer whales and many scattered humpback whales. All three Rockhoppers were deployed at their intended locations at NH65, NH45, and then NH25. The echosounder successfully collected backscatter data for the duration of the survey, and interestingly we noticed increased prey on the echosounder at the same time as we observed the humpbacks. Already we are detecting connections between the environment and cetaceans!           

Figure 8. Fin whale spotted while on our first HALO survey. Photo: Leigh Torres, NOAA/NMFS permit # 21678

After nearly twelve hours conducting field work, the shoreline was close in sight, and we stopped our survey effort. For the first time all day, we all collectively sat in the vessel’s laboratory, finally putting our feet up to rest. We pulled back into Newport harbor around 7:00 pm, with the first HALO cruise successfully in the books. And though we visually observed many cetaceans and collected prey data, we still couldn’t help wondering what the Rockhoppers were recording at the bottom of the ocean. The thought of getting back out there for more surveys and retrieving the sound data keeps our momentum in full swing. For the next 11 months (and hopefully longer!) we will conduct the same 24 hr. cruise. The future is exciting, and we can’t wait to report back on our future trips and research findings.

Figure 9. The HALO team walking along the dock to their cars in Newport, Oregon, heading home after cruise #1. Photo: Miranda Mayhall.

This project was funded by sales and renewals of the special Oregon whale license plate, which benefits MMI. We gratefully thank all the gray whale license plate holders, who made this research trip possible.

Scouting mission to Kodiak: Reconnaissance of potential gray whale research in Kodiak, Alaska.

Dr. KC Bierlich, Dr. Alejandro Fernández Ajó, and Dr. Leigh Torres, OSU Department of Fisheries, Wildlife, & Conservation Sciences, Geospatial Ecology of Marine Megafauna Lab

Eastern North Pacific (ENP) gray whales (Eschrichtius robustus) undertake one of the longest annual migrations of any mammal, traveling from their winter breeding grounds in the warm waters of Baja California, Mexico to their summer feeding grounds in the icy waters of the Bering and Chukchi Seas1,2. Yet, a distinct subgroup of this population, called the Pacific Coast Feeding Group (PCFG), instead shorten their migration farther south to spend the summer foraging along waters from northern California, USA to northern British Columbia, Canada1 (Figure 1). On these summer feeding grounds gray whales will forage almost continuously to increase their energy reserves to support migration and reproduction during the rest of the year.

The GEMM Lab has been studying the ecology and physiology of the PCFG gray whales in Oregon waters since 2015, combining traditional photo-ID and behavioral observation methods with fecal sample collection, drone flights, and prey assessment to integrate data on individual whale behavior, nutritional status, prey consumption, and hormone variation. These multidisciplinary methods have proven effective to obtain an improved understanding of PCFG gray whale body condition and hormone variation by demographic unit and over time3,4,5, as well as prey energetics and foraging ecology6.

Figure 1. Left: ENP Gray whale´s range from the breeding grounds in Baja California, Mexico to the northernmost feeding grounds in the Arctic. Right: Overview of Kodiak Island; the red square shows a zoom in image of the study area, including the shore – and boat-based data collection sites in yellow.

Since the PCFG remains a small proportion (~230 individuals) of the larger eastern ENP population (~20,000 individuals), the GEMM Lab and multiple collaborators are interested in extending the research design implemented by the GEMM Lab in Oregon to study gray whale ecology and physiology of whales feeding on the more northern foraging grounds. The goal would be to fill some of the many critical knowledge gaps including gray whale resilience and response to climate change, connectivity between foraging grounds, population dynamics of the PCFG and ENP, and physiological variation (body condition, hormones) as a function of habitat, prey, demography, and time of year.

Kodiak Island, Alaska is a middle distance between PCFG foraging grounds in Newport, Oregon and the traditional ENP foraging grounds in Chukchi and Beaufort Seas (Figure 1). Two studies documented high gray whale encounter rates in Ugak Bay in Kodiak Island, including during summer months when foraging behavior was observed7,8. Evidence from photo-ID matches in these studies indicated that some PCFG whales might also extends their feeding grounds further north to Kodiak Island7,8.

During August-September of this year, GEMM Lab postdocs KC Bierlich and Alejandro Fernández Ajó traveled to Kodiak Island to assess opportunities for researching gray whales in the area. The mission objectives included determining gray whale presence, assessing behavioral states and foraging areas, determining feasibility of drone operations and fecal sample collection, collecting photo ID images, assessing feasibility of boat and shore-based operations in Ugak Bay (Figure 1), and connecting with local scientists and stakeholders interested in collaborating.

We landed in Kodiak the evening of August 28 (Figure 2), with a beautiful sunset. The next morning, we met our captain, Alexus Kwachka, over breakfast to discuss a plan for going offshore to look for gray whales later in the week. Alexus is a local fisherman in Kodiak with over 30 years of experience fishing in Alaska and incredible knowledge on local wildlife and navigating the rough Alaskan seas. It was particularly interesting to hear his stories on the local changes he has noticed over the years, not just in weather and fishing, but also in the seals, birds, and whales.

Figure 2. Arriving to Kodiak after a long day of travel.

Next, we met with Sun’aq Tribe’s biologist Matthew Van Daele, who coordinates the marine mammal stranding network on Kodiak Island and has a deep knowledge of the locations to find whales. Matt showed us several great spots to scout for gray whales along the shore in the Pasagshak area (Figure 1), which overlooks Ugak Bay and is about 1 hour drive from Kodiak (Figure 3). Along the way, Matt discussed the high mortality rate of gray whales he has observed over the past two years and his concerns about some skinny whales in the area he recently observed during aerial surveys. Since 2019, an Unusual Mortality Event (UME) of gray whales along the whole North Pacific west coast (Mexico, USA, Canada) has impacted the ENP gray whales and while the exact cause(s) of these mortalities is largely unknown, evidence suggests reduced nutritional status may be a likely cause of death9. We learned from Matt that while gray whale strandings are decreasing compared to the previous two years, the numbers are still concerningly high. It was an absolute pleasure spending the day with Matt, as being born and raised in Kodiak he has such great knowledge of the area and the local wildlife. Together we saw Kodiak’s beautiful landscape with lots of different wildlife, which included some huge Kodiak brown bears a few hundred meters away from the road (Figure 4).

Figure 3. The views from Pasagshak Point that are good observation locations for gray whales. The gray arrows represent the view looking left (A) and right (C) from Pasagshak Point (B). A panorama of the view from left to right on the point is also shown (D). Photo: KC Bierlich.
Figure 4. Sighting of a Kodiak brown bear (Ursus arctos) off the roadside on our way to Pasagshak. The Kodiak brown bear is the largest recognized subspecies (or population) of the brown bear, and one of the largest bears alive today. Photo: Alejandro Fernández Ajó.

The next day, the weather was great, so we returned to the Pasagshak lookout points to spend the day looking for whales. We spotted several gray whales from the cliffs and shore. At Burton Beach, we spotted a gray whale very close to shore that first appeared to be traveling, but then changed direction and started moving closer inshore –less than 10 m from where we were standing on the beach! The whale then swam back and forth along the shore, providing an opportunity to collect photos of its right and left side to use for photo ID. KC flew the drone over the whale and recorded some amazing behavior of lateral swimming and great images for photogrammetry. Our excitement was sky high as within two days on the trip we had documented the presence of gray whales, recorded the best places to work from land, and even captured some interesting behavior, photo ID, and photogrammetry data from shore! (Figure 5).

Figure 5. Gray whale feeding off Burton Beach, Kodiak Island. This photo was taken from the shore, as the whale swam back and forth amazingly close to the shoreline. In this picture you can see the whale´s head from a ventral perspective. Photo: Alejandro Fernández Ajó / GEMM Lab. Photograph captured under NOAA/NMFS permit #21678.

The weather deteriorated over the next couple days, bringing foggy and rainy conditions. We used this time to process data and meet with some of the local researchers. When the weather conditions improved, we met back up with Alexus and boarded his fishing vessel, “No Point”, and headed off to Ugak Bay to look for gray whales. During transit we encountered a humpback whale mother-calf pair lunge feeding and breaching (Figure 6). As we approached Pasagshak we sighted a gray whale diving and benthic feeding in 60 m water depth, and then 2-3 other individual whales exhibiting the same behavior close by. We collected photo ID data, but high wind conditions hindered drone operations, so we continued surveying further into Ugak Bay and turned around following the coast towards Gull Point (Figure 7).

Figure 6. A breaching humpback whale on the way to Ugak Bay from Kodiak. Photo: Alejandro Fernández Ajó / GEMM Lab. Photograph captured under NOAA/NMFS permit #21678.
Figure 7. Track line (shown in blue) of boat-based operations. White circles represent the locations for sightings of gray whales.

During our survey effort we spotted a gray whale foraging on a shallow rocky, kelp reef (12 m depth) along the northwest point of Ugak Bay. This sighting was similar to behavior we often observe in Oregon, with whales feeding in near shore shallow, reef habitats. Conditions for flying the drone were still too windy, but we observed the whale defecate and collected a fecal sample! For us, fecal samples are like “biological gold”, as we can study hormones (which include assessments of their reproductive status, nutritional condition, sex determination, and stress levels), genetics, prey, and much more! We were so excited to collect this sample because it provides the chance to start looking at the physiological parameters of these Alaskan whales and compare findings to what we observe in samples collected from whales in Oregon (Figure 8).

Figure 8. A gray whale fecal sample right after being scooped from the water using nets attached long aluminum poles. Photo: KC Bierlich.

After a beautiful night anchored in a sheltered bay near Gull Point (Figure 9) we continued west to scan for whales. Back in Ugak Bay, we found six more gray whales diving and feeding in 50-60 m depth near the same location as the previous day off Pasagshak point. Weather conditions had finally improved, allowing us to fly the drone. We flew over four whales and collected video for behavior and photogrammetry analysis, which allows us to measure the body condition of the whales to assess how healthy it is (Figure 10).

Figure 9. “Home sweet home” for the night where our vessel “No point” anchored in a sheltered bay. Photo: Alejandro Fernández Ajó.
Figure 10. Drone image of two gray whales feeding near each other. Note the trailing sediment plume from the whale’s mouth and body indicating it was bottom feeding in a muddy benthic habitat. Photo: KC Bierlich. Photograph captured under NOAA/NMFS permit #21678.

Another highlight of our field work was the collection of a benthic prey sample using a Ponar grab sampler at this location in Pasagshak Bay where the whales were foraging. The bottom was muddy and rich with invertebrates; the sample literally looked like it was boiling from the amount of prey in it (Figure 11). From this sample, we will determine the invertebrate species and caloric content of these prey for comparison to the prey found in Oregon waters.

Figure 11. The Ponar bottom grab sample, full of invertebrate prey, taken near whales feeding in ~50-60 m depth. Photo: CK Bierlich.

Overall, this scouting mission to Kodiak was a great success! Through boat surveys, shore-based observations, and the conversations with locals, we determined the best areas and timing to effectively work from boats and shore to expand our gray whale research to Kodiak. Moreover, our scouting mission resulted in the collection of relevant pilot data including fecal samples for hormonal analyses, drone images for body condition and behavioral assessments, prey samples, and photo-ID images. This scouting mission identified several knowledge gaps regarding gray whale ecology, physiology, and population connectivity that can be feasibly addressed through expansion of GEMM Lab research efforts to the Alaskan region. Importantly, the trip facilitated important networking with locals to establish potential collaborations for future work. We are optimistic and excited to grow our collaborative research in Kodiak.

This pilot project was funded by sales and renewals of the special Oregon whale license plate, which benefits MMI. We gratefully thank all the gray whale license plate holders, who made this scouting trip possible.

References:

1 Calambokidis J, Darling JD, Deecke V, Gearin P, Gosho M, Megill W, et al. Abundance, range and movements of a feeding aggregation of gray whales (Eschrichtius robustus) from California to south- eastern Alaska in 1998. J Cetacean Res Manag 2002; 4:267–76.

2Stewart JD, Weller DW. Abundance of eastern North Pacific gray whales 2019/2020. 2021. U.S. Department of Commerce, NOAA Technical Memorandum NMFS-SWFSC-639. https://doi.org/10. 25923/bmam-pemorandum NMFS-SWFSC-639. https://doi.org/10. 25923/bmam-pe91.

3Lemos, L. S. et al. Assessment of fecal steroid and thyroid hormone metabolites in eastern North Pacific gray whales. Conserv. Physiol. 8, (2020).

4Lemos, L. S. et al. Stressed and slim or relaxed and chubby? A simultaneous assessment of gray whale body condition and hormone variability. Mar. Mammal Sci. 1–11 (2021). doi:10.1111/mms.12877

5Soledade Lemos, L., Burnett, J. D., Chandler, T. E., Sumich, J. L. & Torres, L. G. Intra‐ and inter‐annual variation in gray whale body condition on a foraging ground. Ecosphere 11, (2020).

6Hildebrand, L., Bernard, K. S. & Torres, L. G. (2021). Do Gray Whales Count Calories? Comparing Energetic Values of Gray Whale Prey Across Two Different Feeding Grounds in the Eastern North Pacific. Frontiers in Marine Science, 8(July), 1–13. https://doi.org/10.3389/fmars.2021.683634

7Gosho Merrill, Patrick Gearin, Ryan Jenkinson, Jeff Laake, Lori Mazzuca, David Kubiak, John Calambokidis, Will Megill, Brian Gisborne, Dawn Goley, Christina Tombach, James Darling, V. D. gosho_et_al._2011_-_sc-m11-awmp2.pdf. (2011).

8Moore, S. E., Wynne, K. M., Kinney, J. C. & Grebmeier, J. M. GRAY WHALE OCCURRENCE AND FORAGE SOUTHEAST OF KODIAK, ISLAND, ALASKA. Mar. Mammal Sci. 23, 419–428 (2007).

9Christiansen F, Rodríguez-González F, Martínez-Aguilar S, Urbán J and others (2021) Poor body condition associated with an unusual mortality event in gray whales. Mar Ecol Prog Ser 658:237-252. https://doi.org/10.3354/meps13585


 [TL1]Add this link here:

https://mmi.oregonstate.edu/thank-you

Learning the right stuff – examining social transmission in humans, monkeys, and cetaceans

Clara Bird, PhD Student, OSU Department of Fisheries, Wildlife, and Conservation Sciences, Geospatial Ecology of Marine Megafauna Lab

The start of a new school year is always an exciting time. Like high school, it means seeing friends again and the anticipation of preparing to learn something new. Even now, as a grad student less focused on coursework, the start of the academic year involves setting project timelines and goals, most of which include learning. As I’ve been reflecting on these goals, one of my dad’s favorite sayings has been at the forefront of my mind. As an overachieving and perfectionist kid, I often got caught up in the pursuit of perfect grades, so the phrase “just learn the stuff” was my dad’s reminder to focus on what matters. Getting good grades didn’t matter if I wasn’t learning. While my younger self found the phrase rather frustrating, I have come to appreciate and find comfort in it. 

Given that my research is focused on behavioral ecology, I’ve also spent a lot of time thinking about how gray whales learn. Learning is important, but also costly. It involves an investment of energy (a physiological cost, Christie & Schrater, 2015; Jaumann et al., 2013), and an investment of time (an opportunity cost). Understanding the costs and benefits of learning can help inform conservation efforts because how an individual learns today affects the knowledge and tactics that the individual will use in the future. 

Like humans, individual animals can learn a variety of tactics in a variety of ways. In behavioral ecology we classify the different types of learning based on the teacher’s role (even though they may not be consciously teaching). For example, vertical transmission is a calf learning from its mom, and horizontal transmission is an individual learning from other conspecifics (individuals of the same species) (Sargeant & Mann, 2009). An individual must be careful when choosing who to learn from because not all strategies will be equally efficient. So, it stands to reason than an individual should choose to learn from a successful individual. Signals of success can include factors such as size and age. An individual’s parent is an example of success because they were able to reproduce (Barrett et al., 2017). Learning in a population can be studied by assessing which individuals are learning, who they are learning from, and which learned behaviors become the most common.

An example of such a study is Barrett et al. (2017) where researchers conducted an experiment on capuchin monkeys in Costa Rica. This study centered around the Panama ́fruit, which is extremely difficult to open and there are several documented capuchin foraging tactics for processing and consuming the fruit (Figure 1). For this study, the researchers worked with a group of monkeys who lived in a habitat where the fruit was not found, but the group included several older members who had learned Panamá fruit foraging tactics prior to joining this group. During a 75-day experiment, the researchers placed fruits near the group (while they weren’t looking) and then recorded the tactics used to process the fruit and who used each tactic. Their results showed that the most efficient tactic became the most common tactic over time, and that age-bias was a contributing factor, meaning that individuals were more like to copy older members of the group. 

Figure 1. Figure from Barrett et al. (2017) showing a capuchin monkey eating a Panamá fruit using the canine seam technique.

Social learning has also been documented in dolphin societies. A long-term study on wild bottlenose dolphins in Shark Bay, Australia assessed how habitat characteristics and the foraging behaviors used by moms and other conspecifics affected the foraging tactics used by calves (Sargeant & Mann, 2009). Interestingly, although various factors predicted what foraging tactic was used, the dominant factor was vertical transmission where the calf used the tactic learned from its mom (Figure 2). Overall, this study highlights the importance of considering a variety of factors because behavioral diversity and learning are context dependent.

Figure 2. Figure from Sargeant & Mann (2009) showing that the probability of a calf using a tactic was higher if the mother used that tactic.

Social learning is something that I am extremely interested in studying in our study population of gray whales in Oregon. While studies on social learning for such long-lived animals require a longer study period than of the span of our current dataset, I still find it important to consider the role learning may play. One day I would love to delve into the different factors of learning by these gray whales and answer questions such as those addressed in the studies I described above. Which foraging tactics are learned? How much of a factor is vertical transmission? Considering that gray whale calves spend the first few months of the foraging season with their mothers I would expect that there is at least some degree of vertical transmission present. Furthermore, how do environmental conditions affect learning? What tactics are learned in good vs. poor years of prey availability? Does it matter which tactic is learned first? While the chances that I’ll get to address these questions in the next few years are low, I do think that investigating how tactic diversity changes across age groups could be a good place to start. As I’ve discussed in a previous blog, my first dissertation chapter will focus on quantifying the degree of individual specialization present in my study group. After reading about age-biased learning, I am curious to see if older whales, as a group, use fewer tactics and if those tactics are the most energetically efficient.

The importance of understanding learning is related to that of studying individual specialization, which can allows us to estimate how behavioral tactics might change in popularity over time and space. We could then combine this with knowledge of how tactics are related to morphology and habitat and the associated energetic costs of each tactic. This knowledge would allow us to estimate the impacts of environmental change on individuals and the population. While my dissertation research only aims to provide a few puzzle pieces in this very large and complicated gray whale ecology puzzle, I am excited to see what I find. Writing this blog has both inspired new questions and served as a good reminder to be more patient with myself because I am still, “just learning the stuff”.