Dr. KC Bierlich, Postdoctoral Scholar, OSU Department of Fisheries, Wildlife, & Conservation Sciences, Geospatial Ecology of Marine Megafauna Lab
The SAPPHIRE Project is in full swing, as we spend our days aboard the R/V Star Keys searching for krill and blue whales (Figure 1) in the South Taranaki Bight (STB) region of Aotearoa New Zealand. We are investigating how changing ocean conditions impact krill availability and quality, and how this in turn impacts blue whale behavior, health, and reproduction. Understanding the link between changing environmental conditions on prey species and predators is key to understanding the larger implications of climate change on ocean food webs and each populations’ resiliency.
Figure 1. The SAPPHIRE team searching for blue whales. Top left) KC Bierlich, top right) Dawn Barlow, bottom left) Dawn Barlow, Kim Bernard (left to right), bottom right) KC Bierlich, Dawn Barlow, Leigh Torres, Mike Ogle (left to right).
One of the many components of the SAPPHIRE Project is to understand how foraging success of blue whales is influenced by environmental variation (see this recent blog written by Dr. Dawn Barlow introducing each component of the project). When you cannot go to a grocery store or restaurant any time you are hungry, you must rely on stored energy from previous feeds to fuel energy needs. Body condition reflects an individual’s stored energy in the body as a result of feeding and thus represents the foraging success of an individual, which can then affect its potential for reproductive output and the individual’s overall health (see this previous blog). As discussed in a previous blog, drones serve as a valuable tool for obtaining morphological measurements of whales to estimate their body condition. We are using drones to collect aerial imagery of pygmy blue whales to obtain body condition measurements late in the foraging season between years 2024 and 2026 of the SAPPHIRE Project (Figure 2). We are quantifying body condition as Body Area Index (BAI), which is a relative measure standardized by the total length of the whale and well suited for comparing individuals and populations (Figure 3).
The GEMM Lab recently published an article led by Dr. Dawn Barlow where we investigated the differences in BAI between three blue whale populations: Eastern North Pacific blue whales feeding in Monterey Bay, California; Chilean blue whales feeding in the Corcovado Gulf; and New Zealand Pygmy blue whales feeding in the STB (Barlow et al., 2023). These three populations are interesting to compare since blue whales that feed in Monterey Bay and Corcovado Gulf migrate to and from these seasonally productive feeding grounds, while the Pygmy blue whales stay in Aotearoa New Zealand year-round. Interestingly, the Pygmy blue whales had higher BAI (were fatter) compared to the other two regions despite relatively lower productivity in their foraging grounds. This difference in body condition may be due to different life history strategies where the non-migratory Pygmy blue whales may be able to feed as opportunities arrive, while the migratory strategies of the Eastern North Pacific and Chilean blue whales require good timing to access high abundant prey. Another interesting and unexpected result from our blue whale comparison was that Pygmy blue whales are not so “pygmy”; they are actually the same size as Eastern North Pacific and Chilean blue whales, with an average size around 22 m. Our findings from this blue whale comparison leads us to more questions about how environmental conditions that vary from year to year influence body condition and reproduction of these “not so pygmy” blue whales.
Figure 2. An aerial image of a Pygmy blue whale in the South Taranaki Bight region of Aotearoa New Zealand collected during the SAPPHIRE 2024 field season using a DJI Inspire 2 drone.
Figure 3. A drone image of a Pygmy blue whale and the length and body width measurements used to estimate Body Area Index (BAI), represented by the shaded blue region. Width measurements will also be used to help identify pregnant individuals.
The GEMM Lab has been studying this population of Pygmy blue whales in the STB since 2013 and found that years designated as a marine heatwave resulted with a reduction in blue whale feeding activity. Interestingly, breeding activity is also reduced during marine heatwaves in the following season when compared to the breeding season following a more productive, typical foraging season. These findings indicate that fluctuations in the environment, such as marine heatwaves, may affect not only foraging success, but also reproduction in Pygmy blue whales.
To help us better understand reproductive patterns across years, we will use body width measurements from drone images paired with hormone concentrations collected from fecal and biopsy samples to identify pregnant individuals. Progesterone is a hormone secreted in the ovaries of mammals during the estrous cycle and gestation, making it the predominant hormone responsible for sustaining pregnancy. Recently, the GEMM Lab’s Dr. Alejandro Fernandez-Ajo wrote a blog discussing his publication identifying pregnant individual gray whales using drone-based body width measurements and progesterone concentrations from fecal samples (Fernandez et al., 2023). While individuals that were pregnant had higher levels of progesterone compared to when they were not pregnant, the body width at 50% of the body length served as a more reliable method for detecting pregnancy in gray whales. We will use similar methods to help identify pregnancy in Pygmy blue whales for the SAPPHIRE Project where will we examine body width measurement paired with progesterone concentrations collected from fecal and biopsy samples to identify pregnant individuals. We hope our work will help to better understand how climate change will influence Pygmy blue whale body condition and reproduction, and thus the overall health and resiliency of the population. Stay tuned!
References
Barlow, D. R., Bierlich, K. C., Oestreich, W. K., Chiang, G., Durban, J. W., Goldbogen, J. A., Johnston, D. W., Leslie, M. S., Moore, M. J., Ryan, J. P., & Torres, L. G. (2023). Shaped by Their Environment: Variation in Blue Whale Morphology across Three Productive Coastal Ecosystems. Integrative Organismal Biology, 5(1). https://doi.org/10.1093/iob/obad039
Fernandez Ajó, A., Pirotta, E., Bierlich, K. C., Hildebrand, L., Bird, C. N., Hunt, K. E., Buck, C. L., New, L., Dillon, D., & Torres, L. G. (2023). Assessment of a non-invasive approach to pregnancy diagnosis in gray whales through drone-based photogrammetry and faecal hormone analysis. Royal Society Open Science, 10(7), 230452. https://doi.org/10.1098/rsos.230452
Dr. KC Bierlich, Postdoctoral Scholar, OSU Department of Fisheries, Wildlife, & Conservation Sciences, Geospatial Ecology of Marine Megafauna (GEMM) Lab
A recent blog post by GEMM Lab’s PhD Candidate Clara Bird gave a recap of our 8th consecutive GRANITEfield season this year. In her blog, Clara highlighted that we saw 71 individual gray whales this season, 61 of which we have seen in previous years and identified as belonging to the Pacific Coast Feeding Group (PCFG). With an estimated population size of around 212 individuals, this means that we saw almost 1/3 of the PCFG population this season alone. Since the GEMM Lab first started collecting data on PCFG gray whales in 2016, we have collected drone imagery on over 120 individuals, which is over half the PCFG population. This dataset provides incredible opportunity to get to know these individuals and observe them from year to year as they grow and mature through different life history stages, such as producing a calf. A question our research team has been interested in is what makes a PCFG whale different from an Eastern North Pacific (ENP) gray whale, which has a population size around 16,000 individuals and feed predominantly in the Arctic during the summer months? For this blog, I will highlight findings from our recent publication in Biology Letters (Bierlich et al., 2023) comparing the morphology (body length, skull, and fluke size) between PCFG and ENP populations.
Body size and shape reflect how an animal functions in their environment and can provide details on an individual’s current health, reproductive status, and energetic requirements. Understanding how animals grow is a key component for monitoring the health of populations and their vulnerability to climate change and other stressors in their environment. As such, collecting accurate morphological measurements of individuals is essential to model growth and infer their health. Collecting such morphological measurements of whales is challenging, as you cannot ask a whale to hold still while you prepare the tape measure, but as discussed in a previous blog, drones provide a non-invasive method to collect body size measurements of whales. Photogrammetry is a non-invasive technique used to obtain morphological measurements of animals from photographs. The GEMM Lab uses drone-based photogrammetry to obtain morphological measurements of PCFG gray whales, such as their body length, skull length (as snout-to-blowhole), and fluke span (see Figure 1).
Figure 1. Morphological measurements obtained via photogrammetry of a Pacific Coast Feeding Group (PCFG) gray whale. These measurements were used to compare to individuals from the Eastern North Pacific (ENP) population.
As mentioned in this previous blog, we use photo-identification to identify unique individual gray whales based on markings on their body. This method is helpful for linking all the data we are collecting (morphology, hormones, behavior, new scarring and skin conditions, etc.) to each individual whale. An individual’s sightings history can also be used to estimate their age, either as a ‘minimum age’ based on the date of first sighting or a ‘known age’ if the individual was seen as a calf. By combining the length measurements from drone-based photogrammetry and age estimates from photo-identification history, we can construct length-at-age growth models to examine how PCFG gray whales grow. While no study has previously examined length-at-age growth models specifically for PCFG gray whales, another study constructed growth curves for ENP gray whales using body length and age estimates obtained from whaling, strandings, and aerial photogrammetry (Agbayani et al., 2020). For our study, we utilized these datasets and compared length-at-age growth, snout-to-blowhole length, and fluke span between PCFG and ENP whales. We used Bayesian statistics to account and incorporate the various levels of uncertainty associated with data collected (i.e., measurements from whaling vs. drone, ‘minimum age’ vs. ‘known age’).
We found that while both populations grow at similar rates, PCFG gray whales reach smaller adult lengths than ENP. This difference was more extreme for females, where PCFG females were ~1 m (~3 ft) shorter than ENP females and PCFG males were ~0.5 m (1.5 ft) shorter than ENP males (Figure 2, Figure 3). We also found that ENP males and females have slightly larger skulls and flukes than PCFG male and females, respectively. Our results suggest PCFG whales are shaped differently than ENP whales (Figure 3)! These results are also interesting in light of our previous published study that found PCFG whales are skinnier than ENP whales (see this previous blog post).
Figure 2. Growth curves (von Bertalanffy–Putter) for length-at-age comparing male and female ENP and PCFG gray whales (shading represents 95% highest posterior density intervals). Points represent mean length and median age. Vertical bars represent photogrammetric uncertainty. Dashed horizontal lines represent uncertainty in age estimates.
Figure 3. Schematic highlighting the differences in body size between Pacific Coast Feeding Group (PCFG) and Eastern North Pacific (ENP) gray whales.
Our results raise some interesting questions regarding why PCFG are smaller: Is this difference in size and shape normal for this population and are they healthy? Or is this difference a sign that they are stressed, unhealthy and/or not getting enough to eat? Larger individuals are typically found at higher latitudes (this pattern is called Bergmann’s Rule), which could explain why ENP whales are larger since they feed in the Arctic. Yet many species, including fish, birds, reptiles, and mammals, have experienced reductions in body size due to changes in habitat and anthropogenic stressors (Gardner et al., 2011). The PCFG range is within closer proximity to major population centers compared to the ENP foraging grounds in the Arctic, which could plausibly cause increased stress levels, leading to decreased growth.
The smaller morphology of PCFG may also be related to the different foraging tactics they employ on different prey and habitat types than ENP whales. Animal morphology is linked to behavior and habitat (see this blogpost). ENP whales feeding in the Arctic generally forage on benthic amphipods, while PCFG whales switch between benthic, epibenthic and planktonic prey, but mostly target epibenthic mysids. Within the PCFG range, gray whales often forage in rocky kelp beds close to shore in shallow water depths (approx. 10 m) that are on average four times shallower than whales feeding in the Arctic. The prey in the PCFG range is also found to be of equal or higher caloric value than prey in the Arctic range (see this blog), which is interesting since PCFG were found to be skinnier.
It is also unclear when the PCFG formed? ENP and PCFG whales are genetically similar, but photo-identification history reveals that calves born into the PCFG usually return to forage in this PCFG range, suggesting matrilineal site fidelity that contributes to the population structure. PCFG whales were first documented off our Oregon Coast in the 1970s (Figure 4). Though, from examining old whaling records, there may have been PCFG gray whales foraging off the coasts of Northern California to British Columbia since the 1920s.
Figure 4. First reports of summer-resident gray whales along the Oregon coast, likely part of the Pacific Coast Feeding Group. Capital Journal, August 9, 1976, pg. 2.
Altogether, our finding led us to two hypotheses: 1) the PCFG range provides an ecological opportunity for smaller whales to feed on a different prey type in a shallow environment, or 2) the PCFG range is an ecological trap, where individuals gain less energy due to energetically costly feeding behaviors in complex habitat while potentially targeting lower density prey, causing them to be skinnier and have decreased growth. Key questions remain for our research team regarding potential consequences of the smaller sized PCFG whales, such as does the smaller body size equate to reduced resilience to environmental and anthropogenic stressors? Does smaller size effect fecundity and population fitness? Stay tuned as we learn more about this unique and fascinating smaller sized gray whale.
References
Agbayani, S., Fortune, S. M. E., & Trites, A. W. (2020). Growth and development of North Pacific gray whales (Eschrichtius robustus). Journal of Mammalogy, 101(3), 742–754. https://doi.org/10.1093/jmammal/gyaa028
Bierlich, K. C., Kane, A., Hildebrand, L., Bird, C. N., Fernandez Ajo, A., Stewart, J. D., Hewitt, J., Hildebrand, I., Sumich, J., & Torres, L. G. (2023). Downsized: gray whales using an alternative foraging ground have smaller morphology. Biology Letters, 19(8). https://doi.org/10.1098/rsbl.2023.0043
Gardner, J. L., Peters, A., Kearney, M. R., Joseph, L., & Heinsohn, R. (2011). Declining body size: A third universal response to warming? Trends in Ecology and Evolution, 26(6), 285–291. https://doi.org/10.1016/j.tree.2011.03.005
Dr. KC Bierlich, Postdoctoral Scholar, OSU Department of Fisheries, Wildlife, & Conservation Sciences, Geospatial Ecology of Marine Megafauna (GEMM) Lab
The recent advancement in drones (or unoccupied aircraft systems, UAS) has greatly enhanced opportunities for scientists across a broad range of disciplines to collect high-resolution aerial imagery. Wildlife researchers in particular have utilized this technology to study large elusive animals, such as whales, to observe their behavior (see Clara Bird’s blog) and obtain morphological measurements via photogrammetry (see previous blog for a brief history on photogrammetry and drones). However, obtaining useful measurement data is not as easy as flying the drone and pressing record. For this blog, I will provide a brief overview on the basics of using photogrammetry to extract morphological measurements from images collected with drones, as well as the associated uncertainty from using different drone platforms.
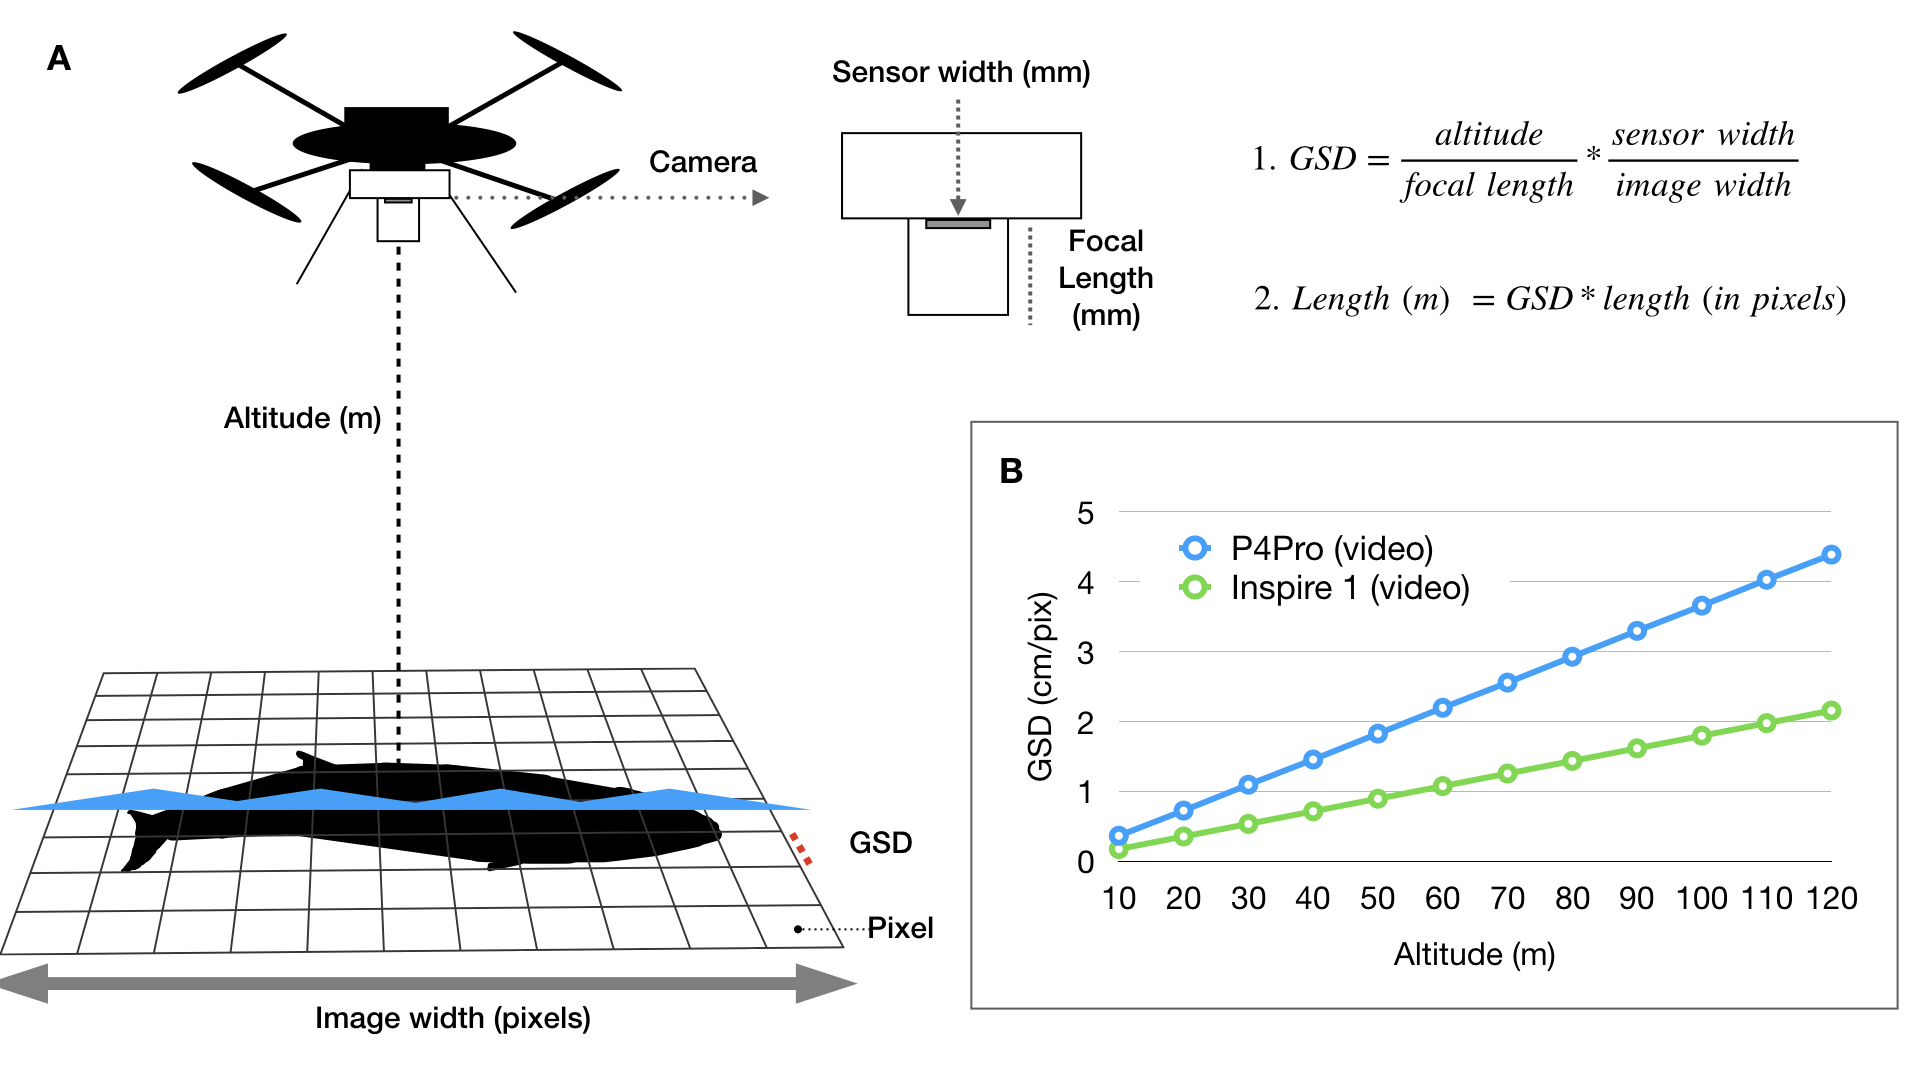
During my PhD at Duke University, I co-developed an open-source photogrammetry software called MorphoMetriX to measure whales in images I collected using drones (Fig. 1) (Torres and Bierlich, 2020) (see this blog for some fieldwork memoirs!). The software is designed to be flexible, simple to use, and customizable without knowledge of scripting languages. Using MorphoMetriX, measurements are made in pixels and then multiplied by the ground sampling distance (GSD) to convert to standard units (e.g., meters) (Fig. 2A). GSD represents the distance on the ground each pixel represents (i.e., the linear size of the pixel) and therefore sets the scale of the image (i.e., cm per pixel). Figure 2A describes how GSD is dependent on the camera sensor, focal length lens, and altitude. Thus, drones equipped with different cameras and focal length lenses will have inherent differences in GSD as altitude increases (Fig. 2B). A larger GSD increases the length each pixel represents in a photo and results in a lower resolution image, potentially obscuring important features in the photo and introducing measurement error.
Figure 1. An example of a Pacific Coast Feeding Group gray whale measured in MorphoMetriX (Torres & Bierlich, 2020).Figure 2: Overview of photogrammetry methods and calculating ground sampling distance (GSD). A) Photogrammetry methods for how each image is scaled to convert measurements in pixels to standard units (e.g., meters). Altitude is the distance between the camera lens and whale (usually at the surface of the water). Figure from Torres and Bierlich (2020). B) The exact (not accounting for distortion or altitude error) ground sampling distance (GSD) for two drone platforms commonly used to obtain morphological measurements of cetaceans. The difference in GSD between the P4Pro and Inspire 1 is due to the difference in sensor width and focal lengths of the cameras used. Figure from Bierlich et al. (2021).
Obtaining accurate altitude information is a key component in obtaining accurate measurements. All drones are equipped with a barometer, which measures altitude from changes in pressure. In general, barometers usually yield low accuracy in the altitude recorded, particularly for low-cost sensors commonly found on small, off-the-shelf drones (Wei et al., 2016). Dawson et al. (2017) added a laser altimeter (i.e., LightWare SF11/C, https://www.mouser.com//datasheet//2//321//28054-SF11-Laser-Altimeter-Manual-Rev8-1371857.pdf) to a drone, which yields higher accuracy in the altitude recorded. Since then, several studies have adopted use of a laser altimeter to study different species of baleen whales (i.e., Gough et al., 2019; Christiansen et al., 2018).
The first chapter of my dissertation, which was published last year in Marine Ecology Progress Series, compared the accuracy of several drones equipped with different camera sensors, focal length lenses, and a barometer vs. laser altimeter (Bierlich et al., 2021). We flew each drone over a known sized object floating at the surface and collected images at various altitudes (between 10 – 120 m). We used the known size of the floating object to determine the percent error of each measurement at each altitude. We found that 1) there is a lot of variation in measurement error across the different drones when using a barometer to measure altitude and 2) using a laser altimeter dramatically reduces measurement error for each drone (Fig. 3).
Figure 3. The % error for measurements from different drones. Black dashed line represents 0% error (true length = 1.48 m). The gray dashed lines represent under- and over-estimation of the true length by 5% (1.41 and 1.55 m, respectively).
These findings are important because if a study is analyzing measurements that are from more than one drone, the uncertainty associated with those measurements must be taken into account to know if measurements are reliable and comparable. For instance, let’s say we are comparing the body length of two different populations and found that population A is significantly longer than population B. From looking at Figure 3, that significant difference in length between population A and B could be unreliable as the difference may be due to the bias introduced by the type of drone, camera sensor, focal length lens, and whether a barometer or laser altimeter was used for recording altitude. In other words, without incorporating uncertainty associated with each measurement, how do you trust your measurement?
Hence, the National Institute of Standards and Technology (NIST) states that a measurement is complete only when accompanied by a quantitative statement of its uncertainty (Taylor & Kuyatt, 1994). In our Bierlich et al. (2021) study, we develop a Bayesian statistical model where we use the measurements of the known-sized object floating at the surface (what was used for Fig. 3) as training data to predict the lengths of unknown-sized whales. This Bayesian approach views data and the underlying parameters that generated the data (such as the mean or standard deviation) as random, and thus can be described by a statistical distribution. Using Bayes’ Theorem, a model of the observed data (called the likelihood function), is combined with prior knowledge pertaining to the underlying parameters (called the prior probability distribution) to form the posterior probability distribution, which serves as updated knowledge about the underlying parameter. For example, if someone told me they saw a 75 ft blue whale, I would not be phased. But if someone told me they saw a 150 ft blue whale, I would be skeptical – I’m using prior knowledge to determine the probability of this statement being true.
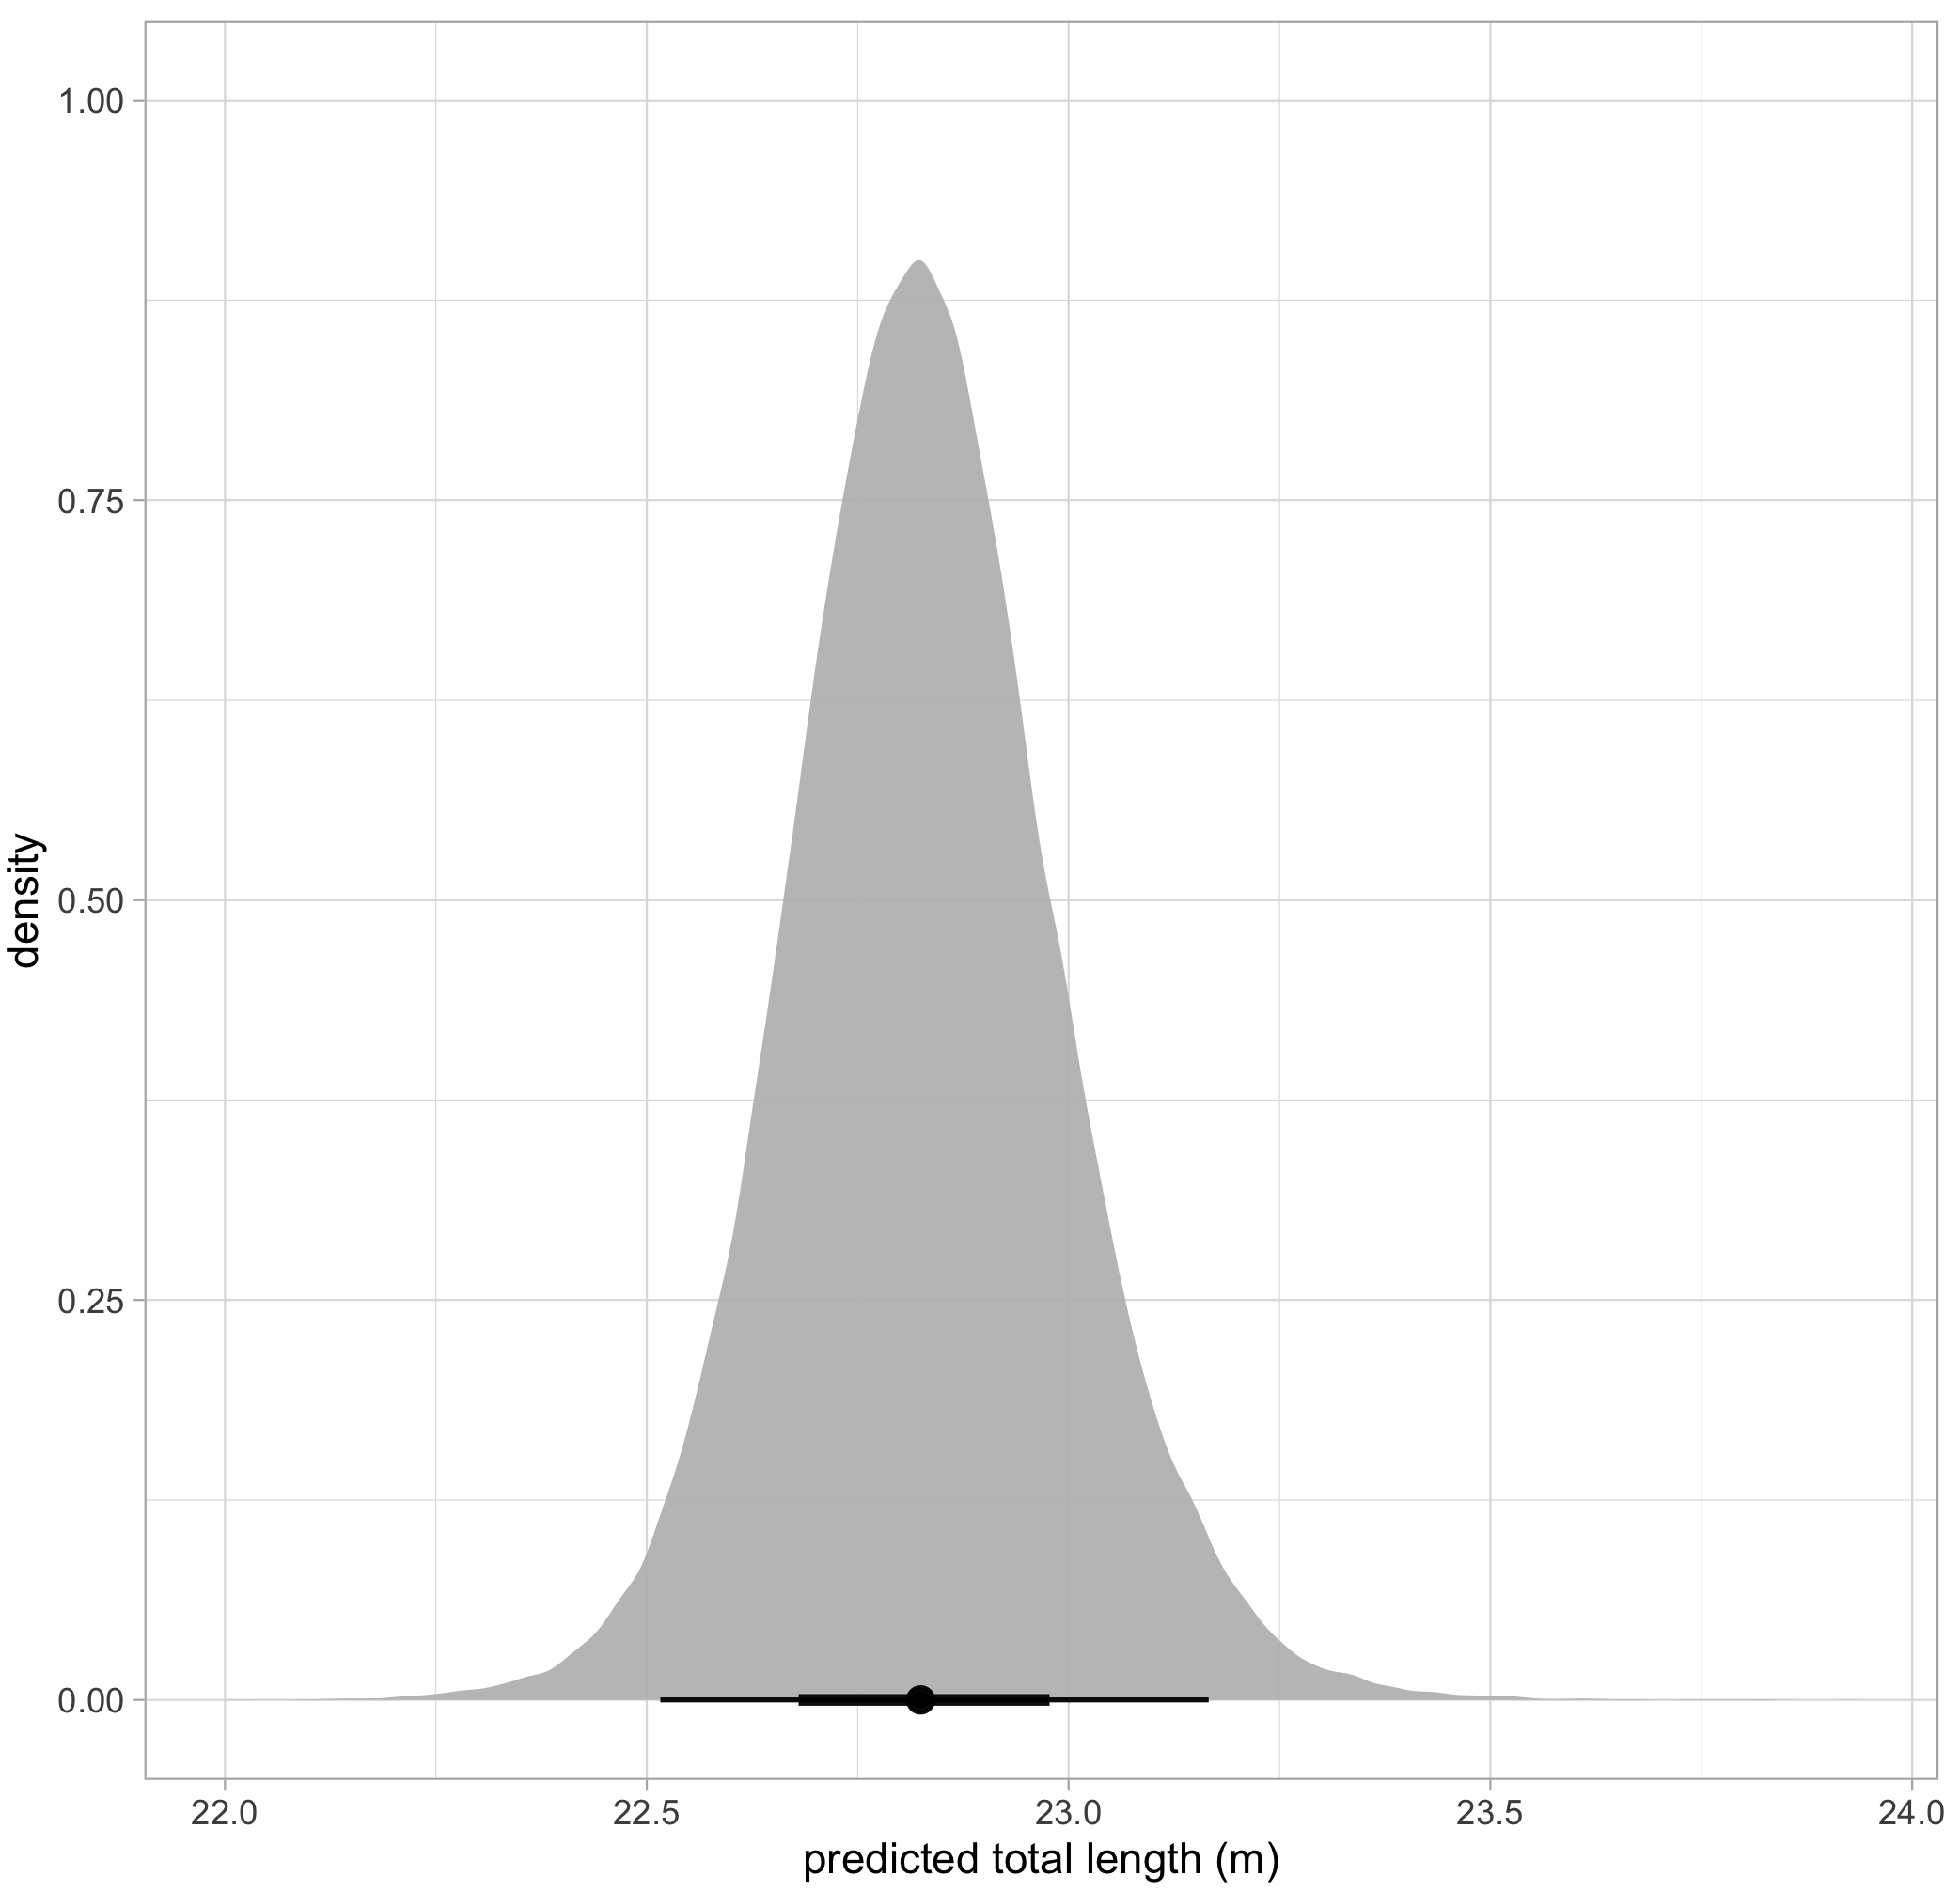
The posterior probability distribution produced by this Bayesian approach can also serve as new prior information for subsequent analyses. Following this framework, we used the known-sized objects to first estimate the posterior probability distribution for error for each drone. We then used that posterior probability distribution for error specific to each drone platform as prior information to form a posterior predictive distribution for length of unknown-sized whales. The length of an individual whale can then be described by the mean of this second posterior predictive distribution, and its uncertainty defined as the variance or an interval around the mean (Fig. 4).
Figure 4. An example of a posterior predictive distribution for total length of an individual blue whale. The black bars represent the uncertainty around the mean value (the black dot) – the longer black bars represent the 95% highest posterior density (HPD) interval, and the shorter black bars represent the 65% HPD interval.
For over half a decade, the GEMM Lab has been collecting drone images of Pacific Coast Feeding Group (PCFG) of gray whales off the coast of Oregon to measure their morphology and body condition (see GRANITE Project Blog). We have been using several different types of drones equipped with different cameras, focal length lenses, barometers, and laser altimeters. These measurements from different drones will inherently have different levels of error associated with them, so adapting these methods for incorporating uncertainty will be key to ensure our measurements are comparable and analyses are robust. To do this, we fly over a known-sized board (1 m) at the start of each flight to use as training data to generate a posterior predictive distribution for length of the an unknown-sized PCFG gray whale that we fly over (Fig. 5). Likewise, we are working closely with several other collaborators who are also using different drones. Incorporating measurement uncertainty from drones used across research labs and in different environments will help ensure robust analyses and provide great opportunity for some interesting comparisons – such as differences in gray whale body condition on their feeding grounds in Oregon vs. their breeding grounds in Baja, Mexico, and morphological comparisons with other baleen whale species, such as blue and humpback whales. We are currently wrapping up measurement from thousands of boards (Fig. 5) and whales (Fig. 1) from 2016 – 2021, so stay tuned for the results!
Figure 5. An example of a known-sized object (1 m long board) used as training data to assess measurement uncertainty.
References
Bierlich, K.C., Schick, R.S., Hewitt, J., Dale, J., Goldbogen, J.A., Friedlaender, A.S., Johnston D.J. (2021). A Bayesian approach for predicting photogrammetric uncertainty in morphometric measurements derived from UAS. Marine Ecology Progress Series. DOI: https://doi.org/10.3354/meps13814
Christiansen F, Vivier F, Charlton C, Ward R, Amerson A, Burnell S, Bejder L (2018) Maternal body size and condition determine calf growth rates in southern right whales. Mar Ecol Prog Ser 592: 267−281
Dawson SM, Bowman MH, Leunissen E, Sirguey P (2017) Inexpensive aerial photogrammetry for studies of whales and large marine animals. Front Mar Sci 4: 366
Gough, W.T., Segre, P.S., Bierlich, K.C., Cade, D.E., Potvin, J., Fish, F. E., Dale, J., di Clemente, J., Friedlaender, A.S., Johnston, D.W., Kahane-Rapport, S.R., Kennedy, J., Long, J.H., Oudejans, M., Penry, G., Savoca, M.S., Simon, M., Videsen, S.K.A., Visser, F., Wiley, D.N., Goldbogen, J.A. (2019). Scaling of swimming performance in baleen whales. Journal of Experimental Biology, 222(20).https://doi.org/10.1242/jeb.204172
Taylor, B. N., and Kuyatt, C. E. (1994). Guidelines for Evaluating and Expressing the Uncertainty of NIST Measurement Results. Washington, DC: National Institute of Standards and Technology. 1–25.
Torres, W.I., & Bierlich, K.C. (2020). MorphoMetriX: a photogrammetric measurement GUI for morphometric analysis of megafauna. Journal of Open Source Software, 5(45), 1825. https://doi.org/10.21105/joss.01825
Wei S, Dan G, Chen H (2016) Altitude data fusion utilizing differential measurement and complementary filter. IET Sci Meas Technol (Singap) 10: 874−879
With the GRANITE field season officially over, we are now processing all of the data we collected this summer. For me, I am starting to go through all the drone videos to take snapshots of each whale to measure their body condition. As I go through these videos, I am reflecting on the different experiences I am fortunate enough to have with flying different drones, in different environments, over different species of baleen whales: blue, humpback, Antarctic minke, and now gray whales. Each of these species have a different morphological design and body shape (Woodward et al., 2006), which leads to different behaviors that are noticeable from the drone. Drones create immense opportunity to learn how whales thrive in their natural environments [see previous blog for a quick history], and below are some of my memories from above.
I first learned how drones could be used to study the morphology and behavior of large marine mammals during my master’s degree at Duke University, and was inspired by the early works of John Durban (Durban et al., 2015, 2016) Fredrick Christiansen (Christiansen et al., 2016) and Leigh Torres (Torres et al., 2018). I immediately recognized the value and utility of this technology as a new tool to better monitor the health of marine mammals. This revelation led me to pursue a PhD with the Duke University Marine Robotics and Remote Sensing (MaRRS) Lab led by Dr. Dave Johnston where I helped further develop tools and methods for collecting drone-based imagery on a range of species in different habitats.
When flying drones over whales, there are a lot of moving parts; you’re on a boat that is moving, flying something that is moving, following something that is moving. These moving elements are a lot to think about, so I trained hard, so I did not have to think about each step and flying felt intuitive and natural. I did not grow up playing video games, so reaching this level of comfort with the controls took a lot of practice. I practiced for hours over the course of months before my first field excursion and received some excellent mentorship and training from Julian Dale, the lead engineer in the MaRRS Lab. Working with Julian and the many hours of training helped me establish a solid foundation in my piloting skills and feel confident working in various environments on different species.
Blue whales offshore of Monterey, California.
In 2017 and 2018 I was involved in collaborative project with the MaRRS Lab and Goldbogen Lab at Stanford University, where we tagged and flew drones over blue whales offshore of Monterey, California. We traveled about an hour offshore and reliably found groups of blue whales actively feeding. Working offshore typically brought a large swell, which can often make landing the drone back into your field partner’s hands tricky as everything is bobbing up and down with the oscillations of the swell. Fortunately, we worked from a larger research vessel (~56 ft) and quickly learned that landing the drone in the stern helped dampen the effects of bobbing up and down. The blue whales we encountered often dove to a depth of around 200 m for about 20-minute intervals, then come to the surface for only a few minutes. This short surface period provided only a brief window to locate the whale once it surfaced and quickly fly over it to collect the imagery needed before it repeated its dive cycle. We learned to be patient and get a sense of the animal’s dive cycle before launch in order to time our flights so the drone would be in the air a couple of minutes before the whale surfaced.
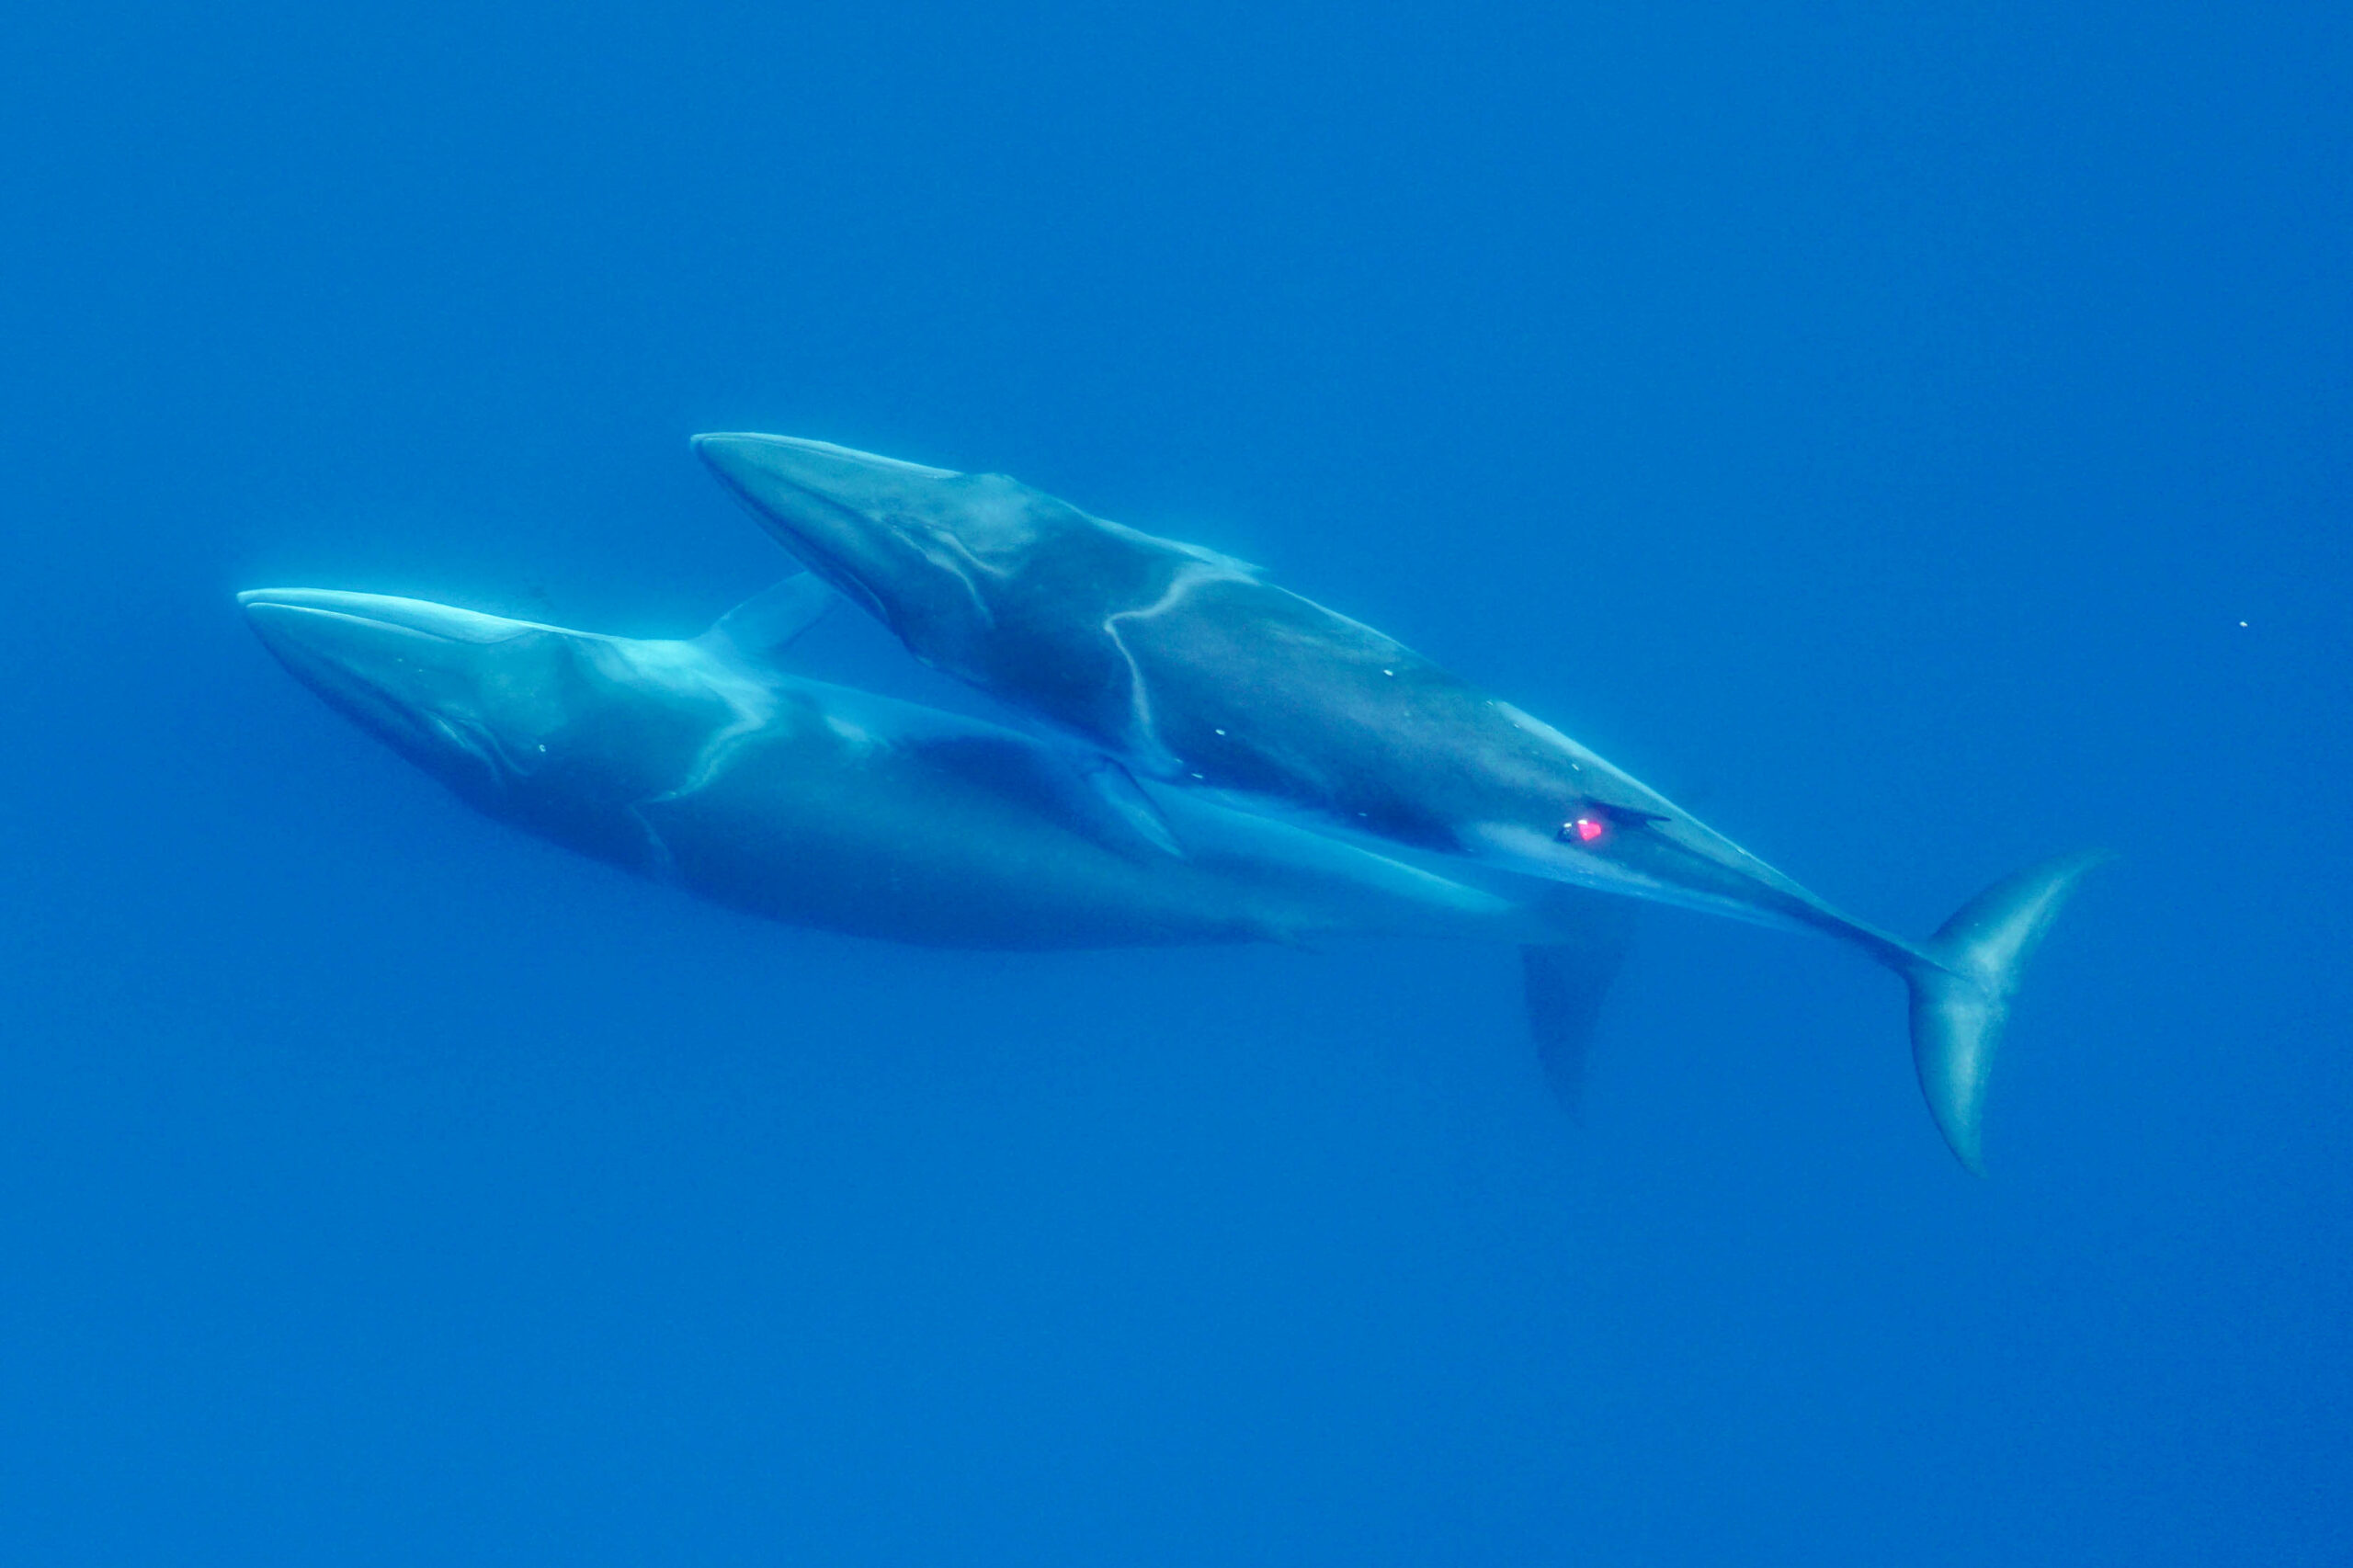
Once over the whales, the streamlined body of the blue whales was noticeable, with their small, high aspect ratio flippers and fluke that make them so well adapted for fast swimming in the open ocean (Fig. 1) (Woodward et al., 2006). I also noticed that because these whales are so large (often 21 – 24 m), I often flew at higher altitudes to be able fit them within the field of view of the camera. It was also always shocking to see how small the tagging boat (~8 m) looked when next to Earth’s largest creatures.
Figure 1. Two blue whales surface after a deep dive offshore of Monterey, Ca. (Image credit: Duke University Marine Robotics and Remote Sensing under NOAA permit 14809-03)
Antarctic minke whales and humpback whales along the Western Antarctic PeninsulaA lot of the data included in my dissertation came from work along the Western Antarctic Peninsula (WAP), which had a huge range of weather conditions, from warm and sunny days to cold and snowy/foggy/rainy/windy/icy days. A big focus was often trying to keep my hands warm, as it was often easier to fly without gloves in order to better feel the controls. One of the coldest days I remember was late in the season in mid-June (almost winter!) in Wilhemina Bay where ice completely covered the bay in just a couple hours, pushing the whales out into the Gerlache Strait; I suspect this was the last ice-free day of the season. Surprisingly though, the WAP also brought some of the best conditions I have ever flown in. Humpback and Antarctic minke whales are often found deep within the bays along the peninsula, which provided protection from the wind. So, there were times where it would be blowing 40 mph in the Gerlache Strait, but calm and still in the bays, such as Andvord Bay, which allowed for some incredible conditions for flying. Working from small zodiacs (~7 m) allowed us more maneuverability for navigating around or through the ice deep in the bays (Fig. 2)
Figure 2. Navigating through ice-flows along the Western Antarctic Peninsula. (Image credit: Duke University Marine Robotics and Remote Sensing under NOAA permit 14809-03 and ACA permits 2015-011 and 2020-016.)
Flying over Antarctic minke whale was always rewarding, as they are very sneaky and can quickly disappear under ice flows or in the deep, dark water. Flying over them often felt like a high-speed chase, as their small streamlined bodies makes them incredibly quick and maneuverable, doing barrel rolls, quick banked turns, and swimming under and around ice flows (Fig. 3). There would often be a group between 3-7 individuals and it felt like they were playing tag with each other – or perhaps with me!
Figure 3. Two Antarctic minke whales swimming together along the Western Antarctic Peninsula. (Image credit: Duke University Marine Robotics and Remote Sensing under NOAA permit 14809-03 and ACA permits 2015-011 and 2020-016.)
Humpbacks displayed a wide range of behaviors along the WAP. Early in the season they continuously fed throughout the entire day, often bubble net feeding in groups typically of 2-5 animals (Fig. 4). For as large as they are, it was truly amazing to see how they use their pectoral fins to perform quick accelerations and high-speed maneuvering for tight synchronized turns to form bubble nets, which corral and trap their krill, their main food source (Fig. 4) (Woodward et al., 2006). Later in the season, humpbacks switched to more resting behavior in the day and mostly fed at night, taking advantage of the diel vertical migration of krill. This behavior meant we often found humpbacks snoozing at the surface after a short dive, as if they were in a food coma. They also seemed to be more curious and playful with each other and with us later in the season (Fig. 5).
We also encountered a lot of mom and calf pairs along the WAP. Moms were noticeably skinny compared to their plump calf in the beginning of the season due to the high energetic cost of lactation (Fig. 6). It is important for moms to regain this lost energy throughout the feeding season and begin to wean their calves. I often saw moms refusing to give milk to their nudging calf and instead led teaching lessons for feeding on their own.
Figure 4. Two humpback whales bubble-net feeding early in the feeding season (December) along the Western Antarctic Peninsula. (Image credit: Duke University Marine Robotics and Remote Sensing under NOAA permit 14809-03 and ACA permits 2015-011 and 2020-016.)Figure 5. A curious humpback whale dives behind our Zodiac along the Western Antarctic Peninsula. (Image credit: Duke University Marine Robotics and Remote Sensing under NOAA permit 14809-03 and ACA permits 2015-011 and 2020-016.)Figure 6. A mom and her calf rest at the surface along the Western Antarctic Peninsula. Note how the mom looks skinnier compared to her plump calf, as lactation is the most energetically costly phase of the reproductive cycle. (Image credit: Duke University Marine Robotics and Remote Sensing under NOAA permit 14809-03 and ACA permits 2015-011 and 2020-016.)
Gray whales off Newport, Oregon
All of these past experiences helped me quickly get up to speed and jump into action with the GRANITE field team when I officially joined the GEMM Lab this year in June. I had never flown a DJI Inspire quadcopter before (the drone used by the GEMM Lab), but with my foundation piloting different drones, some excellent guidance from Todd and Clara, and several hours of practice to get comfortable with the new setup, I was flying over my first gray whale by day three of the job.
The Oregon coast brings all sorts of weather, and some days I strangely found myself wearing a similar number of layers as I did in Antarctica. Fog, wind, and swell could all change within the hour, so I learned to make the most of weather breaks when they came. I was most surprised by how noticeably different gray whales behave compared to the blue, Antarctic minke, and humpback whales I had grown familiar with watching from above. For one, it is absolutely incredible to see how these huge whales use their low-aspect ratio flippers and flukes (Woodward et al., 2006) to perform low-speed, highly dynamic maneuvers to swim in very shallow water (5-10 m) so close to shore (<1m sometimes!) and through kelp forest or surf zones close to the beach. They have amazing proprioception, or the body’s ability to sense its movement, action, and position, as gray whales often use their pectoral fins and fluke to stay in a head standing position (see Clara Bird’s blog) to feed in the bottom sediment layer, all while staying in the same position and resisting the surge of waves that could smash them against the rocks (Video 1) . It is also remarkable how the GEMM Lab knows each individual whale based on natural skin marks, and I started to get a better sense of each whale’s behavior, including where certain individuals typically like to feed, or what their dive cycle might be depending on their feeding behavior.
Video 1. Two Pacific Coast Feeding Group (PCFG) gray whales “head-standing” in shallow waters off the coast of Newport, Oregon. NOAA/NMFS permit #21678
I feel very fortunate to be a part of the GRANITE field team and to contribute to data collection efforts. I look forward to the data analysis phase to see what we learn about how the morphology and behavior of these gray whales to help them thrive in their environment.
References:
Christiansen, F., Dujon, A. M., Sprogis, K. R., Arnould, J. P. Y., and Bejder, L. (2016).Noninvasive unmanned aerial vehicle provides estimates of the energetic cost of reproduction in humpback whales. Ecosphere 7, e01468–18.
Durban, J. W., Fearnbach, H., Barrett-Lennard, L. G., Perryman, W. L., & Leroi, D. J. (2015). Photogrammetry of killer whales using a small hexacopter launched at sea. Journal of Unmanned Vehicle Systems, 3(3), 131-135.
Durban, J. W., Moore, M. J., Chiang, G., Hickmott, L. S., Bocconcelli, A., Howes, G., et al.(2016). Photogrammetry of blue whales with an unmanned hexacopter. Mar. Mammal Sci. 32, 1510–1515.
Torres, L. G., Nieukirk, S. L., Lemos, L., & Chandler, T. E. (2018). Drone up! Quantifying whale behavior from a new perspective improves observational capacity. Frontiers in Marine Science, 5, 319.
Woodward, B. L., Winn, J. P., and Fish, F. E. (2006). Morphological specializations of baleen whales associated with hydrodynamic performance and ecological niche. J. Morphol. 267, 1284–1294.
Dr. KC Bierlich, Postdoctoral Scholar, OSU Department of Fisheries, Wildlife, & Conservation Sciences, Geospatial Ecology of Marine Megafauna Lab
The morphology and body size of an animal is one of the most fundamental factors for understanding a species ecology. For instance, fish body size and fin shape can influence its habitat use, foraging behavior, prey type, physiological performance, and predator avoidance strategies (Fig 1). Morphology and body size can thus reflect details of an individual’s current health, likelihood of survival, and potential reproductive success, which directly influences a species life history patterns, such as reproductive status, growth rate, and energetic requirements. Collecting accurate morphological measurements of individuals is often essential for monitoring populations, and recent studies have demonstrated how animal morphology has profound implications for conservation and management decisions, especially for populations inhabiting anthropogenically-altered environments (Miles 2020) (Fig. 1). For example, in a study on the critically endangered European eel, De Meyer et al. (2020) found that different skulls sizes were associated with different ecomorphs (a local variety of a species whose appearance is determined by its ecological environment), which predicted different diet types and resulted with some ecomorphs having a greater exposure to pollutants and toxins than others. However, obtaining manual measurements of wild animal populations can be logistically challenging, limited by accessibility, cost, danger, and animal disturbance. These challenges are especially true for large elusive animals, such as whales that are often in remote locations, spend little time at the surface of the water, and their large size can preclude safe capture and live handling.
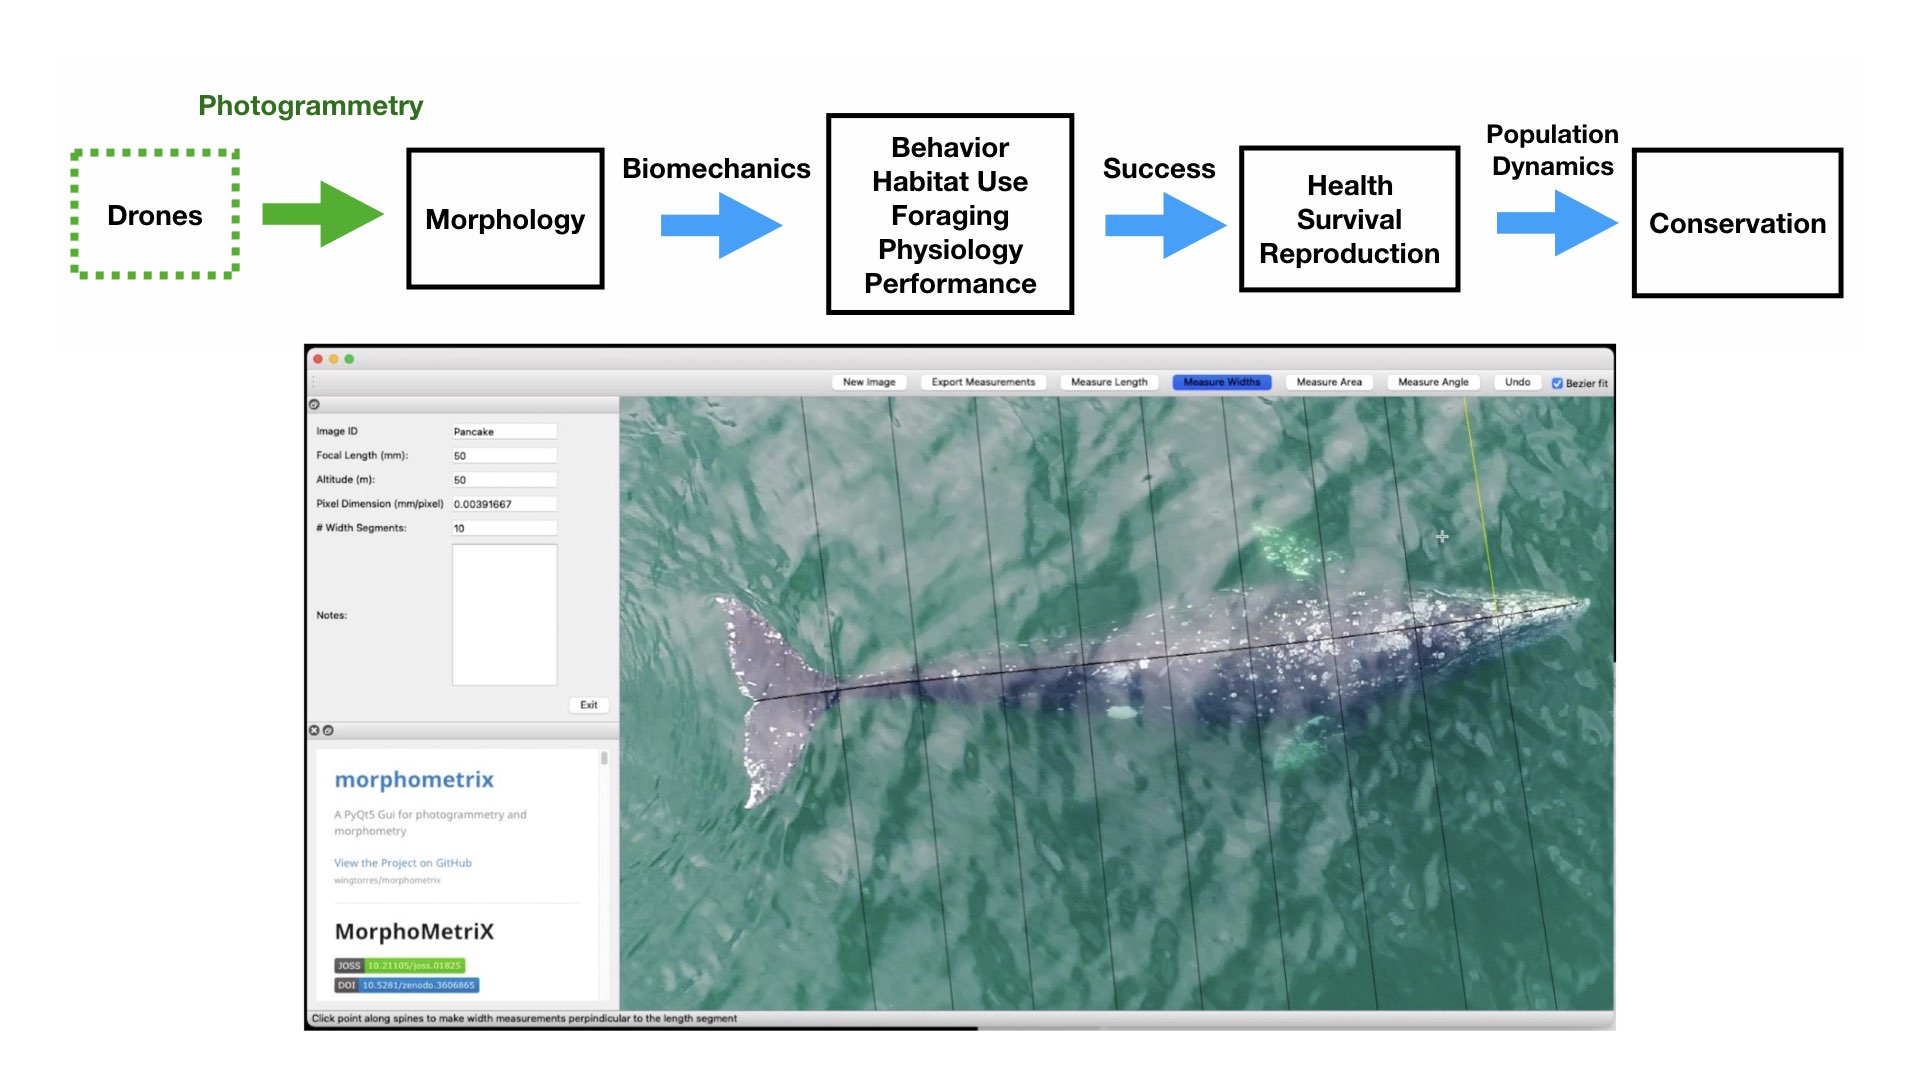
Figure 1. Top) A pathway framework depicting how the morphology of an animal influences its habitat use, behavior, foraging, physiology, and performance. These traits all affect how successful an animal is in its environment and can reflect an individual’s current health, likelihood of survival, and potential reproductive success. This individual success can then be scaled up to assess overall population health, which in turn can have direct implications for conservation. Bottom) an example of morphological differences in fish body size and fin shape from Walker et al. (2013). Fineness ratio (f) = length of body ÷ max body width.
Photogrammetry is a non-invasive method for obtaining accurate morphological measurements of animals from photographs. The two main types of photogrammetry methods used in wildlife biology are 1) single camera photogrammetry, where a known scale factor is applied to a single image to measure 2D distances and angles and 2) stereo-photogrammetry, where two or more images (from a single or multiple cameras) are used to recreate 3D models. These techniques have been used on domestic animals to measure body condition and estimate weight of dairy cows and lactating Mediterranean buffaloes (Negretti et al., 2008; Gaudioso et al., 2014) and on wild animals to measure sexual dimorphism in Western gorillas (Breuer et al., 2007), shoulder heights of elephants (Schrader et al., 2006), nutritional status of Japanese macaques (Kurita et al., 2012), and the body condition of brown bears (Shirane et al., 2020). Over 70 years ago, Leedy (1948) encouraged wildlife biologists to use aerial photogrammetry from aircraft for censusing wild animal populations and their habitats, where photographs can be collected at nadir (straight down) or an oblique angle, and the scale can be calculated by dividing the focal length of the camera by the altitude or by using a ratio of selected points in an image of a known size. Indeed, aerial photogrammetry has been wildly adopted by wildlife biologists and has proven useful in obtaining measurements in large vertebrates, such as elephants and whales.
Whitehead & Payne (1978) first demonstrated the utility of using aerial photogrammetry from airplanes and helicopters as a non-invasive technique for estimating the body length of southern right whales. Prior to this technique, measurements of whales were traditionally limited to assessing carcasses collected from scientific whaling operations, or opportunistically from commercial whaling, subsistence hunting, stranding events, and bycatch. Importantly, aerial photogrammetry provides a method to collect measurements of whales without killing them. This approach has been widely adopted to obtain body length measurements on a variety of whale and dolphin species, including bowhead whales (Cubbage & Calambokidis, 1987), southern right whales (Best & Rüther, 1992), fin whales (Ratnaswamy and Wynn, 1993), common dolphins (Perryman and Lynn, 1993), spinner dolphins (Perryman & Westlake 1998), and killer whales (Fearnbach et al. 2012). Aerial photogrammetry has also been used to measure body widths to estimate nutritive condition related to reproduction in gray whales (Perryman and Lynn, 2002) and northern and southern right whales (Miller et al., 2012). However, these studies collected photographs from airplanes and helicopters, which can be costly, limited by weather and infrastructure to support aircraft research efforts and, importantly, presents a potential risk to wildlife biologists (Sasse 2003).
The recent advancement and commercialization of unoccupied aircraft systems (UAS, or drones) has revolutionized the ability to obtain morphological measurements from high resolution aerial photogrammetry across a variety of ecosystems (Fig. 2). Drones ultimately bring five transformative qualities to conservation science compared to airplanes and helicopters: affordability, immediacy, quality, efficiency, and safety of data collection. Durban et al. (2015) first demonstrated the utility of using drones for non-invasively obtaining morphological measurements of killer whales in remote environments. Since then, drone-based morphological measurements have been applied to a wide range of studies that have increased our understanding on different whale populations. For example, Leslie et al. (2020) used drone-based measurements of the skull to distinguish a unique sub-species of blue whales off the coast of Chile. Groskreutz et al. (2019) demonstrated how long-term nutritional stress has limited body growth in northern resident killer whales, while Stewart et al. (2021) found a decrease in body length of North Atlantic Right whales since 1981 that was associated with entanglements from fishing gear and may be a contributing factor to the decrease in reproductive success for this endangered population.
Drone imagery is commonly used to estimate the body condition of baleen whales by measuring the body length and width of individuals. Recently, the GEMM Lab used body length and width measurements to quantify intra- and inter-seasonal changes in body condition across individual gray whales (Lemos et al., 2020). Drones have also been used to measure body condition loss in humpback whales during the breeding season (Christiansen et al., 2016) and to compare the healthy southern right whales to the skinnier, endangered North Atlantic right whales (Christiansen et al., 2020). Drone-based assessments of body condition have even been used to measure how calf growth rate is directly related to maternal loss during suckling (Christiansen et al., 2018), and even estimate body mass (Christiansen et al., 2019).
Drone-based morphological measurements can also be combined with whale-borne inertial sensing tag data to study the functional morphology across several different baleen whale species. Kahane-Rapport et al. (2020) used drone measurements of tagged whales to analyze the biomechanics of how larger whales require longer times for filtering the water through their baleen when feeding. Gough et al. (2019) used size measurements from drones and swimming speeds from tags to determine that a whale’s “walking speed” is 2 meters per second – whether the largest of the whales, a blue whale, or the smallest of the baleen whales, an Antarctic minke whale. Size measurements and tag data were combined by Segre et al. (2019) to quantify the energetic costs of different sized whales when breaching.
Taken together, drones have revolutionized our ability to obtain morphological measurements of whales, greatly increasing our capacity to better understand how these animals function and perform in their environments. These advancements in marine science are particularly important as these methods provide greater opportunity to monitor the health of populations, especially as they face increased threats from anthropogenic stressors (such as vessel traffic, ocean noise, pollution, fishing entanglement, etc.) and climate change.
Drone-based photogrammetry is one of the main focuses of the GEMM Lab’s project on Gray whale Response to Ambient Noise Informed by Technology and Ecology (GRANITE). This summer we have been collecting drone videos to measure the body condition of gray whales feeding off the coast of Newport, Oregon (Fig. 2). As we try to understand the physiological stress response of gray whales to noise and other potential stressors, we have to account for the impacts of overall nutritional state of each individual whale’s physiology, which we infer from these body condition estimates.
Figure 2. Drones can help collect images of whales to obtain morphological measurements using photogrammetry and help us fill knowledge gaps for how these animals interact in their environment and to assess their current health. Bottom photo is an image collected by the GEMM Lab of a gray whale being measured in MorphoMetriX software to estimate its body condition.
References
Best, P. B., & Rüther, H. (1992). Aerial photogrammetry of southern right whales, Eubalaena australis. Journal of Zoology, 228(4), 595-614.
Breuer, T., Robbins, M. M., & Boesch, C. (2007). Using photogrammetry and color scoring to assess sexual dimorphism in wild western gorillas (Gorilla gorilla). American Journal of Physical Anthropology, 134(3), 369–382. https://doi.org/10.1002/ajpa.20678
Christiansen, F., Vivier, F., Charlton, C., Ward, R., Amerson, A., Burnell, S., & Bejder, L. (2018). Maternal body size and condition determine calf growth rates in southern right whales. Marine Ecology Progress Series, 592, 267–281.
Christiansen, F. (2020). A population comparison of right whale body condition reveals poor state of North Atlantic right whale, 1–43.
Christiansen, F., Dujon, A. M., Sprogis, K. R., Arnould, J. P. Y., & Bejder, L. (2016). Noninvasive unmanned aerial vehicle provides estimates of the energetic cost of reproduction in humpback whales. Ecosphere, 7(10), e01468–18.
Christiansen, F., Sironi, M., Moore, M. J., Di Martino, M., Ricciardi, M., Warick, H. A., … Uhart, M. M. (2019). Estimating body mass of free-living whales using aerial photogrammetry and 3D volumetrics. Methods in Ecology and Evolution, 10(12), 2034–2044.
Cubbage, J. C., & Calambokidis, J. (1987). Size-class segregation of bowhead whales discerned through aerial stereo-photogrammetry. Marine Mammal Science, 3(2), 179–185.
De Meyer, J., Verhelst, P., & Adriaens, D. (2020). Saving the European Eel: How Morphological Research Can Help in Effective Conservation Management. Integrative and Comparative Biology, 23, 347–349.
Gaudioso, V., Sanz-Ablanedo, E., Lomillos, J. M., Alonso, M. E., Javares-Morillo, L., & Rodr\’\iguez, P. (2014). “Photozoometer”: A new photogrammetric system for obtaining morphometric measurements of elusive animals, 1–10.
Gough, W. T., Segre, P. S., Bierlich, K. C., Cade, D. E., Potvin, J., Fish, F. E., … Goldbogen, J. A. (2019). Scaling of swimming performance in baleen whales. Journal of Experimental Biology, 222(20), jeb204172–11.
Groskreutz, M. J., Durban, J. W., Fearnbach, H., Barrett-Lennard, L. G., Towers, J. R., & Ford, J. K. B. (2019). Decadal changes in adult size of salmon-eating killer whales in the eastern North Pacific. Endangered Species Research, 40, 1
Kahane-Rapport, S. R., Savoca, M. S., Cade, D. E., Segre, P. S., Bierlich, K. C., Calambokidis, J., … Goldbogen, J. A. (2020). Lunge filter feeding biomechanics constrain rorqual foraging ecology across scale. Journal of Experimental Biology, 223(20), jeb224196–8.
Leedy, D. L. (1948). Aerial Photographs, Their Interpretation and Suggested Uses in Wildlife Management. The Journal of Wildlife Management, 12(2), 191.
Lemos, L. S., Burnett, J. D., Chandler, T. E., Sumich, J. L., and Torres, L. G. (2020). Intra- and inter-annual variation in gray whale body condition on a foraging ground. Ecosphere 11.
Leslie, M. S., Perkins-Taylor, C. M., Durban, J. W., Moore, M. J., Miller, C. A., Chanarat, P., … Apprill, A. (2020). Body size data collected non-invasively from drone images indicate a morphologically distinct Chilean blue whale (Balaenoptera musculus) taxon. Endangered Species Research, 43, 291–304.
Miles, D. B. (2020). Can Morphology Predict the Conservation Status of Iguanian Lizards? Integrative and Comparative Biology.
Miller, C. A., Best, P. B., Perryman, W. L., Baumgartner, M. F., & Moore, M. J. (2012). Body shape changes associated with reproductive status, nutritive condition and growth in right whales Eubalaena glacialis and E. australis. Marine Ecology Progress Series, 459, 135–156.
Negretti, P., Bianconi, G., Bartocci, S., Terramoccia, S., & Verna, M. (2008). Determination of live weight and body condition score in lactating Mediterranean buffalo by Visual Image Analysis. Livestock Science, 113(1), 1–7. https://doi.org/10.1016/j.livsci.2007.05.018
Ratnaswamy, M. J., & Winn, H. E. (1993). Photogrammetric Estimates of Allometry and Calf Production in Fin Whales, \emph{Balaenoptera physalus}. American Society of Mammalogists, 74, 323–330.
Perryman, W. L., & Lynn, M. S. (1993). Idendification of geographic forms of common dolphin(\emph{Delphinus Delphis}) from aerial photogrammetry. Marine Mammal Science, 9(2), 119–137.
Perryman, W. L., & Lynn, M. S. (2002). Evaluation of nutritive condition and reproductive status of migrating gray whales (\emph{Eschrichtius robustus}) based on analysisof photogrammetric data. Journal Cetacean Research and Management, 4(2), 155–164.
Perryman, W. L., & Westlake, R. L. (1998). A new geographic form of the spinner dolphin, stenella longirostris, detected with aerial photogrammetry. Marine Mammal Science, 14(1), 38–50.
Sasse, B. (2003). Job-Related Mortality of Wildlife Workers in the United States, 1937- 2000, 1015–1020.
Segre, P. S., Potvin, J., Cade, D. E., Calambokidis, J., Di Clemente, J., Fish, F. E., … & Goldbogen, J. A. (2020). Energetic and physical limitations on the breaching performance of large whales. Elife, 9, e51760.
Shirane, Y., Mori, F., Yamanaka, M., Nakanishi, M., Ishinazaka, T., Mano, T., … Shimozuru, M. (2020). Development of a noninvasive photograph-based method for the evaluation of body condition in free-ranging brown bears. PeerJ, 8, e9982. https://doi.org/10.7717/peerj.9982
Shrader, A. M., M, F. S., & Van Aarde, R. J. (2006). Digital photogrammetry and laser rangefinder techniques to measure African elephants, 1–7.
Stewart, J. D., Durban, J. W., Knowlton, A. R., Lynn, M. S., Fearnbach, H., Barbaro, J., … & Moore, M. J. (2021). Decreasing body lengths in North Atlantic right whales. Current Biology.
Walker, J. A., Alfaro, M. E., Noble, M. M., & Fulton, C. J. (2013). Body fineness ratio as a predictor of maximum prolonged-swimming speed in coral reef fishes. PloS one, 8(10), e75422.