As the sun set on February 16th, the R/V Star Keys pulled into Wellington Harbour, marking the end of the 2025 SAPPHIRE field season. The crew and science team returned to shore after a packed, productive, and successful three weeks at sea studying the impacts of environmental change on blue whales and krill in the South Taranaki Bight, Aotearoa New Zealand.
A blue whale comes up for air in the South Taranaki Bight.
In stark contrast to the 2024 field season, which featured dense and seemingly endless layers of gelatinous salps in the water and no krill or blue whales in the South Taranaki Bight, the 2025 field season was filled with blue whales and krill. In our three weeks aboard our research vessel Star Keys this year, we observed 66 blue whales, most of which were lunge feeding at the surface on dense patches of krill. We also collected krill for on-board respiration experiments and to be frozen to measure their lengths, weights, and caloric content. We recovered two hydrophones that recorded blue whale calls for the past year, and replaced them with two more. We collected identification photos, skin and blubber tissue samples for genetic and hormone analysis, and flew drones over almost all whales we encountered to measure body condition and morphology. We conducted water column profiles to measure the oceanography of the region, and mapped the prey field as we surveyed using a scientific echosounder.
Map of our survey effort (gray tracklines), blue whale sightings (red circles), and hydrophone locations (purple stars).
Around the world, we are currently bearing witness to environmental change. Our survey last year in 2024 was a reminder of the challenges these blue whales face to survive and thrive in an increasingly unpredictable ocean. This year was a poignant example of the vibrant marine life that exists here in the South Taranaki Bight when ocean conditions align more closely with what is expected, and of the incredible resilience of these animals as they navigate changing waters. These contrasting conditions over multiple years are key to our understanding as we study the impacts of climate change on krill and blue whales through the SAPPHIRE project.
Drone image of a blue whale coming to the surface.
The fieldwork we do to collect these data is motivated by scientific questions, management needs, and fascination with this ecosystem. But ultimately, what makes fieldwork possible and memorable is the people. We are deeply grateful for the many partners on the SAPPHIRE project. The 2025 science team was made up of Leigh Torres, Dawn Barlow, KC Bierlich, Kim Bernard (Oregon State University), Mike Ogle, and Ros Cole (Department of Conservation). The outstanding crew of the R/V Star Keys (Western Work Boats), Josh Fowden, Dave Futter, and Jordy Maiden-Drum, kept us safe, sailing, fed, and happy for three intense weeks. We are also grateful for our shore support, including our colleagues at Cornell University’s Yang Center for Conservation Bioacoustics, NIWA, the Marine Mammal Institute at Oregon State University, and the University of Auckland. Importantly, we deeply appreciate our many stakeholders who help us share, learn, and make our findings meaningful, including the Department of Conservation, the people of Aotearoa, and iwi across our study region, especially Ngāruahine who hosted us at the Rangatapu Marae for a profound hui with a powerful pōwhiri and critical wānanga of knowledge sharing.
Drone image of a blue whale mom and calf pair.
Now the next phase of the work begins. We have many terabytes of data to process, analyze, interpret, and share. We will certainly have our hands full. But while we are at our computers back in Oregon, we will be holding the memories of this field season close: The brilliant turquoise glow of a blue whale just below the surface, the sound of the deep exhalation as the whale comes up for air, and the awe of looking into a blue whale’s eye as it engulfs a dense swarm of krill; The golden sunset lighting and moon rise over Cape Farewell, and Mount Taranaki towering over the blue waters of the South Taranaki Bight; The giddy exclamations or silent awe of those of us privileged to spend time in these waters observing these animals, and the visions that linger just behind our eyelids as we fell into an exhausted sleep. We will see what the next year holds for the SAPPHIRE team and the blue whales and krill of the South Taranaki Bight.
Did you enjoy this blog? Want to learn more about marine life, research, and conservation? Subscribe to our blog and get a weekly alert when we make a new post! Just add your name into the subscribe box below!
Dr. KC Bierlich, Postdoctoral Scholar, OSU Department of Fisheries, Wildlife, & Conservation Sciences, Geospatial Ecology of Marine Megafauna Lab
The SAPPHIRE Project is in full swing, as we spend our days aboard the R/V Star Keys searching for krill and blue whales (Figure 1) in the South Taranaki Bight (STB) region of Aotearoa New Zealand. We are investigating how changing ocean conditions impact krill availability and quality, and how this in turn impacts blue whale behavior, health, and reproduction. Understanding the link between changing environmental conditions on prey species and predators is key to understanding the larger implications of climate change on ocean food webs and each populations’ resiliency.
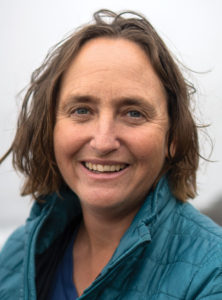
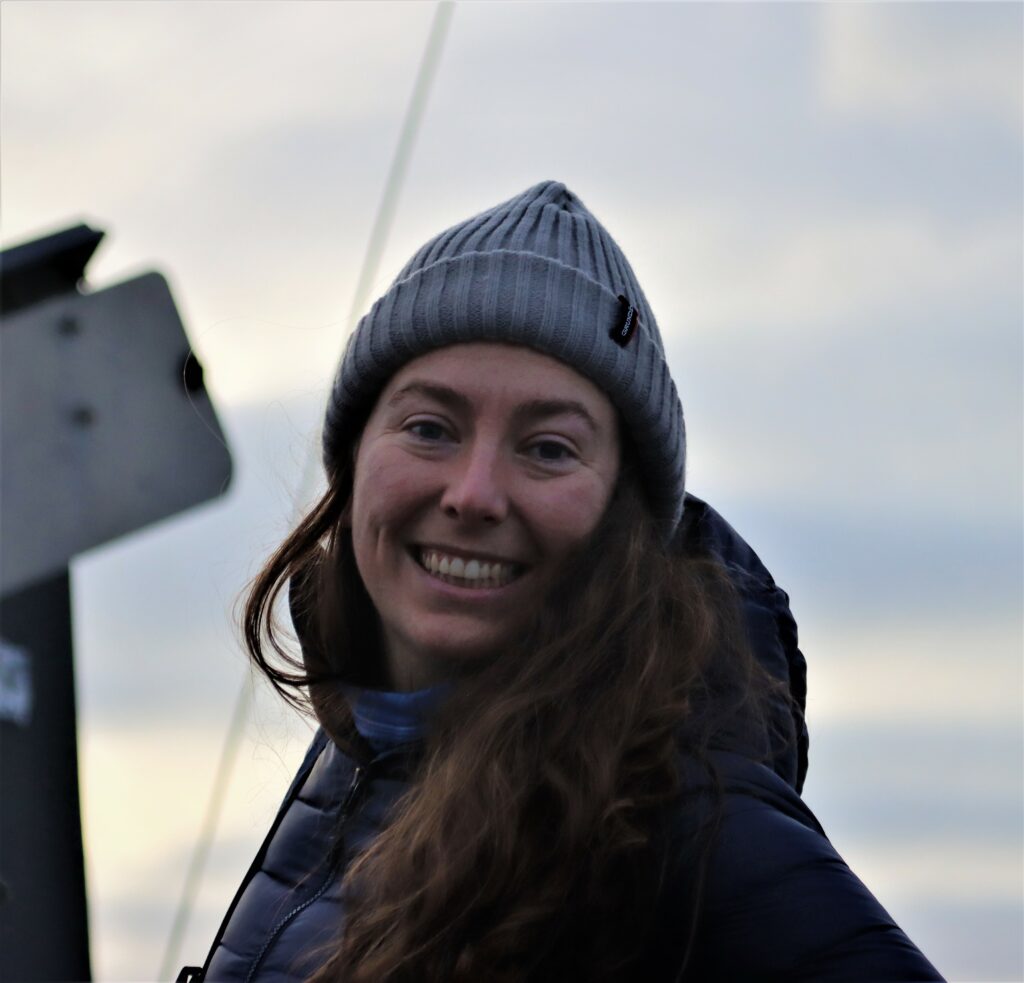
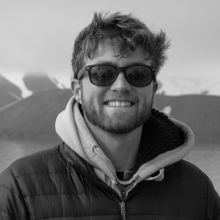
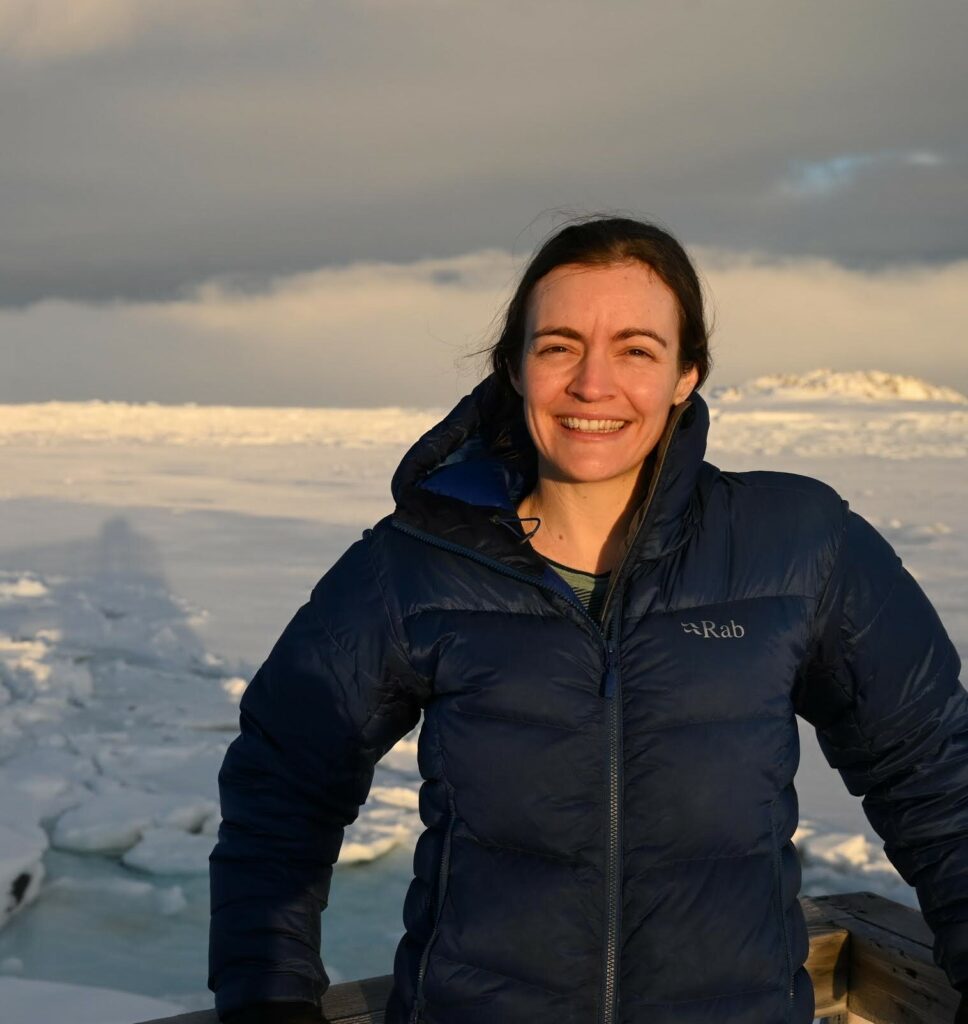
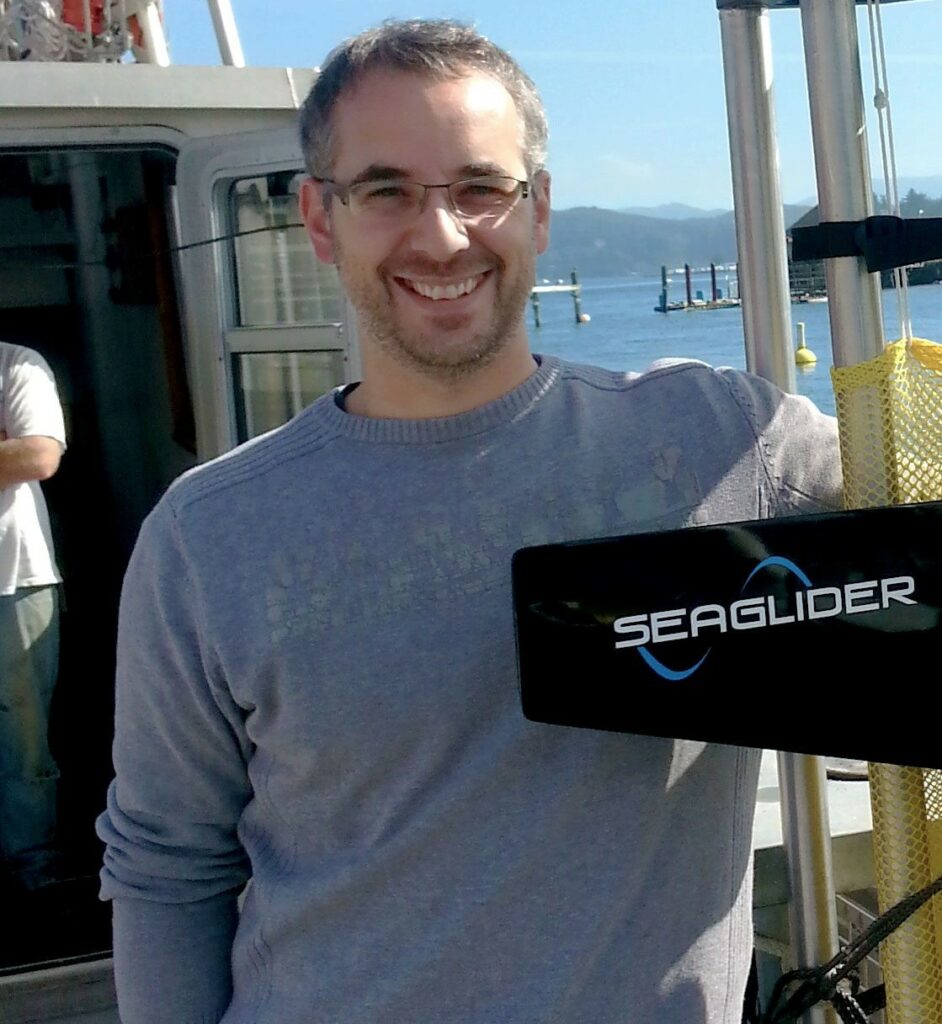
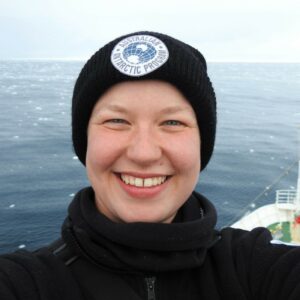
Figure 1. The SAPPHIRE team searching for blue whales. Top left) KC Bierlich, top right) Dawn Barlow, bottom left) Dawn Barlow, Kim Bernard (left to right), bottom right) KC Bierlich, Dawn Barlow, Leigh Torres, Mike Ogle (left to right).
One of the many components of the SAPPHIRE Project is to understand how foraging success of blue whales is influenced by environmental variation (see this recent blog written by Dr. Dawn Barlow introducing each component of the project). When you cannot go to a grocery store or restaurant any time you are hungry, you must rely on stored energy from previous feeds to fuel energy needs. Body condition reflects an individual’s stored energy in the body as a result of feeding and thus represents the foraging success of an individual, which can then affect its potential for reproductive output and the individual’s overall health (see this previous blog). As discussed in a previous blog, drones serve as a valuable tool for obtaining morphological measurements of whales to estimate their body condition. We are using drones to collect aerial imagery of pygmy blue whales to obtain body condition measurements late in the foraging season between years 2024 and 2026 of the SAPPHIRE Project (Figure 2). We are quantifying body condition as Body Area Index (BAI), which is a relative measure standardized by the total length of the whale and well suited for comparing individuals and populations (Figure 3).
The GEMM Lab recently published an article led by Dr. Dawn Barlow where we investigated the differences in BAI between three blue whale populations: Eastern North Pacific blue whales feeding in Monterey Bay, California; Chilean blue whales feeding in the Corcovado Gulf; and New Zealand Pygmy blue whales feeding in the STB (Barlow et al., 2023). These three populations are interesting to compare since blue whales that feed in Monterey Bay and Corcovado Gulf migrate to and from these seasonally productive feeding grounds, while the Pygmy blue whales stay in Aotearoa New Zealand year-round. Interestingly, the Pygmy blue whales had higher BAI (were fatter) compared to the other two regions despite relatively lower productivity in their foraging grounds. This difference in body condition may be due to different life history strategies where the non-migratory Pygmy blue whales may be able to feed as opportunities arrive, while the migratory strategies of the Eastern North Pacific and Chilean blue whales require good timing to access high abundant prey. Another interesting and unexpected result from our blue whale comparison was that Pygmy blue whales are not so “pygmy”; they are actually the same size as Eastern North Pacific and Chilean blue whales, with an average size around 22 m. Our findings from this blue whale comparison leads us to more questions about how environmental conditions that vary from year to year influence body condition and reproduction of these “not so pygmy” blue whales.
Figure 2. An aerial image of a Pygmy blue whale in the South Taranaki Bight region of Aotearoa New Zealand collected during the SAPPHIRE 2024 field season using a DJI Inspire 2 drone.
Figure 3. A drone image of a Pygmy blue whale and the length and body width measurements used to estimate Body Area Index (BAI), represented by the shaded blue region. Width measurements will also be used to help identify pregnant individuals.
The GEMM Lab has been studying this population of Pygmy blue whales in the STB since 2013 and found that years designated as a marine heatwave resulted with a reduction in blue whale feeding activity. Interestingly, breeding activity is also reduced during marine heatwaves in the following season when compared to the breeding season following a more productive, typical foraging season. These findings indicate that fluctuations in the environment, such as marine heatwaves, may affect not only foraging success, but also reproduction in Pygmy blue whales.
To help us better understand reproductive patterns across years, we will use body width measurements from drone images paired with hormone concentrations collected from fecal and biopsy samples to identify pregnant individuals. Progesterone is a hormone secreted in the ovaries of mammals during the estrous cycle and gestation, making it the predominant hormone responsible for sustaining pregnancy. Recently, the GEMM Lab’s Dr. Alejandro Fernandez-Ajo wrote a blog discussing his publication identifying pregnant individual gray whales using drone-based body width measurements and progesterone concentrations from fecal samples (Fernandez et al., 2023). While individuals that were pregnant had higher levels of progesterone compared to when they were not pregnant, the body width at 50% of the body length served as a more reliable method for detecting pregnancy in gray whales. We will use similar methods to help identify pregnancy in Pygmy blue whales for the SAPPHIRE Project where will we examine body width measurement paired with progesterone concentrations collected from fecal and biopsy samples to identify pregnant individuals. We hope our work will help to better understand how climate change will influence Pygmy blue whale body condition and reproduction, and thus the overall health and resiliency of the population. Stay tuned!
References
Barlow, D. R., Bierlich, K. C., Oestreich, W. K., Chiang, G., Durban, J. W., Goldbogen, J. A., Johnston, D. W., Leslie, M. S., Moore, M. J., Ryan, J. P., & Torres, L. G. (2023). Shaped by Their Environment: Variation in Blue Whale Morphology across Three Productive Coastal Ecosystems. Integrative Organismal Biology, 5(1). https://doi.org/10.1093/iob/obad039
Fernandez Ajó, A., Pirotta, E., Bierlich, K. C., Hildebrand, L., Bird, C. N., Hunt, K. E., Buck, C. L., New, L., Dillon, D., & Torres, L. G. (2023). Assessment of a non-invasive approach to pregnancy diagnosis in gray whales through drone-based photogrammetry and faecal hormone analysis. Royal Society Open Science, 10(7), 230452. https://doi.org/10.1098/rsos.230452
Leigh Torres, Associate Professor, PI of the GEMM Lab
There are many phases of a scientific journey, which generally follows a linear path (although I recognize that the process is certainly iterative at times to improve and refine). The scientific journey typically starts with an idea or question, bred from curiosity and passion. The journey hopefully ends with new knowledge, a useful application (e.g., tool or management outcome), and more questions in need of answers, providing a sense of success and pride. But along this path, there are many more phases, with many more emotions. As we begin the four-year SAPPHIRE project, I have already experienced a range of emotions, and I am certain more will come my way as I again wander through the many phases and feeling of science:
PHASE
FEELINGS
Generation of idea or question
Curiosity, passion, wonder
Build the team and develop the funding proposal
Drive, dreaming big, team management, belief in the importance of your proposed work
Notice of funding proposal success
Disbelief, excitement, and pride, followed quickly by feeling daunted, and self-doubt about the ability to pull off what you said you would do.
*Prep for fieldwork/experiment/data collection
Frantic and overwhelmed by the need to remember all the details that make or break the research; lists, lists, lists; pressure to get organized and stay within your budget. Anticipation, exhaustion.
*Outreach/Engagement/Communication
Eagerness to share and connect; Pressure to build relationships and trust; make sure the research is meaningful and accessible to local communities
Sigh of relief to be underway, accompanied by big pressure to achieve: gotta do what you said you would do.
Preparation of scientific publications and reports
Excitement for data synthesis: What will the results say? What are the answers to your burning questions? Were your hypotheses correct? With a good dose of apprehension of peer feedback and critical reviews.
Publications and reports
Satisfaction to see outputs and results from hard work being broadly disseminated.
Project end with final report
Feeling of great accomplishment, but now need to develop the next project and get the funding… the cycle continues.
*After months of intense preparation for our field research component of the SAPPHIRE project in Aotearoa New Zealand (permits, equipment purchasing, community engagement, gathering supplies, learning how to use new equipment, vessel contracting, overseas shipping, travel arrangements, vessel mobilization, oh the list goes on!), we have just stepped off the vessel after 3 full days collecting data. I have cycled through all these emotions many times, and now I feel both exhausted and elated. We are implementing our plan, and we now have data in-hand. Worry creeps in all the time: we need to do more, do better. But I also know that our team is excellent and with patience, blessings from the weather gods, and our continued hard work, we will succeed, learn, and share. As SAPPHIRE chargers ahead to understand the impacts of climate change on marine prey (krill) and predators (blue whales), I am ready for the continued mix of emotions that comes with science.
Photo montage of our awesome SAPPHIRE team in prep mode and during data collection in the South Taranaki Bight within Aotearoa New Zealand.
Did you enjoy this blog? Want to learn more about marine life, research, and conservation? Subscribe to our blog and get a weekly alert when we make a new post! Just add your name into the subscribe box below!
The world is warming. Ocean ecosystems are experiencing significant and rapid impacts of climate change. However, the cascading effects on marine life are largely unknown. Thus, it is critical to understand how – not just if – environmental change impacts the availability and quality of key prey species in ocean food webs, and how these changes will impact marine predator health and population resilience. With these pressing knowledge gaps in mind, we are thrilled to launch a new project “Marine predator and prey response to climate change: Synthesis of Acoustics, Physiology, Prey, and Habitat in a Rapidly changing Environment (SAPPHIRE).” We will examine how changing ocean conditions affect the availability and quality of krill, and thus impact blue whale behavior, health, and reproduction. This large-scale research effort is made possible with funding from the National Science Foundation.
The SAPPHIRE project takes place in the South Taranaki Bight (STB) region of Aotearoa New Zealand, and before diving into our new research plans, let’s reflect briefly on what we know so far about this study system based on our previous research. Our collaborative research team has studied blue whales in the STB since 2013 to document the population, understand their ecology and habitat use, and inform conservation management. We conducted boat-based surveys and used hydrophones to record the underwater soundscape, and found the following:
Blue whales in Aotearoa New Zealand are a unique population, genetically distinct from all other known populations in the Southern Hemisphere, with an estimated population size of 718 (95% CI = 279 – 1926).1
Blue whales reside in the STB region year-round, with feeding and breeding vocalizations detected nearly every day of the year.2,3
Wind-driven upwelling over Kahurangi shoals moves a plume of cold, nutrient-rich waters into the STB, supporting aggregations of krill, and thereby critical feeding opportunities for blue whales in spring and summer.4–6
We developed predictive models to forecast blue whale distribution up to three weeks in advance, providing managers with a real-time tool in the form of a desktop application to produce daily forecast maps for dynamic management.7
During marine heatwaves, blue whale feeding activity was substantially reduced in the STB. Interestingly, their breeding activity was also reduced in the following season when compared to the breeding season following a more productive, typical foraging season. This finding indicates that shifting environmental conditions, such as marine heatwaves and climate change, may have consequences to not just foraging success, but the population’s reproductive patterns.3
A blue whale comes up for air in the South Taranaki Bight. Photo by Leigh Torres.
Project goals
Building on this existing knowledge, we aim to gain understanding of the health impacts of environmental change on krill and blue whales, which can in turn inform management decisions. Over the next three years (2024-2026) we will use multidisciplinary methods to collect data in the field that will enable us to tackle these important but challenging goals. Our broad objectives are to:
Assess variation in krill quality and availability relative to rising temperatures and different ocean conditions,
Document how blue whale body condition and hormone profiles change relative to variable environmental and prey conditions,
Understand how environmental conditions impact blue whale foraging and reproductive behavior, and
Integrate these components to develop novel Species Health Models to predict predator and prey whale population response to rapid environmental change.
Kicking off fieldwork
This coming January, we will set sail aboard the R/V Star Keys and head out in search of blue whales and krill in the STB! Five of our team members will spend three weeks at sea, during which time we will conduct surveys for blue whale occurrence paired with active acoustic assessment of krill availability, fly Unoccupied Aircraft Systems (UAS; “drones”) over whales to determine body condition and potential pregnancy, collect tissue biopsy samples to quantify stress and reproductive hormone levels, deploy hydrophones to record rates of foraging and reproductive calls by blue whales, and conduct on-board controlled experiments on krill to assess their response to elevated temperature.
The team in action aboard the R/V Star Keys in February 2017. Photo by L. Torres.
The moving pieces are many as we work to obtain research permits, engage in important consultation with iwi (indigenous Māori groups), procure specialized scientific equipment, and make travel and shipping arrangements. The to-do lists seem to grow just as fast as we can check items off; such is the nature of coordinating an international, multidisciplinary field effort. But it will pay off when we are underway, and I can barely contain my excitement to back on the water with this research team.
Our team has not collected data in the STB since 2017. We know so much more now than we did when studies of this blue whale population were just beginning. For example, we are eager to put our blue whale forecast tool to use, which will hopefully enable us to direct survey effort toward areas of higher blue whale density to maximize data collection. We are keen to see what new insights we gain, and what new questions and challenges arise.
Research team
The SAPPHIRE project will only be possible with the expertise and coordination of the many members of our collaborative group. We are all thrilled to begin this research journey together, and eager to share what we learn.
Did you enjoy this blog? Want to learn more about marine life, research, and conservation? Subscribe to our blog and get a weekly alert when we make a new post! Just add your name into the subscribe box below!
References:
1. Barlow DR, Torres LG, Hodge KB, Steel D, Baker CS, Chandler TE, Bott N, Constantine R, Double MC, Gill P, Glasgow D, Hamner RM, Lilley C, Ogle M, Olson PA, Peters C, Stockin KA, Tessaglia-Hymes CT, Klinck H. Documentation of a New Zealand blue whale population based on multiple lines of evidence. Endanger Species Res. 2018;36:27–40.
2. Barlow DR, Klinck H, Ponirakis D, Holt Colberg M, Torres LG. Temporal occurrence of three blue whale populations in New Zealand waters from passive acoustic monitoring. J Mammal. 2022;
3. Barlow DR, Klinck H, Ponirakis D, Branch TA, Torres LG. Environmental conditions and marine heatwaves influence blue whale foraging and reproductive effort. Ecol Evol. 2023;13:e9770.
4. Barlow DR, Klinck H, Ponirakis D, Garvey C, Torres LG. Temporal and spatial lags between wind, coastal upwelling, and blue whale occurrence. Sci Rep. 2021;11(6915):1–10.
5. Barlow DR, Bernard KS, Escobar-Flores P, Palacios DM, Torres LG. Links in the trophic chain: Modeling functional relationships between in situ oceanography, krill, and blue whale distribution under different oceanographic regimes. Mar Ecol Prog Ser. 2020;642:207–25.
6. Torres LG, Barlow DR, Chandler TE, Burnett JD. Insight into the kinematics of blue whale surface foraging through drone observations and prey data. PeerJ. 2020;8:e8906.
7. Barlow DR, Torres LG. Planning ahead: Dynamic models forecast blue whale distribution with applications for spatial management. J Appl Ecol. 2021;58(11):2493–504.
Dr. KC Bierlich, Postdoctoral Scholar, OSU Department of Fisheries, Wildlife, & Conservation Sciences, Geospatial Ecology of Marine Megafauna Lab
The morphology and body size of an animal is one of the most fundamental factors for understanding a species ecology. For instance, fish body size and fin shape can influence its habitat use, foraging behavior, prey type, physiological performance, and predator avoidance strategies (Fig 1). Morphology and body size can thus reflect details of an individual’s current health, likelihood of survival, and potential reproductive success, which directly influences a species life history patterns, such as reproductive status, growth rate, and energetic requirements. Collecting accurate morphological measurements of individuals is often essential for monitoring populations, and recent studies have demonstrated how animal morphology has profound implications for conservation and management decisions, especially for populations inhabiting anthropogenically-altered environments (Miles 2020) (Fig. 1). For example, in a study on the critically endangered European eel, De Meyer et al. (2020) found that different skulls sizes were associated with different ecomorphs (a local variety of a species whose appearance is determined by its ecological environment), which predicted different diet types and resulted with some ecomorphs having a greater exposure to pollutants and toxins than others. However, obtaining manual measurements of wild animal populations can be logistically challenging, limited by accessibility, cost, danger, and animal disturbance. These challenges are especially true for large elusive animals, such as whales that are often in remote locations, spend little time at the surface of the water, and their large size can preclude safe capture and live handling.
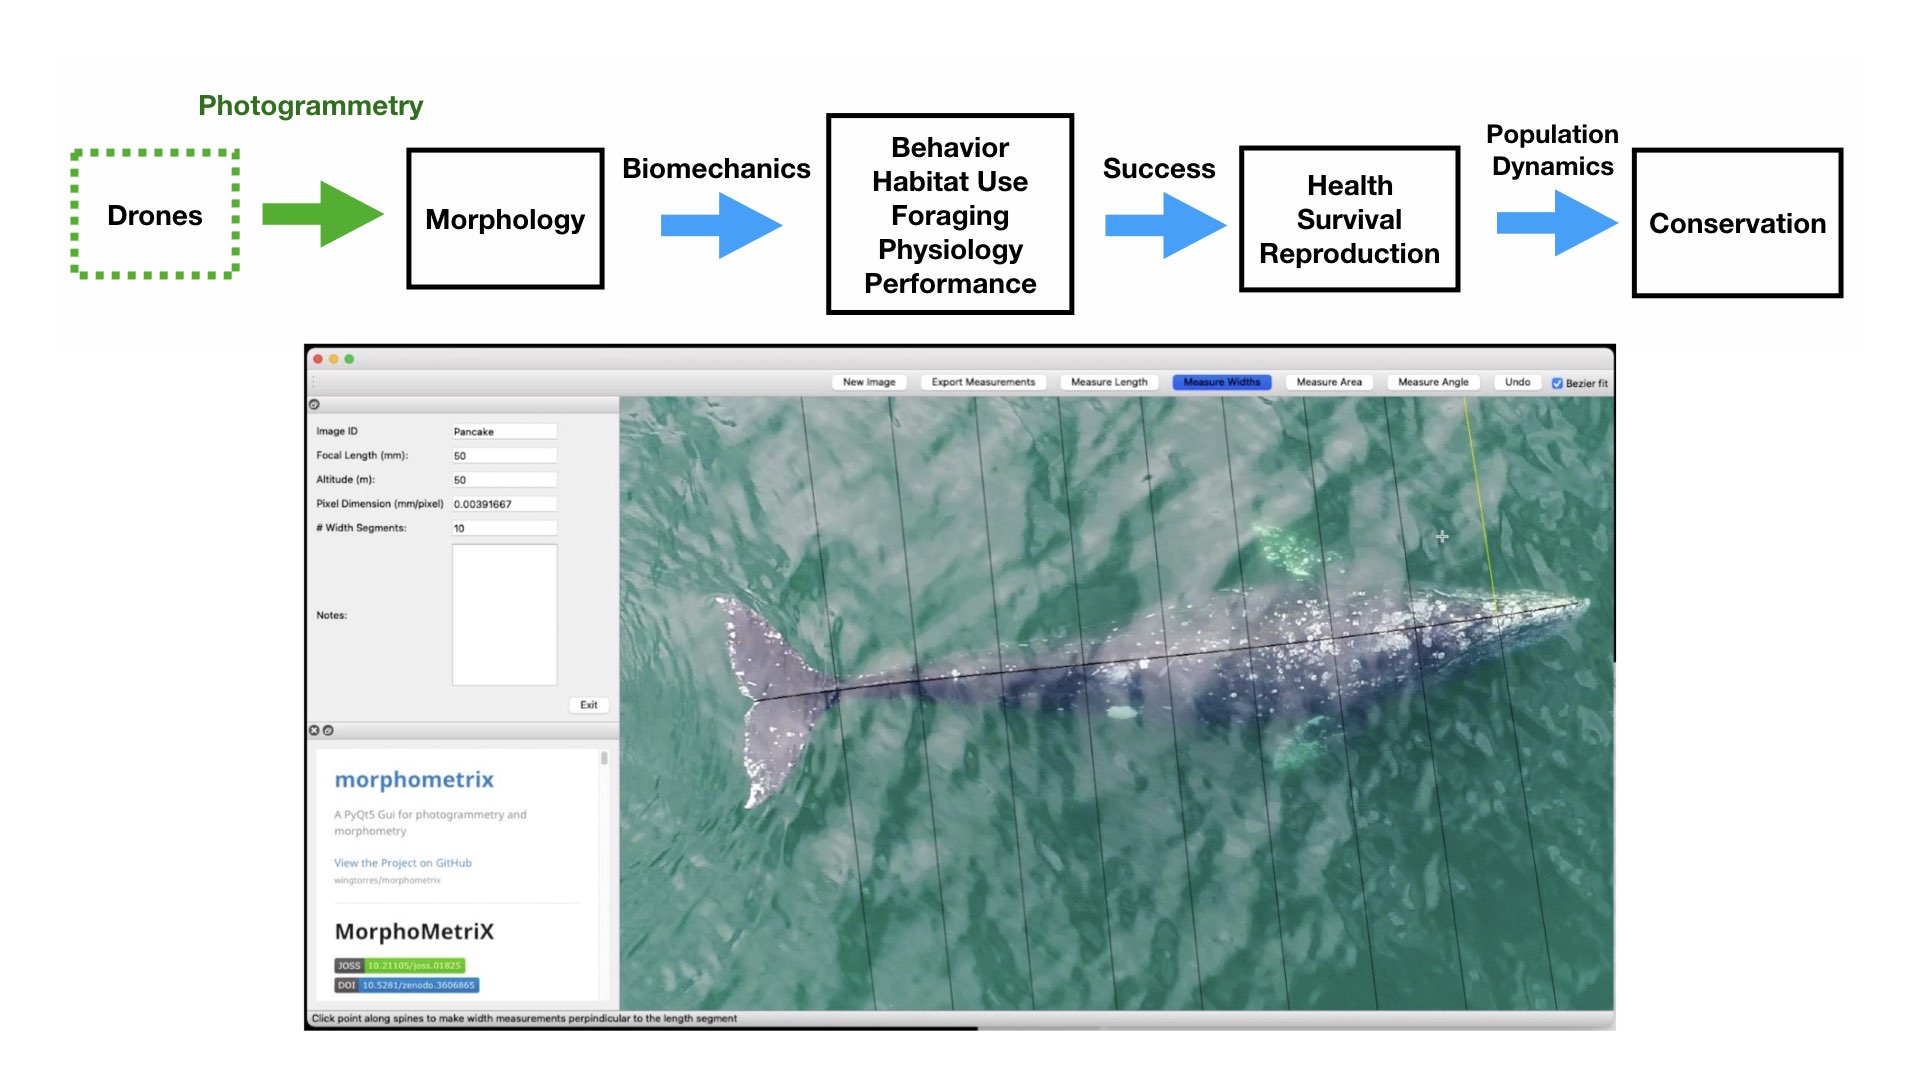
Figure 1. Top) A pathway framework depicting how the morphology of an animal influences its habitat use, behavior, foraging, physiology, and performance. These traits all affect how successful an animal is in its environment and can reflect an individual’s current health, likelihood of survival, and potential reproductive success. This individual success can then be scaled up to assess overall population health, which in turn can have direct implications for conservation. Bottom) an example of morphological differences in fish body size and fin shape from Walker et al. (2013). Fineness ratio (f) = length of body ÷ max body width.
Photogrammetry is a non-invasive method for obtaining accurate morphological measurements of animals from photographs. The two main types of photogrammetry methods used in wildlife biology are 1) single camera photogrammetry, where a known scale factor is applied to a single image to measure 2D distances and angles and 2) stereo-photogrammetry, where two or more images (from a single or multiple cameras) are used to recreate 3D models. These techniques have been used on domestic animals to measure body condition and estimate weight of dairy cows and lactating Mediterranean buffaloes (Negretti et al., 2008; Gaudioso et al., 2014) and on wild animals to measure sexual dimorphism in Western gorillas (Breuer et al., 2007), shoulder heights of elephants (Schrader et al., 2006), nutritional status of Japanese macaques (Kurita et al., 2012), and the body condition of brown bears (Shirane et al., 2020). Over 70 years ago, Leedy (1948) encouraged wildlife biologists to use aerial photogrammetry from aircraft for censusing wild animal populations and their habitats, where photographs can be collected at nadir (straight down) or an oblique angle, and the scale can be calculated by dividing the focal length of the camera by the altitude or by using a ratio of selected points in an image of a known size. Indeed, aerial photogrammetry has been wildly adopted by wildlife biologists and has proven useful in obtaining measurements in large vertebrates, such as elephants and whales.
Whitehead & Payne (1978) first demonstrated the utility of using aerial photogrammetry from airplanes and helicopters as a non-invasive technique for estimating the body length of southern right whales. Prior to this technique, measurements of whales were traditionally limited to assessing carcasses collected from scientific whaling operations, or opportunistically from commercial whaling, subsistence hunting, stranding events, and bycatch. Importantly, aerial photogrammetry provides a method to collect measurements of whales without killing them. This approach has been widely adopted to obtain body length measurements on a variety of whale and dolphin species, including bowhead whales (Cubbage & Calambokidis, 1987), southern right whales (Best & Rüther, 1992), fin whales (Ratnaswamy and Wynn, 1993), common dolphins (Perryman and Lynn, 1993), spinner dolphins (Perryman & Westlake 1998), and killer whales (Fearnbach et al. 2012). Aerial photogrammetry has also been used to measure body widths to estimate nutritive condition related to reproduction in gray whales (Perryman and Lynn, 2002) and northern and southern right whales (Miller et al., 2012). However, these studies collected photographs from airplanes and helicopters, which can be costly, limited by weather and infrastructure to support aircraft research efforts and, importantly, presents a potential risk to wildlife biologists (Sasse 2003).
The recent advancement and commercialization of unoccupied aircraft systems (UAS, or drones) has revolutionized the ability to obtain morphological measurements from high resolution aerial photogrammetry across a variety of ecosystems (Fig. 2). Drones ultimately bring five transformative qualities to conservation science compared to airplanes and helicopters: affordability, immediacy, quality, efficiency, and safety of data collection. Durban et al. (2015) first demonstrated the utility of using drones for non-invasively obtaining morphological measurements of killer whales in remote environments. Since then, drone-based morphological measurements have been applied to a wide range of studies that have increased our understanding on different whale populations. For example, Leslie et al. (2020) used drone-based measurements of the skull to distinguish a unique sub-species of blue whales off the coast of Chile. Groskreutz et al. (2019) demonstrated how long-term nutritional stress has limited body growth in northern resident killer whales, while Stewart et al. (2021) found a decrease in body length of North Atlantic Right whales since 1981 that was associated with entanglements from fishing gear and may be a contributing factor to the decrease in reproductive success for this endangered population.
Drone imagery is commonly used to estimate the body condition of baleen whales by measuring the body length and width of individuals. Recently, the GEMM Lab used body length and width measurements to quantify intra- and inter-seasonal changes in body condition across individual gray whales (Lemos et al., 2020). Drones have also been used to measure body condition loss in humpback whales during the breeding season (Christiansen et al., 2016) and to compare the healthy southern right whales to the skinnier, endangered North Atlantic right whales (Christiansen et al., 2020). Drone-based assessments of body condition have even been used to measure how calf growth rate is directly related to maternal loss during suckling (Christiansen et al., 2018), and even estimate body mass (Christiansen et al., 2019).
Drone-based morphological measurements can also be combined with whale-borne inertial sensing tag data to study the functional morphology across several different baleen whale species. Kahane-Rapport et al. (2020) used drone measurements of tagged whales to analyze the biomechanics of how larger whales require longer times for filtering the water through their baleen when feeding. Gough et al. (2019) used size measurements from drones and swimming speeds from tags to determine that a whale’s “walking speed” is 2 meters per second – whether the largest of the whales, a blue whale, or the smallest of the baleen whales, an Antarctic minke whale. Size measurements and tag data were combined by Segre et al. (2019) to quantify the energetic costs of different sized whales when breaching.
Taken together, drones have revolutionized our ability to obtain morphological measurements of whales, greatly increasing our capacity to better understand how these animals function and perform in their environments. These advancements in marine science are particularly important as these methods provide greater opportunity to monitor the health of populations, especially as they face increased threats from anthropogenic stressors (such as vessel traffic, ocean noise, pollution, fishing entanglement, etc.) and climate change.
Drone-based photogrammetry is one of the main focuses of the GEMM Lab’s project on Gray whale Response to Ambient Noise Informed by Technology and Ecology (GRANITE). This summer we have been collecting drone videos to measure the body condition of gray whales feeding off the coast of Newport, Oregon (Fig. 2). As we try to understand the physiological stress response of gray whales to noise and other potential stressors, we have to account for the impacts of overall nutritional state of each individual whale’s physiology, which we infer from these body condition estimates.
Figure 2. Drones can help collect images of whales to obtain morphological measurements using photogrammetry and help us fill knowledge gaps for how these animals interact in their environment and to assess their current health. Bottom photo is an image collected by the GEMM Lab of a gray whale being measured in MorphoMetriX software to estimate its body condition.
References
Best, P. B., & Rüther, H. (1992). Aerial photogrammetry of southern right whales, Eubalaena australis. Journal of Zoology, 228(4), 595-614.
Breuer, T., Robbins, M. M., & Boesch, C. (2007). Using photogrammetry and color scoring to assess sexual dimorphism in wild western gorillas (Gorilla gorilla). American Journal of Physical Anthropology, 134(3), 369–382. https://doi.org/10.1002/ajpa.20678
Christiansen, F., Vivier, F., Charlton, C., Ward, R., Amerson, A., Burnell, S., & Bejder, L. (2018). Maternal body size and condition determine calf growth rates in southern right whales. Marine Ecology Progress Series, 592, 267–281.
Christiansen, F. (2020). A population comparison of right whale body condition reveals poor state of North Atlantic right whale, 1–43.
Christiansen, F., Dujon, A. M., Sprogis, K. R., Arnould, J. P. Y., & Bejder, L. (2016). Noninvasive unmanned aerial vehicle provides estimates of the energetic cost of reproduction in humpback whales. Ecosphere, 7(10), e01468–18.
Christiansen, F., Sironi, M., Moore, M. J., Di Martino, M., Ricciardi, M., Warick, H. A., … Uhart, M. M. (2019). Estimating body mass of free-living whales using aerial photogrammetry and 3D volumetrics. Methods in Ecology and Evolution, 10(12), 2034–2044.
Cubbage, J. C., & Calambokidis, J. (1987). Size-class segregation of bowhead whales discerned through aerial stereo-photogrammetry. Marine Mammal Science, 3(2), 179–185.
De Meyer, J., Verhelst, P., & Adriaens, D. (2020). Saving the European Eel: How Morphological Research Can Help in Effective Conservation Management. Integrative and Comparative Biology, 23, 347–349.
Gaudioso, V., Sanz-Ablanedo, E., Lomillos, J. M., Alonso, M. E., Javares-Morillo, L., & Rodr\’\iguez, P. (2014). “Photozoometer”: A new photogrammetric system for obtaining morphometric measurements of elusive animals, 1–10.
Gough, W. T., Segre, P. S., Bierlich, K. C., Cade, D. E., Potvin, J., Fish, F. E., … Goldbogen, J. A. (2019). Scaling of swimming performance in baleen whales. Journal of Experimental Biology, 222(20), jeb204172–11.
Groskreutz, M. J., Durban, J. W., Fearnbach, H., Barrett-Lennard, L. G., Towers, J. R., & Ford, J. K. B. (2019). Decadal changes in adult size of salmon-eating killer whales in the eastern North Pacific. Endangered Species Research, 40, 1
Kahane-Rapport, S. R., Savoca, M. S., Cade, D. E., Segre, P. S., Bierlich, K. C., Calambokidis, J., … Goldbogen, J. A. (2020). Lunge filter feeding biomechanics constrain rorqual foraging ecology across scale. Journal of Experimental Biology, 223(20), jeb224196–8.
Leedy, D. L. (1948). Aerial Photographs, Their Interpretation and Suggested Uses in Wildlife Management. The Journal of Wildlife Management, 12(2), 191.
Lemos, L. S., Burnett, J. D., Chandler, T. E., Sumich, J. L., and Torres, L. G. (2020). Intra- and inter-annual variation in gray whale body condition on a foraging ground. Ecosphere 11.
Leslie, M. S., Perkins-Taylor, C. M., Durban, J. W., Moore, M. J., Miller, C. A., Chanarat, P., … Apprill, A. (2020). Body size data collected non-invasively from drone images indicate a morphologically distinct Chilean blue whale (Balaenoptera musculus) taxon. Endangered Species Research, 43, 291–304.
Miles, D. B. (2020). Can Morphology Predict the Conservation Status of Iguanian Lizards? Integrative and Comparative Biology.
Miller, C. A., Best, P. B., Perryman, W. L., Baumgartner, M. F., & Moore, M. J. (2012). Body shape changes associated with reproductive status, nutritive condition and growth in right whales Eubalaena glacialis and E. australis. Marine Ecology Progress Series, 459, 135–156.
Negretti, P., Bianconi, G., Bartocci, S., Terramoccia, S., & Verna, M. (2008). Determination of live weight and body condition score in lactating Mediterranean buffalo by Visual Image Analysis. Livestock Science, 113(1), 1–7. https://doi.org/10.1016/j.livsci.2007.05.018
Ratnaswamy, M. J., & Winn, H. E. (1993). Photogrammetric Estimates of Allometry and Calf Production in Fin Whales, \emph{Balaenoptera physalus}. American Society of Mammalogists, 74, 323–330.
Perryman, W. L., & Lynn, M. S. (1993). Idendification of geographic forms of common dolphin(\emph{Delphinus Delphis}) from aerial photogrammetry. Marine Mammal Science, 9(2), 119–137.
Perryman, W. L., & Lynn, M. S. (2002). Evaluation of nutritive condition and reproductive status of migrating gray whales (\emph{Eschrichtius robustus}) based on analysisof photogrammetric data. Journal Cetacean Research and Management, 4(2), 155–164.
Perryman, W. L., & Westlake, R. L. (1998). A new geographic form of the spinner dolphin, stenella longirostris, detected with aerial photogrammetry. Marine Mammal Science, 14(1), 38–50.
Sasse, B. (2003). Job-Related Mortality of Wildlife Workers in the United States, 1937- 2000, 1015–1020.
Segre, P. S., Potvin, J., Cade, D. E., Calambokidis, J., Di Clemente, J., Fish, F. E., … & Goldbogen, J. A. (2020). Energetic and physical limitations on the breaching performance of large whales. Elife, 9, e51760.
Shirane, Y., Mori, F., Yamanaka, M., Nakanishi, M., Ishinazaka, T., Mano, T., … Shimozuru, M. (2020). Development of a noninvasive photograph-based method for the evaluation of body condition in free-ranging brown bears. PeerJ, 8, e9982. https://doi.org/10.7717/peerj.9982
Shrader, A. M., M, F. S., & Van Aarde, R. J. (2006). Digital photogrammetry and laser rangefinder techniques to measure African elephants, 1–7.
Stewart, J. D., Durban, J. W., Knowlton, A. R., Lynn, M. S., Fearnbach, H., Barbaro, J., … & Moore, M. J. (2021). Decreasing body lengths in North Atlantic right whales. Current Biology.
Walker, J. A., Alfaro, M. E., Noble, M. M., & Fulton, C. J. (2013). Body fineness ratio as a predictor of maximum prolonged-swimming speed in coral reef fishes. PloS one, 8(10), e75422.