New publication by GEMM Lab reveals sub-population health differences in gray whales 

Dr. KC Bierlich, Postdoctoral Scholar, OSU Department of Fisheries, Wildlife, & Conservation Sciences, Geospatial Ecology of Marine Megafauna (GEMM) Lab

In a previous blog, I discussed the importance of incorporating measurement uncertainty in drone-based photogrammetry, as drones with different sensors, focal length lenses, and altimeters will have varying levels of measurement accuracy. In my last blog, I discussed how to incorporate photogrammetric uncertainty when combining multiple measurements to estimate body condition of baleen whales. In this blog, I will highlight our recent publication in Frontiers in Marine Science (https://doi.org/10.3389/fmars.2022.867258) led by GEMM Lab’s Dr. Leigh TorresClara Bird, and myself that used these methods in a collaborative study using imagery from four different drones to compare gray whale body condition on their breeding and feeding grounds (Torres et al., 2022).

Most Eastern North Pacific (ENP) gray whales migrate to their summer foraging grounds in Alaska and the Arctic, where they target benthic amphipods as prey. A subgroup of gray whales (~230 individuals) called the Pacific Coast Feeding Group (PCFG), instead truncates their migration and forages along the coastal habitats between Northern California and British Columbia, Canada (Fig. 1). Evidence from a recent study lead by GEMM Lab’s Lisa Hildebrand (see this blog) found that the caloric content of prey in the PCFG range is of equal or higher value than the main amphipod prey in the Arctic/sub-Arctic regions (Hildebrand et al., 2021). This implies that greater prey density and/or lower energetic costs of foraging in the Arctic/sub-Arctic may explain the greater number of whales foraging in that region compared to the PCFG range. Both groups of gray whales spend the winter months on their breeding and calving grounds in Baja California, Mexico. 

Figure 1. The GEMM Lab field team following a Pacific Coast Feeding Group (PCFG) gray whale swimming in a kelp bed along the Oregon Coast during the summer foraging season. 

In January 2019 an Unusual Mortality Event (UME) was declared for gray whales due to the elevated numbers of stranded gray whales between Mexico and the Arctic regions of Alaska. Most of the stranded whales were emaciated, indicating that reduced nutrition and starvation may have been the causal factor of death. It is estimated that the population dropped from ~27,000 individuals in 2016 to ~21,000 in 2020 (Stewart & Weller, 2021).

During this UME period, between 2017-2019, the GEMM Lab was using drones to monitor the body condition of PCFG gray whales on their Oregon coastal feeding grounds (Fig. 1), while Christiansen and colleagues (2020) was using drones to monitor gray whales on their breeding grounds in San Ignacio Lagoon (SIL) in Baja California, Mexico. We teamed up with Christiansen and colleagues to compare the body condition of gray whales in these two different areas leading up to the UME. Comparing the body condition between these two populations could help inform which population was most effected by the UME.

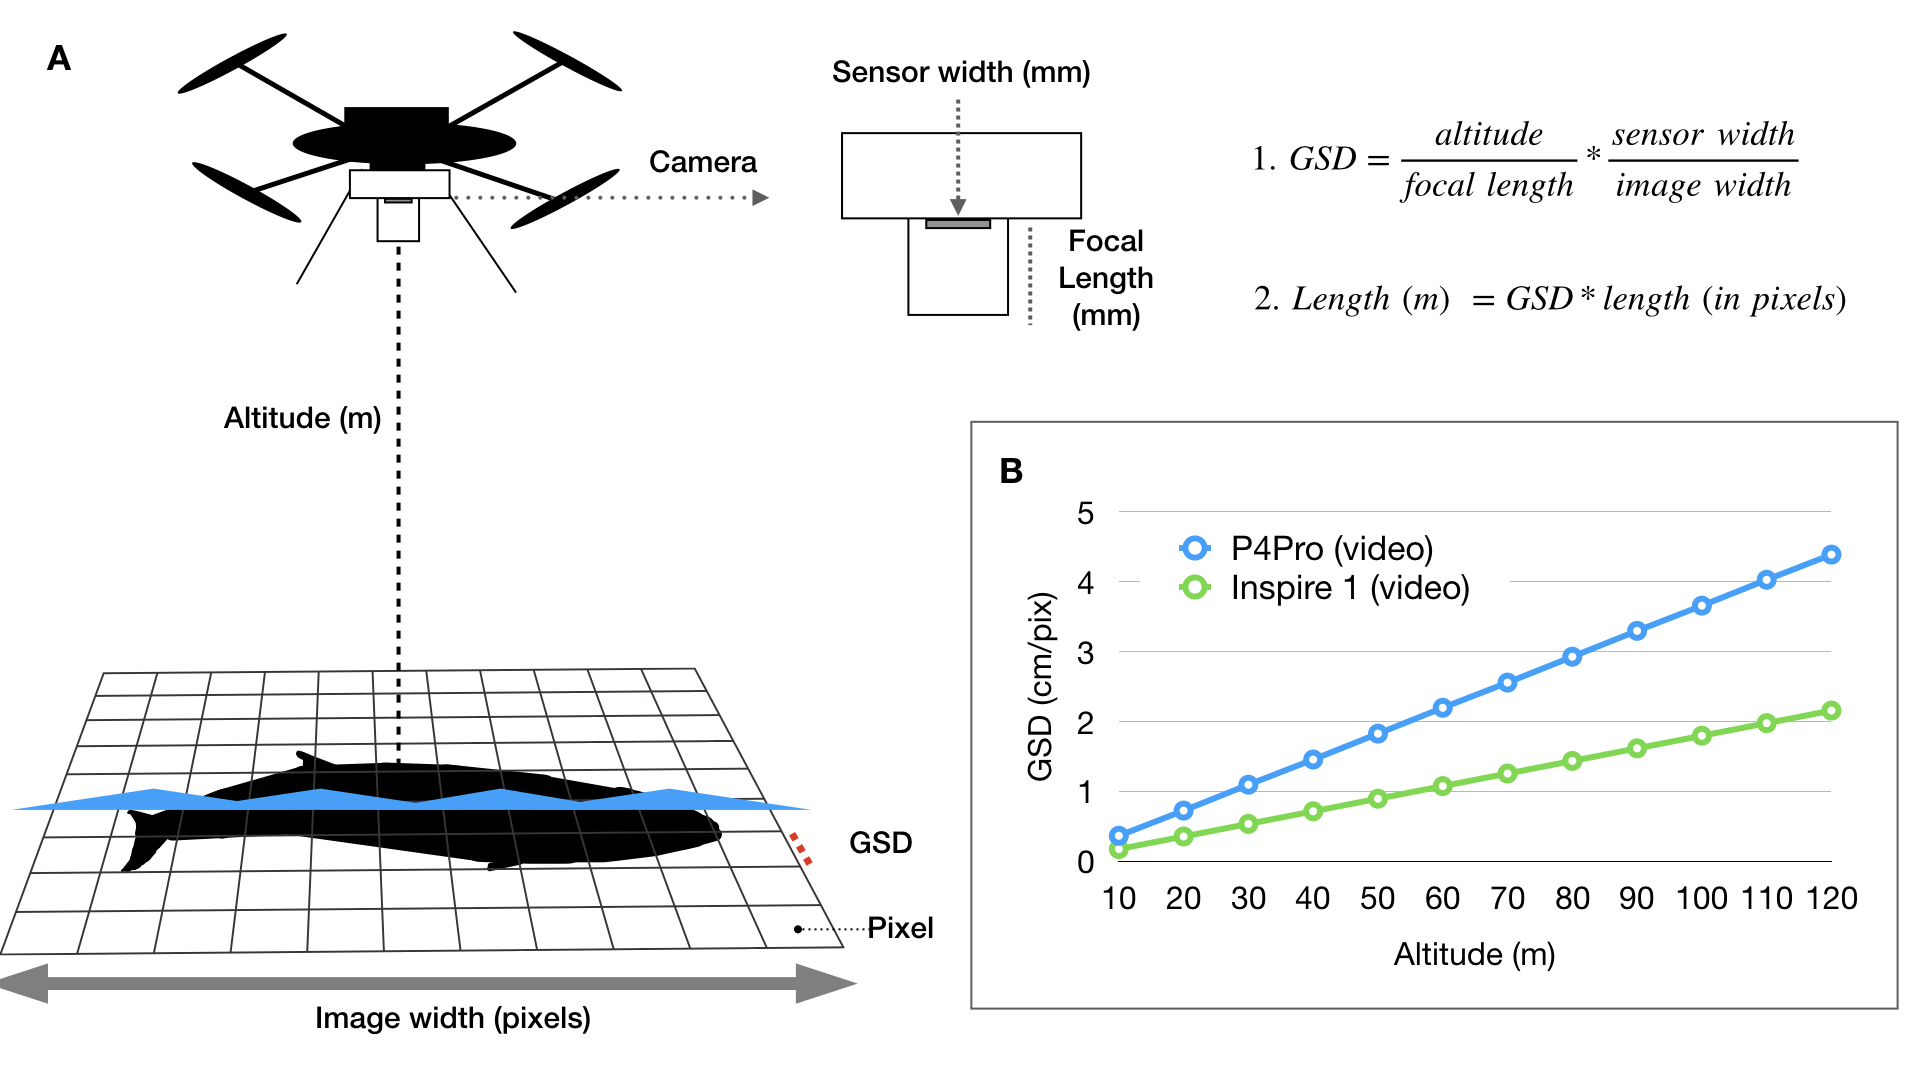
The combined datasets consisted of four different drones used, thus different levels of photogrammetric uncertainty to consider. The GEMM Lab collected data using a DJI Phantom 3 Pro, DJI Phantom 4, and DJI Phantom 4 Pro, while Christiansen et al., (2020) used a DJI Inspire 1 Pro. By using the methodological approach described in my previous blog (here, also see Bierlich et al., 2021a for more details), we quantified photogrammetric uncertainty specific to each drone, allowing cross-comparison between these datasets. We also used Body Area Index (BAI), which is a standardized relative measure of body condition developed by the GEMM Lab (Burnett et al., 2018) that has low uncertainty with high precision, making it easier to detect smaller changes between individuals (see blog here, Bierlich et al., 2021b). 

While both PCFG and ENP gray whales visit San Ignacio Lagoon in the winter, we assume that the photogrammetry data collected in the lagoon is mostly of ENP whales based on their considerably higher population abundance. We also assume that gray whales incur low energetic cost during migration, as gray whale oxygen consumption rates and derived metabolic rates are much lower during migration than on foraging grounds (Sumich, 1983). 

Interestingly, we found that gray whale body condition on their wintering grounds in San Ignacio Lagoon deteriorated across the study years leading up to the UME (2017-2019), while the body condition of PCFG whales on their foraging grounds in Oregon concurrently increased. These contrasting trajectories in body condition between ENP and PCFG whales implies that dynamic oceanographic processes may be contributing to temporal variability of prey available in the Arctic/sub-Arctic and PCFG range. In other words, environmental conditions that control prey availability for gray whales are different in the two areas. For the ENP population, this declining nutritive gain may be associated with environmental changes in the Arctic/sub-Arctic region that impacted the predictability and availability of prey. For the PCFG population, the increase in body condition across years may reflect recovery of the NE Pacific Ocean from the marine heatwave event in 2014-2016 (referred to as “The Blob”) that resulted with a period of low prey availability. These findings also indicate that the ENP population was primarily impacted in the die-off from the UME. 

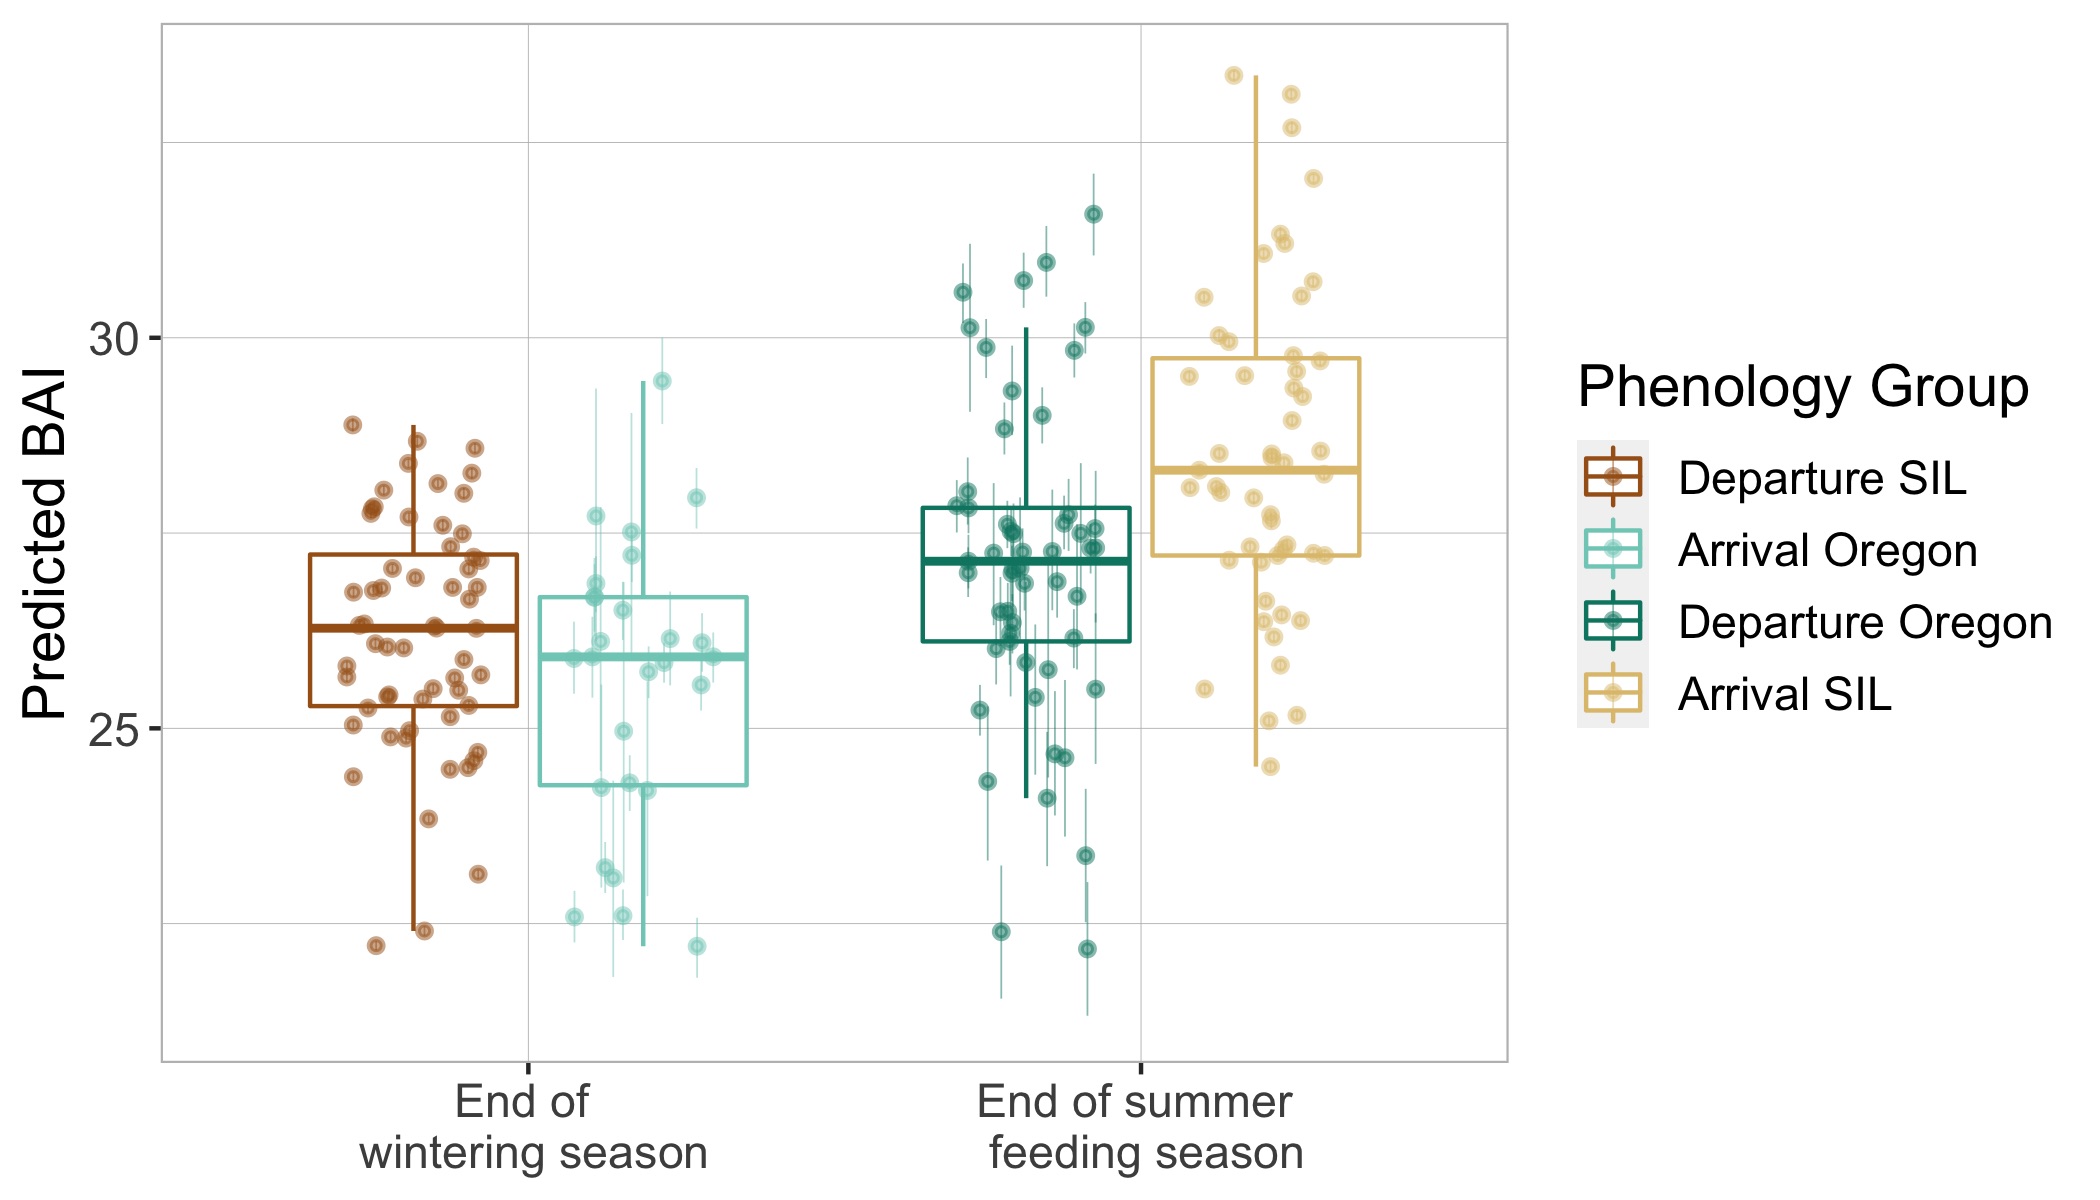
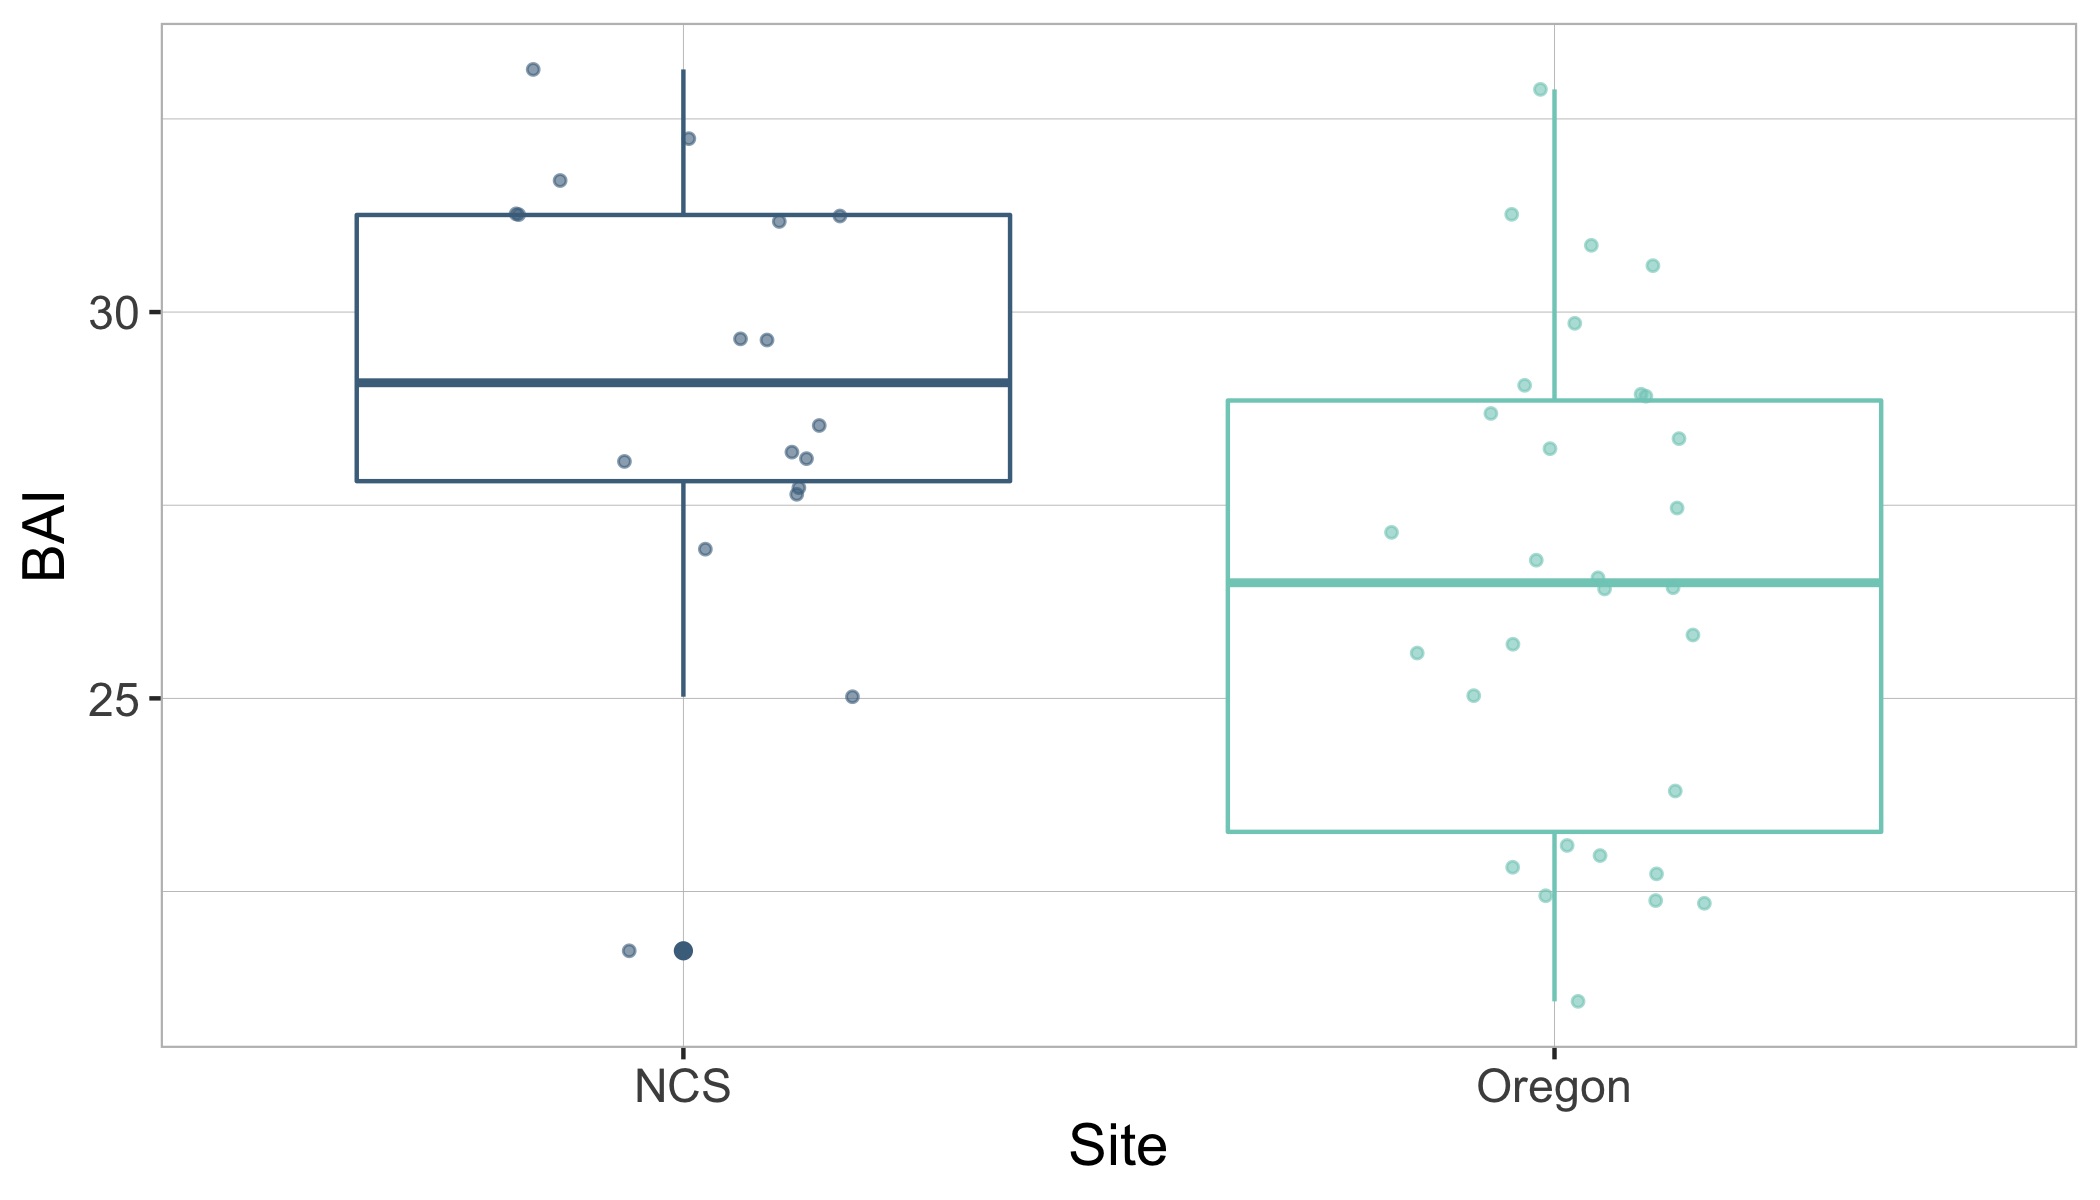
Surprisingly, the body condition of PCFG gray whales in Oregon was regularly and significantly lower than whales in San Ignacio Lagoon (Fig. 2). To further investigate this potential intrinsic difference in body condition between PCFG and ENP whales, we compared opportunistic photographs of gray whales feeding in the Northeastern Chukchi Sea (NCS) in the Arctic collected from airplane surveys. We found that the body condition of PCFG gray whales was significantly lower than whales in the NCS, further supporting our finding that PCFG whales overall have lower body condition than ENP whales that feed in the Arctic (Fig. 3). 

Figure 2. Boxplots showing the distribution of Body Area Index (BAI) values for gray whales imaged by drones in San Ignacio Lagoon (SIL), Mexico and Oregon, USA. The data is grouped by phenology group: End of summer feeding season (departure Oregon vs. arrival SIL) and End of wintering season (arrival Oregon vs. departure SIL). The group median (horizontal line), interquartile range (IQR, box), maximum and minimum 1.5*IQR (vertical lines), and outliers (dots) are depicted in the boxplots. The overlaid points represent the mean of the posterior predictive distribution for BAI of an individual and the bars represents the uncertainty (upper and lower bounds of the 95% HPD interval). Note how PCFG whales at then end of the feeding season (dark green) typically have lower body condition (as BAI) compared to ENP whales at the end of the feeding season when they arrive to SIL after migration (light brown).
Figure 3. Boxplots showing the distribution of Body Area Index (BAI) values of gray whales from opportunistic images collected from a plane in Northeaster Chukchi Sea (NCS) and from drones collected by the GEMM Lab in Oregon. The boxplots display the group median (horizontal line), interquartile range (IQR box), maximum and minimum 1.5*IQR (vertical lines), and outlies (dots). The overlaid points are the BAI values from each image. Note the significantly lower BAI of PCFG whales on Oregon feeding grounds compared to whales feeding in the Arctic region of the NCS.

This difference in body condition between PCFG and ENP gray whales raises some really interesting and prudent questions. Does the lower body condition of PCFG whales make them less resilient to changes in prey availability compared to ENP whales, and thus more vulnerable to climate change? If so, could this influence the reproductive capacity of PCFG whales? Or, are whales that recruit into the PCFG adapted to a smaller morphology, perhaps due to their specialized foraging tactics, which may be genetically inherited and enables them to survive with reduced energy stores?

These questions are on our minds here at the GEMM Lab as we prepare for our seventh consecutive field season using drones to collect data on PCFG gray whale body condition. As discussed in a previous blog by Dr. Alejandro Fernandez Ajo, we are combining our sightings history of individual whales, fecal hormone analyses, and photogrammetry-based body condition to better understand gray whales’ reproductive biology and help determine what the consequences are for these PCFG whales with lower body condition.

Did you enjoy this blog? Want to learn more about marine life, research, and conservation? Subscribe to our blog and get a weekly message when we post a new blog. Just add your name and email into the subscribe box below.

Loading

References

Bierlich, K. C., Hewitt, J., Bird, C. N., Schick, R. S., Friedlaender, A., Torres, L. G., … & Johnston, D. W. (2021). Comparing Uncertainty Associated With 1-, 2-, and 3D Aerial Photogrammetry-Based Body Condition Measurements of Baleen Whales. Frontiers in Marine Science, 1729.

Bierlich, K. C., Schick, R. S., Hewitt, J., Dale, J., Goldbogen, J. A., Friedlaender, A.S., et al. (2021b). Bayesian Approach for Predicting Photogrammetric Uncertainty in Morphometric Measurements Derived From Drones. Mar. Ecol. Prog. Ser. 673, 193–210. doi: 10.3354/meps13814

Burnett, J. D., Lemos, L., Barlow, D., Wing, M. G., Chandler, T., & Torres, L. G. (2018). Estimating morphometric attributes of baleen whales with photogrammetry from small UASs: A case study with blue and gray whales. Marine Mammal Science35(1), 108–139.

Christiansen, F., Rodrı́guez-González, F., Martı́nez-Aguilar, S., Urbán, J., Swartz, S., Warick, H., et al. (2021). Poor Body Condition Associated With an Unusual Mortality Event in Gray Whales. Mar. Ecol. Prog. Ser. 658, 237–252. doi:10.3354/meps13585

Hildebrand, L., Bernard, K. S., and Torres, L. G. (2021). Do Gray Whales Count Calories? Comparing Energetic Values of Gray Whale Prey Across Two Different Feeding Grounds in the Eastern North Pacific. Front. Mar. Sci. 8. doi: 10.3389/fmars.2021.683634

Stewart, J. D., and Weller, D. (2021). Abundance of Eastern North Pacific Gray Whales 2019/2020 (San Diego, CA: NOAA/NMFS)

Sumich, J. L. (1983). Swimming Velocities, Breathing Patterns, and Estimated Costs of Locomotion in Migrating Gray Whales, Eschrichtius Robustus. Can. J. Zoology. 61, 647–652. doi: 10.1139/z83-086

Torres, L.G., Bird, C., Rodrigues-Gonzáles, F., Christiansen F., Bejder, L., Lemos, L., Urbán Ramírez, J., Swartz, S., Willoughby, A., Hewitt., J., Bierlich, K.C. (2022). Range-wide comparison of gray whale body condition reveals contrasting sub-population health characteristics and vulnerability to environmental change. Frontiers in Marine Science. 9:867258. https://doi.org/10.3389/fmars.2022.867258

Drones with lasers: almost as cool as “sharks with laser beams attached to their heads”

Dr. KC Bierlich, Postdoctoral Scholar, OSU Department of Fisheries, Wildlife, & Conservation Sciences, Geospatial Ecology of Marine Megafauna (GEMM) Lab

The recent advancement in drones (or unoccupied aircraft systems, UAS) has greatly enhanced opportunities for scientists across a broad range of disciplines to collect high-resolution aerial imagery. Wildlife researchers in particular have utilized this technology to study large elusive animals, such as whales, to observe their behavior (see Clara Bird’s blog) and obtain morphological measurements via photogrammetry (see previous blog for a brief history on photogrammetry and drones). However, obtaining useful measurement data is not as easy as flying the drone and pressing record. For this blog, I will provide a brief overview on the basics of using photogrammetry to extract morphological measurements from images collected with drones, as well as the associated uncertainty from using different drone platforms. 

During my PhD at Duke University, I co-developed an open-source photogrammetry software called MorphoMetriX to measure whales in images I collected using drones (Fig. 1) (Torres and Bierlich, 2020) (see this blog for some fieldwork memoirs!). The software is designed to be flexible, simple to use, and customizable without knowledge of scripting languages. Using MorphoMetriX, measurements are made in pixels and then multiplied by the ground sampling distance (GSD) to convert to standard units (e.g., meters) (Fig. 2A). GSD represents the distance on the ground each pixel represents (i.e., the linear size of the pixel) and therefore sets the scale of the image (i.e., cm per pixel). Figure 2A describes how GSD is dependent on the camera sensor, focal length lens, and altitude. Thus, drones equipped with different cameras and focal length lenses will have inherent differences in GSD as altitude increases (Fig. 2B). A larger GSD increases the length each pixel represents in a photo and results in a lower resolution image, potentially obscuring important features in the photo and introducing measurement error.

Figure 1. An example of a Pacific Coast Feeding Group gray whale measured in MorphoMetriX (Torres & Bierlich, 2020).
Figure 2: Overview of photogrammetry methods and calculating ground sampling distance (GSD). A) Photogrammetry methods for how each image is scaled to convert measurements in pixels to standard units (e.g., meters). Altitude is the distance between the camera lens and whale (usually at the surface of the water). Figure from Torres and Bierlich (2020). B) The exact (not accounting for distortion or altitude error) ground sampling distance (GSD) for two drone platforms commonly used to obtain morphological measurements of cetaceans. The difference in GSD between the P4Pro and Inspire 1 is due to the difference in sensor width and focal lengths of the cameras used. Figure from Bierlich et al. (2021).

Obtaining accurate altitude information is a key component in obtaining accurate measurements. All drones are equipped with a barometer, which measures altitude from changes in pressure. In general, barometers usually yield low accuracy in the altitude recorded, particularly for low-cost sensors commonly found on small, off-the-shelf drones (Wei et al., 2016). Dawson et al. (2017) added a laser altimeter (i.e., LightWare SF11/C, https://www.mouser.com//datasheet//2//321//28054-SF11-Laser-Altimeter-Manual-Rev8-1371857.pdf) to a drone, which yields higher accuracy in the altitude recorded. Since then, several studies have adopted use of a laser altimeter to study different species of baleen whales (i.e., Gough et al., 2019; Christiansen et al., 2018).

The first chapter of my dissertation, which was published last year in Marine Ecology Progress Series, compared the accuracy of several drones equipped with different camera sensors, focal length lenses, and a barometer vs. laser altimeter (Bierlich et al., 2021). We flew each drone over a known sized object floating at the surface and collected images at various altitudes (between 10 – 120 m). We used the known size of the floating object to determine the percent error of each measurement at each altitude. We found that 1) there is a lot of variation in measurement error across the different drones when using a barometer to measure altitude and 2) using a laser altimeter dramatically reduces measurement error for each drone (Fig. 3).

Figure 3. The % error for measurements from different drones. Black dashed line represents 0% error (true length = 1.48 m). The gray dashed lines represent under- and over-estimation of the true length by 5% (1.41 and 1.55 m, respectively).

These findings are important because if a study is analyzing measurements that are from more than one drone, the uncertainty associated with those measurements must be taken into account to know if measurements are reliable and comparable. For instance, let’s say we are comparing the body length of two different populations and found that population A is significantly longer than population B. From looking at Figure 3, that significant difference in length between population A and B could be unreliable as the difference may be due to the bias introduced by the type of drone, camera sensor, focal length lens, and whether a barometer or laser altimeter was used for recording altitude. In other words, without incorporating uncertainty associated with each measurement, how do you trust your measurement? 

Hence, the National Institute of Standards and Technology (NIST) states that a measurement is complete only when accompanied by a quantitative statement of its uncertainty (Taylor & Kuyatt, 1994). In our Bierlich et al. (2021) study, we develop a Bayesian statistical model where we use the measurements of the known-sized object floating at the surface (what was used for Fig. 3) as training data to predict the lengths of unknown-sized whales. This Bayesian approach views data and the underlying parameters that generated the data (such as the mean or standard deviation) as random, and thus can be described by a statistical distribution. Using Bayes’ Theorem, a model of the observed data (called the likelihood function), is combined with prior knowledge pertaining to the underlying parameters (called the prior probability distribution) to form the posterior probability distribution, which serves as updated knowledge about the underlying parameter. For example, if someone told me they saw a 75 ft blue whale, I would not be phased. But if someone told me they saw a 150 ft blue whale, I would be skeptical – I’m using prior knowledge to determine the probability of this statement being true. 

The posterior probability distribution produced by this Bayesian approach can also serve as new prior information for subsequent analyses. Following this framework, we used the known-sized objects to first estimate the posterior probability distribution for error for each drone. We then used that posterior probability distribution for error specific to each drone platform as prior information to form a posterior predictive distribution for length of unknown-sized whales. The length of an individual whale can then be described by the mean of this second posterior predictive distribution, and its uncertainty defined as the variance or an interval around the mean (Fig. 4). 

Figure 4. An example of a posterior predictive distribution for total length of an individual blue whale. The black bars represent the uncertainty around the mean value (the black dot) – the longer black bars represent the 95% highest posterior density (HPD) interval, and the shorter black bars represent the 65% HPD interval. 

For over half a decade, the GEMM Lab has been collecting drone images of Pacific Coast Feeding Group (PCFG) of gray whales off the coast of Oregon to measure their morphology and body condition (see GRANITE Project Blog). We have been using several different types of drones equipped with different cameras, focal length lenses, barometers, and laser altimeters. These measurements from different drones will inherently have different levels of error associated with them, so adapting these methods for incorporating uncertainty will be key to ensure our measurements are comparable and analyses are robust. To do this, we fly over a known-sized board (1 m) at the start of each flight to use as training data to generate a posterior predictive distribution for length of the an unknown-sized PCFG gray whale that we fly over (Fig. 5). Likewise, we are working closely with several other collaborators who are also using different drones. Incorporating measurement uncertainty from drones used across research labs and in different environments will help ensure robust analyses and provide great opportunity for some interesting comparisons – such as differences in gray whale body condition on their feeding grounds in Oregon vs. their breeding grounds in Baja, Mexico, and morphological comparisons with other baleen whale species, such as blue and humpback whales. We are currently wrapping up measurement from thousands of boards (Fig. 5) and whales (Fig. 1) from 2016 – 2021, so stay tuned for the results!

Figure 5. An example of a known-sized object (1 m long board) used as training data to assess measurement uncertainty. 

References

Bierlich, K.C., Schick, R.S., Hewitt, J., Dale, J., Goldbogen, J.A., Friedlaender, A.S., Johnston D.J. (2021). A Bayesian approach for predicting photogrammetric uncertainty in morphometric measurements derived from UAS. Marine Ecology Progress Series. DOI: https://doi.org/10.3354/meps13814

Christiansen F, Vivier F, Charlton C, Ward R, Amerson A, Burnell S, Bejder L (2018) Maternal body size and condition determine calf growth rates in southern right whales. Mar Ecol Prog Ser 592: 267−281

Dawson SM, Bowman MH, Leunissen E, Sirguey P (2017) Inexpensive aerial photogrammetry for studies of whales and large marine animals. Front Mar Sci 4: 366

Gough, W.T., Segre, P.S., Bierlich, K.C., Cade, D.E., Potvin, J., Fish, F. E., Dale, J., di Clemente, J., Friedlaender, A.S., Johnston, D.W., Kahane-Rapport, S.R., Kennedy, J., Long, J.H., Oudejans, M., Penry, G., Savoca, M.S., Simon, M., Videsen, S.K.A., Visser, F., Wiley, D.N., Goldbogen, J.A. (2019). Scaling of swimming performance in baleen whales. Journal of Experimental Biology222(20).https://doi.org/10.1242/jeb.204172  

Taylor, B. N., and Kuyatt, C. E. (1994). Guidelines for Evaluating and Expressing the Uncertainty of NIST Measurement Results. Washington, DC: National Institute of Standards and Technology. 1–25.

Torres, W.I., & Bierlich, K.C. (2020). MorphoMetriX: a photogrammetric measurement GUI for morphometric analysis of megafauna. Journal of Open Source Software5(45), 1825. https://doi.org/10.21105/joss.01825  

Wei S, Dan G, Chen H (2016) Altitude data fusion utilizing differential measurement and complementary filter. IET Sci Meas Technol (Singap) 10: 874−879

Inter- and Transdisciplinary Sea Otter Research

By Dominique Kone, Masters Student, Marine Resource Management

As the human population continues to grow, so does our impact on marine environments. In many cases, these problems – such as microplastics, vessel noise, or depleted fisheries – are far too grand for any one person to tackle on their own and it takes a team effort to find adequate solutions. Experts within a single field (e.g. ecology, economics, genetics) have been collaborating to tackle these issues for decades, but there is an increasing interest and recognition of the importance in working with others outside one’s own discipline.

It’s not surprising that most collaborative efforts are between experts from the same field. It’s easier to converse with those with similar vocabulary, we often enjoy learning from our peers, and our thought-processes and problem-solving skills are typically very similar. However, as issues become more complex and stretch across disciplines, the need for interdisciplinary collaboration becomes more and more imperative. As a graduate student studying marine resource management, I’ve learned the great value in conducting interdisciplinary work. Yet, I still have much to learn if I want to continue to help find solutions to the many complex marine issues. Therefore, over the next year, I’ve committed to joining a interdisciplinary team of graduate students, as part of an NSF-funded fellowship program at Oregon State University (OSU), to further investigate a potential sea otter reintroduction to Oregon. Here, I provide a brief overview of the program and my team’s goals for the coming year.

Source: Hakai Magazine.

The fellowship program emphasizes both interdisciplinary and transdisciplinary approaches, so before I explain the program, it’s important to first understand these terms. In short, interdisciplinarity typically relates to experts from different fields analyzing, synthesizing, and coordinating their work as a whole (Choi & Pak 2006). Another way to think about this, in more practical terms, is if two or more experts share information and learn from one another; each expert can then individually apply that information or lessons-learned to their own line of work. In contrast, transdisciplinary work is slightly more collaborative, where experts work more hand-in-hand to develop a product or solution that transcends their disciplines’ traditional boundaries. The experts essentially create a product that would not have been possible working in isolation. In practice, the product(s) that stems from inter- and transdisciplinary work – if they truly are inter- or transdisciplinary by definition – is potentially very different.

Source: Dr. Shoshanah Jacobs.

With an increasing interest in interdisciplinary work, the National Science Foundation (NSF) developed the National Research Traineeship (NRT) program to encourage select universities to develop and implement innovative and transformative models for training graduate students in STEM disciplines. After soliciting proposals, the NSF awarded OSU one of these NRT projects to support OSU’s Risk and Uncertainty Quantification in Marine Science NRT Program. OSU’s NRT program was born out of the recognition that much of the complexity of marine issues is largely due to the uncertainty of natural and human systems. Therefore, the primary purpose of this program is to train the next generation of natural resource scientists and managers to be better equipped to study and manage complex marine systems, especially under extreme uncertainty and potential risk.

Source: Oregon State University.

This NRT program trains graduate students in three core concept areas: coupled natural human systems, big data, and risk and uncertainty analyses and communications. To learn these core concepts, students fulfil a minor that includes coursework in statistical inference, uncertainty quantification, risk analyses, earth system science, and social systems. In addition to the minor, students also conduct collaborative research in small (3-5 students) cross-disciplinary teams to address specific issues in marine resource management. Within each team, students come from different disciplines and fields, and must learn to work together to produce a transdisciplinary research product. Throughout the year, each team will develop a set of research questions to address their issue at hand, conduct research which links all their fields, and produce a transdisciplinary report summarizing the process they undertook and the end product. Most students who are accepted into the NRT program are awarded one-year fellowships, funded by the NSF.

At the start of this academic year, I was awarded one of these NRT fellowships to address the many issues and implications of a potential sea otter reintroduction to Oregon. Over the next year, I will be working with two other OSU graduate students with backgrounds in genetics and social sciences. Our task is to not only investigate the ecological implications – which I am currently doing for my own thesis – but we are to expand this investigation to also address many of the genetic, political, and social factors, as well. While each of us is capable of addressing one of these factors individually, the real test will be in finding linkages between each of our disciplines to make this project truly transdisciplinary.

Structure and vision of OSU’s NRT program. Source: Oregon State University.

Since our project started, we have worked to better understand each another’s expertise, interests, and the general need for a transdisciplinary project of this sort. After acquiring this base understanding, we spent a considerable amount of time developing research questions and potential methods for addressing our issue. Throughout this process, it’s already become apparent that each of us is starting to learn important teamwork and collaboration skills, including effective communication and explanation of complicated concepts, active listening, critical thinking, and constructive feedback.  While these skills are imperative for our research over the next year, they are also life-long skills that we’ll continue to use in our careers beyond graduate school.

As I’ve stated previously, learning to be an effective collaborator is extremely important to me. Getting the opportunity to work interdisciplinarily is what attracted me to my thesis, the marine resource management program, and the NRT program. By choosing to take my graduate education down this path, I’ve been fortunate to obtain important skills in collaboration, as well as work on a project that allows me to tackle real-world issues and creatively develop scientifically-based solutions. I have high hopes for this NRT project, and I’m excited to continue to conduct meaningful and targeted research over the next year with my new team.

2018-19 OSU NRT Cohort. Source: Oregon State University.

References:

Choi, B. C., and A. W. Pak. Multidisciplinarity, interdisciplinarity and transdisciplinarity in health research, service, education and policy: 1. Definitions, objectives, and evidence of effectiveness. Clinical and Investigative Medicine. 29(6): 351-64.