The Way Forward is the End

By Morgan O’Rourke-Liggett, M.S., Oregon State University, Department of Fisheries, Wildlife, and Conservation Sciences, Geospatial Ecology of Marine Megafauna Lab

It is the end.

I graduated with a Master’s degree.

This journey began 10 years ago when I visited colleges as a high school junior.

Begin with the end in mind. 

I knew I would major in science as an undergrad and focus on something more specific as a graduate student. Studying whales required a background in marine biology, which led to my undergraduate degree in oceanography with strong emphasis in fisheries and wildlife, policy, and ecology. My master’s degree was built on that and added specific skills in data collection, management, and analysis.

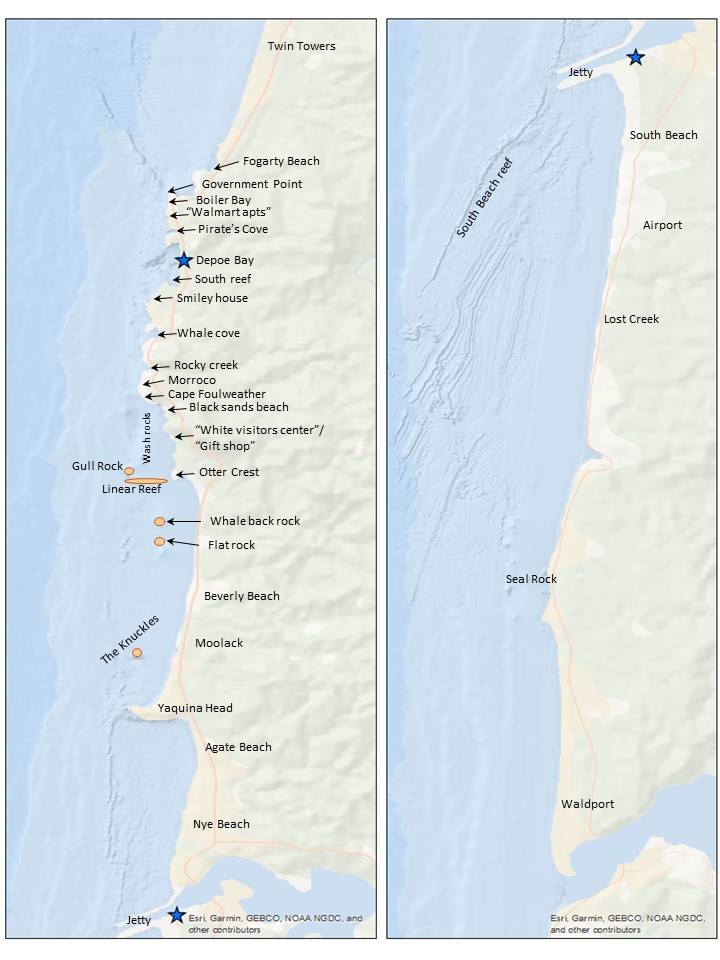
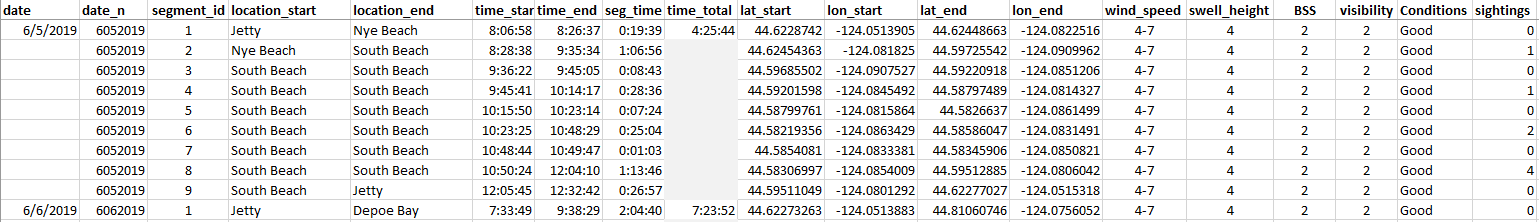
The last time I wrote a blog, I was sharing the details of the data management and intricacies of my master’s project. Part of what made that project so successful was knowing the end goal: we wanted to know the area surveyed based on visibility and a visual representation of it. This knowledge aided in the development of matrices for environmental conditions, assigning integer variables to text survey notes, and determining what toolboxes and packages would be the most appropriate for analysis.

As a visual learner, I like to sketch out what I am doing or draw it on a whiteboard in a concept board. This approach is something I have always done and was further reinforced as a necessary step in my programming classes early on in my master’s education. My professors would assign a problem that could be solved in programming by making a function or script of code. We were taught to write out what our end goals were and what inputs were available for the problem. From there, filling in what steps were needed would be added. That was a critical step that made writing many difficult Python and R for loops and functions easier to build.

This skill and mentality of “beginning with the end” in mind can also be useful in preparation for data collection. There are eleven common data types that are described with examples in Table 1. Understanding what data type is being collected could save several hours of data management and wrangling during the data analysis phase. From my experience in data analytics, some models yield more accurate results if the character data is manipulated to behave like an integer in R. Additionally, certain packages and toolboxes in R and GIS are only useful for certain data types.

Data TypeDefinitionExample
Integer (int)Numeric data without fractions-707, 0, 707
Floating point (float) or DoubleNumeric data with fractions707.07, 0.7, 707.00
Character (char)Single letter, digit, space, punctuation mark, symbola, !
String (str or text) or ComplexSequence of characters, digits, or symbolsHello, +1-999-666-3333
Boolean (bool) or LogicalTrue or false values0 (false), 1 (true)
Enumerated type (enum)Small set of predefined values that can be text or numericalrock (0), jezz (1)
ArrayList with a number of elements in a specific orderrock (0), jazz (1), blues (2), pop (3)
DataDate in YYYY-MM-DD fomat2021-09-28
TimeTime in hh:mm:ss format or a time interval between two events12:00:59
DatetimeStores a value of both YYYY-MM-DD hh:mm:ss2021-09-28
12:00:59
TimestampNumber of seconds that have elapsed since midnight, 1st January 1970 in UTC1632855600
Table 1. Table of the eleven most common data types with a short definition and an example of the data type. Table inspired by (Choudhury 2022).

Beginning with the end in mind allows more clarity and strategies to be efficient and achieve your goal. It develops a better understanding of why each stage of data collection and analysis is important; why each stage in a career is important. It provides a road map for what will, undoubtedly, be an incredible learning experience.

References

Choudhury, A. 2022. What are Data Types and Why are They Important. https://amplitude.com/blog/data-types#datetime

Did you enjoy this blog? Want to learn more about marine life, research, and conservation? Subscribe to our blog and get a weekly message when we post a new blog. Just add your name and email into the subscribe box below.

Loading

Spreadsheets, ArcGIS, and Programming! Oh My!

By Morgan O’Rourke-Liggett, Master’s Student, Oregon State University, Department of Fisheries, Wildlife, and Conservation Sciences, Geospatial Ecology of Marine Megafauna Lab

Avid readers of the GEMM Lab blog and other scientists are familiar with the incredible amounts of data collected in the field and the informative figures displayed in our publications and posters. Some of the more time-consuming and tedious work hardly gets talked about because it’s the in-between stage of science and other fields. For this blog, I am highlighting some of the behind-the-scenes work that is the subject of my capstone project within the GRANITE project.

For those unfamiliar with the GRANITE project, this multifaceted and non-invasive research project evaluates how gray whales respond to chronic ambient and acute noise to inform regulatory decisions on noise thresholds (Figure 1). This project generates considerable data, often stored in separate Excel files. While this doesn’t immediately cause an issue, ongoing research projects like GRANITE and other long-term monitoring programs often need to refer to this data. Still, when scattered into separate long Excel files, it can make certain forms of analysis difficult and time-consuming. It requires considerable attention to detail, persistence, and acceptance of monotony. Today’s blog will dive into the not-so-glamorous side of science…data management and standardization!

Figure 1. Infographic for the GRANITE project. Credit: Carrie Ekeroth

Of the plethora of data collected from the GRANITE project, I work with the GPS trackline data from the R/V Ruby, environmental data recorded on the boat, gray whale sightings data, and survey summaries for each field day. These come to me as individual yearly spreadsheets, ranging from thirty entries to several thousand. The first goal with this data is to create a standardized survey effort conditions table. The second goal is to determine the survey distance from the trackline, using the visibility for each segment, and calculate the actual area surveyed for the segment and day. This blog doesn’t go into how the area is calculated. Still, all these steps are the foundation for finding that information so the survey area can be calculated.

The first step requires a quick run-through of the sighting data to ensure all dates are within the designated survey area by examining the sighting code. After the date is a three-letter code representing a different starting location for the survey, such as npo for Newport and dep for Depoe Bay. If any code doesn’t match the designated codes for the survey extent, those are hidden, so they are not used in the new table. From there, filling in the table begins (Figure 2).

Figure 2. A blank survey effort conditions table with each category listed at the top in bold.

Segments for each survey day were determined based on when the trackline data changed from transit to the sighting code (i.e., 190829_1 for August 29th, 2019, sighting 1). Transit indicated the research vessel was traveling along the coast, and crew members were surveying the area for whales. Each survey day’s GPS trackline and segment information were copied and saved into separate Excel workbook files. A specific R code would convert those files into NAD 1983 UTM Zone 10N northing and easting coordinates.

Those segments are uploaded into an ArcGIS database and mapped using the same UTM projection. The northing and easting points are imported into ArcGIS Pro as XY tables. Using various geoprocessing and editing tools, each segmented trackline for the day is created, and each line is split wherever there was trackline overlap or U shape in the trackline that causes the observation area to overlap. This splitting ensures the visibility buffer accounts for the overlap (Figure 3).

Figure 3. Segment 3 from 7/22/2019 with the visibility of 3 km portrayed as buffers. There are more than one because the trackline was split to account for the overlapping of the survey area. This approach accounts for the fact that this area where all three buffers overlap was surveyed 3 times.

Once the segment lines are created in ArcGIS, the survey area map (Figure 4) is used alongside the ArcGIS display to determine the start and end locations. An essential part of the standardization process is using the annotated locations in Figure 4 instead of the names on the basemap for the location start and endpoints. This consistency with the survey area map is both for tracking the locations through time and for the crew on the research vessel to recognize the locations. The step assists with interpreting the survey notes for conditions at the different segments. The time starts and ends, and the latitude and longitude start and end are taken from the trackline data.

Figure 4. Map of the survey area with annotated locations (Created by L. Torres, GEMM Lab)

The sighting data includes the number of whales sighted, Beaufort Sea State, and swell height for the locations where whales were spotted. The environmental data from the sighting data is used as a guide when filling in the rest of the values along the trackline. When data, such as wind speed, swell height, or survey condition, is not explicitly given, matrices have been developed in collaboration with Dr. Leigh Torres to fill in the gaps in the data. These matrices and protocols for filling in the final conditions log are important tools for standardizing the environmental and condition data.

The final product for the survey conditions table is the output of all the code and matrices (Figure 5). The creation of this table will allow for accurate calculation of survey effort on each day, month, and year of the GRANITE project. This effort data is critical to evaluate trends in whale distribution, habitat use, and exposure to disturbances or threats.

Figure 5. A snippet of the completed 2019 season effort condition log.

The process of completing the table can be a very monotonous task, and there are several chances for the data to get misplaced or missed entirely. Attention to detail is a critical aspect of this project. Standardizing the GRANITE data is essential because it allows for consistency over the years and across platforms. In describing this aspect of my project, I mentioned three different computer programs using the same data. This behind-the-scenes work of creating and maintaining data standardization is critical for all projects, especially long-term research such as the GRANITE project.

Did you enjoy this blog? Want to learn more about marine life, research, and conservation? Subscribe to our blog and get a weekly message when we post a new blog. Just add your name and email into the subscribe box below.

Loading

Marine Science Pride: The Significance of Representation in the Workplace

Morgan O’Rourke-Liggett, Graduate Student, OSU Department of Fisheries, Wildlife, and Conservation Sciences, Geospatial Ecology of Marine Megafauna Lab

October is LGBTQIA2S+ (Lesbian, Gay, Bisexual, Transgender, Intersex, Asexual, Aromatic, Agender, Two-Spirit, plus) History Month in the United States. As a marine biologist and member of the LGBTQIA2S+ community, I publicly came out in 2016. Since then, I have been navigating coming out in the workplace. As a graduate student, I’m using this time to practice being an “out” marine biologist.

OutInSTEM, a student organization at Oregon State University (OSU), supports LGBTQIA2S+ students in science, technology, engineering, and mathematics (STEM). It provides mentorship and connection with faculty and other students in the LGBTQIA2S+ community. Another goal is to increase visibility in the profession and foster confidence in students as they continue their professional careers. Other initiatives like OutInSTEM exist in many forms across agencies and countries.

Within the National Oceanographic and Atmospheric Administration (NOAA), the National Marine Sanctuary System created the initiative #PrideInTheOcean to celebrate both Ocean Month and LGBTQIA2S+ Pride Month, which both occur in June in the United States. This program partners with Pride Outside, a group connecting the LGBTQIA2S+ community through outdoor activities.

Some notable LGBTQIA2S+ scientists in marine studies are members and alumni of the Marine Mammal Institute at OSU. One is Dominique Kone (He/Him) who is now a marine ecologist and science officer at the California Ocean Science Trust. He is a graduate of OSU’s Marine Mammal Institute and the GEMM laboratory. Dominique wrote about his story here on Ocean Wise. Another is Dr. Daniel Palacios (He/Him), Endowed Associate Professor in Whale Habitats and lead of the Whale Habitat, Ecology, and Telemetry laboratory (WHET Lab) at OSU’s Marine Mammal Institute. Read Daniel’s story here on 500 Queer Scientists.

Visibility and representation are critical for multiple reasons. One is creating an atmosphere where LGBTQIA2S+ members feel validated in their experiences, allowing them to express their opinions, and recognize their contributions. Without the stress of facing potential harassment in the workplace, we can be our genuine selves leading to a healthier work environment, increased engagement, and better results.

Not everyone can be “out” in all aspects of their life. Some may be out publicly, but not at work; only out to select friends, etc. If it’s not safe (financially, physically, etc.), some people are never able to come out. Personal safety usually drives this decision. Some don’t want to expose aspects of their personal life in the workplace. Others hide it until after they have been hired or passed the probation period. Some never share due to fear of reprisal, such as being passed over for a promotion.

Despite the presence of state and federal anti-discrimination policies, micro and macro-aggressions occur in the workplace, such as transgender people having to fight for appropriate housing assignments. As a fisheries biological technician in Alaska, I was moved around several times as they had never dealt with a non-binary, transmasculine professional in their dorm rooms. I was forced to move three times and was frequently misgendered and deadnamed (deadnaming is calling a transgender person by an incorrect name, often their birth name and no longer use upon transitioning). It was a difficult situation and negatively affected my personal and work experience. I felt demoralized, disheartened, and depressed. I lost my respect for the agency and my long-standing dream of working in Alaska. 

To avoid repeating my experience in Alaska, perhaps we can think critically about our labs and workspaces. The following is a non-exhaustive list of things to consider when including and thinking about LGBTQIA2S+ co-workers:

  • How are transgender and other gender-diverse co-workers treated?
  • Does your place of work have gender-inclusive restrooms on every floor of the building?
  • Are dorms or berths separated by binary gender?
  • Do the men’s restrooms have menstruation products and baby changing station(s)?
  • Does your field gear include sizing options for people who have non-conforming bodies?
  • If your lab does events including significant others, is the environment welcoming of same-gender spouses? How do you treat singles?
  • Are your field locations in places that could be dangerous for LGBTQIA2S+ and other marginalized identities threatened by extremists?
  • Do you have intake forms with gender or sex on them? Is it necessary?
  • Do you use gendered language when non-gendered language can be used? (Examples from Grammarly)
  • Have you examined your own preconceptions and possible role in microaggressions? (What is a microaggression? Common LGBTQIA2S+ microaggressions)

We work in an incredible profession with smart, kind, and fun co-workers. Let’s take action to ensure it is also safe and inclusive for all members.

If you wish to read other LGBTQIA2S+ scientists’ stories you can find them at https://500queerscientists.com/, https://ocean.org/blog/international-lgbtqia-stem-day-role-models-in-ocean-science/, and follow #PrideInSTEM , #LGBTQSTEMDay , and #PrideInTheOcean on social media. The first four articles in the reference section for this blog contain other peer-reviewed studies and testimonials about the importance of LGBTQIA2S+ representation in the workplace and fields ranging from geosciences to sports media.

Did you enjoy this blog? Want to learn more about marine life, research, and conservation? Subscribe to our blog and get a weekly message when we post a new blog. Just add your name and email to the subscribe box below!

Loading

References

Fisher, Kathleen Quardokus, et al. “Developing scientists as champions of diversity to transform the geosciences.” Journal of Geoscience Education 67.4 (2019): 459-471.

Johns, Nikara. “Pride Month: Nike’s Jarvis Sam on the Importance of Queer & Black Representation in the Workplace.” 18 June 2021. Footwear News.

Kilicaslan, Jan and Melissa Petrakis. “Heteronormative models of health-care delivery: investigating staff knowledge and confidence to meet the needs of LGBTIQ+ people.” Social Work in Health Care 58.6 (2019): 612-632.

Magrath, Rory. “”Progress…Slowly, but Surely”: The Sports Media Workplace, Gay Sports Journalists, and LGBT Media Representation in Sport.” Journalism Studies 21.2 (2020): 2545-270.

Palacios, Daniel. Daniel Palacios. 2022. https://500queerscientists.com/daniel-palacios/

Robinson, Chloe. International LGBTQIA2S+ STEM Day: Role Models in Ocean Science. 18 November 2021. Webpage. https://ocean.org/blog/international-lgbtqia-stem-day-role-models-in-ocean-science/