Do gray whales count calories? New GEMM Lab publication compares energetic values of prey available to gray whales on two feeding grounds in the eastern North Pacific

By Lisa Hildebrand, PhD student, OSU Department of Fisheries, Wildlife, & Conservation Sciences, Geospatial Ecology of Marine Megafauna Lab

Predators have high energetic requirements that must be met to ensure reproductive success and population viability. For baleen whales, this task is particularly challenging since their foraging seasons are typically limited to short temporal windows during summer months when they migrate to productive high latitude environments. Foraging success is a balancing act whereby baleen whales must maximize the amount of energy they intake, while minimizing the amount of energy they expend to obtain food. Maximization of energy intake can be achieved by targeting the most beneficial prey. How beneficial a particular prey type (or prey patch) is can depend on a number of factors such as abundance, density, quality, size, and availability. Determining why baleen whales target particular prey types or patches is an important factor to enhance our understanding of their ecology and can ultimately aid in informing their management and conservation.

The GEMM Lab has several research projects in Newport and Port Orford, Oregon, on the Pacific Coast Feeding Group (PCFG), which is a sub-group of gray whales from the Eastern North Pacific (ENP) population. While ENP gray whales feed in the Bering, Chukchi, and Beaufort Seas (Arctic) in the summer months, the PCFG utilizes the range from northern California, USA to northern British Columbia, Canada. Our work to date has revealed a number of new findings about the PCFG including that they successfully gain weight during the summer on Oregon foraging grounds (Soledade Lemos et al. 2020). Furthermore, females that consistently use the PCFG range as their foraging grounds have successfully reproduced and given birth to calves (Calambokidis & Perez 2017). Yet, the abundance of the PCFG (~250 individuals; Calambokidis et al. 2017) is two orders of magnitude smaller than the ENP population (~20,000; Stewart & Weller 2021). So, why do more gray whales not use the PCFG range as their foraging grounds when it provides a shorter migration while also allowing whales to meet their high energetic requirements and ensure reproductive success? There are several hypotheses regarding this ecological mystery including that prey abundance, density, quality, and/or availability are higher in the Arctic than in the PCFG range, thus justifying the much larger number of gray whales that migrate further north for the summer feeding season. 

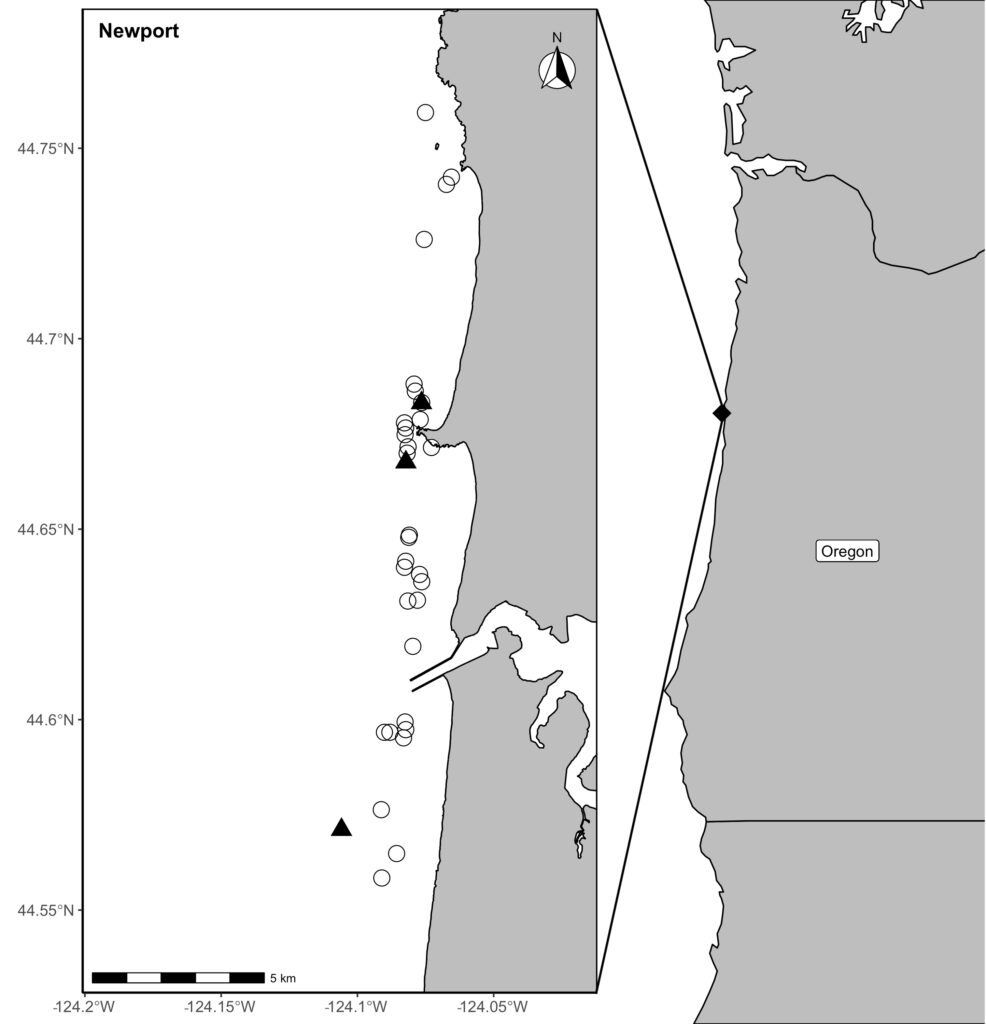
Figure 1. Locations of prey samples collected with a light trap (open circles) or opportunistic collections of surface swarms of crab larvae (black triangles) in Newport, along the Oregon coast in the Pacific Northwest coast of the United States.

Our recent paper in Frontiers in Marine Science addressed the hypothesis that prey quality in the Arctic is higher than that of PCFG prey. To test this hypothesis, we first determined the quality (energetic value) of nearshore Oregon zooplankton species that PCFG gray whales are assumed to feed on (based on observations of fine-scale spatial and temporal overlap of foraging gray whales and sampled zooplankton). We obtained prey samples from nearshore reefs along the Oregon coast (Figure 1) as part of the GRANITE project using a light trap, which is a modified water jug with a weight and two floats attached to it, allowing the trap to sit approximately 1 meter above the seafloor. The trap contained a light which attracted zooplankton and effectively captured epibenthic prey of gray whales. Traps were left to soak overnight in locations where gray whales had been observed feeding extensively and collected the following morning. After identifying each specimen to species level and sorting them into reproductive stages, we used a bomb calorimeter to determine the caloric content of each species by month, year, and reproductive stage. We then compared these values to the literature-derived caloric value of the predominant benthic amphipod species that  ENP gray whales feed on in the Arctic. These comparisons allowed us to extrapolate the caloric values gained from each prey type to estimated energetic requirements of pregnant and lactating female gray whales (Villegas-Amtmann et al. 2017). 

Figure 2. Median caloric content and interquartile ranges by (A) species, (B) reproductive stage, and (C) month. Sizes of the zooplankton images are scaled at actual ratios relative to one another.

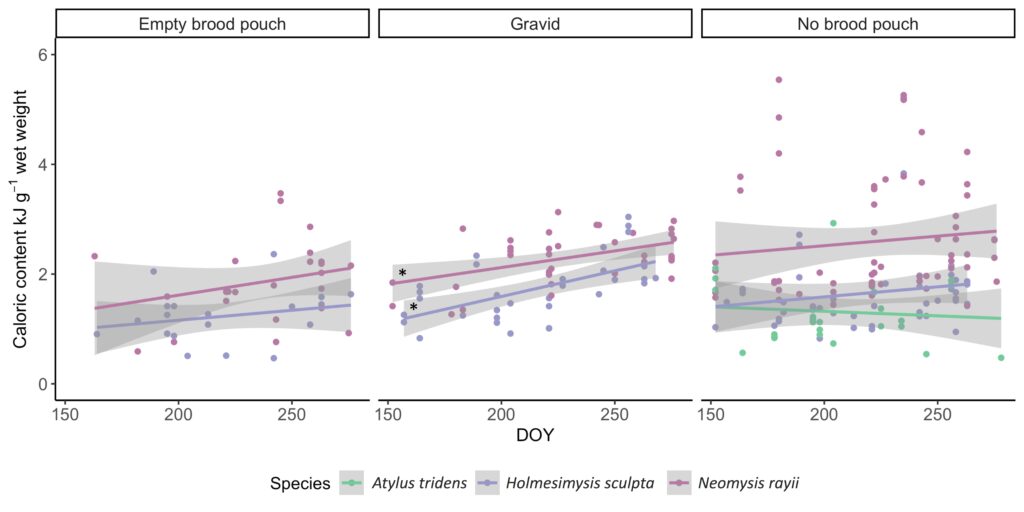
So, what did we find? Our sampling along the Oregon coast revealed six predominant zooplankton species: two mysid shrimp (Neomysis rayiiHolmesimysis sculpta), two amphipods (Atylus tridensPolycheria osborni), and two types of crab larvae (Dungeness crab megalopae, porcelain crab larvae). These six Oregon prey species showed significant differences in their caloric values, with N. rayii and Dungeness crab megalopae having significantly higher calories per gram than the other prey species (Figure 2), though Dungeness crab megalopae stood out as the caloric gold mines for feeding gray whales in the PCFG range. Furthermore, month and reproductive stage also influenced  the caloric content of some prey species, with gravid (aka pregnant) female mysid shrimp significantly increasing in calories throughout the summer (Figure 3).

Figure 3. Caloric content of different reproductive stages as a function of day of year (DOY; ranging from June to October) for the mysids Holmesimysis sculpta and Neomysis rayii, and the amphipod Atylus tridens. A. tridens is only represented on one panel due to small sample size of this species for the empty brood pouch and gravid reproductive stages. Asterisks indicate significant regressions (p<0.05).

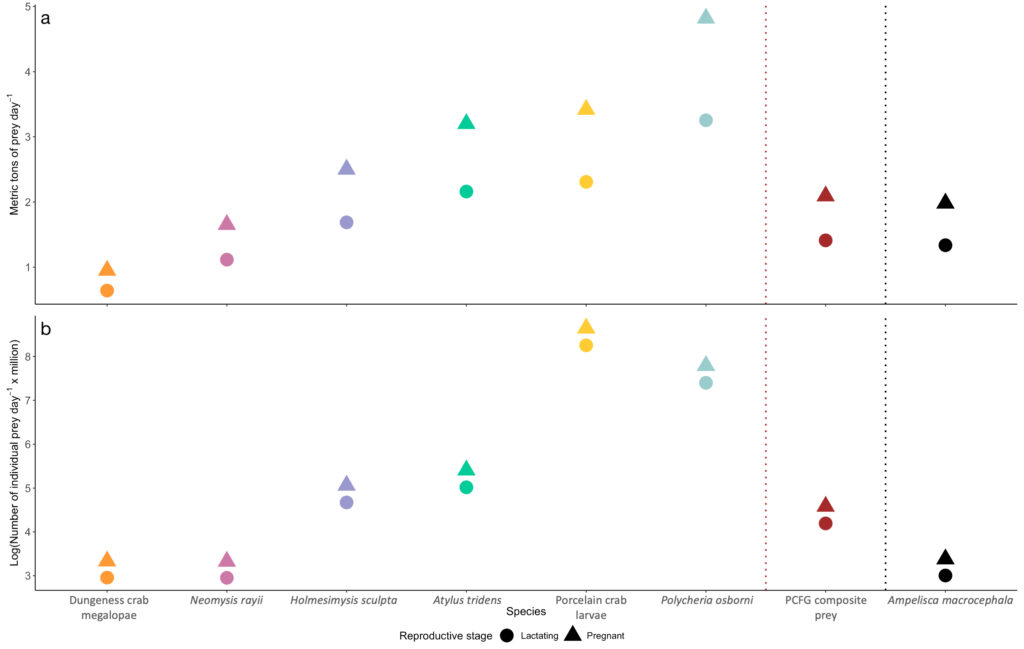
The comparison of our Oregon prey caloric values to the predominant Arctic amphipod (Ampelisca macrocephala) proved our hypothesis wrong:  Arctic amphipods do not have higher caloric value than Oregon prey, which would have help to explain why many more gray whales feed in the Arctic. We found that two Oregon prey species (N. rayii and Dungeness crab megalopae) have higher caloric values than A. macrocephala. If we translate the caloric contents of these prey to gray whale energetic needs, these differences mean that lactating and pregnant gray whales feeding in the PCFG area would need between 0.7-1.03 and 0.22-0.33 metric tons of prey less per day if they fed on Dungeness crab megalopae or N. rayii, respectively, than a whale feeding on Arctic A. macrocephala (Figure 4). 

Figure 4. Daily prey requirements (A: metric tons; B: number of individuals) needed by pregnant and lactating female gray whales to meet their energetic requirements on the foraging ground. Energetic requirement estimates obtained from Villegas-Amtmann et al. (2017). Note the logarithmic scale of y-axis in panel (B).

If quality were the only prey metric that gray whales used to evaluate which food to eat, then it would make very little sense for so many gray whales to migrate to the Arctic when there are prey types of equal and greater quality available to them in the PCFG range. However, quality is not the only metric that influences gray whale foraging decisions. We therefore posit that the abundance, density, and availability of benthic amphipods in the Arctic are higher than the prey species found in the PCFG range. In fact, knowledge of the pulsed reproductive cycle of Dungeness and porcelain crabs allows us to conclude that the larvae of these two species are only available for a few weeks in the late spring and early summer on the Oregon coast. While mysid shrimp, such as N. rayii, are continuously available in the PCFG range throughout the summer, they may occur in less dense and more patchy aggregations than Arctic benthic amphipods. However, current estimates of prey density and abundance for either region are not available, and we do not have data on the energetic costs of the different foraging strategies. While there are still several unknowns, we have documented that higher prey quality in the Arctic is not the reason for the difference in gray whale foraging ground use in the eastern North Pacific.

References

Calambokidis, J., & Perez, A. 2017. Sightings and follow-up of mothers and calves in the PCFG and implications for internal recruitment. IWC Report SC/A17/GW/04 for the Workshop on the Status of North Pacific Gray Whales (La Jolla: IWC).

Calambokidis, J., Laake, J., & Perez, A. 2017. Updated analysis of abundance and population structure of seasonal gray whales in the Pacific Northwest, 1996-2015. IWC Report SC/A17/GW/05 for the Workshop on the Status of North Pacific Gray Whales (La Jolla: IWC).

Soledade Lemos, L., Burnett, J. D., Chandler, T. E., Sumich, J. L., & Torres, L. G. 2020. Intra- and inter-annual variation in gray whale body condition on a foraging ground. Ecosphere 11(4):e03094.

Stewart, J. D., & Weller, D. W. 2021. Abundance of eastern North Pacific gray whales 2019/2020. Department of Commerce, NOAA Technical Memorandum NMFS-SWFSC-639. United States: NOAA. doi:10.25923/bmam-pe91.

Villegas-Amtmann, S., Schwarz, L. K., Gailey, G., Sychenko, O., & Costa, D. P. 2017. East or west: the energetic cost of being a gray whale and the consequence of losing energy to disturbance. Endangered Species Research 34:167-183.

Rock-solid GRANITE: Scaling the disturbance response of individual whales up to population level impacts

By Lisa Hildebrand, PhD student, OSU Department of Fisheries & Wildlife, Geospatial Ecology of Marine Megafauna Lab

Since early May, much of the GEMM Lab has been consumed by the GRANITE project, which stands for Gray whale Response to Ambient Noise Informed by Technology and Ecology. Two weeks ago, PhD student Clara Bird discussed our field work preparations, and since May 20th we have conducted five successful days of field work (and one unsuccessful day due to fog). If you are now expecting a blog about the data we have collected so far and whales we encountered, I am sorry to disappoint you. Rather, I want to take a big step back and provide the context of the GRANITE project as a whole, explain why this project and data collection is so important, and discuss what it is that we hope to achieve with our ever-growing, multidisciplinary dataset and team.

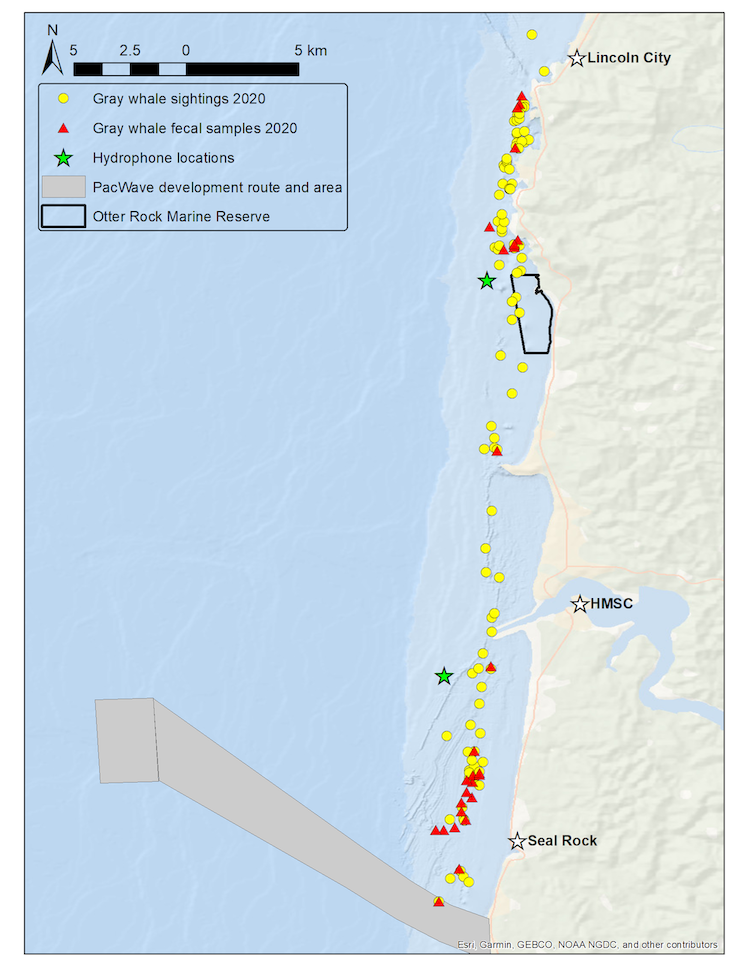
We use the Pacific Coast Feeding Group (PCFG) of gray whales that forage off the Oregon coast as our study system to better understand the ecological and physiological response of baleen whales to multiple stressors. Our field methodology includes replicate physiological and ecological sampling of this accessible baleen whale population with synoptic measurement of multiple types of stressors. We collect fecal samples for hormone analysis, conduct drone overflights of whales to collect body condition and behavioral data, record the ambient soundscape through deployment of two hydrophones, and conduct whale photo-identification to link all data streams to each individual whale of known sex, estimated age, and reproductive status. We resample these data from multiple individuals within and between summer foraging seasons, while exposed to different potential stressors occurring at different intensities and temporal periods and durations. The hydrophones are strategically placed with one in a heavily boat-trafficked (and therefore noisy) area close to the Port of Newport, while the second is located in a relatively calm (and therefore quieter) spot near the Otter Rock Marine Reserve (Fig. 1). These hydrophones provide us with information about both natural (e.g. killer whales, wind, waves) and anthropogenic (e.g. boat traffic, seismic survey, marine construction associated with PacWave wave energy facility development) noise that may affect gray whales. During sightings with whales, we also drop GoPro cameras and sample for prey to better understand the habitats where whales forage and what they might be consuming.

Figure 1. Map of GRANITE study area from Seal Rock to Lincoln City with gray whale sightings (yellow circles) and and fecal samples collected (red triangles) from the 2020 field season. Green stars represent the two hydrophone locations. Source: L. Torres.

GEMM Lab PI Dr. Leigh Torres initiated this research project in 2015 and established partnerships with acoustician Dr. Joe Haxel and (then) PhD student Dr. Leila Lemos. Since then, the team working on this project has grown considerably to provide expertise in the various disciplines that the project integrates. Leigh is currently joined at the GRANITE helm by 4 co-PIs: Dr. Haxel, endocrinologist Dr. Kathleen Hunt, biological statistician Dr. Leslie New, and physiologist Dr. Loren Buck. Drs. Alejandro Fernandez Ajo, KC Bierlich and Enrico Pirotta are postdoctoral scholars who are working on the endocrinology, photogrammetry, and biostatistical modelling components, respectively. Finally, Clara and myself are partially funded through this project for our PhD research, with Clara focusing on the links between behavior, body condition, individualization, and habitat, while I am tackling questions about the recruitment and site fidelity of the PCFG (more about these topics below). 

Faculty Research Assistant Todd Chandler supervises PhD student Clara Bird during her maiden drone flight over a whale. Source: L. Torres.

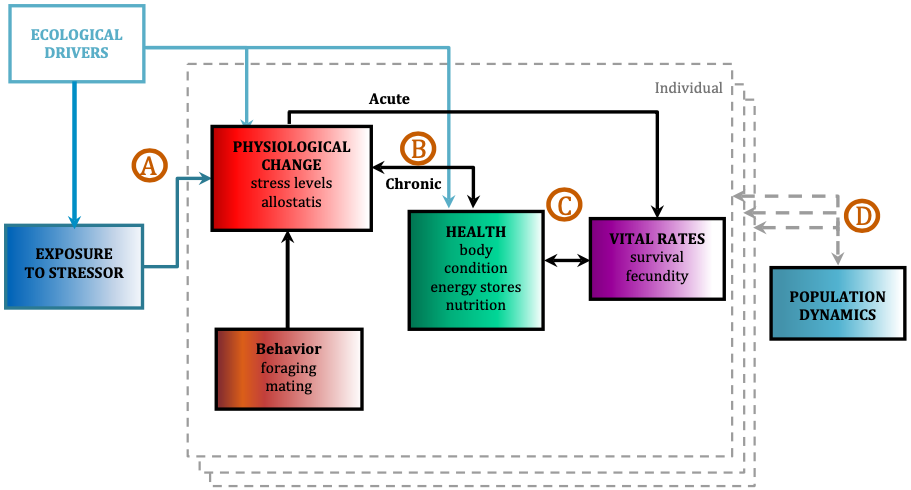
The ultimate goal of this project is to use the PCFG as a case study to quantify baleen whale physiological response to different stressors and model the subsequent impacts on the population by implementing our long-term, replicate dataset into a framework called Population consequences of disturbance (PCoD; Fig. 2). PCoD is built upon the underlying concept that changes in behavior and/or physiology caused by disturbance (i.e. noise) affect the fitness of individuals by impacting their health and vital rates, such as survival, reproductive success, and growth rate (Pirotta et al. 2018). These impacts at the individual level may (or may not) affect the population as a whole, depending on what proportion of individuals in the population are affected by the disturbance and the intensity of the disturbance effect on each individual. The PCoD framework requires quantification of four stages: a) the physiological and/or behavioral changes that occur as a result of exposure to a stressor (i.e. noise), b) the acute effects of these physiological and/or behavioral responses on individual vital rates, and their chronic effects via individual health, c) the way in which changes in health may affect the vital rates of individuals, and d) how changes in individual vital rates may affect population dynamics (Fig. 2; Pirotta et al. 2018). While four stages may not sound like a lot, the amount and longevity of data needed to quantify each stage is immense. 

Figure 2. Conceptual framework of the population consequences of disturbance (PCoD). Letters (A-D) represent the four stages that require quantification in order for PCoD to be implemented. Each colored box represents external (ecological drivers, stressors) and internal (physiology, health, vital rates, behavior) factors that can change over time that are measured for each individual whale (dashed grey boundary line). The effects are then integrated across all individuals in the population to project their effects on the population’s dynamics. Figure and caption adapted from Pirotta et al. 2018.

The ability to detect a change in behavior or physiology often requires an understanding of what is “normal” for an individual, which we commonly refer to as a baseline. The best way to establish a baseline is to collect comprehensive data over a long time period. With our data collection efforts since 2015 of fecal samples, drone flights and photo identification, we have established useful baselines of behavioral and physiological data for PCFG gray whales. These baselines are particularly impressive since it is typically difficult to collect repeated measurements of hormones and body condition from the same individual baleen whale across multiple years. These repeated measurements are important because, like all mammals, hormones and body condition vary across life history phases (i.e., with pregnancy, injury, or age class) and across time (i.e., good or bad foraging conditions). To achieve these repeated measurements, GRANITE exploits the high degree of intra- and inter-annual site fidelity of the PCFG, their accessibility for study due to their affinity for nearshore habitat use, and the long-term sighting history of many whales that provides sex and approximate age information. Our work to-date has already established a few important baselines. We now know that the body condition of PCFG gray whales increases throughout a foraging season and can fluctuate considerably between years (Soledade Lemos et al. 2020). Furthermore, there are significant differences in body condition by reproductive state, with calves and pregnant females displaying higher body conditions (Soledade Lemos et al. 2020). Our dataset has also allowed us to validate and quantify fecal steroid and thyroid hormone metabolite concentrations, providing us with putative thresholds to identify a stressed vs. not stressed whale based on its hormone levels (Lemos et al. 2020).

PhD student Lisa Hildebrand and GRANITE co-PI Dr. Kathleen Hunt collecting a fecal sample. Source: L. Torres.

We continue to collect data to improve our understanding of baseline PCFG physiology and behavior, and to detect changes in their behavior and physiology due to disturbance events. All these data will be incorporated into a PCoD framework to scale from individual to population level understanding of impacts. However, more data is not the only thing we need to quantify each of the PCoD stages. The implementation of the PCoD framework also depends on understanding several aspects of the PCFG’s population dynamics. Specifically, we need to know whether recruitment to the PCFG population occurs internally (calves born from “PCFG mothers” return to the PCFG) or externally (immigrants from the larger Eastern North Pacific gray whale population joining the PCFG as adults). The degree of internal or external recruitment to the PCFG population should be included in the PCoD model as a parameter, as it will influence how much individual level disturbance effects impact the overall health and viability of the population. Furthermore, knowing residency times and home ranges of whales within the PCFG is essential to understand exposure durations to disturbance events. 

To assess both recruitment and residency patterns of the PCFG, I am undertaking a large photo-identification effort, which includes compiling sightings and photo data across many years, regions, and collaborators. Through this effort we aim to identify calves and their return rate to the population, the rate of new adult recruits to the population, and the spatial residency of individuals in our study system. Although photo-id is a basic, commonplace method in marine mammal science, its role is critical to tracking individuals over time to understand population dynamics (in a non-invasive manner, no less). A large portion of my PhD research will focus on the tedious yet rewarding task of photo-id data management and matching in order to address these pressing knowledge gaps on PCFG population dynamics needed to implement the PCoD model that is an ultimate goal of GRANITE. I am just beginning this journey and have already pinpointed many analytical and logistical hurdles that I need to overcome. I do not anticipate an easy path to addressing these questions, but I am extremely eager to dig into the data, reveal the patterns, and integrate the findings into our rock-solid GRANITE project.  

Funding for the GRANITE project comes from the Office of Naval Research, the Department of Energy, Oregon Sea Grant, the NOAA/NMFS Ocean Acoustics Program, and the OSU Marine Mammal Institute.

References

Lemos, L.S., Olsen, A., Smith, A., Chandler, T.E., Larson, S., Hunt, K., and L.G. Torres. 2020. Assessment of fecal steroid and thyroid hormone metabolites in eastern North Pacific gray whales. Conservation Physiology 8:coaa110.

Pirotta, E., Booth, C.G., Costa, D.P., Fleishman, E., Kraus, S.D., Lusseau, D., Moretti, D., New, L.F., Schick, R.S., Schwarz, L.K., Simmons, S.E., Thomas, L., Tyack, P.L., Weise, M.J., Wells, R.S., and J. Harwood. 2018. Understanding the population consequences of disturbance. Ecology and Evolution 8(19):9934-9946.

Soledade Lemos, L., Burnett, J.D., Chandler, T.E., Sumich, J.L., and L.G. Torres. 2020. Intra- and inter-annual variation in gray whale body condition on a foraging ground. Ecosphere 11(4):e03094.

Wave riders or deep divers: what do cetaceans do in stormy weather?

By Lisa Hildebrand¹ and Samara Haver²

¹PhD Student, OSU Department of Fisheries, Wildlife, and Conservation Sciences, Geospatial Ecology of Marine Megafauna Lab 

²Postdoctoral Scholar, OSU Department of Fisheries, Wildlife, and Conservation Sciences, Cooperative Institute for Marine Resources Studies, Hatfield Marine Science Center

Many aspects of studying cetacean ecology, behavior, population dynamics, health, and sociality depend on being able to see and/or sample cetaceans when they come to the surface. While this research is not necessarily easy given that cetaceans spend the majority of their time underwater out of human sight, it is definitely feasible, as evidenced by decades of cetacean research. However, in order for researchers to observe cetaceans at the surface they need to get out to sea, and this boat-based effort can realistically only be done in good ocean conditions. Any sea-going individual likely uses the Beaufort sea state (BSS) scale as a measure of ocean conditions. For a full breakdown and excellent explanation of what the BSS is, check out our beloved Alexa’s blog; but for the purposes of this blog all you really need to know is that the smaller the BSS (which starts at 0), the calmer the ocean, and the higher the BSS, the rougher & stormier the ocean. There are two main reasons for conducting cetacean research in low BSS: 1) above a certain threshold (usually BSS 4) it becomes difficult to reliably spot and recognize cetaceans at the surface, thus compromising good data collection, and/or 2) to ensure safety and comfort of the research team. 

So, when the BSS gets too high, us humans usually do not go out to sea to study cetaceans, which means that the cetaceans, for the most part, go unobserved. So, many questions arise about what cetaceans are doing during these rough ocean conditions. What does an increased BSS mean for them? Are they unfazed by big waves and strong winds, or are they affected by the weather and take longer dives or seek out fairer seas? A conversation among friends sparked our curiosity of what cetaceans do in stormy conditions and inspired us to collaborate on this blog. Here, we report on what is and is not known about cetaceans in storms, and discuss some ideas about how best to quantify the effects of rough sea conditions on cetaceans.

Slide the arrows to compare sea conditions (BSS 1 [left] vs BSS 6 [right]) experienced by Alexa, the GEMM Lab marine mammal observer on the May 2019 Northern California Current cruise onboard NOAA ship Bell M. Shimada. Source: A. Kownacki/GEMM Lab.

A literature search of cetaceans during storms did not generate many results, which was not surprising to us given the above reasons about researchers not being able to survey in rough sea conditions. However, we did find a couple of interesting studies about cetacean behavior and distribution after storms.

Changes in foraging behavior

Autumnal storms in Maryland, USA resulted in less frequent and shorter encounters of bottlenose dolphins in the US Mid-Atlantic Bight. However, dolphins spent a significantly higher percentage of their encounters feeding after storms than they did before or during them (Fandel et al. 2020). Similarly, bottlenose dolphins in Mississippi Sound displayed an approximately 15% increase in foraging activity for up to 2 years following Hurricane Katrina (Smith et al. 2013). These changes in foraging behavior are attributed to shifts in distributions and behavior of dolphin prey species as a result of altered environmental conditions (primarily sea surface temperature and salinity) following the hurricanes.

Out-of-habitat events and strandings

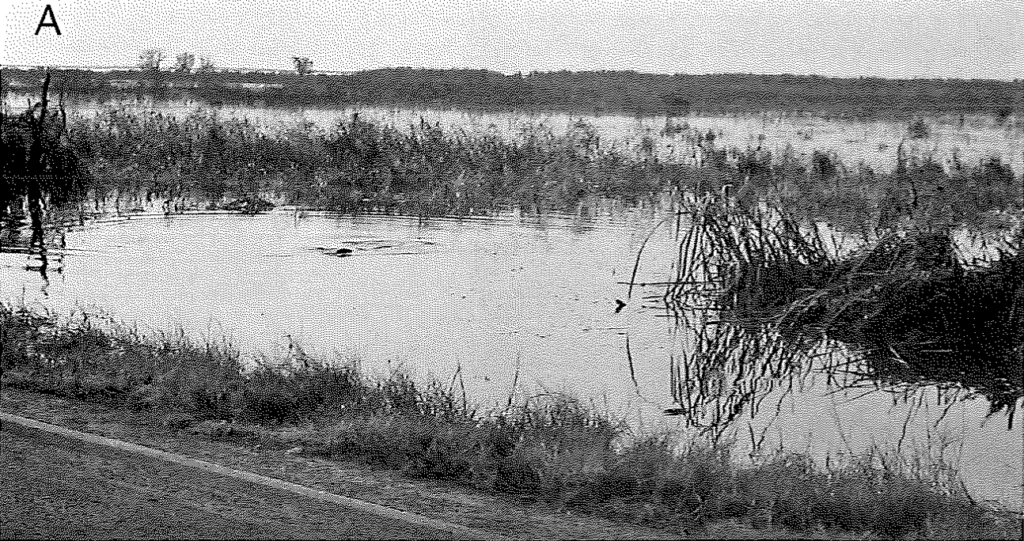
An out-of-habitat event occurs when an animal is displaced out of its typical habitat. Seven of these events were reported following Hurricane Rita, which hit the southwest Louisiana coast in 2005, with bottlenose dolphins found in flooded roadside ditches, canals, shallow flooded fields, and a natural creek area (Rosel & Watts 2008). These locations ranged from 2.5 to 11 km inland from the coast of the Gulf of Mexico, where these dolphins were displaced from. It is believed that the animals were carried inland on the storm surge that accompanied Hurricane Rita and were left stranded in areas that held water the longest once it started receding (Rosel & Watts 2008).

One of the roadside ditches where a bottlenose dolphin was trapped in Louisiana following Hurricane Rita. Taken from Rosel & Watts (2008).

There have been two mass strandings of pygmy killer whales that are believed to have been a result of hurricanes. In 1995, five pygmy killer whales stranded (three of which died, while two were successfully refloated) in the British Virgin Islands a day after Hurricane Marilyn (Mignucci-Giannoni et al. 1999). In 2006, six pygmy killer whales (five of which died) stranded in New Caledonia during and after Hurricane Jim (Clua et al. 2014). Both studies hypothesize that increased energetic costs, as a result of attempting to evade the hurricanes, coupled with animals becoming disoriented and ending up in shallow waters, is what caused them to strand. 

While these studies reveal post-storm effects on cetaceans, we still do not know exactly how these individuals behaved during the storms. Did they attempt longer dives to stay away from the rough conditions at the surface, thus becoming disoriented? Or were they behaving normally (i.e. foraging, travelling) and were simply “pushed” into waters that they did not intend to go into? Given that very stormy sea conditions do not allow for visual, boat-based surveys, we need to employ different technologies to study cetacean behavior and distribution during storms.

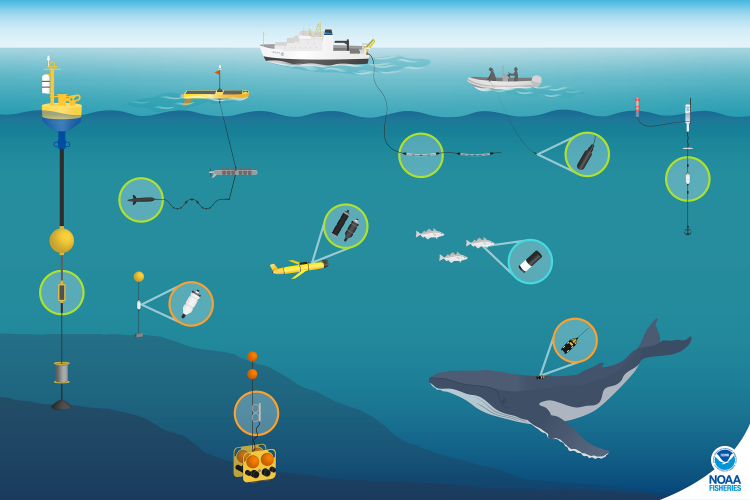
Passive acoustic monitoring (PAM) is a great tool that can monitor ocean environments for us when the seas are too stormy. Using fixed or mobile platforms, underwater PAM listening devices (hydrophone and data storage) can record sounds in the ocean for us to listen and analyze from shore. With PAM we are able to track the vocalizations of marine mammals as well as other sounds in the environment, such as waves crashing and rain. Anecdotally, we have spent many days at sea in conditions that were too rough for visual observations, but we could safely use our PAM tools to detect cetaceans. So, just because the seas may be too rough to see cetaceans, this fact does not mean that we cannot observe them – we just need to listen instead of look. 

There are many tools that can be used to record underwater sounds, including passive acoustic monitoring (PAM; shown in orange), real-time acoustic data collection (green), and active acoustics (blue.) Source: NOAA Fisheries.

A number of studies have investigated whether whales change their vocalization behavior differently in response to changing ambient sound conditions (for example: Dunlop et al. 2010; Fournet et al. 2018). While research on ocean sound levels is often focused on the impact of human-generated or anthropogenic noise, there are also natural, abiotic sound sources (e.g. wind, rain, ice) that can elevate ambient sound levels. One potential animal response to elevated ambient sound levels is to vocalize at a higher intensity, called the Lombard (or cocktail party) effect. This phenomenon is common for us humans – have you ever been at a party and at some point you realize that you are shouting to someone in order to be heard above the noise of the room? That’s the Lombard effect! Humpback whales in Glacier Bay National Park, Alaska, exhibited the Lombard effect in response to both natural and man-made sounds, but the probability of calling was lower when vessels were present compared to times with only natural sounds (Fournet et al. 2018). It is also possible that whales may vocalize at different frequencies, times, or for shorter durations when the ocean becomes louder, which we can easily track with PAM. Unfortunately, PAM is limited to what we are able to hear, so if we do not hear whales we cannot determine if this result is because their vocalizations are masked by higher intensity sounds, if they stopped vocalizing, or if they left the listening area. 

Animal-borne tags are another kind of autonomous observation tool that could help us understand cetacean behavior and distribution in storms. Admittedly, the logistics of applying tags before an imminent storm are probably complex. However, the development of medium-duration archival tags may provide a good trade-off between deploying tags long enough before a storm begins, thus providing safe working conditions for the research team, while minimizing potential physical impacts to the animals (Szesciorka et al. 2016). There are currently no published tag studies that document cetacean behavior during storms, but a study of a gray-headed albatross, fitted with a satellite transmitter, that successfully foraged during an Antarctic storm (Catry et al. 2004) shows the promise of using animal-borne tags to answer these questions.  

As with many questions about animal behavior, our best option is to combine all of our research tools to piece together evidence about what might be going on in the deep, dark, stormy ocean. Simultaneously collecting acoustic and movement & behavior data through PAM and animal-borne tags, respectively, could allow us to determine how cetaceans behave during storms. While we are probably not poised to tackle these questions right now, perhaps another curious graduate student can take it on for their own PhD research…

References

Catry, P., Phillips, R.A., and J.P. Croxall. Sustained fast travel by a gray-headed albatross (Thalassarchie chrysostoma) riding an Antarctic storm. The Auk 121(4):1208-1213.

Clua, E.E., Manire, C.A., and C. Garrigue. 2014. Biological data of pygmy killer whales (Feresa attenuata) from a mass stranding in New Caledonia (South Pacific) associated with Hurricane Jim in 2006. Aquatic Mammals 40(2):162-172.

Dunlop, R.A., Cato, D.H., and M.J. Noad. 2010. Your attention please: increasing ambient noise levels elicits a change in communication behaviour in humpback whales (Megaptera novaeangliae). Proceedings of the Royal Society B 277(1693):doi.org/10.1098/rspb.2009.2319. 

Fandel, A.D., Garrod, A., Hoover, A.L., Wingfield, J.E., Lyubchich, V., Secor, D.H., Hodge, K.B., Rice, A.N., and H. Bailey. 2020. Effects of intense storm events on dolphin occurrence and foraging behavior. Scientific Reports 10:19247.

Fournet, M.E.H., Matthews, L.P., Gabriele, C.M., Haver, S., Mellinger, D.K., and H. Klinck. 2018. Humpback whales Megaptera novaeangliae alter calling behavior in response to natural sounds and vessel noise. Marine Ecology Progress Series 607:251-268.

Mignucci-Giannoni, A.A., Toyos-González, G. M., Pérez-Padilla, J., Rodríguez-López, M. A., and J. Overing. 1999. Mass stranding of pygmy killer whales (Feresa attenuata) in the British Virgin Islands. Journal of the Marine Biological Association of the United Kingdom 80:759-760.

Rosel, P.E., and H. Watts. 2008. Hurricane impacts on bottlenose dolphins in the northern Gulf of Mexico. Gulf of Mexico Science 25:7.

Smith, C.E., Hurley, B.J., Toms, C.N., Mackey, A.D., Solangi, M., and S.A. Kuczaj II. 2013. Hurricane impacts on the foraging patterns of bottlenose dolphins Tursiops truncatus in Mississippi Sound. Marine Ecology Progress Series 487:231-244.

Szesciorka, A.R., Calambokidis, J., and J.T. Harvey. 2016. Testing tag attachments to increase the attachment duration of archival tags on baleen whales. Animal Biotelemetry 4:18.

The Recipe for a “Perfect” Marine Mammal and Seabird Cruise

By Alexa Kownacki, Ph.D. Student, OSU Department of Fisheries and Wildlife, Geospatial Ecology of Marine Megafauna Lab

Science—and fieldwork in particular—is known for its failures. There are websites, blogs, and Twitter pages dedicated to them. This is why, when things go according to plan, I rejoice. When they go even better than expected, I practically tear up from amazement. There is no perfect recipe for a great marine mammal and seabird research cruise, but I would suggest that one would look like this:

 A Great Marine Mammal and Seabird Research Cruise Recipe:

  • A heavy pour of fantastic weather
    • Light on the wind and seas
    • Light on the glare
  • Equal parts amazing crew and good communication
  • A splash of positivity
  • A dash of luck
  • A pinch of delicious food
  • Heaps of marine mammal and seabird sightings
  • Heat to approximately 55-80 degrees F and transit for 10 days along transects at 10-12 knots

The end of another beautiful day at sea on the R/V Shimada. Image source: Alexa K.

The Northern California Current Ecosystem (NCCE) is a highly productive area that is home to a wide variety of cetacean species. Many cetaceans are indicator species of ecosystem health as they consume large quantities of prey from different levels in trophic webs and inhabit diverse areas—from deep-diving beaked whales to gray whales traveling thousands of miles along the eastern north Pacific Ocean. Because cetacean surveys are a predominant survey method in large bodies of water, they can be extremely costly. One alternative to dedicated cetacean surveys is using other research vessels as research platforms and effort becomes transect-based and opportunistic—with less flexibility to deviate from predetermined transects. This decreases expenses, creates collaborative research opportunities, and reduces interference in animal behavior as they are never pursued. Observing animals from large, motorized, research vessels (>100ft) at a steady, significant speed (>10kts/hour), provides a baseline for future, joint research efforts. The NCCE is regularly surveyed by government agencies and institutions on transects that have been repeated nearly every season for decades. This historical data provides critical context for environmental and oceanographic dynamics that impact large ecosystems with commercial and recreational implications.

My research cruise took place aboard the 208.5-foot R/V Bell M. Shimada in the first two weeks of May. The cruise was designated for monitoring the NCCE with the additional position of a marine mammal observer. The established guidelines did not allow for deviation from the predetermined transects. Therefore, mammals were surveyed along preset transects. The ship left port in San Francisco, CA and traveled as far north as Cape Meares, OR. The transects ranged from one nautical mile from shore and two hundred miles offshore. Observations occurred during “on effort” which was defined as when the ship was in transit and moving at a speed above 8 knots per hour dependent upon sea state and visibility. All observations took place on the flybridge during conducive weather conditions and in the bridge (one deck below the flybridge) when excessive precipitation was present. The starboard forward quarter: zero to ninety degrees was surveyed—based on the ship’s direction (with the bow at zero degrees). Both naked eye and 7×50 binoculars were used with at least 30 percent of time binoculars in use. To decrease observer fatigue, which could result in fewer detected sightings, the observer (me) rotated on a 40 minutes “on effort”, 20 minutes “off effort” cycle during long transits (>90 minutes).

Alexa on-effort using binoculars to estimate the distance and bearing of a marine mammal sighted off the starboard bow. Image source: Alexa K.

Data was collected using modifications to the SEEbird Wincruz computer program on a ruggedized laptop and a GPS unit was attached. At the beginning of each day and upon changes in conditions, the ship’s heading, weather conditions, visibility, cloud cover, swell height, swell direction, and Beaufort sea state (BSS) were recorded. Once the BSS or visibility was worse than a “5” (1 is “perfect” and 5 is “very poor”) observations ceased until there was improvement in weather. When a marine mammal was sighted the latitude and longitude were recorded with the exact time stamp. Then, I noted how the animal was sighted—either with binoculars or naked eye—and what action was originally noticed—blow, splash, bird, etc. The bearing and distance were noted using binoculars. The animal was given three generalized behavior categories: traveling, feeding, or milling. A sighting was defined as any marine mammal or group of animals. Therefore, a single sighting would have the species and the best, high, and low estimates for group size.

By my definitions, I had the research cruise of my dreams. There were moments when I imagined people joining this trip as a vacation. I *almost* felt guilty. Then, I remember that after watching water for almost 14 hours (thanks to the amazing weather conditions), I worked on data and reports and class work until midnight. That’s the part that no one talks about: the data. Fieldwork is about collecting data. It’s both what I live for and what makes me nervous. The amount of time, effort, and money that is poured into fieldwork is enormous. The acquisition of the data is not as simple as it seems. When I briefly described my position on this research cruise to friends, they interpret it to be something akin to whale-watching. To some extent, this is true. But largely, it’s grueling hours that leave you fatigued. The differences between fieldwork and what I’ll refer to as “everything else” AKA data analysis, proposal writing, manuscript writing, literature reviewing, lab work, and classwork, are the unbroken smile, the vaguely tanned skin, the hours of laughter, the sea spray, and the magical moments that reassure me that I’ve chosen the correct career path.

Alexa photographing a gray whale at sunset near Newport, OR. Image source: Alexa K.

This cruise was the second leg of the Northern California Current Ecosystem (NCCE) survey, I was the sole Marine Mammal and Seabird Observer—a coveted position. Every morning, I would wake up at 0530hrs, grab some breakfast, and climb to the highest deck: the fly-bridge. Akin to being on the top of the world, the fly-bridge has the best views for the widest span. From 0600hrs to 2000hrs I sat, stood, or danced in a one-meter by one-meter corner of the fly-bridge and surveyed. This visual is why people think I’m whale watching. In reality, I am constantly busy. Nonetheless, I had weather and seas that scientists dream about—and for 10 days! To contrast my luck, you can read Florence’s blog about her cruise. On these same transects, in February, Florence experienced 20-foot seas with heavy rain with very few marine mammal sightings—and of those, the only cetaceans she observed were gray whales close to shore. That starkly contrasts my 10 cetacean species with upwards of 45 sightings and my 20-minute hammock power naps on the fly-bridge under the warm sun.

Pacific white-sided dolphins traveling nearby. Image source: Alexa K.

Marine mammal sightings from this cruise included 10 cetacean species: Pacific white-sided dolphin, Dall’s porpoise, unidentified beaked whale, Cuvier’s beaked whale, gray whale, Minke whale, fin whale, Northern right whale dolphin, blue whale, humpback whale, and transient killer whale and one pinniped species: northern fur seal. What better way to illustrate these sightings than with a map? We are a geospatial lab after all.

Cetacean Sightings on the NCCE Cruise in May 2018. Image source: Alexa K.

This map is the result of data collection. However, it does not capture everything that was observed: sea state, weather, ocean conditions, bathymetry, nutrient levels, etc. There are many variables that can be added to maps–like this one (thanks to my GIS classes I can start adding layers!)–that can provide a better understanding of the ecosystem, predator-prey dynamics, animal behavior, and population health.

The catch from a bottom trawl at a station with some fish and a lot of pyrosomes (pink tube-like creatures). Image source: Alexa K.

Being a Ph.D. student can be physically and mentally demanding. So, when I was offered the opportunity to hone my data collection skills, I leapt for it. I’m happiest in the field: the wind in my face, the sunshine on my back, surrounded by cetaceans, and filled with the knowledge that I’m following my passion—and that this data is contributing to the greater scientific community.

Humpback whale photographed traveling southbound. Image source: Alexa K.