Wavelet analysis to describe biological cycles and signals of non-stationarity

By Allison Dawn, GEMM Lab Master’s student, OSU Department of Fisheries, Wildlife, and Conservation Sciences, Geospatial Ecology of Marine Megafauna Lab 

During my second term of graduate school, I have been preparing to write my research proposal. The last two months have been an inspiring process of deep literature dives and brainstorming sessions with my mentors. As I discussed in my last blog, I am interested in questions related to pattern and scale (fine vs. mesoscale) in the context of the Pacific Coast Feeding Group (PCFG) of gray whales, their zooplankton prey, and local environmental variables.

My work currently involves exploring which scales of pattern are important in these trophic relationships and whether the dominant scale of a pattern changes over time or space. I have researched which analysis tools would be most appropriate to analyze ecological time series data, like the impressive long-term dataset the GEMM lab has collected in Port Orford as part of the TOPAZ  project, where we have monitored the abundance of whales and zooplankton, as well as environmental variables since 2016. 

A useful analytical tool that I have come across in my recent coursework and literature review is called wavelet analysis. Importantly, wavelet analysis can handle non-stationarity and edge detection in time series data. Non-stationarity is when a dataset’s mean and/or variance can change over time or space, and edge detection is the identification of the change location (in time or space). For example, it is not just the cycles or “ups and downs” of zooplankton abundance I am interested in, but when in time or where in space these cycles of “ups and downs” might change in relation to what their previous values, or distances between values, were. Simply stated, non-stationarity is when what once was normal is no longer normal. Wavelet analysis has been applied across a broad range of fields, such as environmental engineering (Salas et al. 2020), climate science (Slater et al. 2021), and bio-acoustics (Buchan et al. 2021). It can be applied to any time series dataset that might violate the traditional statistical assumption of stationarity. 

In a recent review of climate science methodology, Slater et al. (2021) outlined the possible behavior of time series data. Using theoretical plots, the authors show that data can a) have the same mean and variance over time, or b) have non-stationarity that can be broken into three major groups – trend, step change, or shifts in variance. Figure 1 further demonstrates the difference between stationary vs. non-stationary data in relation to a given variable of interest over time. 

Figure 1. Plots showing the possible magnitude of a given variable across a time series: a) Stationary behavior, b) Non-stationary trend, step-change, and a shift in variance. [Taken from Slater et. al (2021)].

Traditional correlation statistics assumes stationarity, but it has been shown that ecological time series are often non-stationary at certain scales (Cazelles & Hales, 2006). In fact, ecological data rarely meets the requirements of a controlled experiment that traditional statistics require. This non-stationarity of ecological data means that while widely-used methods like generalized linear models and analyses of variances (ANOVAs) can be helpful to assess correlation, they are not always sufficient on their own to describe the complex natural phenomena ecologists seek to explain. Non-stationarity occurs frequently in ecological time series, so it is appropriate to consider analysis tools that will allow us to detect edges to further investigate the cause.

Wavelet analysis can also be conducted across a time series of multiple response variables to assess if these variables share high common power (correlation). When data is combined in this way it is called a cross-wavelet analysis. An interesting paper used cross-wavelet analysis to assess the seasonal response of zooplankton life history in relation to climate warming (Winder et. al 2009). Results from their cross-wavelet analysis showed that warming temperatures over the past two decades increased the voltinism (number of broods per year) of copepods. The authors show that where once annual recruitment followed a fairly stationary pattern, climate warming has contributed to a much more stochastic pattern of zooplankton abundance. From these results, the authors contribute to the hypothesis that climate change has had a temporal impact on zooplankton population dynamics, and recruitment has increasingly drifted out of phase from the original annual cycles. 
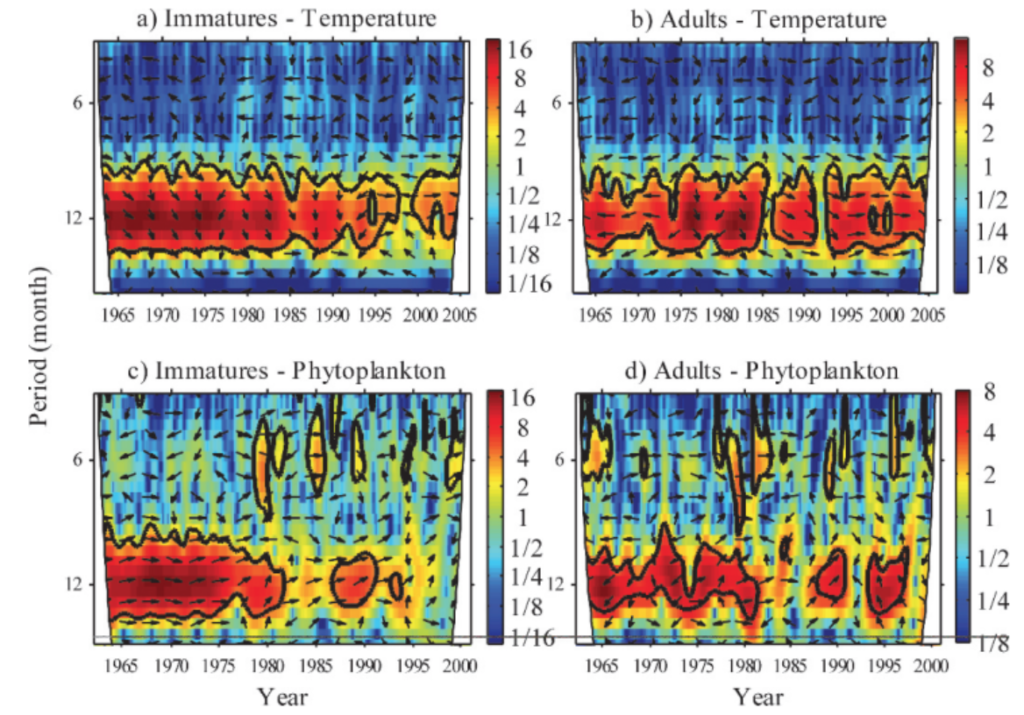
Figure 2. Cross-wavelet spectrum for immature and adult Leptodiaptomus ashlandi for 1965 through either 2000 or 2005. Plots show a) immatures and temperature, b) adults and temperature, c) immatures and phytoplankton, and d) adults and phytoplankton. Arrows indicate phase between combined time series. 0 degrees is in-phase and 180 degrees is anti-phase. Black contour lines show “cone of influence” or the 95% significance level, every value within the cone is considered significant. Left axis shows the temporal period, and the color legend shows wavelet frequency power, with low frequencies in blue and high frequencies in red. Plots show strong covariation of high common power at the 12-month period until the 1980s. This pattern is especially evident in plot c) and d). [Taken from (Winder et. al 2009)].

While wavelet and cross-wavelet analyses should not be the only tool used to explore data, due to its limitations with significance testing, it is still worth implementing to gain a better understanding of how time series variables relate to each other over multiple spatial and/or temporal scales. It is often helpful to combine multiple methods of analysis to get a larger sense of patterns in the data, especially in spatio-temporal research.

When conducting research within the context of climate change, where the concentration of CO2 in ppm in the atmosphere is a non-stationary time series itself (Figure 3), it is important to consider how our datasets might be impacted by climate change and wavelet analysis can help identify the scales of change. 
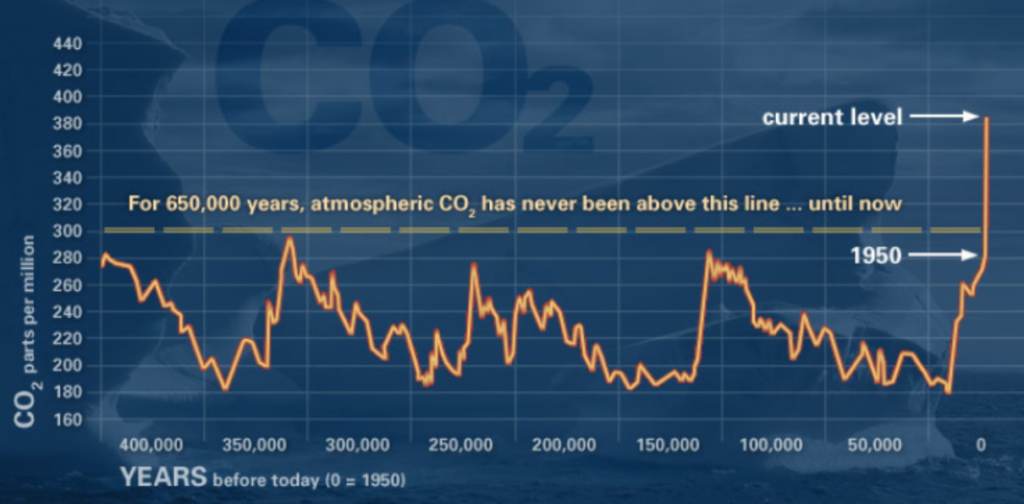
Figure 3. Plot showing the historic fluctuations of CO^2 and the recent deviation from normal levels. Source: https://globalclimate.ucr.edu/resources.html

When considering our ecological time series of data in Port Orford, we want to evaluate how changing ocean conditions may be related to data trends. For example, has the annual mean or variance of zooplankton abundance changed over time, and where has that change occurred in time or space? These changes might have occurred at different scales and might be invisible at other scales. I am eager to see if wavelet analysis can detect these sorts of changes in the abundance of zooplankton across our time series of data, particularly during the seasons of intense heat waves or upwelling. 

Did you enjoy this blog? Want to learn more about marine life, research and conservation? Subscribe to our blog and get a weekly email when we make a new post! Just add your name into the subscribe box on the left panel.

References

Buchan, S. J., Pérez-Santos, I., Narváez, D., Castro, L., Stafford, K. M., Baumgartner, M. F., … & Neira, S. (2021). Intraseasonal variation in southeast Pacific blue whale acoustic presence, zooplankton backscatter, and oceanographic variables on a feeding ground in Northern Chilean Patagonia. Progress in Oceanography, 199, 102709.

Cazelles, B., & Hales, S. (2006). Infectious diseases, climate influences, and nonstationarity. PLoS Medicine, 3(8), e328.

Salas, J. D., Anderson, M. L., Papalexiou, S. M., & Frances, F. (2020). PMP and climate variability and change: a review. Journal of Hydrologic Engineering, 25(12), 03120002.

Slater, L. J., Anderson, B., Buechel, M., Dadson, S., Han, S., Harrigan, S., … & Wilby, R. L. (2021). Nonstationary weather and water extremes: a review of methods for their detection, attribution, and management. Hydrology and Earth System Sciences, 25(7), 3897-3935.

Winder, M., Schindler, D. E., Essington, T. E., & Litt, A. H. (2009). Disrupted seasonal clockwork in the population dynamics of a freshwater copepod by climate warming. Limnology and Oceanography, 54(6part2), 2493-2505.

Taking a breather

Allison Dawn, new GEMM Lab Master’s student, OSU Department of Fisheries, Wildlife and Conservation Sciences, Geospatial Ecology of Marine Megafauna Lab

While standing at the Stone Shelter at the Saint Perpetua Overlook in 2016, I took in the beauty of one of the many scenic gems along the Pacific Coast Highway. Despite being an East Coast native, I felt an unmistakable draw to Oregon. Everything I saw during that morning’s hike, from the misty fog that enshrouded evergreens and the ocean with mystery, to the giant banana slugs, felt at once foreign and a place I could call home. Out of all the places I visited along that Pacific Coast road trip, Oregon left the biggest impression on me.

Figure 1. View from the Stone Shelter at the Cape Perpetua Overlook, Yachats, OR. June 2016.

For my undergraduate thesis, which I recently defended in May 2021, I researched blue whale surface interval behavior. Surface interval events for oxygen replenishment and rest are a vital part of baleen whale feeding ecology, as it provides a recovery period before they perform their next foraging dive (Hazen et al., 2015; Roos et al., 2016). Despite spending so much time studying the importance of resting periods for mammals, that 2016 road trip was my last true extended resting period/vacation until, several years later in 2021, I took another road trip. This time it was across the country to move to the place that had enraptured me.

Now that I am settled in Corvallis, I have reflected on my journey to grad school and my recent road trip; both prepared me for a challenging and exciting new chapter as an incoming MSc student within the Marine Mammal Institute (MMI).

Part 1: Journey to Grad School

When I took that photo at the Cape Perpetua Overlook in 2016, I had just finished the first two semesters of my undergraduate degree at UNC Chapel Hill. As a first-generation, non-traditional student those were intense semesters as I made the transition from a working professional to full-time undergrad.

By the end of my freshman year I was debating exactly what to declare as my major, when one of my marine science TA’s, Colleen, (who is now Dr. Bove!), advised that I “collect experiences, not degrees.” I wrote this advice down in my day planner and have never forgotten it. Of course, obtaining a degree is important, but it is the experiences you have that help lead you in the right direction.

That advice was one of the many reasons I decided to participate in the Morehead City Field Site program, where UNC undergraduates spend a semester at the coast, living on the Duke Marine Lab’s campus in Beaufort, NC. During that semester, students take classes to fulfill a marine science minor while participating in hands-on research, including an honors thesis project. The experience of designing, carrying out, and defending my own project affirmed that graduate school in the marine sciences was right for me. As I move into my first graduate TA position this fall, I hope to pay forward that encouragement to other undergraduates who are making decisions about their own future path.

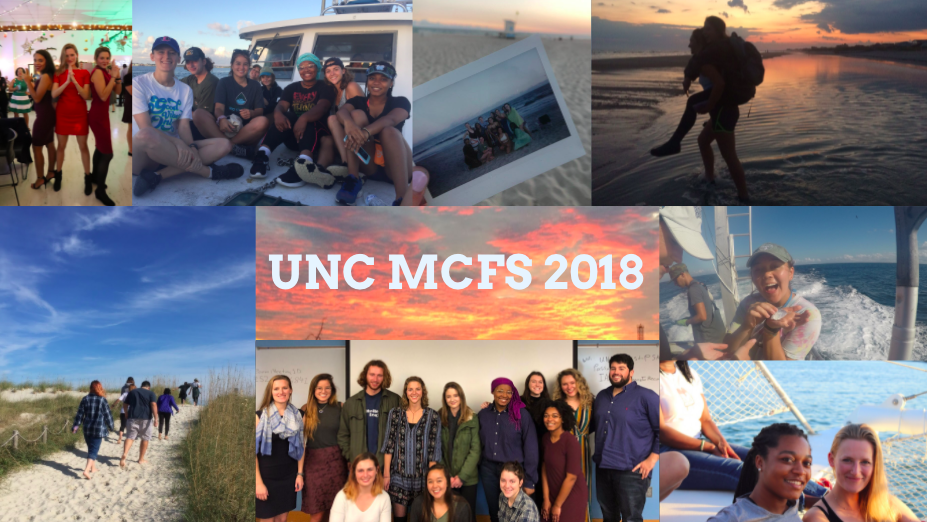
Figure 2. Final slide from my honors thesis defense. UNC undergraduates, and now fellow alumni, who participated in the Morehead City Field Site program in Fall 2018.

Part 2: Taking a Breather

Like the GEMM Lab’s other new master’s student Miranda, my road trip covered approximately 2,900 miles. I was solo for much of the drive, which meant there was no one to argue when I decided to binge listen to podcasts. My new favorite is How To Save A Planet, hosted by marine biologist Dr. Ayana Elizabeth Johnson and Alex Blumberg. At the end of each episode they provide a call to action & resources for listeners – I highly recommend this show to anyone interested in what you can do right now about climate change.

Along my trip I took a stop in Utah to visit my parents. I had never been to a desert basin before and engaged in many desert-related activities: visiting Zion National Park, hiking in 116-degree heat, and facing my fear of heights via cliff jumping.

Figure 3. Sandstone Rocks at Sand Hollow National Park, Hurricane, Utah. June 2021.

 My parents wanted to help me settle into my new home, as parents do, so we drove the rest of the way to Oregon together. As this would be their first visit to the state, we strategically planned a trip to Crater Lake as our final scenic stop before heading into Corvallis.

Figure 4. Wizard Island in Crater Lake National Park, Klamath County, OR. June 2021.

This time off was filled with adventure, yet was restorative, and reminded me the importance of taking a break. I feel ready and refreshed for an intense summer of field work.

Part 3: Rested and Ready

Despite accumulating skills to do research in the field over the years, I have yet to do marine mammal field work (or even see a whale in person for that matter.) My mammal research experience included analyzing drone imagery, behind a computer, that had already been captured. As you can imagine, I am extremely excited to join the Port Orford team as part of the TOPAZ/JASPER projects this summer, collecting ecological data on gray whales and their prey. I will be learning the ropes from Lisa Hildebrand and soaking up as much information as possible as I will be taking over as lead for this project next year.

It will take some time before my master’s thesis is fully developed, but it will likely focus on assessing the environmental factors that influence gray whale zooplankton prey availability, and the subsequent impacts on whale movements and health. For five years, the Port Orford project has conducted GoPro drops at 12 sampling stations to collect data on zooplankton relative abundance.

Figures 5 & 6. GEMM GoPro drop stick assembly and footage demonstrating mysid data collection. July 2021.

Paired with this GoPro is a Time-Depth Recorder (TDR) that provides temperature and depth data. The 2021 addition to this GoPro system is a new dissolved oxygen (DO) sensor the GEMM Lab has just acquired. This new piece of equipment will add to the set of parameters we can analyze to describe what and how oceanographic factors drive prey variability and gray whale presence in our study site.My first task as a GEMM Lab student is to get to know this DO sensor, figure out how it works, set it up, test it, attach it to the GoPro device, and prepare it for data collection during the upcoming Port Orford project starting in 1 week!

Figure 7. The GEMM lab’s new RBR solo3 getting ready for Port Orford. July 2021.

Dissolved oxygen plays a vital role in the ocean; however, climate change and increased nutrient loading has caused the ocean to undergo deoxygenation. According to the IUCN’s 2019 Issues Brief, these factors have resulted in an oxygen decline of 2% since the middle of the 20th century, with most of this loss occurring within the first 1000 meters of the ocean. Two percent may not seem like much, but many species have a narrow oxygen threshold and, like pH changes in coral reef systems, even slight changes in DO can have an impact. Additionally, the first 1000 meters of the ocean contains the greatest amount of species richness and biodiversity.

Previous research done in a variety of systems (i.e., estuarine, marine, and freshwater lakes) shows that dissolved oxygen concentrations can have an impact on predator-prey interactions, where low dissolved oxygen results in decreased predation (Abrahams et al., 2007; Breitburg et al., 1997; Domenici et al., 2007; Kramer et al., 1987); and changes in DO also change prey vertical distributions (Decker et al., 2004). In Port Orford, we are interested in understanding the interplay of factors driving zooplankton community distribution and abundance while investigating the trophic interaction between gray whales and their prey.

I have spent some time with our new DO sensor and am looking forward to its first deployments in Port Orford! Stay tuned for updates from the field!

References

Abrahams, M. V., Mangel, M., & Hedges, K. (2007). Predator–prey interactions and changing environments: who benefits?. Philosophical Transactions of the Royal Society B: Biological Sciences, 362(1487), 2095-2104.

Breitburg, D. L., Loher, T., Pacey, C. A., & Gerstein, A. (1997). Varying effects of low dissolved oxygen on trophic interactions in an estuarine food web. Ecological Monographs, 67(4), 489-507.

​​Decker, M. B., Breitburg, D. L., & Purcell, J. E. (2004). Effects of low dissolved oxygen on zooplankton predation by the ctenophore Mnemiopsis leidyi. Marine Ecology Progress Series, 280, 163-172.

Domenici, P., Claireaux, G., & McKenzie, D. J. (2007). Environmental constraints upon locomotion and predator–prey interactions in aquatic organisms: an introduction.

Hazen, E. L., Friedlaender, A. S., & Goldbogen, J. A. (2015). Blue whales (Balaenoptera musculus) optimize foraging efficiency by balancing oxygen use and energy gain as a function of prey density. Science Advances, 1(9), e1500469.

Kramer, D. L. (1987). Dissolved oxygen and fish behavior. Environmental biology of fishes, 18(2), 81-92.

Roos, M. M., Wu, G. M., & Miller, P. J. (2016). The significance of respiration timing in the energetics estimates of free-ranging killer whales (Orcinus orca). Journal of Experimental Biology, 219(13), 2066-2077.