The pandemic has taught me that certain skills – including ones I never recognized as such – can atrophy. How do I construct an outfit that involves actual pants instead of gym shorts? How do I make a lunch that is portable and can be eaten outside my home?
These are things that I’ve had to relearn over the last year, as I increasingly leave my virtual work world and move back into the physical world. Recently, the new ways in which the world is opening up again have pushed me to brush off another skill – how do I talk to other people about my work?
The pandemic has necessarily made the world a bit more insular. A year and a half into my graduate career, I’ve mostly discussed my work within the cozy cocoon of my lab groups and cohort. In particular, I’ve lived the last few months in that realm of research that is so specific and internal that almost no one else fully understands or cares about what I’m doing: I’ve spent days tangled up in oodles of models, been woken up at night by dreams about coding, and sweated over the decimal points of statistical deviance-explained values.
This period of scientific navel gazing abruptly ended this February. In the space of ten days, I presented at my first in-person conference during graduate school, gave a short talk at my first international conference, and gave my longest talk yet to a public audience. After reveling in the minutiae of research for months, it was so valuable to be forced to take a step back, think about the overarching narrative of this work, and practice telling that story to different audiences.
A February talk for the Oregon chapter of the American Cetacean Society gave me the chance to tell the story of my research to a broad audience.
Presenting this work to an in-person audience for the first time was especially rewarding. With a physical (!) poster in hand, I headed out to Newport for the annual meeting of the Oregon Chapter of The Wildlife Society. The GEMM Lab really took this conference by storm – Leigh gave a plenary talk on the meeting’s theme of “Dynamic Oceans, Shifting Landscapes”, Lisa chaired a session and gave a talk about trophic relationships between kelp and whales, and Miranda presented a poster on the new Holistic Assessment of Living marine resources off the Oregon coast (HALO) project.
This great GEMM Lab presence gave me the opportunity to reference everyone else’s work as I shared my own, and to think about the body of work we do as a group and the coherence in research themes that different projects share. I almost lost my voice by talking for the entire duration of the poster session, and was energized by the opportunity to share this work with so many interested people.
The GEMM Lab and other OSU Marine Mammal Institute members presented alongside terrestrial researchers on the theme of “Dynamic Oceans, Shifting Landscapes”.
Originally scheduled for Hawaii, this meeting was instead held virtually as a safety precaution against Covid-19. Nevertheless, the diversity of talks and time spent gathering online still gave me the sense of being part of an international ocean science community. People attended from every time zone, and watching early-morning talks while wearing pajamas with Solene, Dawn, and Quin the dog is officially one of my new favorite conference experiences.
In addition to the chance to discuss science with other students and researchers, it was great to have the opportunity to step back from our normal routines a bit. The Krill Seeker Lab did the conference-organized 5K walk together (in intermittent rain, of course) and our team even came within one point of winning the trivia contest. All the while, we were hopping in and out of poster sessions and talks, realizing that virtual conferences can be just as busy as in-person ones.
Taking a 5k-long break from watching talks! From left to right: Rachel Kaplan, Kim Bernard, Giulia Wood, and Kirsten Steinke.
Over the last two years, one of the things the pandemic has made me appreciate the most is the ability to gather. Dinner with friends, holidays with family – the ability to be together is far more tentative and precious than I realized during the “before times.” Now, as we start tiptoeing back into normal life a bit more, I’m appreciating the ability to gather for science and looking forward to more conferences in the future.
Did you enjoy this blog? Want to learn more about marine life, research and conservation? Subscribe to our blog and get a weekly email when we make a new post! Just add your name into the subscribe box on the left panel.
2MS Student, OSU Department of Fisheries, Wildlife, and Conservation Sciences, Seabird Oceanography Lab
The marine environment is dynamic, and mobile animals must respond to the patchy and ephemeral availability of resource in order to make a living (Hyrenbach et al. 2000). Climate change is making ocean ecosystems increasingly unstable, yet these novel conditions can be difficult to document given the vast depth and remoteness of most ocean locations. Marine megafauna species such as marine mammals and seabirds integrate ecological processes that are often difficult to observe directly, by shifting patterns in their distribution, behavior, physiology, and life history in response to changes in their environment (Croll et al. 1998, Hazen et al. 2019). These mobile marine animals now face additional challenges as rising temperatures due to global climate change impact marine ecosystems worldwide (Hazen et al. 2013, Sydeman et al. 2015, Silber et al. 2017, Becker et al. 2019). Given their mobility, visibility, and integration of ocean processes across spatial and temporal scales, these marine predator species have earned the reputation as effective ecosystem sentinels. As sentinels, they have the capacity to shed light on ecosystem function, identify risks to human health, and even predict future changes (Hazen et al. 2019). So, let’s explore a few examples of how studying marine megafauna has revealed important new insights, pointing toward the importance of monitoring these sentinels in a rapidly changing ocean.
Cairns (1988) is often credited as first promoting seabirds as ecosystem sentinels and noted several key reasons why they were perfect for this role: (1) Seabirds are abundant, wide-ranging, and conspicuous, (2) although they feed at sea, they must return to land to nest, allowing easier observation and quantification of demographic responses, often at a fraction of the cost of traditional, ship-based oceanographic surveys, and therefore (3) parameters such as seabird reproductive success or activity budgets may respond to changing environmental conditions and provide researchers with metrics by which to assess the current state of that ecosystem.
The unprecedented 2014-2016 North Pacific marine heatwave (“the Blob”) caused extreme ecosystem disruption over an immense swath of the ocean (Cavole et al. 2016). Seabirds offered an effective and morbid indication of the scale of this disruption: Common murres (Uria aalge), an abundant and widespread fish-eating seabird, experienced widespread breeding failure across the North Pacific. Poor reproductive performance suggested that there may have been fewer small forage fish around and that these changes occurred at a large geographic scale. The Blob reached such an extreme as to kill immense numbers of adult birds, which professional and community scientists found washed up on beach-surveys; researchers estimate that an incredible 1,200,000 murres may have died from starvation during this period (Piatt et al. 2020). While the average person along the Northeast Pacific Coast during this time likely didn’t notice any dramatic difference in the ocean, seabirds were shouting at us that something was terribly wrong.
Happily, living seabirds also act as superb ecosystem sentinels. Long-term research in the Gulf of Maine by U.S. and Canadian scientists monitors the prey species provisioned by adult seabirds to their chicks. Will has spent countless hours over five summers helping to conduct this research by watching terns (Sterna spp.) and Atlantic puffins (Fratercula arctica) bring food to their young on small islands off the Maine coast. After doing this work for multiple years, it’s easy to notice that what adults feed their chicks varies from year to year. It was soon realized that these data could offer insight into oceanographic conditions and could even help managers assess the size of regional fish stocks. One of the dominant prey species in this region is Atlantic herring (Clupea harengus), which also happens to be the focus of an economically important fishery. While the fishery targets four or five-year-old adult herring, the seabirds target smaller, younger herring. By looking at the relative amounts and sizes of young herring collected by these seabirds in the Gulf of Maine, these data can help predict herring recruitment and the relative number of adult herring that may be available to fishers several years in the future (Scopel et al. 2018). With some continued modelling, the work that we do on a seabird colony in Maine with just a pair of binoculars can support or maybe even replace at least some of the expensive ship-based trawl surveys that are now a popular means of assessing fish stocks.
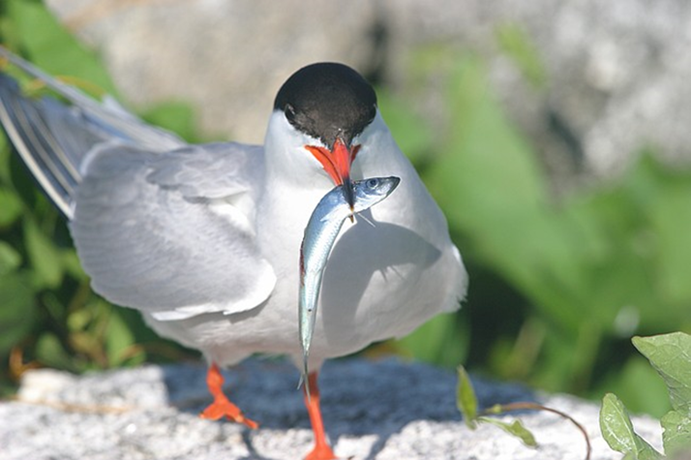
A common tern (Sterna hirundo) with a young Atlantic herring from the Gulf of Maine, ready to feed its chick (Photo courtesy of the National Audubon Society’s Seabird Institute)
For more far-ranging and inaccessible marine predators such as whales, measuring things such as dietary shifts can be more challenging than it is for seabirds. Nevertheless, whales are valuable ecosystem sentinels as well. Changes in the distribution and migration phenology of specialist foragers such as blue whales (Balaenoptera musculus) and North Atlantic right whales (Eubalaena glacialis) can indicate relative changes in the distribution and abundance of their zooplankton prey and underlying ocean conditions (Hazen et al. 2019). In the case of the critically endangered North Atlantic right whale, their recent declines in reproductive success reflect a broader regime shift in climate and ocean conditions. Reduced copepod prey has resulted in fewer foraging opportunities and changing foraging grounds, which may be insufficient for whales to obtain necessary energetic stores to support calving (Gavrilchuk et al. 2021, Meyer-Gutbrod et al. 2021). These whales assimilate and showcase the broad-scale impacts of climate change on the ecosystem they inhabit.
Blue whales that feed in the rich upwelling system off the coast of California rely on the availability of their krill prey to support the population (Croll et al. 2005). A recent study used acoustic monitoring of blue whale song to examine the timing of annual population-level transition from foraging to breeding migration compared to oceanographic variation, and found that flexibility in timing may be a key adaptation to persistence of this endangered population facing pressures of rapid environmental change (Oestreich et al. 2022). Specifically, blue whales delayed the transition from foraging to breeding migration in years of the highest and most persistent biological productivity from upwelling, and therefore listening to the vocalizations of these whales may be valuable indicator of the state of productivity in the ecosystem.
Figure reproduced from Oestreich et al. 2022, showing relationships between blue whale life-history transition and oceanographic phenology of foraging habitat. Timing of the behavioral transition from foraging to migration (day of year on the y-axis) is compared to (a) the date of upwelling onset; (b) the date of peak upwelling; and (c) total upwelling accumulated from the spring transition to the end of the upwelling season.
In a similar vein, research by the GEMM Lab on blue whale ecology in New Zealand has linked their vocalizations known as D calls to upwelling conditions, demonstrating that these calls likely reflect blue whale foraging opportunities (Barlow et al. 2021). In ongoing analyses, we are finding that these foraging-related calls were drastically reduced during marine heatwave conditions, which we know altered blue whale distribution in the region (Barlow et al. 2020). Now, for the final component of Dawn’s PhD, she is linking year-round environmental conditions to the occurrence patterns of different blue whale vocalization types, hoping to shed light on ecosystem processes by listening to the signals of these ecosystem sentinels.
A blue whale comes up for air in the South Taranaki Bight of New Zealand. photo by L. Torres.
It is important to understand the widespread implications of the rapidly warming climate and changing ocean conditions on valuable and vulnerable marine ecosystems. The cases explored here in this blog exemplify the importance of monitoring these marine megafauna sentinel species, both now and into the future, as they reflect the health of the ecosystems they inhabit.
Did you enjoy this blog? Want to learn more about marine life, research and conservation? Subscribe to our blog and get a weekly email when we make a new post! Just add your name into the subscribe box on the left panel.
References:
Barlow DR, Bernard KS, Escobar-Flores P, Palacios DM, Torres LG (2020) Links in the trophic chain: Modeling functional relationships between in situ oceanography, krill, and blue whale distribution under different oceanographic regimes. Mar Ecol Prog Ser 642:207–225.
Barlow DR, Klinck H, Ponirakis D, Garvey C, Torres LG (2021) Temporal and spatial lags between wind, coastal upwelling, and blue whale occurrence. Sci Rep 11:1–10.
Becker EA, Forney KA, Redfern J V., Barlow J, Jacox MG, Roberts JJ, Palacios DM (2019) Predicting cetacean abundance and distribution in a changing climate. Divers Distrib 25:626–643.
Cairns DK (1988) Seabirds as indicators of marine food supplies. Biol Oceanogr 5:261–271.
Cavole LM, Demko AM, Diner RE, Giddings A, Koester I, Pagniello CMLS, Paulsen ML, Ramirez-Valdez A, Schwenck SM, Yen NK, Zill ME, Franks PJS (2016) Biological impacts of the 2013–2015 warm-water anomaly in the northeast Pacific: Winners, losers, and the future. Oceanography 29:273–285.
Croll DA, Marinovic B, Benson S, Chavez FP, Black N, Ternullo R, Tershy BR (2005) From wind to whales: Trophic links in a coastal upwelling system. Mar Ecol Prog Ser 289:117–130.
Croll DA, Tershy BR, Hewitt RP, Demer DA, Fiedler PC, Smith SE, Armstrong W, Popp JM, Kiekhefer T, Lopez VR, Urban J, Gendron D (1998) An integrated approch to the foraging ecology of marine birds and mammals. Deep Res Part II Top Stud Oceanogr.
Gavrilchuk K, Lesage V, Fortune SME, Trites AW, Plourde S (2021) Foraging habitat of North Atlantic right whales has declined in the Gulf of St. Lawrence, Canada, and may be insufficient for successful reproduction. Endanger Species Res 44:113–136.
Hazen EL, Abrahms B, Brodie S, Carroll G, Jacox MG, Savoca MS, Scales KL, Sydeman WJ, Bograd SJ (2019) Marine top predators as climate and ecosystem sentinels. Front Ecol Environ 17:565–574.
Hazen EL, Jorgensen S, Rykaczewski RR, Bograd SJ, Foley DG, Jonsen ID, Shaffer SA, Dunne JP, Costa DP, Crowder LB, Block BA (2013) Predicted habitat shifts of Pacific top predators in a changing climate. Nat Clim Chang 3:234–238.
Hyrenbach KD, Forney KA, Dayton PK (2000) Marine protected areas and ocean basin management. Aquat Conserv Mar Freshw Ecosyst 10:437–458.
Meyer-Gutbrod EL, Greene CH, Davies KTA, Johns DG (2021) Ocean regime shift is driving collapse of the north atlantic right whale population. Oceanography 34:22–31.
Oestreich WK, Abrahms B, Mckenna MF, Goldbogen JA, Crowder LB, Ryan JP (2022) Acoustic signature reveals blue whales tune life history transitions to oceanographic conditions. Funct Ecol.
Piatt JF, Parrish JK, Renner HM, Schoen SK, Jones TT, Arimitsu ML, Kuletz KJ, Bodenstein B, Garcia-Reyes M, Duerr RS, Corcoran RM, Kaler RSA, McChesney J, Golightly RT, Coletti HA, Suryan RM, Burgess HK, Lindsey J, Lindquist K, Warzybok PM, Jahncke J, Roletto J, Sydeman WJ (2020) Extreme mortality and reproductive failure of common murres resulting from the northeast Pacific marine heatwave of 2014-2016. PLoS One 15:e0226087.
Scopel LC, Diamond AW, Kress SW, Hards AR, Shannon P (2018) Seabird diets as bioindicators of atlantic herring recruitment and stock size: A new tool for ecosystem-based fisheries management. Can J Fish Aquat Sci.
Silber GK, Lettrich MD, Thomas PO, Baker JD, Baumgartner M, Becker EA, Boveng P, Dick DM, Fiechter J, Forcada J, Forney KA, Griffis RB, Hare JA, Hobday AJ, Howell D, Laidre KL, Mantua N, Quakenbush L, Santora JA, Stafford KM, Spencer P, Stock C, Sydeman W, Van Houtan K, Waples RS (2017) Projecting marine mammal distribution in a changing climate. Front Mar Sci 4:413.
Sydeman WJ, Poloczanska E, Reed TE, Thompson SA (2015) Climate change and marine vertebrates. Science 350:772–777.
By Allison Dawn, GEMM Lab Master’s student, OSU Department of Fisheries, Wildlife, and Conservation Sciences, Geospatial Ecology of Marine Megafauna Lab
During my second term of graduate school, I have been preparing to write my research proposal. The last two months have been an inspiring process of deep literature dives and brainstorming sessions with my mentors. As I discussed in my last blog, I am interested in questions related to pattern and scale (fine vs. mesoscale) in the context of the Pacific Coast Feeding Group (PCFG) of gray whales, their zooplankton prey, and local environmental variables.
My work currently involves exploring which scales of pattern are important in these trophic relationships and whether the dominant scale of a pattern changes over time or space. I have researched which analysis tools would be most appropriate to analyze ecological time series data, like the impressive long-term dataset the GEMM lab has collected in Port Orford as part of the TOPAZ project, where we have monitored the abundance of whales and zooplankton, as well as environmental variables since 2016.
A useful analytical tool that I have come across in my recent coursework and literature review is called wavelet analysis. Importantly, wavelet analysis can handle non-stationarity and edge detection in time series data. Non-stationarity is when a dataset’s mean and/or variance can change over time or space, and edge detection is the identification of the change location (in time or space). For example, it is not just the cycles or “ups and downs” of zooplankton abundance I am interested in, but when in time or where in space these cycles of “ups and downs” might change in relation to what their previous values, or distances between values, were. Simply stated, non-stationarity is when what once was normal is no longer normal. Wavelet analysis has been applied across a broad range of fields, such as environmental engineering (Salas et al. 2020), climate science (Slater et al. 2021), and bio-acoustics (Buchan et al. 2021). It can be applied to any time series dataset that might violate the traditional statistical assumption of stationarity.
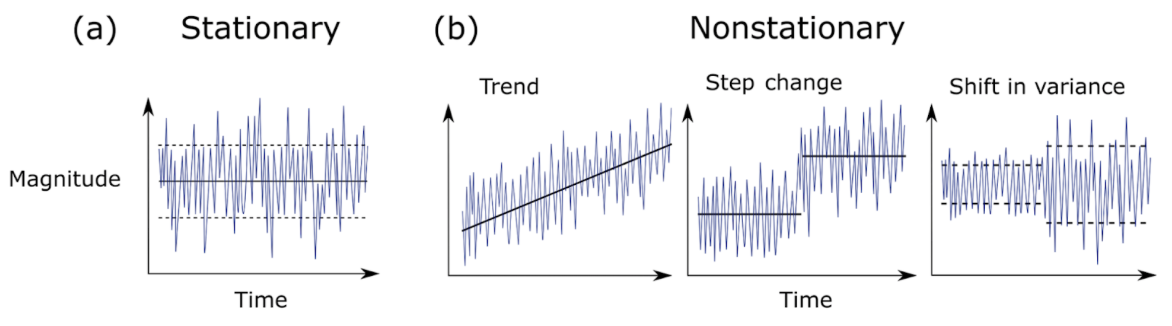
In a recent review of climate science methodology, Slater et al. (2021) outlined the possible behavior of time series data. Using theoretical plots, the authors show that data can a) have the same mean and variance over time, or b) have non-stationarity that can be broken into three major groups – trend, step change, or shifts in variance. Figure 1 further demonstrates the difference between stationary vs. non-stationary data in relation to a given variable of interest over time.
Figure 1. Plots showing the possible magnitude of a given variable across a time series: a) Stationary behavior, b) Non-stationary trend, step-change, and a shift in variance. [Taken from Slater et. al(2021)].
Traditional correlation statistics assumes stationarity, but it has been shown that ecological time series are often non-stationary at certain scales (Cazelles & Hales, 2006). In fact, ecological data rarely meets the requirements of a controlled experiment that traditional statistics require. This non-stationarity of ecological data means that while widely-used methods like generalized linear models and analyses of variances (ANOVAs) can be helpful to assess correlation, they are not always sufficient on their own to describe the complex natural phenomena ecologists seek to explain. Non-stationarity occurs frequently in ecological time series, so it is appropriate to consider analysis tools that will allow us to detect edges to further investigate the cause.
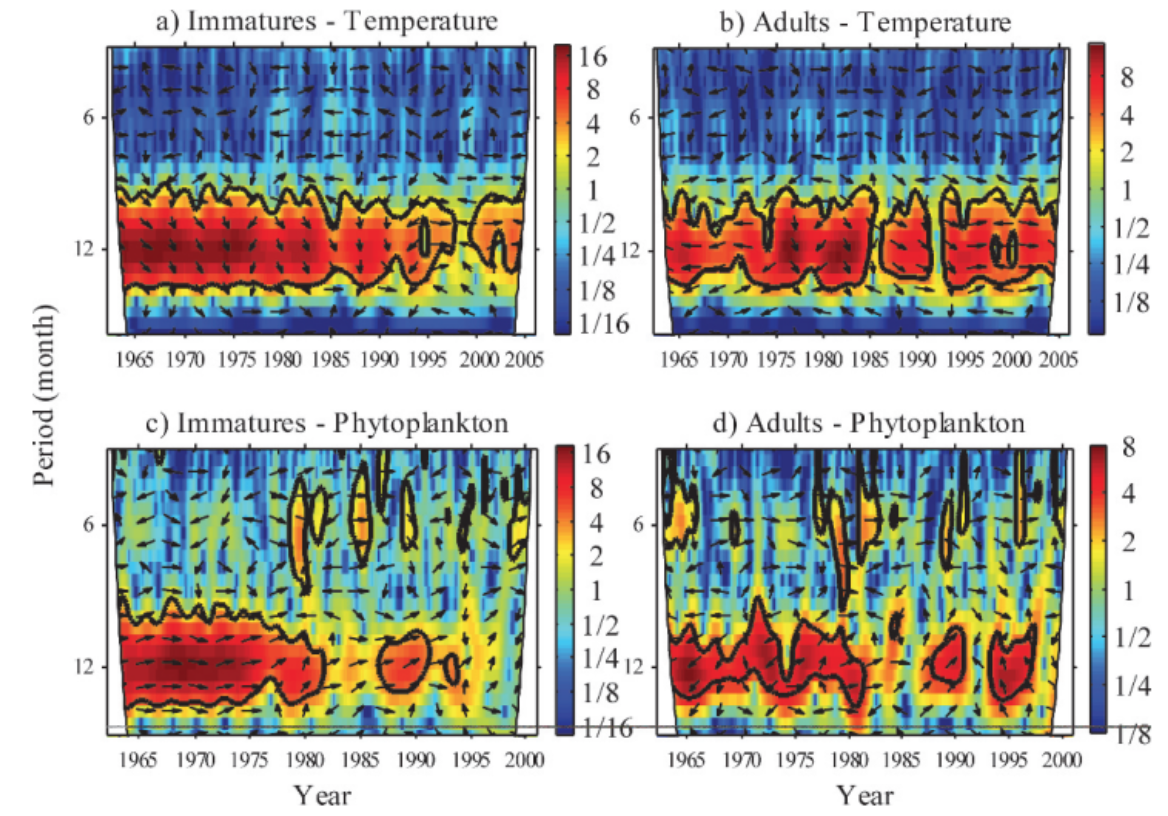
Wavelet analysis can also be conducted across a time series of multiple response variables to assess if these variables share high common power (correlation). When data is combined in this way it is called a cross-wavelet analysis. An interesting paper used cross-wavelet analysis to assess the seasonal response of zooplankton life history in relation to climate warming (Winder et. al 2009). Results from their cross-wavelet analysis showed that warming temperatures over the past two decades increased the voltinism (number of broods per year) of copepods. The authors show that where once annual recruitment followed a fairly stationary pattern, climate warming has contributed to a much more stochastic pattern of zooplankton abundance. From these results, the authors contribute to the hypothesis that climate change has had a temporal impact on zooplankton population dynamics, and recruitment has increasingly drifted out of phase from the original annual cycles.
Figure 2. Cross-wavelet spectrum for immature and adult Leptodiaptomus ashlandi for 1965 through either 2000 or 2005. Plots show a) immatures and temperature, b) adults and temperature, c) immatures and phytoplankton, and d) adults and phytoplankton. Arrows indicate phase between combined time series. 0 degrees is in-phase and 180 degrees is anti-phase. Black contour lines show “cone of influence” or the 95% significance level, every value within the cone is considered significant. Left axis shows the temporal period, and the color legend shows wavelet frequency power, with low frequencies in blue and high frequencies in red. Plots show strong covariation of high common power at the 12-month period until the 1980s. This pattern is especially evident in plot c) and d). [Taken from (Winder et. al 2009)].
While wavelet and cross-wavelet analyses should not be the only tool used to explore data, due to its limitations with significance testing, it is still worth implementing to gain a better understanding of how time series variables relate to each other over multiple spatial and/or temporal scales. It is often helpful to combine multiple methods of analysis to get a larger sense of patterns in the data, especially in spatio-temporal research.
When conducting research within the context of climate change, where the concentration of CO2 in ppm in the atmosphere is a non-stationary time series itself (Figure 3), it is important to consider how our datasets might be impacted by climate change and wavelet analysis can help identify the scales of change.
When considering our ecological time series of data in Port Orford, we want to evaluate how changing ocean conditions may be related to data trends. For example, has the annual mean or variance of zooplankton abundance changed over time, and where has that change occurred in time or space? These changes might have occurred at different scales and might be invisible at other scales. I am eager to see if wavelet analysis can detect these sorts of changes in the abundance of zooplankton across our time series of data, particularly during the seasons of intense heat waves or upwelling.
Did you enjoy this blog? Want to learn more about marine life, research and conservation? Subscribe to our blog and get a weekly email when we make a new post! Just add your name into the subscribe box on the left panel.
References
Buchan, S. J., Pérez-Santos, I., Narváez, D., Castro, L., Stafford, K. M., Baumgartner, M. F., … & Neira, S. (2021). Intraseasonal variation in southeast Pacific blue whale acoustic presence, zooplankton backscatter, and oceanographic variables on a feeding ground in Northern Chilean Patagonia. Progress in Oceanography, 199, 102709.
Cazelles, B., & Hales, S. (2006). Infectious diseases, climate influences, and nonstationarity. PLoS Medicine, 3(8), e328.
Salas, J. D., Anderson, M. L., Papalexiou, S. M., & Frances, F. (2020). PMP and climate variability and change: a review. Journal of Hydrologic Engineering, 25(12), 03120002.
Slater, L. J., Anderson, B., Buechel, M., Dadson, S., Han, S., Harrigan, S., … & Wilby, R. L. (2021). Nonstationary weather and water extremes: a review of methods for their detection, attribution, and management. Hydrology and Earth System Sciences, 25(7), 3897-3935.
Winder, M., Schindler, D. E., Essington, T. E., & Litt, A. H. (2009). Disrupted seasonal clockwork in the population dynamics of a freshwater copepod by climate warming. Limnology and Oceanography, 54(6part2), 2493-2505.
If you are an avid reader of our blog, you probably know quite a bit about gray whales, specifically the Pacific Coast Feeding Group (PCFG) of gray whales. Of the just over 50 GEMM Lab blogs written in 2021, 43% of them were about PCFG gray whales (or at least mentioned gray whales in some way). I guess this statistic is not too surprising when you consider that six of the 10 GEMM Lab members conduct gray whale-related research. You might think that we would have reached our annual limit of online gray whale content with that many blogs featuring these gentle giants, but you would in fact be wrong…
At the end of 2021, we launched a brand new website all about gray whales called IndividuWhale! It features stories of some of the Oregon coast’s most iconic gray whales, as well as information about how we study them, stressors they experience in our waters, and even a game to test your gray whale identification skills. IndividuWhale is a true labor of love that took over a year to create and that we are extremely proud to share with you today. Before I tell you more about the website, I want to take a moment to give a huge shout out to Erik Urdahl who was instrumental in getting this website off the ground and making it as interactive and beautiful as it is – hurrah Erik!
Equal‘s right side with visible boat propeller scars. Source: GEMM Lab.
Like us humans, gray whales have individual personalities and stories. They experience life-altering events, go through periods of stress, must provide for their offspring, and can behave differently to one another. Since Leigh & co. have been conducting in-depth research about PCFG gray whales in Oregon waters since 2016, we have been able to document several fascinating stories and events that these individuals have experienced. Take Equal, for example, a male whale that is at least 7 years old. The GEMM Lab observed Equal on consecutive days in June 2018, where on the first day he looked healthy and normal, but on the second day had fresh boat propeller-like scars on his back. Not only did we document these scars in photographs, but we were also able to collect a fecal sample from Equal the day we observed him with these scars. After analyzing his fecal sample for stress hormones, we discovered that Equal had very high stress levels compared to previous samples collected – unsurprising seeing as he had been hit by a boat! While this event was certainly sad for Equal (although don’t worry – we have seen him many times again in the years after this event looking healthy & normal once again), it was a very fortuitous occurrence for us since we were able to “validate” our stress hormone data relative to the value from Equal when he was clearly stressed out. Find out more about Equal as well as seven other gray whales here!
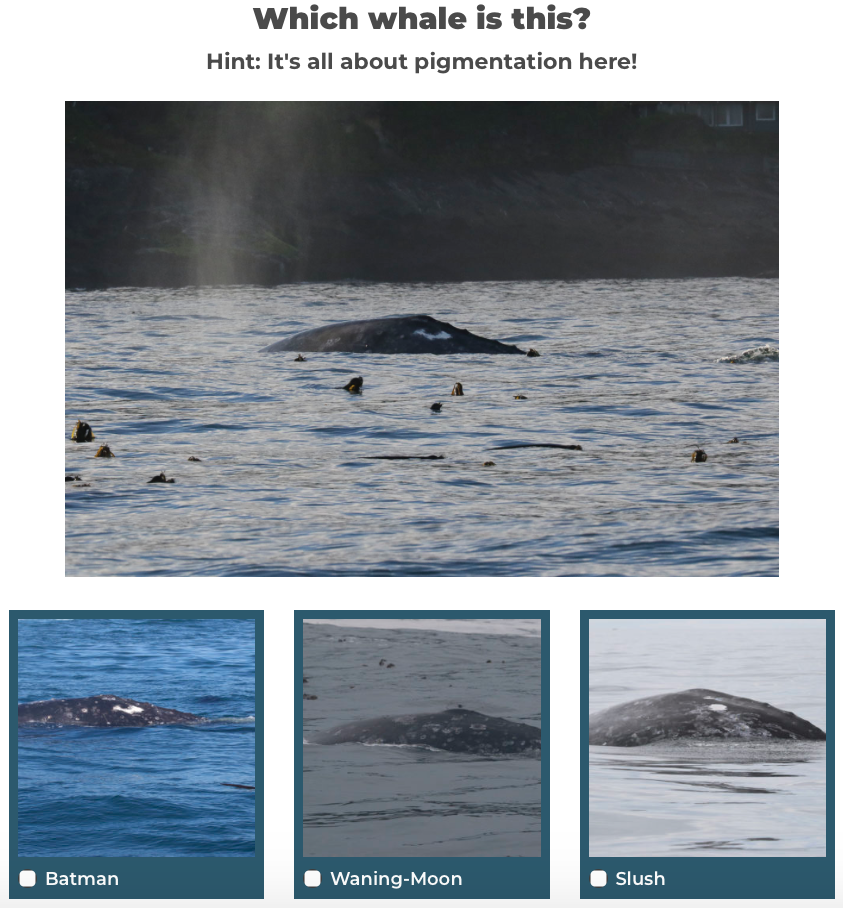
You might be wondering, how we knew that the whale with the boat propeller scar was Equal and how we recognize him again years after the incident. Gray whales have unique pigmentation patterns on their bodies and flukes that allow us to re-identify individuals between years and distinguish them from one another. Additionally, scars, such as those that Equal now carries on his back, can also be useful in telling whales apart. Therefore, we take photographs of every whale we see to match markings and identify whales. This process is called photo ID. Some individuals can have very distinctive markings, such as Roller Skate who has two big white dots on her right side, while others can look more inconspicuous, like Clouds. Therefore, conducting photo ID requires a lot of attention to detail and perseverance. To learn more about the different features we use to identify individuals, check out the “Studying Whales With Photographs” page. Do you think you have what it takes to tell individuals apart? Then try your luck at our photo ID game after!
Test your photo ID skills in our whale match game!
Unfortunately, these whales do not live in a pristine environment, as is evidenced by Equal’s story. Their main objective during the summer when in Oregon waters is to gain weight (energy stores) by consuming large amounts of prey, which is made more difficult by a number of stressors, including potential fishery entanglements, ocean noise, vessel traffic, and habitat changes. We describe these four stressors on the IndividuWhale website since we are trying to assess the impacts of them on gray whales through our research, however they are certainly not the only stressors that these whales experience. Little is known about the level at which these stressors may have a negative impact on the whales, and how whales react when they experience some of these stressors in concert. The answers to these questions are difficult to tease apart but the GRANITE project is aiming to do so through a framework called Population Consequences of Multiple Stressors (read more about it here). This approach requires a lot of data on a lot of individuals in a population and as you can see from the IndividuWhale website, we are slowly starting to get there! 2022 will certainly bring many more gray whale-themed blogs to this website, and you can share in our journey of learning about the lives of PCFG gray whales by exploring the IndividuWhale website (https://www.individuwhale.com).
Dr. Alejandro A. Fernández Ajó, Postdoctoral Scholar, Marine Mammal Institute – OSU Department of Fisheries, Wildlife, & Conservation Sciences, Geospatial Ecology of Marine Megafauna (GEMM) Lab.
I just returned to my home country, Argentina, after over 2 years without leaving the USA due to COVID-19 travel restrictions. Being back with my family, my friends, my culture, and speaking my native language feels great and relaxing. However, I returned to a country struggling to rebound from the coronavirus pandemic. I am afraid this post pandemic scenario places Argentina in a vulnerable situation. The need for economic growth could result in decisions or policies that, in the long term, hurt the country, leaving environmental damage for potential economic growth.
Argentina holds extensive oil and gas deposits, including the world’s second largest gas formation, Vaca Muerta. Although offshore (i.e., in the ocean) oil exploration and exploitation are not yet extensively developed, the intention of offshore gas and oil drilling is on the agenda. In July 2021, a public hearing was held with the purpose to consider the environmental impact assessment for carrying out seismic exploration in the North Argentinian basin off the southern coast of the Buenos Aires province. Over 90% of the participants, including scientists, researchers, technicians from various institutions, non-governmental organizations and representatives of the fishing sector spoke against the project and highlighted the negative impacts that such activity can generate on marine life, and to other socioeconomic activities such as tourism and fishing, not only in Argentina but at the regional level.
Thousands of people marched along the beaches and the main coastal cities of Argentina to protest against the approval for a seismic explorations project in the Argentinian basin. Photo source: prensaobrera.com
Seismic prospections are usually done with the purpose for oil and gas exploitation and less frequently for research purposes. In seismic prospections, ships carry out explosions with airguns, whose sound waves reach the seabed, bounce back and are captured by receivers on the ships to map the petroleum deposits in seafloor and identify potential areas for hydrocarbon extractions. The sound emitted by the seismic airguns can reach extremely loud levels of sounds that travel for thousands of miles underwater. Such extreme high levels of sound can alter the behavior of many marine species, from the smallest planktonic species, to the largest marine mammals, masking their communication, causing physical and physiological stress, interfering with their vital functions, and reducing the local availability of prey (Di Iorio & Clark, 2010; Hildebrand, 2009; Weilgart, 2018).
Here you can listen to a short audio clip of a seismic airgun firing every ~8 seconds, a typical pattern. Close your eyes and imagine you are a whale living in this environment. Now, put the clip on loop and play it for three months straight. This would be the soundscape that whales living in a region of oil and gas exploration hear, as seismic surveys often last 1-4 months (see our previous post “Hearing is believing” for more details).
Despite the public rejection and the mounting evidence about the negative impacts and environmental risks associated with such activities, the government approved the initiation of the seismic prospection off the southern coast of Buenos Aires. In response, thousands of people marched along the beaches and the main coastal cities of Argentina to protest against the oil exploration project. The areas where the seismic surveys will be carried out overlap largely with the southern right whale’s migration routes and feeding areas during their spring and summer (Figure 1). Likewise, the area overlaps with highly productive areas in the ocean that hosts great biodiversity of species of ecological and commercial importance, including the feeding areas of seabirds, turtles and other marine mammals. Additionally, the seismic activity will endanger the health of the beaches of the coast of Buenos Aires and Uruguay where thousands of tourists spend the summer to escape from the large cities.
Figure 1. The map on the left is showing (light blue squares CAN_100, CAN_108, and CAN_114) the areas where seismic prospections are proposes. The map on the right is showing the individual satellite track lines for eleven individual southern right whales (SRW) during the feeding season. You can observe that the proposed area for seismic explorations overlaps with critical feeding habitat for the SRW. Source: Whale Conservation Institute of Argentina (ICB).
The impacts of these activities to marine wildlife are difficult to control and monitor (Elliott et al. 2019, Gordon et al, 2003), especially for large whales that are a very challenging taxa to study (Hunt et al. 2013). We know that the ability to perceive biologically important sounds is critical to marine mammals, and acoustic disturbance through human-generated noise can interfere with their natural functions. Sounds from seismic surveys are intense and have peak frequency bands overlapping those used by baleen whales (Di Lorio & Clark, 2010); however, evidence of interference with baleen whale acoustic communication, and the effects on their health and physiology are sparse. In this context, the GEMM Lab project GRANITE (Gray Whale Response to Ambient Noise Informed by Technology and Ecology), plans to generate information to fulfill these knowledge gaps and provide tools to aid conservation and management decisions in terms of allowable noise level in whale habitats. I am hopeful such information will reach decision makers and influence their decisions, however, sometimes it is frustrating to see how evidence-based information generated with high quality standards are often ignored.
The recent approval of the seismic exploration in Argentina is an example of my frustration. There is no way that the oil industry can guarantee a low-risk of impact on biodiversity and the environment. There are too many examples of environmental catastrophes related to the oil industries at sea that speak for themselves. Moreover, the promotion of such activities goes against the compromises assumed by the country to work to mitigate the effects of Climate Change, and to achieve the reductions of the greenhouse gas emissions to comply with the Paris Agreement. Decades of research help recognized the areas that would be impacted by these seismic activities as key habitat for the life cycle of whales, penguins, seals and more. But, apparently all these scientific data are ignored at the time of weighing the tradeoffs between “economic development” and environmental impacts. As a conservation biologist, I am questioning what can be done in order to be heard and significantly influence such decisions.
Did you enjoy this blog? Want to learn more about marine life, research, and conservation? Subscribe to our blog and get a weekly alert when we make a new post! Just add your name into the subscribe box on the left panel.
References:
Di Iorio, L., & Clark, C. W. (2010). Exposure to seismic survey alters blue whale acoustic communication. Biology Letters, 6(1), 51–54. https://doi.org/10.1098/rsbl.2009.0651
Weilgart, L. (2018). The impact of ocean noise pollution on fish and invertebrates. Report for OceanCare, Switzerland.
Elliott, B. W., Read, A. J., Godley, B. J., Nelms, S. E., & Nowacek, D. P. (2019). Critical information gaps remain in understanding impacts of industrial seismic surveys on marine vertebrates. In Endangered Species Research (Vol. 39, pp. 247–254). Inter-Research. https://doi.org/10.3354/esr00968
Gordon, J., Gillespie, D., Potter, J., Frantzis, A., Simmonds, M. P., Swift, R., & Thompson, D. (2003). A review of the effects of seismic surveys on marine mammals. Marine Technology Society Journal, 37(4), 16-34.
Hunt, K. E., Moore, M. J., Rolland, R. M., Kellar, N. M., Hall, A. J., Kershaw, J., Raverty, S. A., Davis, C. E., Yeates, L. C., Fauquier, D. A., Rowles, T. K., & Kraus, S. D. (2013). Overcoming the challenges of studying conservation physiology in large whales: a review of available methods. Conservation Physiology, cot006–cot006. https://doi.org/10.1093/conphys/cot006
Dr. KC Bierlich, Postdoctoral Scholar, OSU Department of Fisheries, Wildlife, & Conservation Sciences, Geospatial Ecology of Marine Megafauna (GEMM) Lab
The recent advancement in drones (or unoccupied aircraft systems, UAS) has greatly enhanced opportunities for scientists across a broad range of disciplines to collect high-resolution aerial imagery. Wildlife researchers in particular have utilized this technology to study large elusive animals, such as whales, to observe their behavior (see Clara Bird’s blog) and obtain morphological measurements via photogrammetry (see previous blog for a brief history on photogrammetry and drones). However, obtaining useful measurement data is not as easy as flying the drone and pressing record. For this blog, I will provide a brief overview on the basics of using photogrammetry to extract morphological measurements from images collected with drones, as well as the associated uncertainty from using different drone platforms.
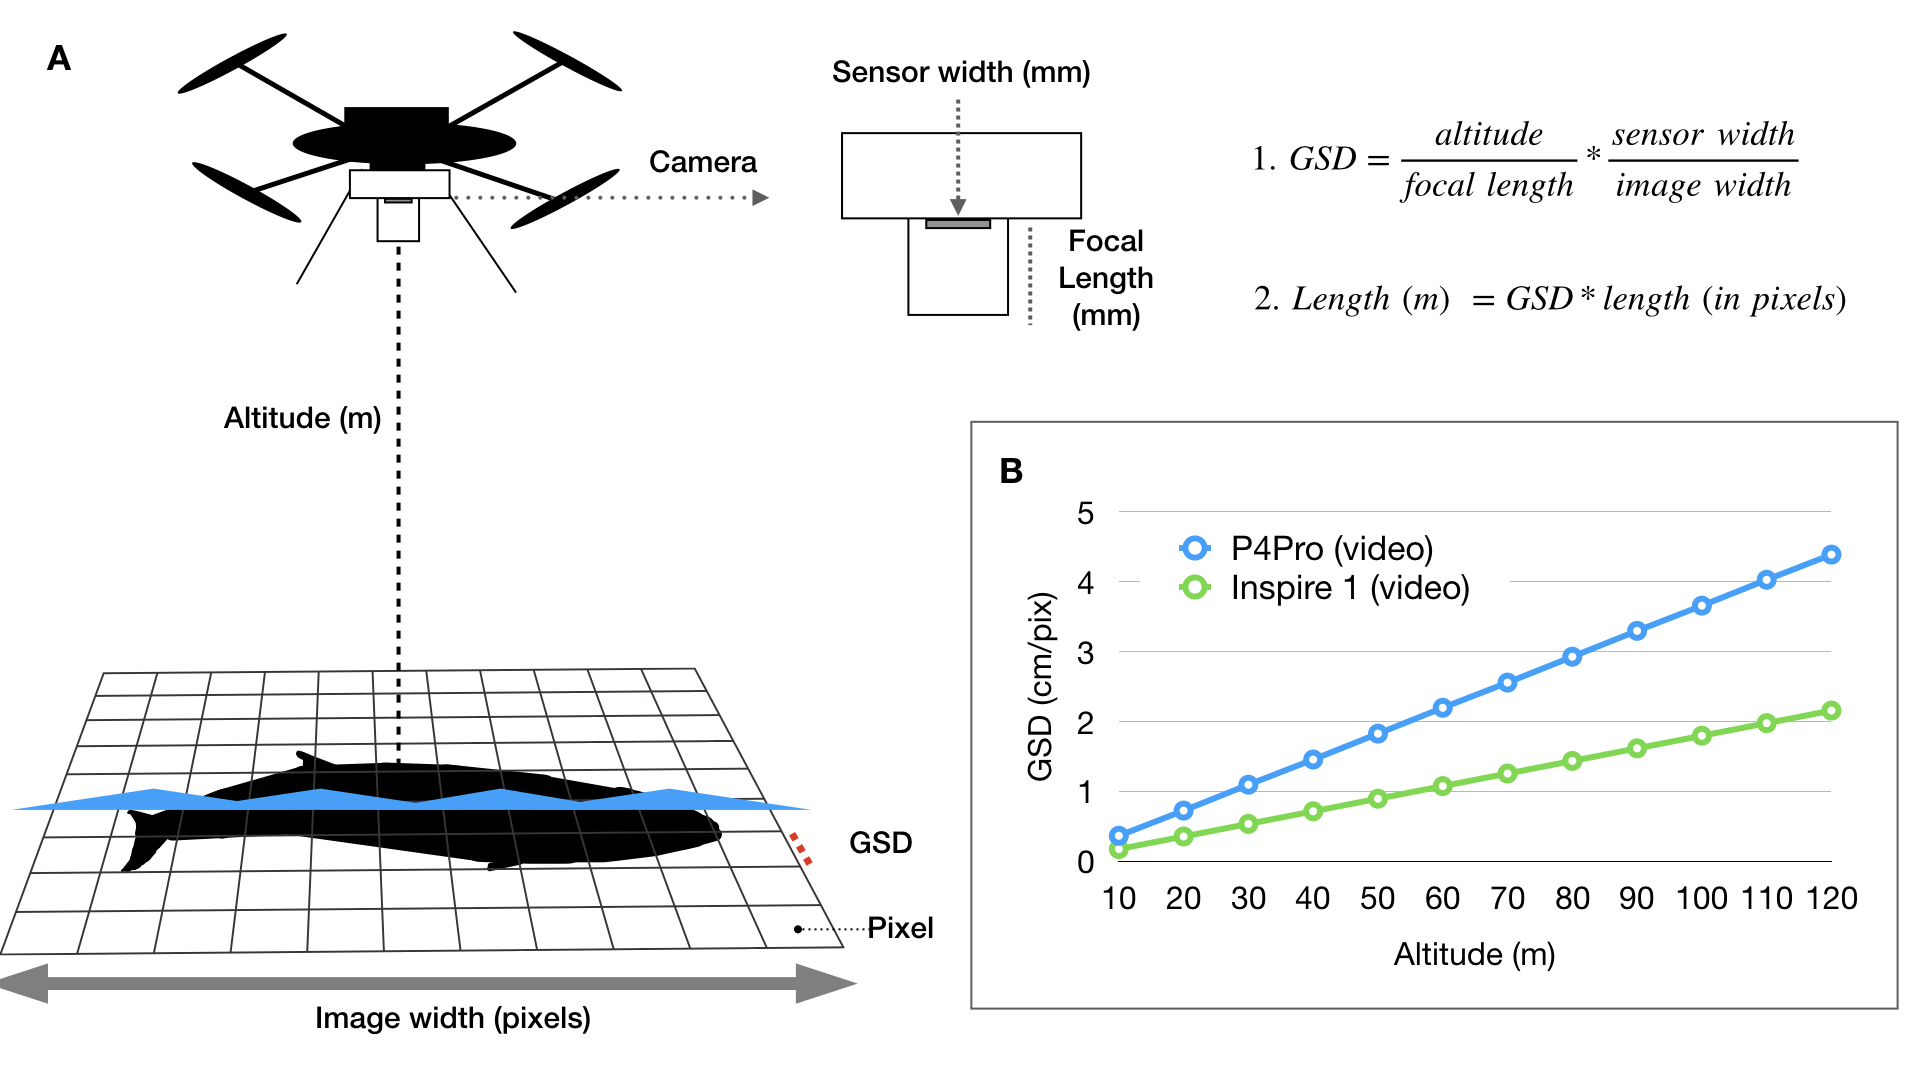
During my PhD at Duke University, I co-developed an open-source photogrammetry software called MorphoMetriX to measure whales in images I collected using drones (Fig. 1) (Torres and Bierlich, 2020) (see this blog for some fieldwork memoirs!). The software is designed to be flexible, simple to use, and customizable without knowledge of scripting languages. Using MorphoMetriX, measurements are made in pixels and then multiplied by the ground sampling distance (GSD) to convert to standard units (e.g., meters) (Fig. 2A). GSD represents the distance on the ground each pixel represents (i.e., the linear size of the pixel) and therefore sets the scale of the image (i.e., cm per pixel). Figure 2A describes how GSD is dependent on the camera sensor, focal length lens, and altitude. Thus, drones equipped with different cameras and focal length lenses will have inherent differences in GSD as altitude increases (Fig. 2B). A larger GSD increases the length each pixel represents in a photo and results in a lower resolution image, potentially obscuring important features in the photo and introducing measurement error.
Figure 1. An example of a Pacific Coast Feeding Group gray whale measured in MorphoMetriX (Torres & Bierlich, 2020).Figure 2: Overview of photogrammetry methods and calculating ground sampling distance (GSD). A) Photogrammetry methods for how each image is scaled to convert measurements in pixels to standard units (e.g., meters). Altitude is the distance between the camera lens and whale (usually at the surface of the water). Figure from Torres and Bierlich (2020). B) The exact (not accounting for distortion or altitude error) ground sampling distance (GSD) for two drone platforms commonly used to obtain morphological measurements of cetaceans. The difference in GSD between the P4Pro and Inspire 1 is due to the difference in sensor width and focal lengths of the cameras used. Figure from Bierlich et al. (2021).
Obtaining accurate altitude information is a key component in obtaining accurate measurements. All drones are equipped with a barometer, which measures altitude from changes in pressure. In general, barometers usually yield low accuracy in the altitude recorded, particularly for low-cost sensors commonly found on small, off-the-shelf drones (Wei et al., 2016). Dawson et al. (2017) added a laser altimeter (i.e., LightWare SF11/C, https://www.mouser.com//datasheet//2//321//28054-SF11-Laser-Altimeter-Manual-Rev8-1371857.pdf) to a drone, which yields higher accuracy in the altitude recorded. Since then, several studies have adopted use of a laser altimeter to study different species of baleen whales (i.e., Gough et al., 2019; Christiansen et al., 2018).
The first chapter of my dissertation, which was published last year in Marine Ecology Progress Series, compared the accuracy of several drones equipped with different camera sensors, focal length lenses, and a barometer vs. laser altimeter (Bierlich et al., 2021). We flew each drone over a known sized object floating at the surface and collected images at various altitudes (between 10 – 120 m). We used the known size of the floating object to determine the percent error of each measurement at each altitude. We found that 1) there is a lot of variation in measurement error across the different drones when using a barometer to measure altitude and 2) using a laser altimeter dramatically reduces measurement error for each drone (Fig. 3).
Figure 3. The % error for measurements from different drones. Black dashed line represents 0% error (true length = 1.48 m). The gray dashed lines represent under- and over-estimation of the true length by 5% (1.41 and 1.55 m, respectively).
These findings are important because if a study is analyzing measurements that are from more than one drone, the uncertainty associated with those measurements must be taken into account to know if measurements are reliable and comparable. For instance, let’s say we are comparing the body length of two different populations and found that population A is significantly longer than population B. From looking at Figure 3, that significant difference in length between population A and B could be unreliable as the difference may be due to the bias introduced by the type of drone, camera sensor, focal length lens, and whether a barometer or laser altimeter was used for recording altitude. In other words, without incorporating uncertainty associated with each measurement, how do you trust your measurement?
Hence, the National Institute of Standards and Technology (NIST) states that a measurement is complete only when accompanied by a quantitative statement of its uncertainty (Taylor & Kuyatt, 1994). In our Bierlich et al. (2021) study, we develop a Bayesian statistical model where we use the measurements of the known-sized object floating at the surface (what was used for Fig. 3) as training data to predict the lengths of unknown-sized whales. This Bayesian approach views data and the underlying parameters that generated the data (such as the mean or standard deviation) as random, and thus can be described by a statistical distribution. Using Bayes’ Theorem, a model of the observed data (called the likelihood function), is combined with prior knowledge pertaining to the underlying parameters (called the prior probability distribution) to form the posterior probability distribution, which serves as updated knowledge about the underlying parameter. For example, if someone told me they saw a 75 ft blue whale, I would not be phased. But if someone told me they saw a 150 ft blue whale, I would be skeptical – I’m using prior knowledge to determine the probability of this statement being true.
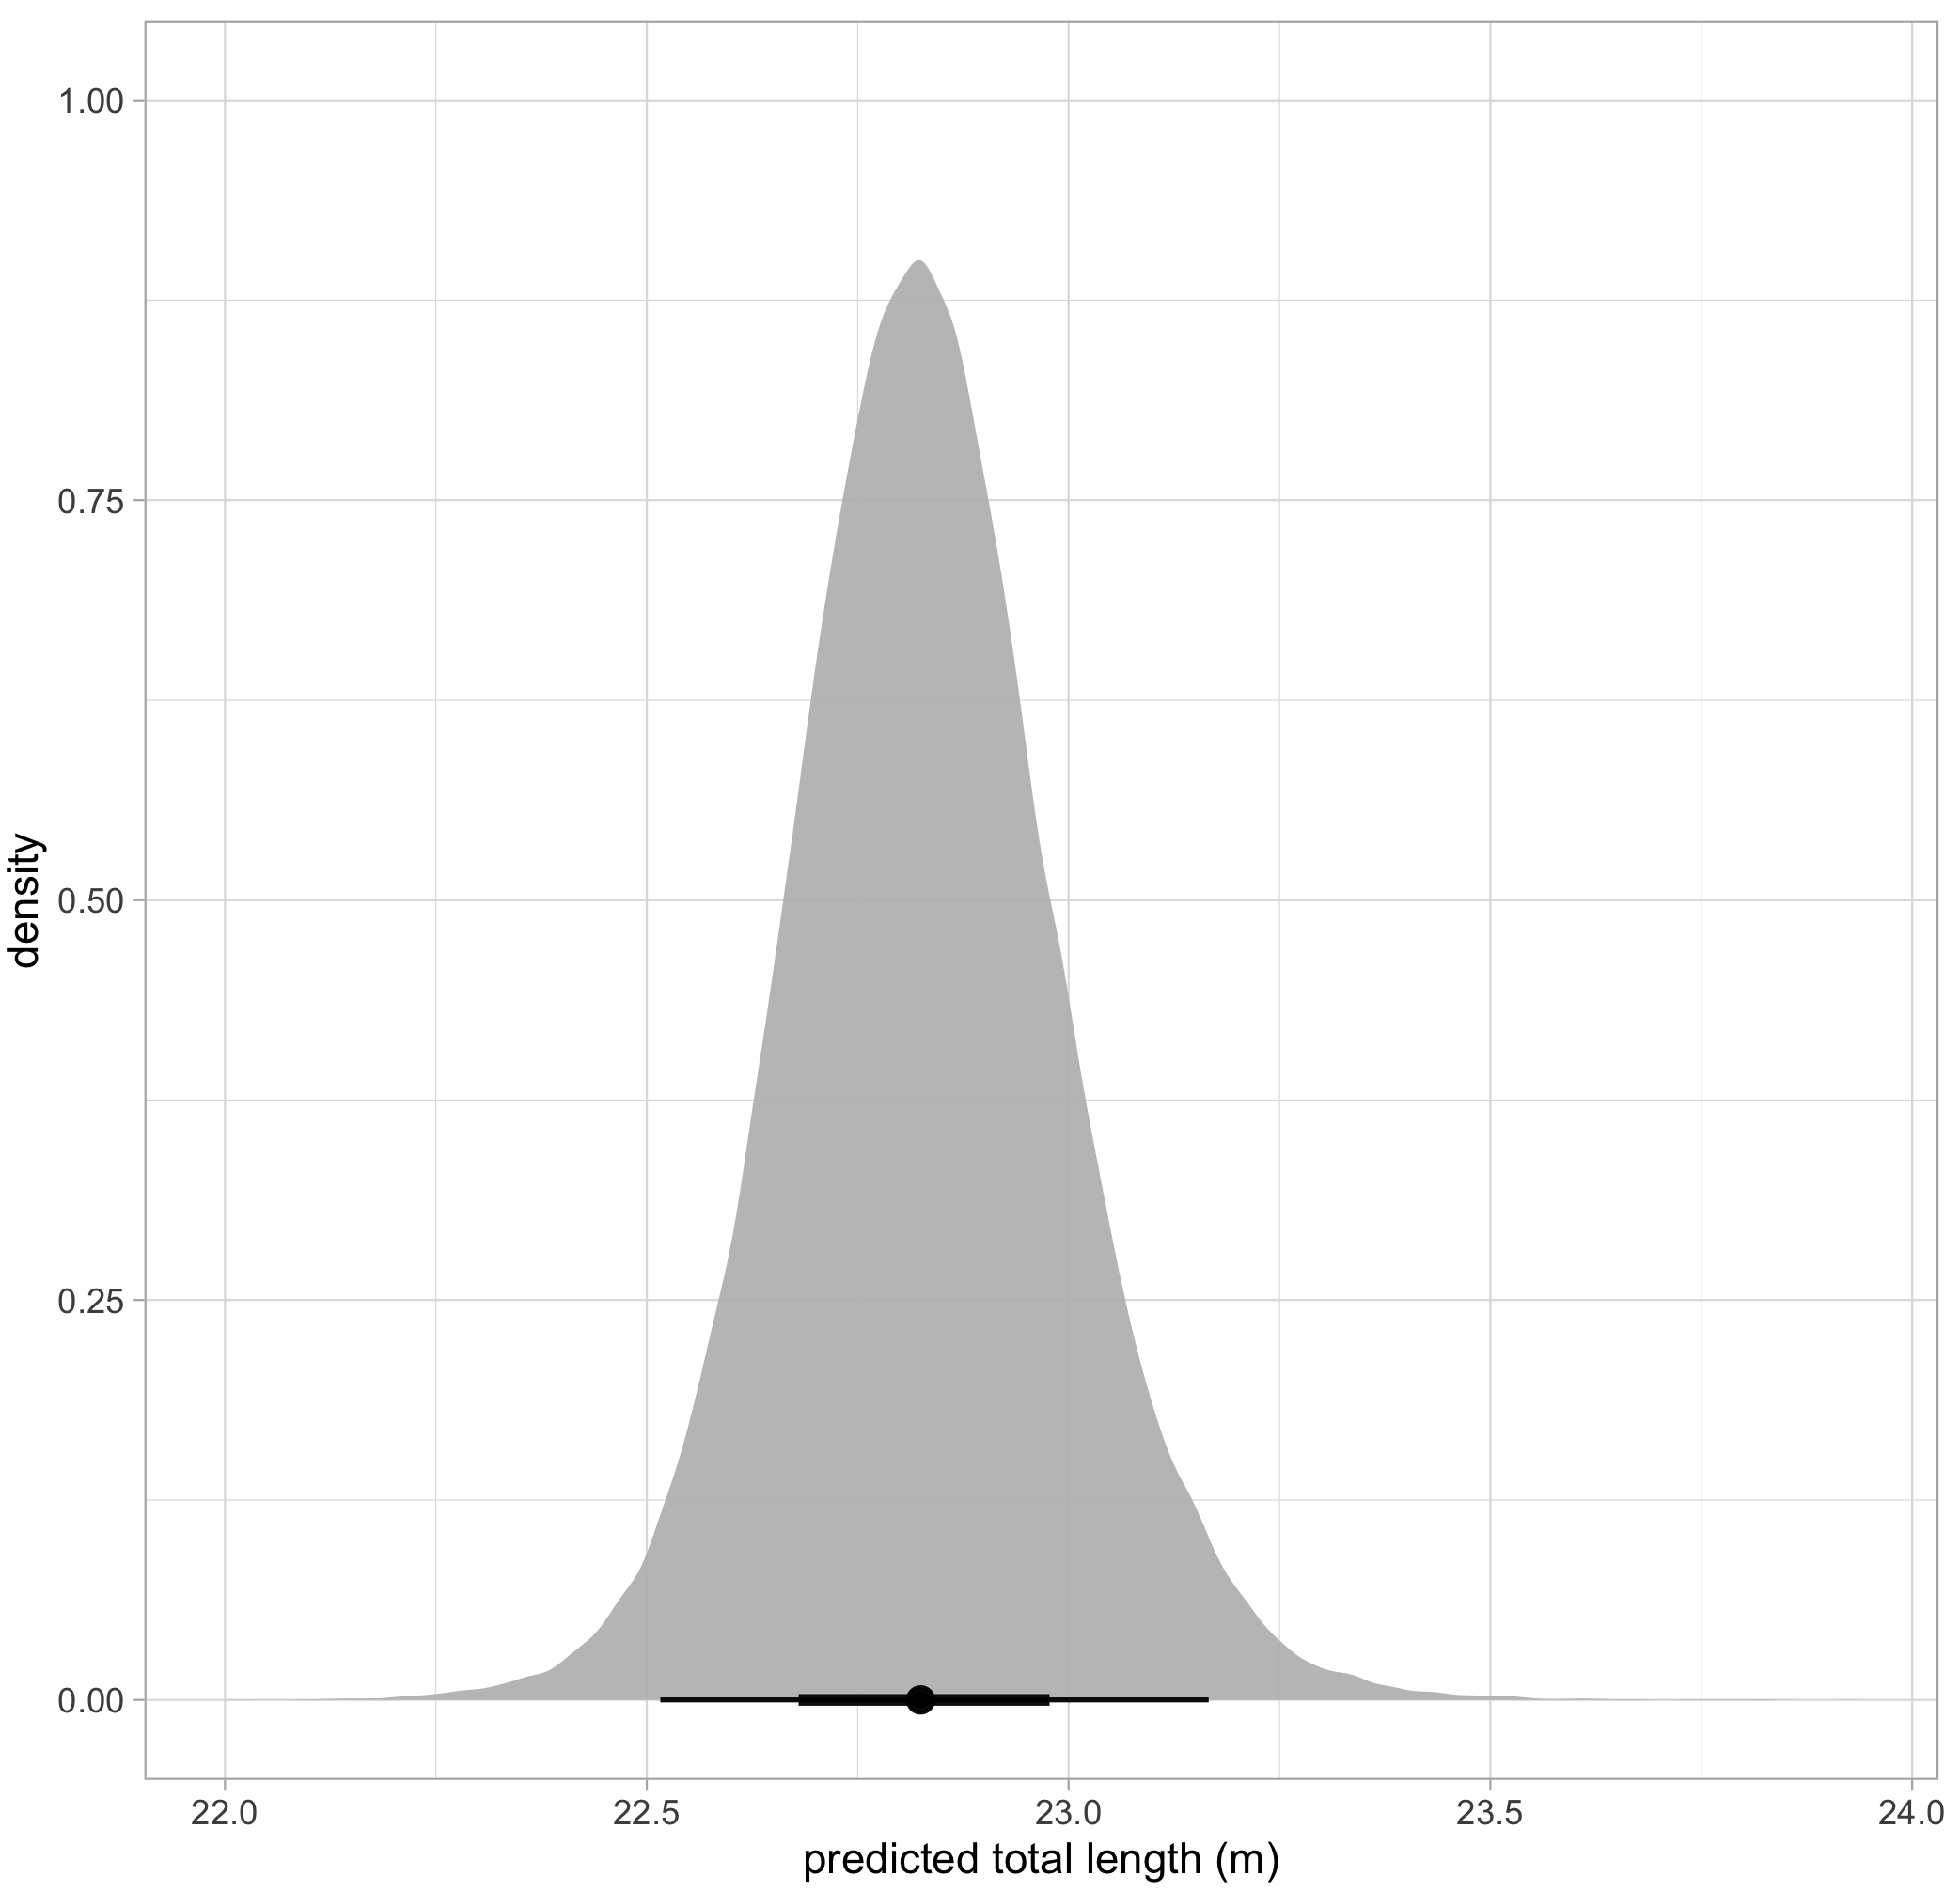
The posterior probability distribution produced by this Bayesian approach can also serve as new prior information for subsequent analyses. Following this framework, we used the known-sized objects to first estimate the posterior probability distribution for error for each drone. We then used that posterior probability distribution for error specific to each drone platform as prior information to form a posterior predictive distribution for length of unknown-sized whales. The length of an individual whale can then be described by the mean of this second posterior predictive distribution, and its uncertainty defined as the variance or an interval around the mean (Fig. 4).
Figure 4. An example of a posterior predictive distribution for total length of an individual blue whale. The black bars represent the uncertainty around the mean value (the black dot) – the longer black bars represent the 95% highest posterior density (HPD) interval, and the shorter black bars represent the 65% HPD interval.
For over half a decade, the GEMM Lab has been collecting drone images of Pacific Coast Feeding Group (PCFG) of gray whales off the coast of Oregon to measure their morphology and body condition (see GRANITE Project Blog). We have been using several different types of drones equipped with different cameras, focal length lenses, barometers, and laser altimeters. These measurements from different drones will inherently have different levels of error associated with them, so adapting these methods for incorporating uncertainty will be key to ensure our measurements are comparable and analyses are robust. To do this, we fly over a known-sized board (1 m) at the start of each flight to use as training data to generate a posterior predictive distribution for length of the an unknown-sized PCFG gray whale that we fly over (Fig. 5). Likewise, we are working closely with several other collaborators who are also using different drones. Incorporating measurement uncertainty from drones used across research labs and in different environments will help ensure robust analyses and provide great opportunity for some interesting comparisons – such as differences in gray whale body condition on their feeding grounds in Oregon vs. their breeding grounds in Baja, Mexico, and morphological comparisons with other baleen whale species, such as blue and humpback whales. We are currently wrapping up measurement from thousands of boards (Fig. 5) and whales (Fig. 1) from 2016 – 2021, so stay tuned for the results!
Figure 5. An example of a known-sized object (1 m long board) used as training data to assess measurement uncertainty.
References
Bierlich, K.C., Schick, R.S., Hewitt, J., Dale, J., Goldbogen, J.A., Friedlaender, A.S., Johnston D.J. (2021). A Bayesian approach for predicting photogrammetric uncertainty in morphometric measurements derived from UAS. Marine Ecology Progress Series. DOI: https://doi.org/10.3354/meps13814
Christiansen F, Vivier F, Charlton C, Ward R, Amerson A, Burnell S, Bejder L (2018) Maternal body size and condition determine calf growth rates in southern right whales. Mar Ecol Prog Ser 592: 267−281
Dawson SM, Bowman MH, Leunissen E, Sirguey P (2017) Inexpensive aerial photogrammetry for studies of whales and large marine animals. Front Mar Sci 4: 366
Gough, W.T., Segre, P.S., Bierlich, K.C., Cade, D.E., Potvin, J., Fish, F. E., Dale, J., di Clemente, J., Friedlaender, A.S., Johnston, D.W., Kahane-Rapport, S.R., Kennedy, J., Long, J.H., Oudejans, M., Penry, G., Savoca, M.S., Simon, M., Videsen, S.K.A., Visser, F., Wiley, D.N., Goldbogen, J.A. (2019). Scaling of swimming performance in baleen whales. Journal of Experimental Biology, 222(20).https://doi.org/10.1242/jeb.204172
Taylor, B. N., and Kuyatt, C. E. (1994). Guidelines for Evaluating and Expressing the Uncertainty of NIST Measurement Results. Washington, DC: National Institute of Standards and Technology. 1–25.
Torres, W.I., & Bierlich, K.C. (2020). MorphoMetriX: a photogrammetric measurement GUI for morphometric analysis of megafauna. Journal of Open Source Software, 5(45), 1825. https://doi.org/10.21105/joss.01825
Wei S, Dan G, Chen H (2016) Altitude data fusion utilizing differential measurement and complementary filter. IET Sci Meas Technol (Singap) 10: 874−879
“Why don’t you just automate it?” This is a question I am frequently asked when I tell someone about my work. My thesis involves watching many hours of drone footage of gray whales and meticulously coding behaviors, and there are plenty of days when I have asked myself that very same question. Streamlining my process is certainly appealing and given how wide-spread and effective machine learning methods have become, it is a tempting option to pursue. That said, machine learning is only appropriate for certain research questions and scales, and it’s important to consider these before investing in using a new tool.
The application of machine learning methods to behavioral ecology is called computational ethology (Anderson & Perona, 2014). To identify behaviors from videos, the model tracks individuals across video frames and identifies patterns of movement that form a behavior. This concept is similar to the way we identify a whale as traveling if it’s moving in a straight line and as foraging if it’s swimming in circles within a small area (Mayo & Marx, 1990, check out this blog to learn more). The level of behavioral detail that the model is able to track depends on the chosen method (Figure 1, Pereira et al., 2020). These methods range from tracking each animal as a simple single point (called a centroid) to tracking the animal’s body positioning in 3D (this method is called pose estimation), which range from providing less detailed to more detailed behavior definitions. For example, tracking an individual as a centroid could be used to classify traveling and foraging behaviors, while pose estimation could identify specific foraging tactics.
Figure 1. Figure from Pereira et al. (2020) illustrating the different methods of animal behavior tracking that are possible using machine learning.
Pose estimation involves training the machine learning algorithm to track individual anatomical features of an individual (e.g., the head, legs, and tail of a rat), meaning that it can define behaviors in great detail. A behavior state could be defined as a combination of the angle between the tail and the head, and the stride length.
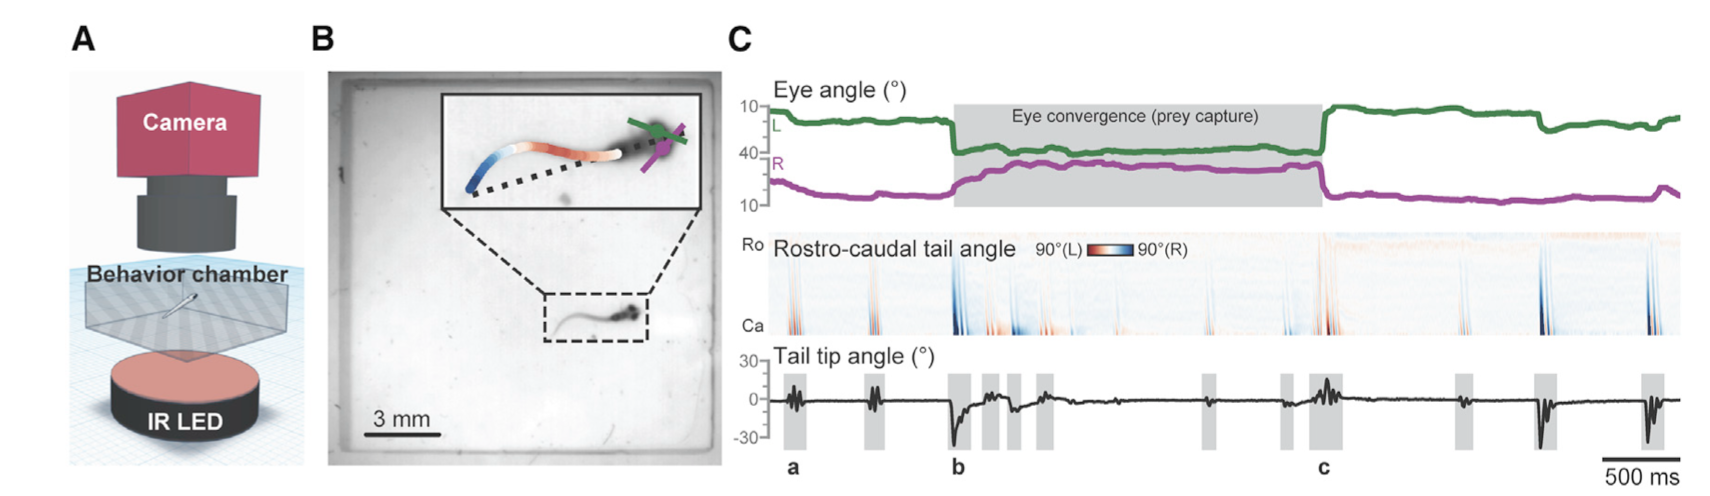
For example, Mearns et al. (2020) used pose estimation to study how zebrafish larvae in a lab captured their prey. They tracked the tail movements of individual larvae when presented with prey and classified these movements into separate behaviors that allowed them to associate specific behaviors with prey capture (Figure 2). The authors found that these behaviors occurred in a specific sequence, that the behaviors kept the prey within the larvae’s line of sight, and that the sequence was triggered by visual cues. In fact, when they removed the visual cue of the prey, the larvae terminated the behavior sequence, meaning that the larvae are continually choosing to do each behavior in the sequence, rather than the sequence being one long behavior event that is triggered only by the initial visual cue. This study is a good example of the applicability of machine learning models for questions aimed at kinematics and fine-scale movements. Pose estimation has also been used to study the role of facial expression and body language in rat social communication (Ebbesen & Froemke, 2021).
Figure 2. Excerpt from figure 1 of Mearns et al. (2020) illustrating (A) the camera set up for their experiment, (B) how the model tracked the eye angles and tail of the larvae fish, (C) the kinematics extracted from the footage. In panel (C) the top plot shows how the eyes converged on the same object (the prey) during prey capture event, the middle plot shows when the tail was curved to the left or the right, and the bottom plot shows the angle of the tail tip relative to the body.
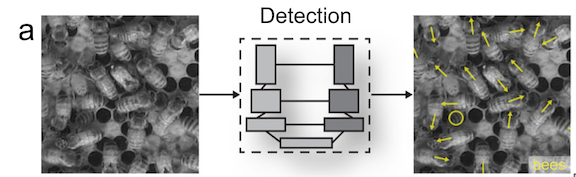
While previous machine learning methods to track animal movements required individuals to be physically marked, the current methods can perform markerless tracking (Pereira et al., 2020). This improvement has broadened the kinds of studies that are possible. For example, Bozek et al., (2021) developed a model that tracked individuals throughout an entire honeybee colony and showed that certain individual behaviors were spatially distributed within the colony (Figure 3). Machine learning enabled the researchers to track over 1000 individual bees over several months, a task that would be infeasible for someone to do by hand.
Figure 3. Excerpt from figure 1 of Bozek et al., (2021) showing how individual bees and their trajectories were tracked.
These studies highlight that the potential benefits of using machine learning when studying fine scale behaviors (like kinematics) or when tracking large groups of individuals. Furthermore, once it’s trained, the model can process large quantities of data in a standardized way to free up time for the scientists to focus on other tasks.
While machine learning is an exciting and enticing tool, automating behavior detection via machine learning could be its own PhD dissertation. Like most things in life, there are costs and benefits to using this technique. It is a technically difficult tool, and while applications exist to make it more accessible, knowledge of the computer science behind it is necessary to apply it effectively and correctly. Secondly, it can be tedious and time consuming to create a training dataset for the model to “learn” what each behavior looks like, as this step involves manually labeling examples for the model to use.
As I’ve mentioned in a previous blog, I came quite close to trying to study the kinematics of gray whale foraging behaviors but ultimately decided that counting fluke beats wasn’t necessary to answer my behavioral research questions. It was important to consider the scale of my questions (as described in Allison’s blog) and I think that diving into more fine-scale kinematics questions could be a fascinating follow-up to the questions I’m asking in my PhD.
For instance, it would be interesting to quantify how gray whales use their flukes for different behavior tactics. Do gray whales in better body condition beat their flukes more frequently while headstanding? Does the size of the fluke affect how efficiently they can perform certain tactics? While these analyses would help quantify the energetic costs of different behaviors in better detail, they aren’t necessary for my broad scale questions. Consequently, taking the time to develop and train a pose estimation machine learning model is not the best use of my time.
That being said, I am interested in applying machine learning methods to a specific subset of my dataset. In social behavior, it is not only useful to quantify the behaviors exhibited by each individual but also the distance between them. For example, the distance between a mom and her calf can be indicative of the calves’ dependence on its mom (Nielsen et al., 2019). However, continuously measuring the distance between two individuals throughout a video is tedious and time intensive, so training a machine learning model could be an effective use of time. I plan to work with an intern this summer to develop a machine learning model to track the distance between pairs of gray whales in our drone footage and then relate this distance data with the manually coded behaviors to examine patterns in social behavior (Figure 4). Stay tuned to learn more about our progress!
Figure 4. A mom and calf pair surfacing together. Image collected under NOAA/NMFS permit #21678
Did you enjoy this blog? Want to learn more about marine life, research, and conservation? Subscribe to our blog and get a weekly alert when we make a new post! Just add your name into the subscribe box on the left panel.
References
Anderson, D. J., & Perona, P. (2014). Toward a Science of Computational Ethology. Neuron, 84(1), 18–31. https://doi.org/10.1016/j.neuron.2014.09.005
Bozek, K., Hebert, L., Portugal, Y., Mikheyev, A. S., & Stephens, G. J. (2021). Markerless tracking of an entire honey bee colony. Nature Communications, 12(1), 1733. https://doi.org/10.1038/s41467-021-21769-1
Ebbesen, C. L., & Froemke, R. C. (2021). Body language signals for rodent social communication. Current Opinion in Neurobiology, 68, 91–106. https://doi.org/10.1016/j.conb.2021.01.008
Mayo, C. A., & Marx, M. K. (1990). Surface foraging behaviour of the North Atlantic right whale, Eubalaena glacialis , and associated zooplankton characteristics. Canadian Journal of Zoology, 68(10), 2214–2220. https://doi.org/10.1139/z90-308
Mearns, D. S., Donovan, J. C., Fernandes, A. M., Semmelhack, J. L., & Baier, H. (2020). Deconstructing Hunting Behavior Reveals a Tightly Coupled Stimulus-Response Loop. Current Biology, 30(1), 54-69.e9. https://doi.org/10.1016/j.cub.2019.11.022
Nielsen, M., Sprogis, K., Bejder, L., Madsen, P., & Christiansen, F. (2019). Behavioural development in southern right whale calves. Marine Ecology Progress Series, 629, 219–234. https://doi.org/10.3354/meps13125
Pereira, T. D., Shaevitz, J. W., & Murthy, M. (2020). Quantifying behavior to understand the brain. Nature Neuroscience, 23(12), 1537–1549. https://doi.org/10.1038/s41593-020-00734-z
This year in late February is the 2022 Ocean Sciences Meeting, an interdisciplinary bonanza of ocean scientists from all over the world. The conference will be held online this year as a precaution against Covid-19, and a week of virtual talks and poster sessions will cover new research in diverse topics from microbial ecology to ocean technology to whale vocalizations.
The meeting will also include my first poster presentation at a major conference, and so I have the typical grad student jitters that accompany each new thing I do (read more about the common experience of “imposter syndrome” here). This poster is the first time since starting graduate school and joining Project OPAL that I’m trying to craft a full science story that connects whales, their prey, and oceanographic conditions.
Learning how to do the analyses to assess and quantify these connections has involved plenty of head-scratching and periodic frustration on my part, but it has also offered a surprisingly joyful and even moving experience. In my efforts to troubleshoot a problem with my prey analysis, I’ve reached out to nearly everyone who works with krill acoustic data on the West Coast. Every single person has been incredibly welcoming and ready to help me, and excited to learn about my work in return. This experience has made me realize how many people I have on my team, and that even strangers are willing to support me on the whacky journey that is a PhD.
Through these collaborations, I am learning to analyze the acoustic signal of krill, small animals that are important food for whales foraging off the coast of Oregon and beyond. As part of Project OPAL, we plan to compare krill swarms with whale survey data to learn about the types of aggregations that whales are drawn to. From the perspective of a hungry whale, not all krill are created equal.
Analysis of a layer of krill in the upper ocean. The blue color in the top panel indicates scattering of acoustic signal by the krill, and the outline in the bottom panel shows the results of an algorithm programmed to detect krill aggregations.
In addition to developing great remote relationships through this work, the ability to meet in person as we continue adapting to life during the pandemic has absolutely not lost its thrill. After over a year of meetings and collaborating on Zoom, I was delighted to meet GEMM Lab postdoc Solène Derville this January, after she journeyed from her home in New Caledonia to Oregon. It was so exciting to see her in real life (we’re more similar in height than I knew!) and a few minutes into our first lunch together she was already helping me refine my analysis plans and think of new approaches.
Our interaction also made me think about how impressive the GEMM Lab is. The first two people Solène saw upon her arrival in Oregon were me and fellow GEMM Lab student Allison Dawn, two newer members who joined the lab after her last trip to Oregon. Without a moment of hesitation, Allison stepped up to give Solène a ride to Newport from Corvallis to finish her long journey. The connection our lab has developed and maintained during a pandemic, across borders and time zones, is special.
Hiking on gorgeous days is just one of the many benefits of being in the same place! This adventure included spotting a whale blow off the coast and a lot of GEMM excitement.
As I look out at the next few weeks until the Ocean Sciences meeting, and out towards the rest of my PhD, I inevitably feel worried about all I need to accomplish. But, I know that the dynamics in our lab and the other collaborative relationships I’m forming are what will carry me through. Every meeting and new connection reminds me that I’m not doing this alone. I’m grateful that there’s a team of people who are ready and willing to help me muddle my way through my first Principal Components Analysis, puzzle over algorithm errors, and celebrate with me as we make progress.
Since coming back from winter holiday, things have picked back up to my normal pace of GO! and I’ve taken little to no “down time” in my awaken hours. As a grad student who is also a mother to an active 11-year-old daughter and two dogs, my days are packed. Although I do enjoy a life of steady movement and accomplishment, I also need to do “nothing” sometimes, like a recluse who needs to see the sun on occasion. So, this evening I decided that I would have a night of fun and I took my daughter to see a movie. We haven’t been to the movies much since the pandemic started, but it is one of our most beloved things to do. I heard the theatres were like ghost towns since the recent omicron surge anyway, so we showed up and were one of two families there. We picked a comedy and ordered a bucket of popcorn, nachos (no jalapeños, just the cheese), slurpies, soft pretzels, and sour patch kids (I told the cashier to have two wheelchairs ready to haul us out of there post feast). We laughed and sang and by the near end of the movie, I had a moment of self-realization: I felt really relaxed. This epiphany was synaptically followed by thinking about how cetaceans engage in play.
Humans often recognize play through sports or games, and mostly through smiling and the vocalization of laughter. If we’re laughing it usually means that we are not aggressing. From what we currently understand, play in cetaceans has evolved as an ontogenetic behavior in many species for the purposes of developing survival skills (Paulos et al., 2010). This “purpose of play” makes a lot of sense, and I see it in my dogs when they are growling, snapping, tugging rope, and chasing each other in the yard. They are having the time of their lives and certainly not really fighting one another, yet they are also clearly practicing important skills if they were to come across predators or prey in the wild.
Most cetaceans vocalize often, whether in the form of pulsed calls, whistles, screams, songs, clicks or combination calls. The element of play associated with a utilized sound or other behavior opens the door for cetaceans to develop important social relationships among conspecifics, as well as developing crucial survival skills (Paulos et al., 2010). To quantify the vocal signals produced by cetacean species, researchers examine their complex repertoires to understand more about the function of certain sounds made specifically during play (Boisseau, 2004). Bottlenose dolphins provide each other with a distinct signal, pulse whistles that start around 13 kHz and end at around 10 kHz (Fig 1), to tell one another that the behavior they are exhibiting is play rather than aggression (Blomqvist et al., 2005).
Figure 1. Spectrogram of bottlenose dolphin pulse whistles during play. Blomqvist et al., 2005.
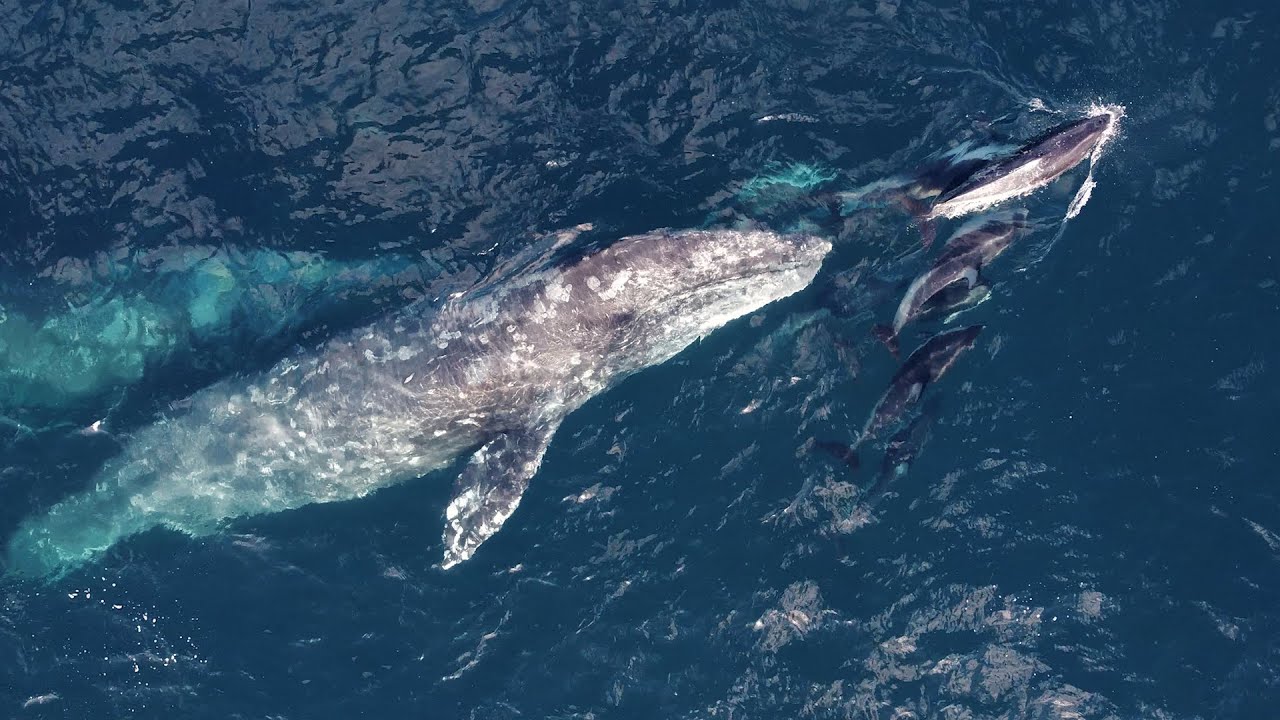
Cetacean play is defined as behavior that is spontaneous, intentional, pleasurable, and rewarding (Hill et al., 2017). Although cetacean play is conducted in a relaxed setting when there is no immediate need for survival, it has a role in growth and sociability (Hill et al., 2017). For example, cetaceans participate in interspecies play, where they actively engage with one another for no apparent ecological benefit (excluding periods of symbiotic behavior, such as working together to herd prey). Yet, these periods of interspecies play may suggest that these animals are comfortable practicing for real world situations with one another. Large baleen whales have few predators and thus have opportunities to engage in play with pods of dolphins. In some cases, large baleen whales such as humpback and gray whales will lift smaller mammals out of the water, possibly to practice for maternal care (Hill et al., 2017).
Cetaceans engage in play not only with one another, but as solitary individuals as well. This play (which can occur parallel to conspecifics simultaneously) includes surfing, aerial breaches and leaps, slapping the surface of the water with a fin or tail fluke, and erratic swimming (Paulos et al., 2010). Some cetaceans play with objects they find in the wild. One example being bowhead whales, which are known to balance, sink, and lift logs (Paulos et al., 2010).
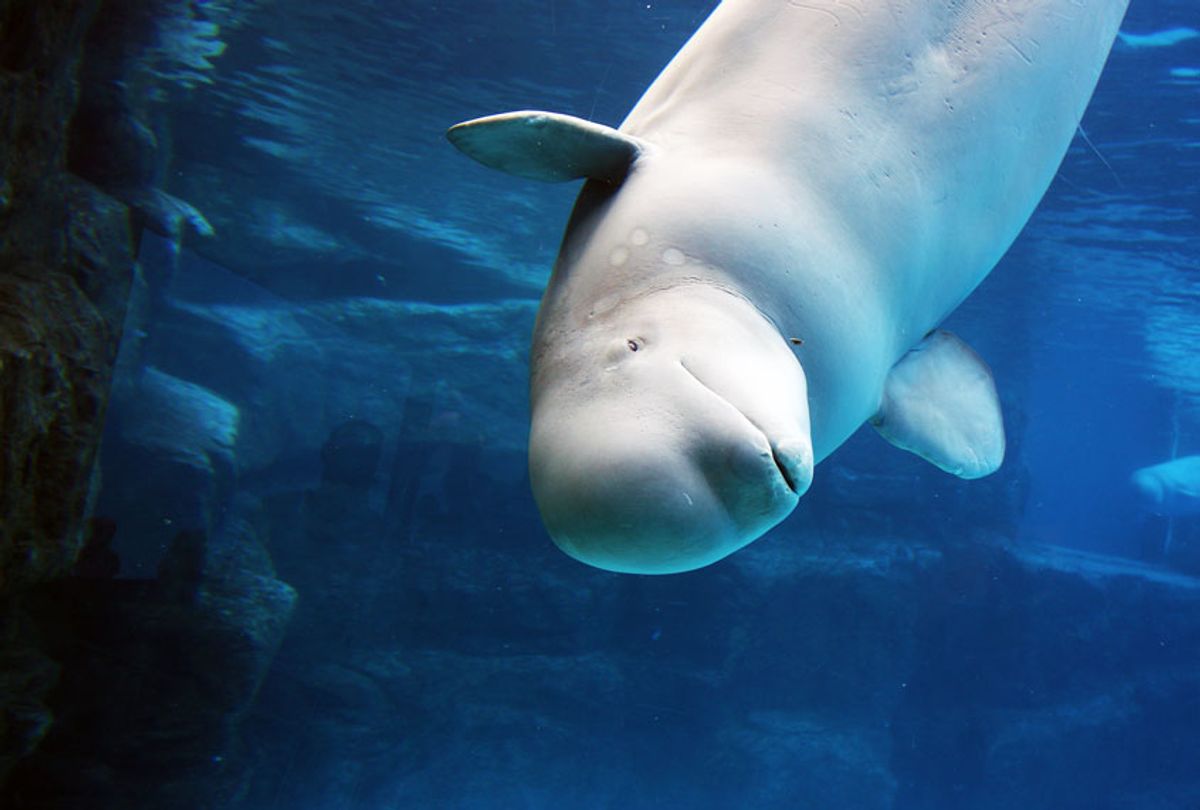
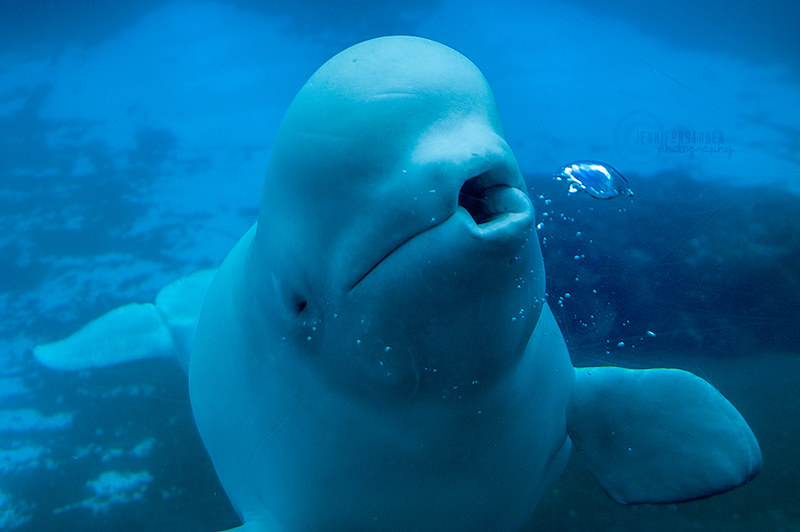
Another interesting cetacean play behavior is bubble blowing. Though humpback whales blow bubbles as a means of trapping prey while foraging (Moreno & Macgregor, 2019), beluga whales, particularly females, blow mouth ring bubbles and perform blowhole bursts when engaging in solitary play (Hill et al., 2011). Just for the fun of it. It appears that cetaceans also need to be actively involved in “nothing” sometimes, as there is some good use for it. For me, engaging in play is a way to reset and relax, which is necessary even for those us who gain a lot of pleasure from our accomplishments. As I sit in the desolate theatre connecting with my daughter and nurturing my own needs, I feel completely justified in my relaxing night off. Pass the nachos, please.
Blomqvist, C., Mello, I., Amundin, M. 2005. An acoustic play-fight signal in bottlenose dolphins (Tursiops truncatus) in human care. Aquatic Mammals, 31 (2), 187-194.
Boisseau, O. 2004. Quantifying the acoustic repertoire of a population: The vocalizations of free-ranging bottlenose dolphins in Fiordland, New Zealand. The Journal of the Acoustical Society of America, 117, 2318-2329. https://doi.org/10.1121/1.1861692.
Hill, H., Kahn, M., Brilliott, L., Roberts, B., Gutierrez, C. 2011. Beluga (Delphinaptera leucas) bubble bursts: surprise, protection, or play? International Journal of Comparative Psychology, 24, 235-243.
As I sit down at my desk during the first week of 2022 to write the first blog of this new year, more than ever before I feel like I am at a pivotal time. Standing in front of an invisible frontier, contemplating the past, and anxiously looking ahead.
Globally, 2021 was yet another challenging year. The COVID pandemic is persisting in endless waves of contamination and new variants. Climate change is all the more on our minds as the COP26 failed to live up to the expectations of many.
For me personally, 2021 was a very strange year too. I recovered from an accident I had in November 2020 that shook me to the bones and pushed me into living life to its fullest. On the other hand, the pandemic prevented me from moving to Oregon and I have been remotely working on the OPAL project for a year. I feel very lucky to participate in this work and I have enjoyed every bit of time I have spent on my computer processing data and teasing out the ecological drivers of whale distribution in Oregon. Yet, despite the numerous zoom meeting and email exchanges, I have been frustrated by the long-distance relationship I had with my dear GEMM lab colleagues and friends. Like so many others, I have felt the tow of the virtual life the pandemic has imposed on us.
As I reflect on the mixed feelings I am experiencing in this first week of 2022, I realize that the global context we live in and my individual questionings are intertwined. The pandemic and environmental issues triggered the same ethical and philosophical questions about individual responsibility, freedom, and equity. For instance, why should I make sacrifices that will cost me a lot personally but only have a very minor effect on the broader scale? The year 2021 has confronted us with a harsh reality: however strongly you believe your answer to the above question is the right one, other people might think otherwise.
The term eco-anxiety has emerged in recent years to describe people suffering from ‘persistent worries about the future of Earth and the life it shelters’. These symptoms of chronic fear are rising worldwide, which sadly but frankly, is only normal given that the degradation of our climate and biosphere deserves our full attention. More disturbingly, I found out that eco-anxiety is mostly affecting children and young people around the globe. Despite acting for the environment on an everyday basis and working as a conservation biologist, I can relate to this feeling of overwhelming helplessness.
In the first week of this new year, I would like to turn this distress into motivation to act and do better. To that extent, ‘adaptation’ is the word that keeps coming up to my mind. In biology, adaptation is the process of change by which an organism or species becomes better suited to its environment. Contrary to ‘acclimation’ that refers to a temporary change occurring on the short term, adaptation is a more profound evolution occurring at the scale of multiple generations. Somewhat, we need to combine the best of both worlds, adapt profoundly but adapt fast.
As I stayed at my family house in Toulouse (France) during the last couple weeks, I went through my old stuff in the room I occupied as a teenager and found a note book written by a 13 year-old Solène. I smiled at my words “One day, I will become a Biologist so that maybe I can save our beautiful planet, […] it’s the only thing that matters”. I was both impressed by the strength of the conviction I was holding to back then and stunned that I have now reached a place, as an independent adult and early career marine ecologist, where I could actually put these words in action.
So here is my 2022 New Year’s resolution: despite the waves of anxiety that sometimes hit us, let’s keep fighting our battles and trust that we can make this world a better place!
“Sometimes you have the feeling that nothing makes sense anymore, and sometimes it just feels right.” A picture of myself taken during a research cruise in New Caledonia this summer. We were searching for humpback whales in the Chesterfield archipelago (South Pacific), one of the most remote and pristine reef in the world (Photo credit: Marine Reveilhac, mission MARACAS/IRD/Opération Cétacés/WWF/GouvNC/Parc naturel de la mer de Corail).