Celest Sorrentino, University of California, Santa Barbara, Department of Ecological, Evolution, and Marine Biology, GEMM Lab NSF REU intern
Are you thinking “Did anyone proofread this blog beforehand? Don’t they know how to spell SLEEP?” I completely understand this concern, but not to fear: the spelling of SLEAP is intentional! We’ll address that clickbait in just a moment.
My name is Celest Sorrentino, a first-generation Latina undergrad who leaped at the opportunity to depart from the beaches of Santa Barbara, California to misty Newport, Oregon to learn and grow as a scientist under the influential guidance of Clara Bird, Dr. Leigh Torres and the powerhouse otherwise known as the GEMM lab. As a recent NSF REU (Research Experience for Undergraduates) intern in the GEMM Lab at Oregon State University, I am thrilled to have the chance to finally let you in on the project Clara, Leigh and I have been working on all summer. Ready for this?
Our project uses a deep-learning platform called SLEAP A.I. ( https://sleap.ai/) that can predict and track multiple animals in video to track gray whale mother calf pairs in drone footage. We also took this project a step further and explored how the distance between a gray whale mother and her calf, a proxy for calf independence, varied throughout the season and by different calf characteristics.
In this story, we’ve got a little bit for everyone: the dynamic duo of computer vision and machine learning for my data scientist friends, and ecological inquest for my cetacean researcher friends.
About the Author
Before we begin, I’d like to share that I am not a data scientist. I’ve only ever taken one coding class. I also do not have years of gray whale expertise under my belt (not yet at least!). I’m entering my 5th year at University of California, Santa Barbara as a double major in Ecology and Evolution (BS) as well as Italian Studies (BA). I am sharing this information to convey the feasibility of learning how to use machine-learning as a solution to streamline the laborious task of video analysis, which would permit more time towards answering your own ecological question, as we did here.
Essential Background
Hundreds of Hours of Drone footage
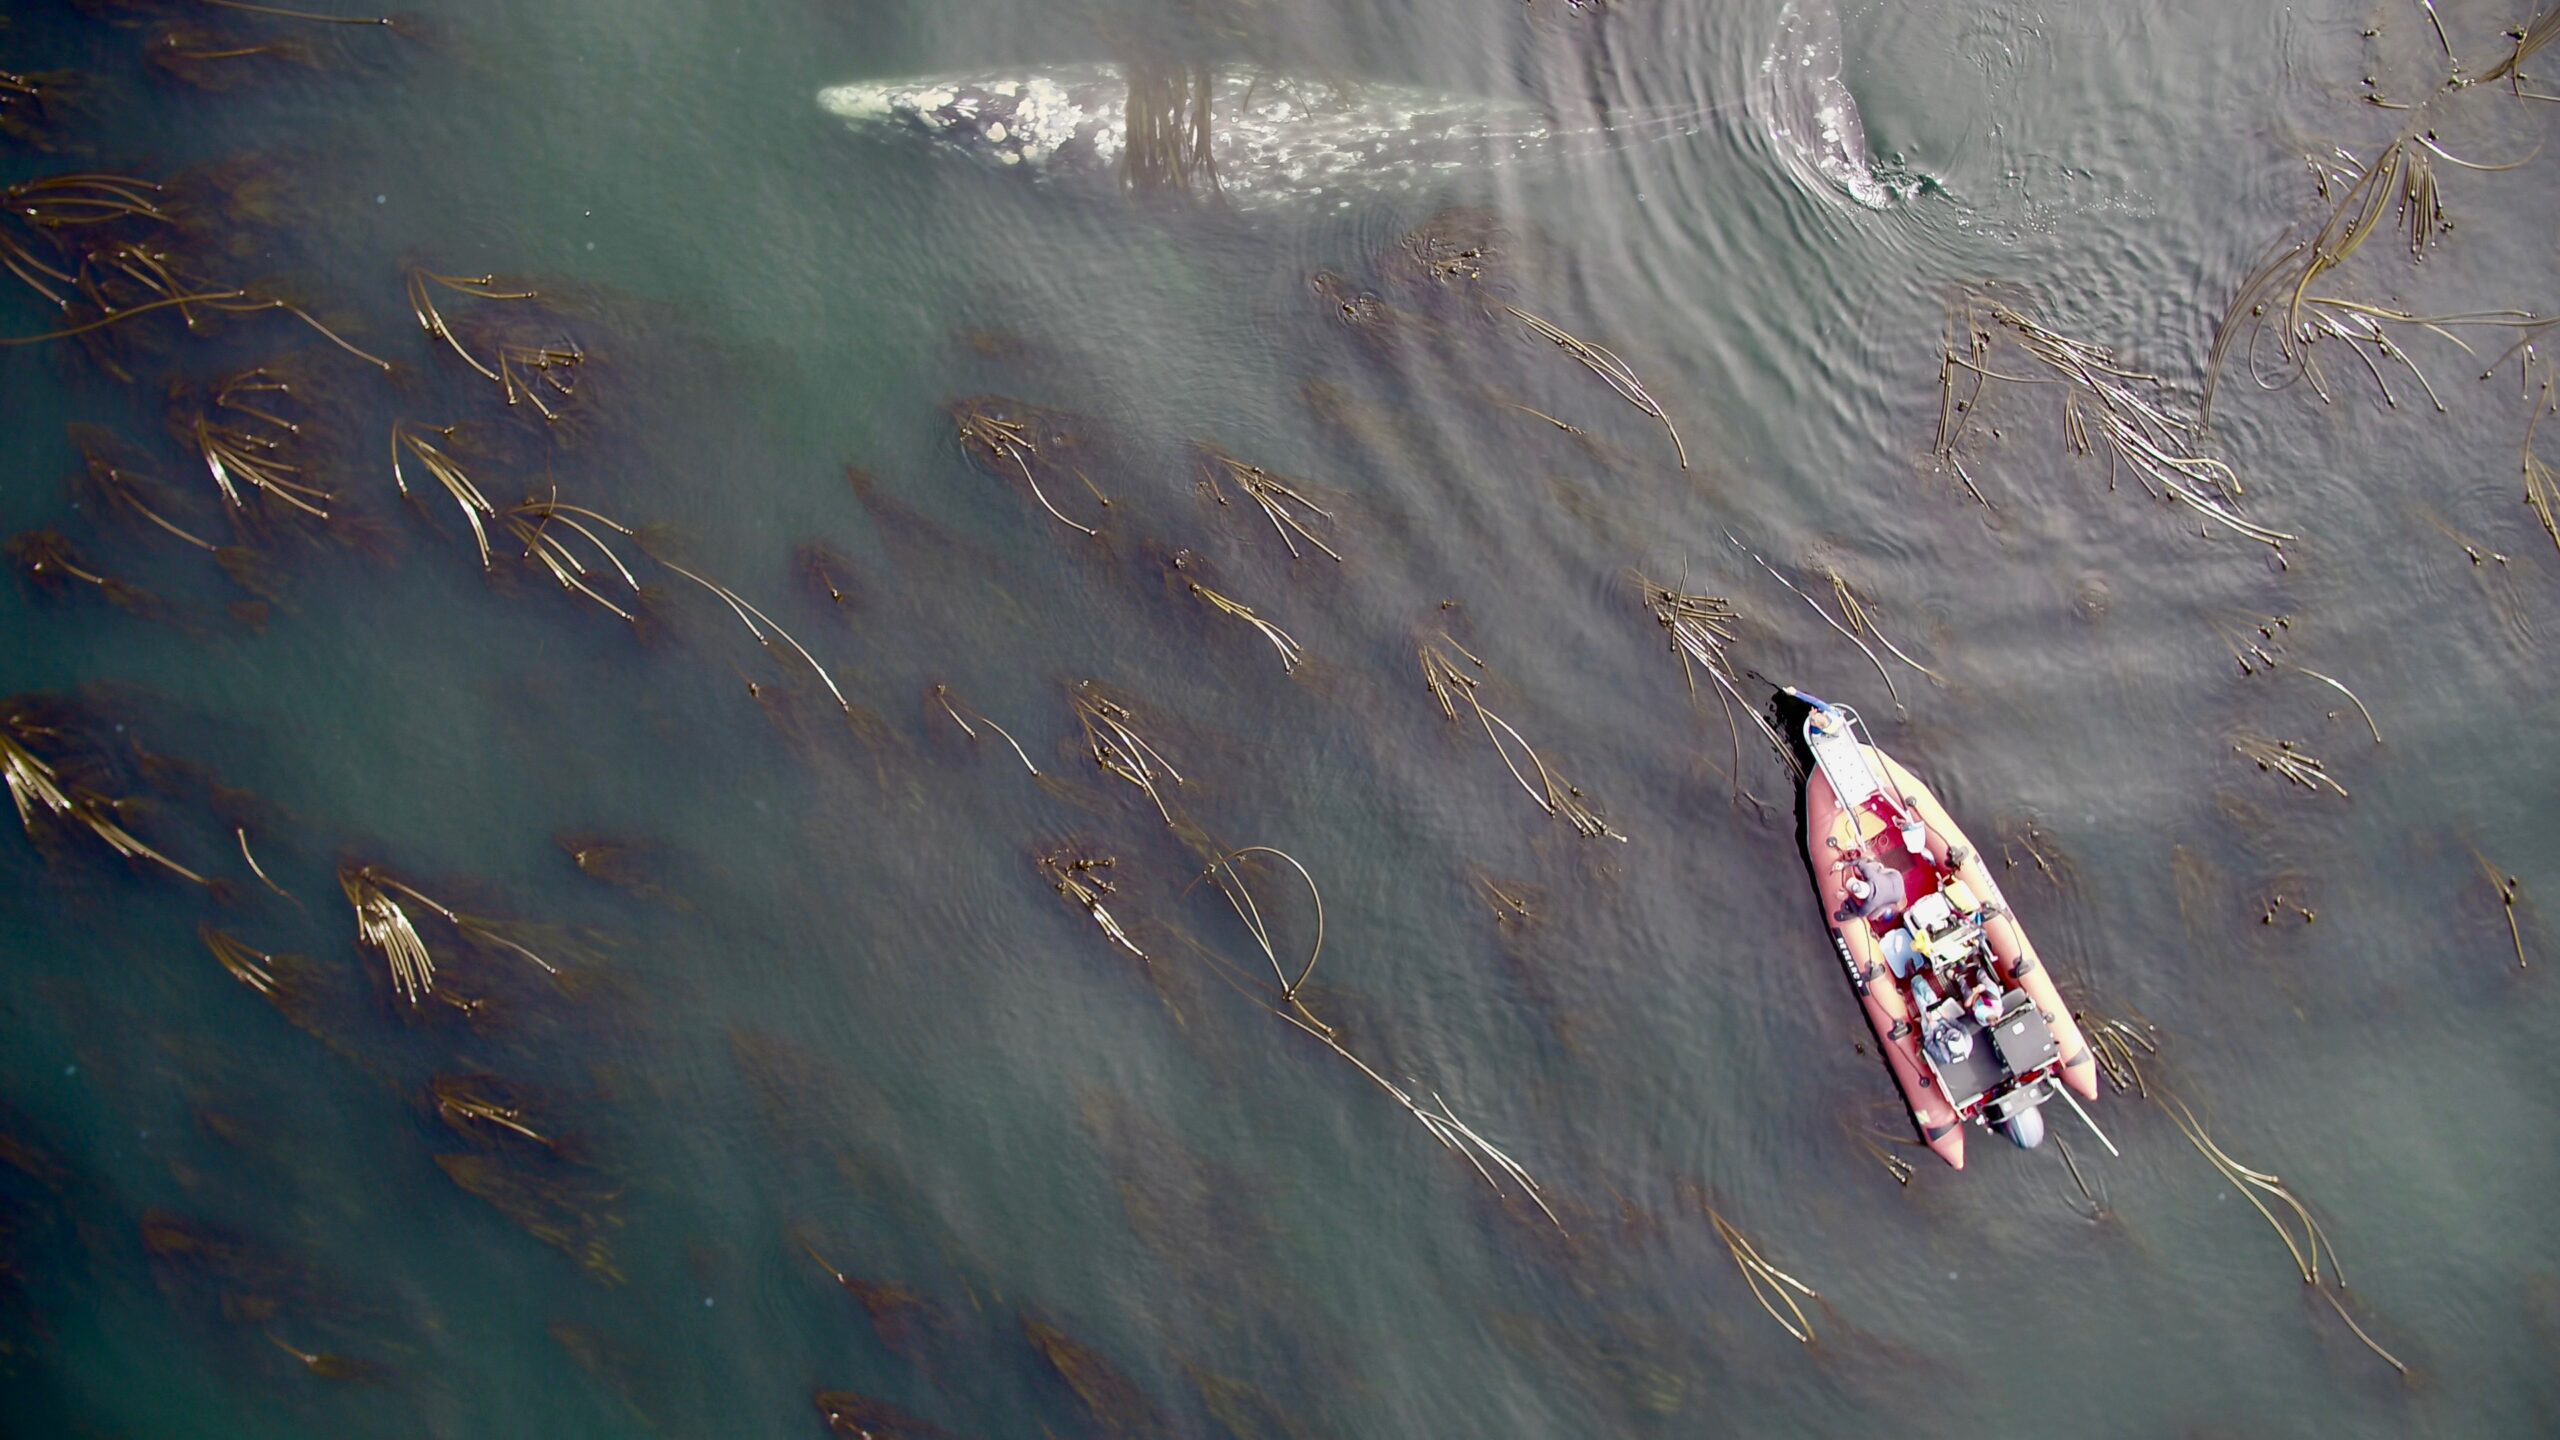
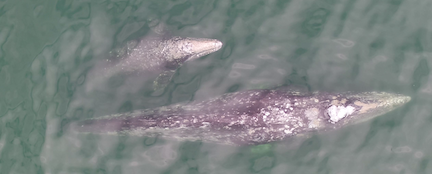
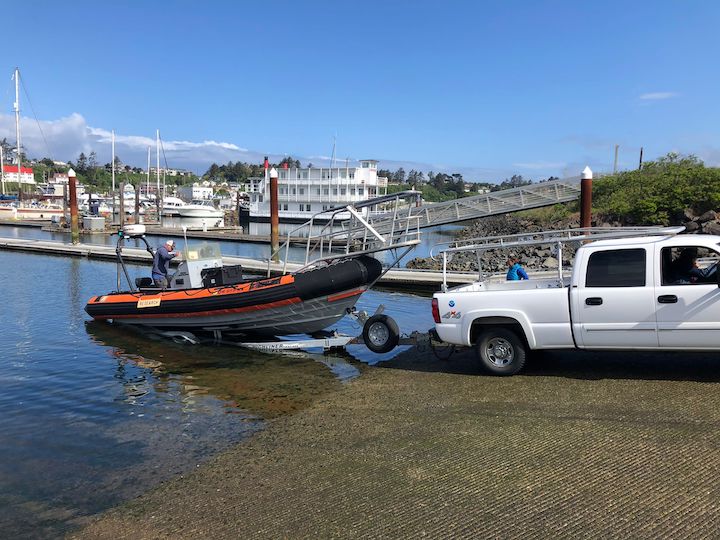
Since 2016, the GEMM Lab has been collecting drone footage of gray whales off the Oregon Coast to observe gray whale behavior in more detail (Torres et al. 2018). Drones have been shown to increase observational time of gray whales by a three-fold (Torres et al. 2018), including the opportunity to revisit the video with fresh eyes at any time one pleases. The GEMM Lab has flow over 500 flights in the past 6 years, including limited footage of gray whale mother-calf pairs. Little is known about gray whale mother-calf dynamics and even less about factors that influence calf development. As we cannot interview hundreds of gray-whale mother-calf pairs to develop a baseline for this information, we explore potential proxies for calf development instead (similar to how developmental benchmarks are used for human growth).
Distance and Development
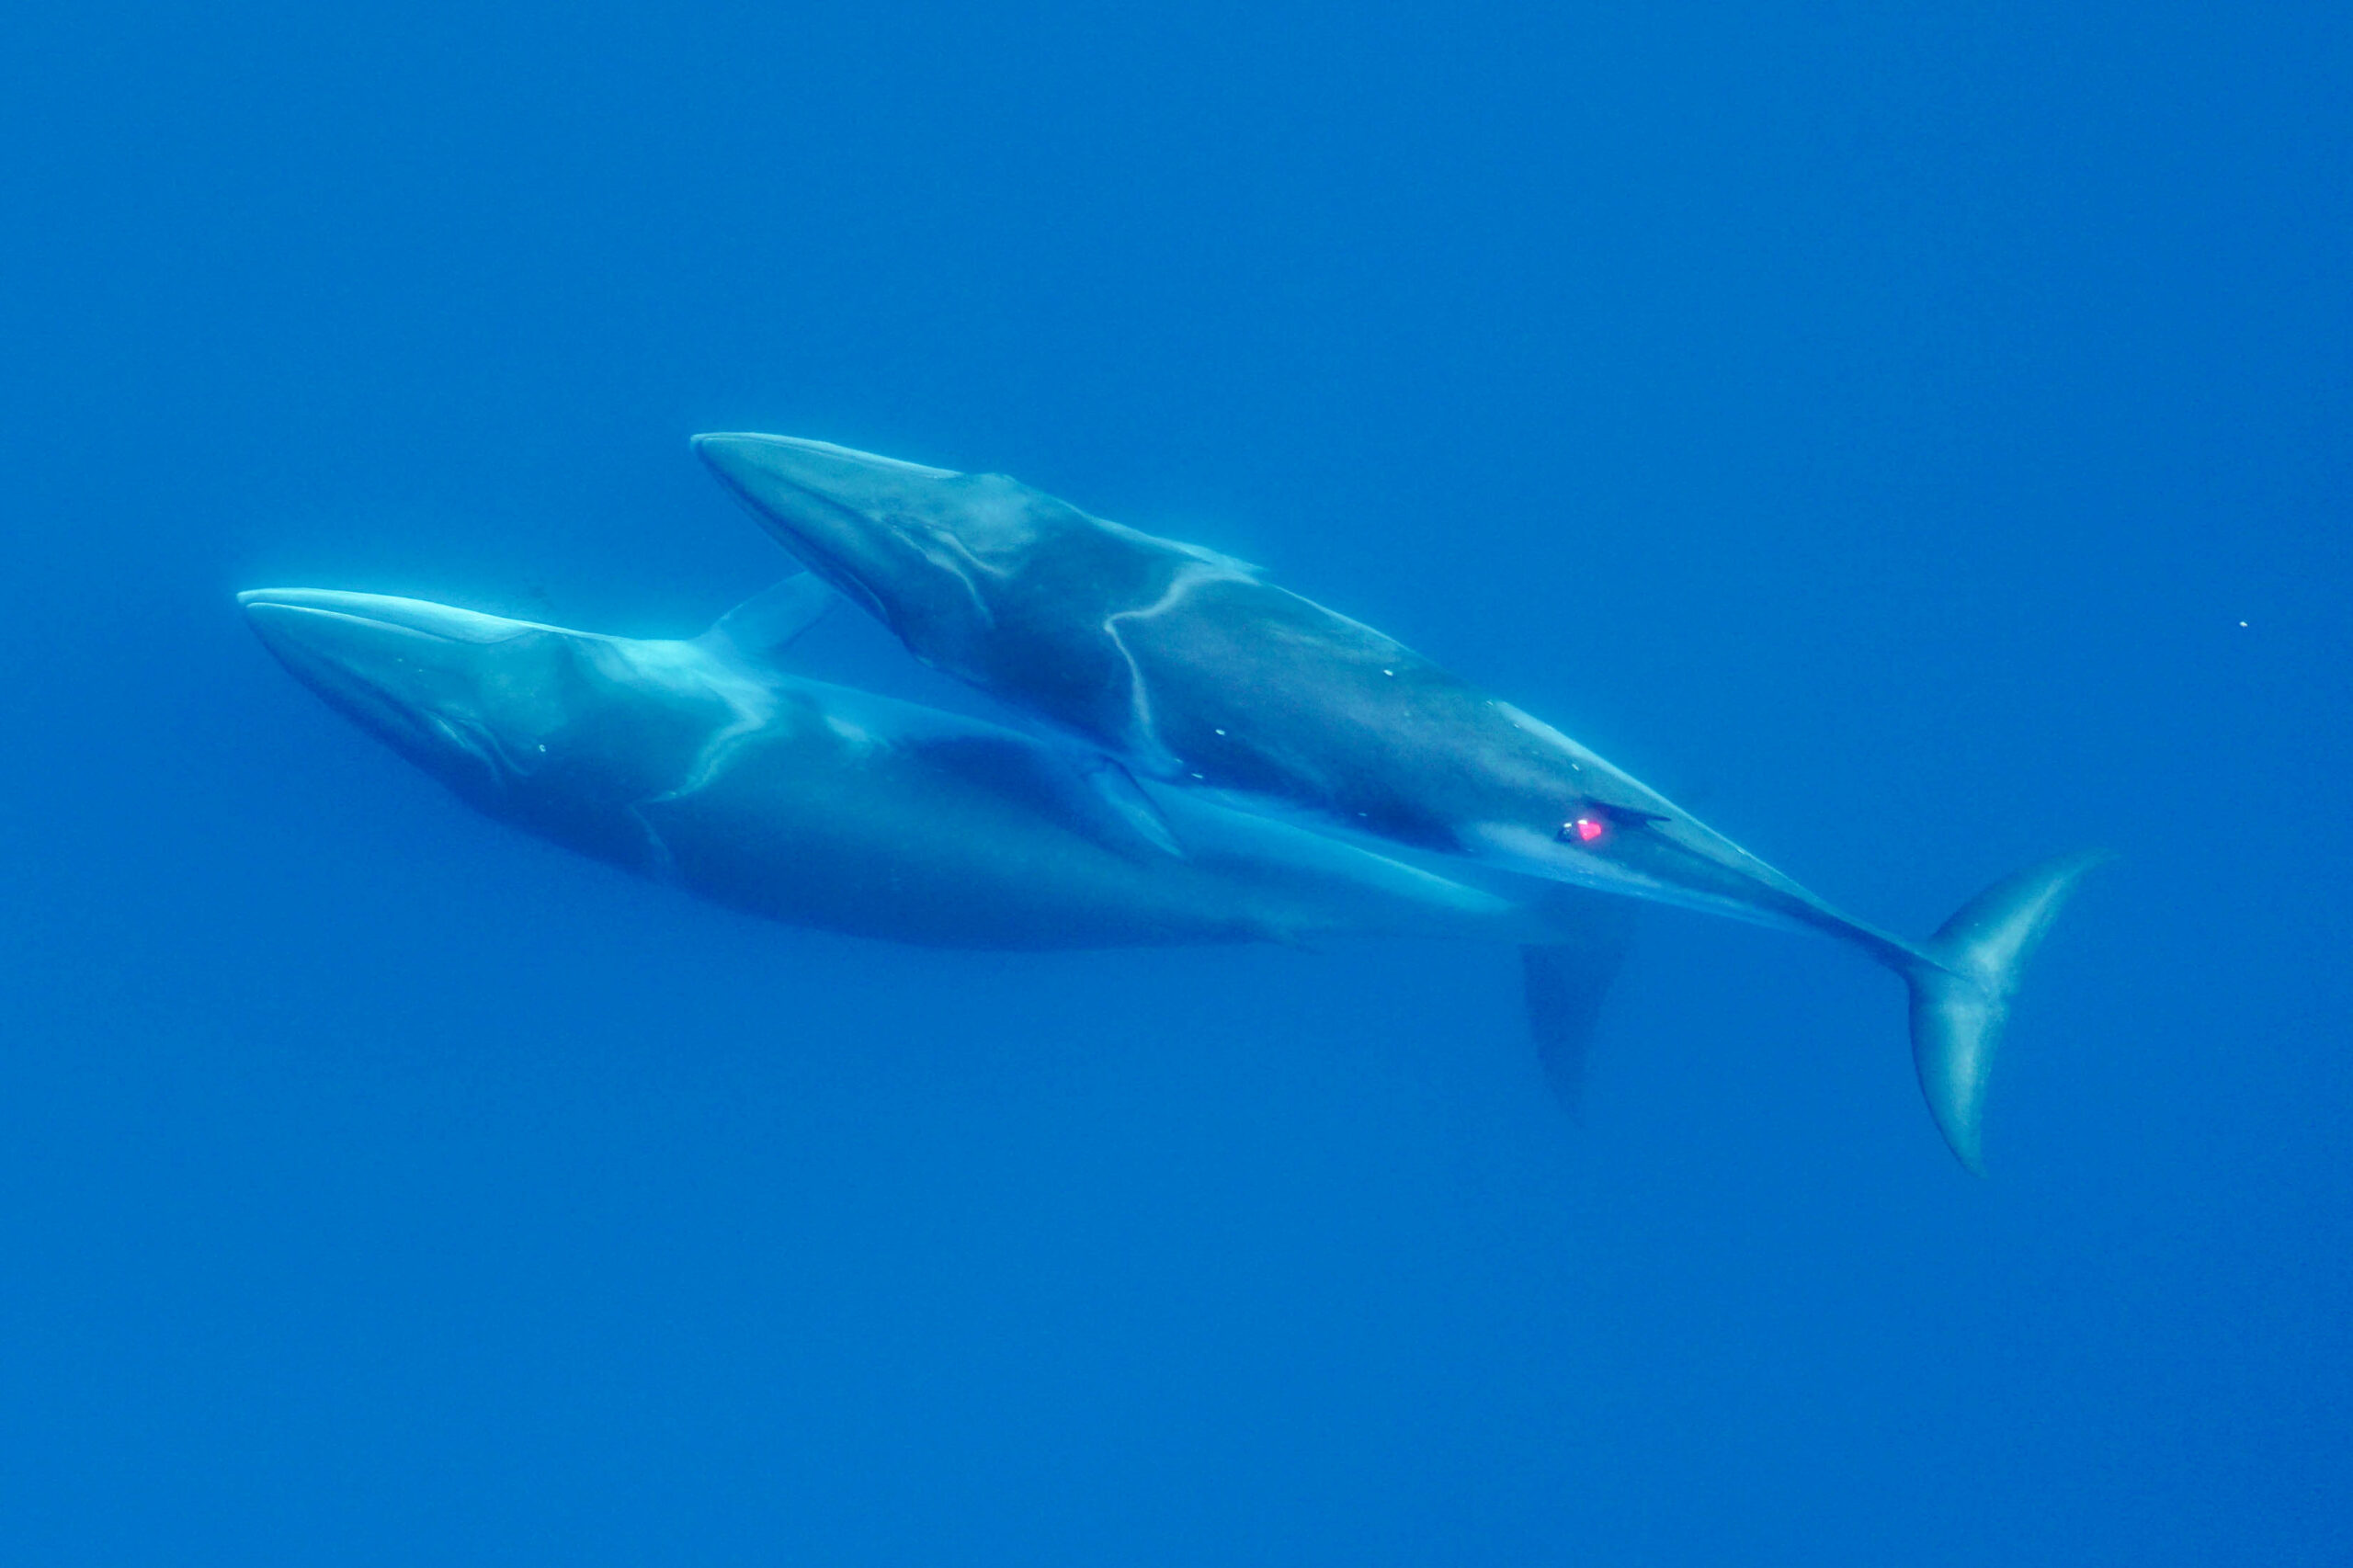
During our own life journey, each of us became less and less dependent on our parents to survive on our own. Formulating our first words so that we can talk for ourselves, cracking an egg for our parents so that we can one day cook for ourselves, or even letting go of their hand when crossing the street. For humans, we spend many years with our kin preparing for these moments, but gray whale mother-calf pairs only have a few months after birth until they separate. Gray whale calves are born on their wintering grounds in Baja California, Mexico (around February), migrate north with their mothers to the foraging grounds, and are then weaned during the foraging season (we think around August). This short time with their mother means that they have to become independent pretty quickly (about 6 months!).
Distance between mother and calf can be considered a measure of independence because we would expect increased distance between the pair as calf independence increases. In a study by Nielson et al (2019), distance between Southern Right Whale mother-calf pairs was found to increase as the calf grew, indicating that it can serve as a good proxy for independence. The moment a mother-calf pair separates has not been documented, but the GEMM lab has footage of calves during the foraging season pre-weaning that can be used to investigate this process. However, video analysis is no easy feat: video analysis can range from post-processing, diligent evaluation, and video documentation (Torres et al. 2018). Although the use of UAS has become a popular method for many researchers, the extensive time required for video analysis is a limitation. As mentioned in Clara’s blog, the choice to pursue different avenues to streamline this process, such as automation through machine learning, is highly dependent on the purpose and the kind of questions a project intends to answer.
SLEAP A.I.
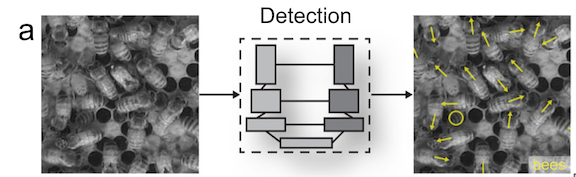
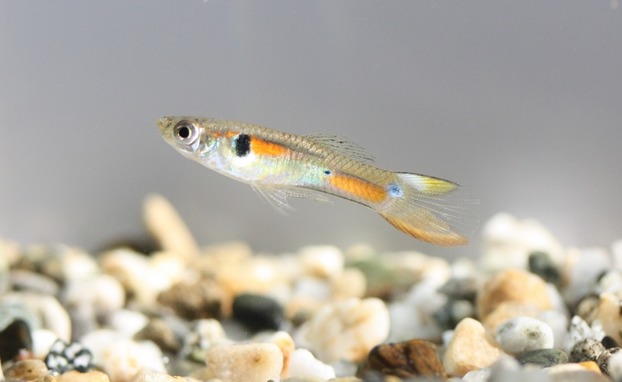
In a world where modern technology is constantly evolving to cater towards making everyday tasks easier, machine learning leads the charge with its ability for a machine to perform human tasks. Deep learning is a subset of machine learning in which the model learns and adapts the ability to perform a task given a dataset. SLEAP (Social LEAP Estimation of Animal Poses) A.I. is an open-source deep-learning framework created to be able to track multiple subjects, specifically animals, throughout a variety of environmental conditions and social dynamics. In previous cases, SLEAP has tracked animals with distinct morphologies and conditions such as mice interactions, fruit flies engaging in courtship, and bee behavior in a petri dish (Pereira 2020). While these studies show that SLEAP could help make video analysis more efficient, these experiments were all conducted on small animals and in controlled environments. However, large megafauna, such as gray whales, cannot be cultivated and observed in a controlled Petri dish. Could SLEAP learn and adapt to predict and track gray whales in an uncontrolled environment, where conditions are never the same (ocean visibility, sunlight, obstructions)?
Methods
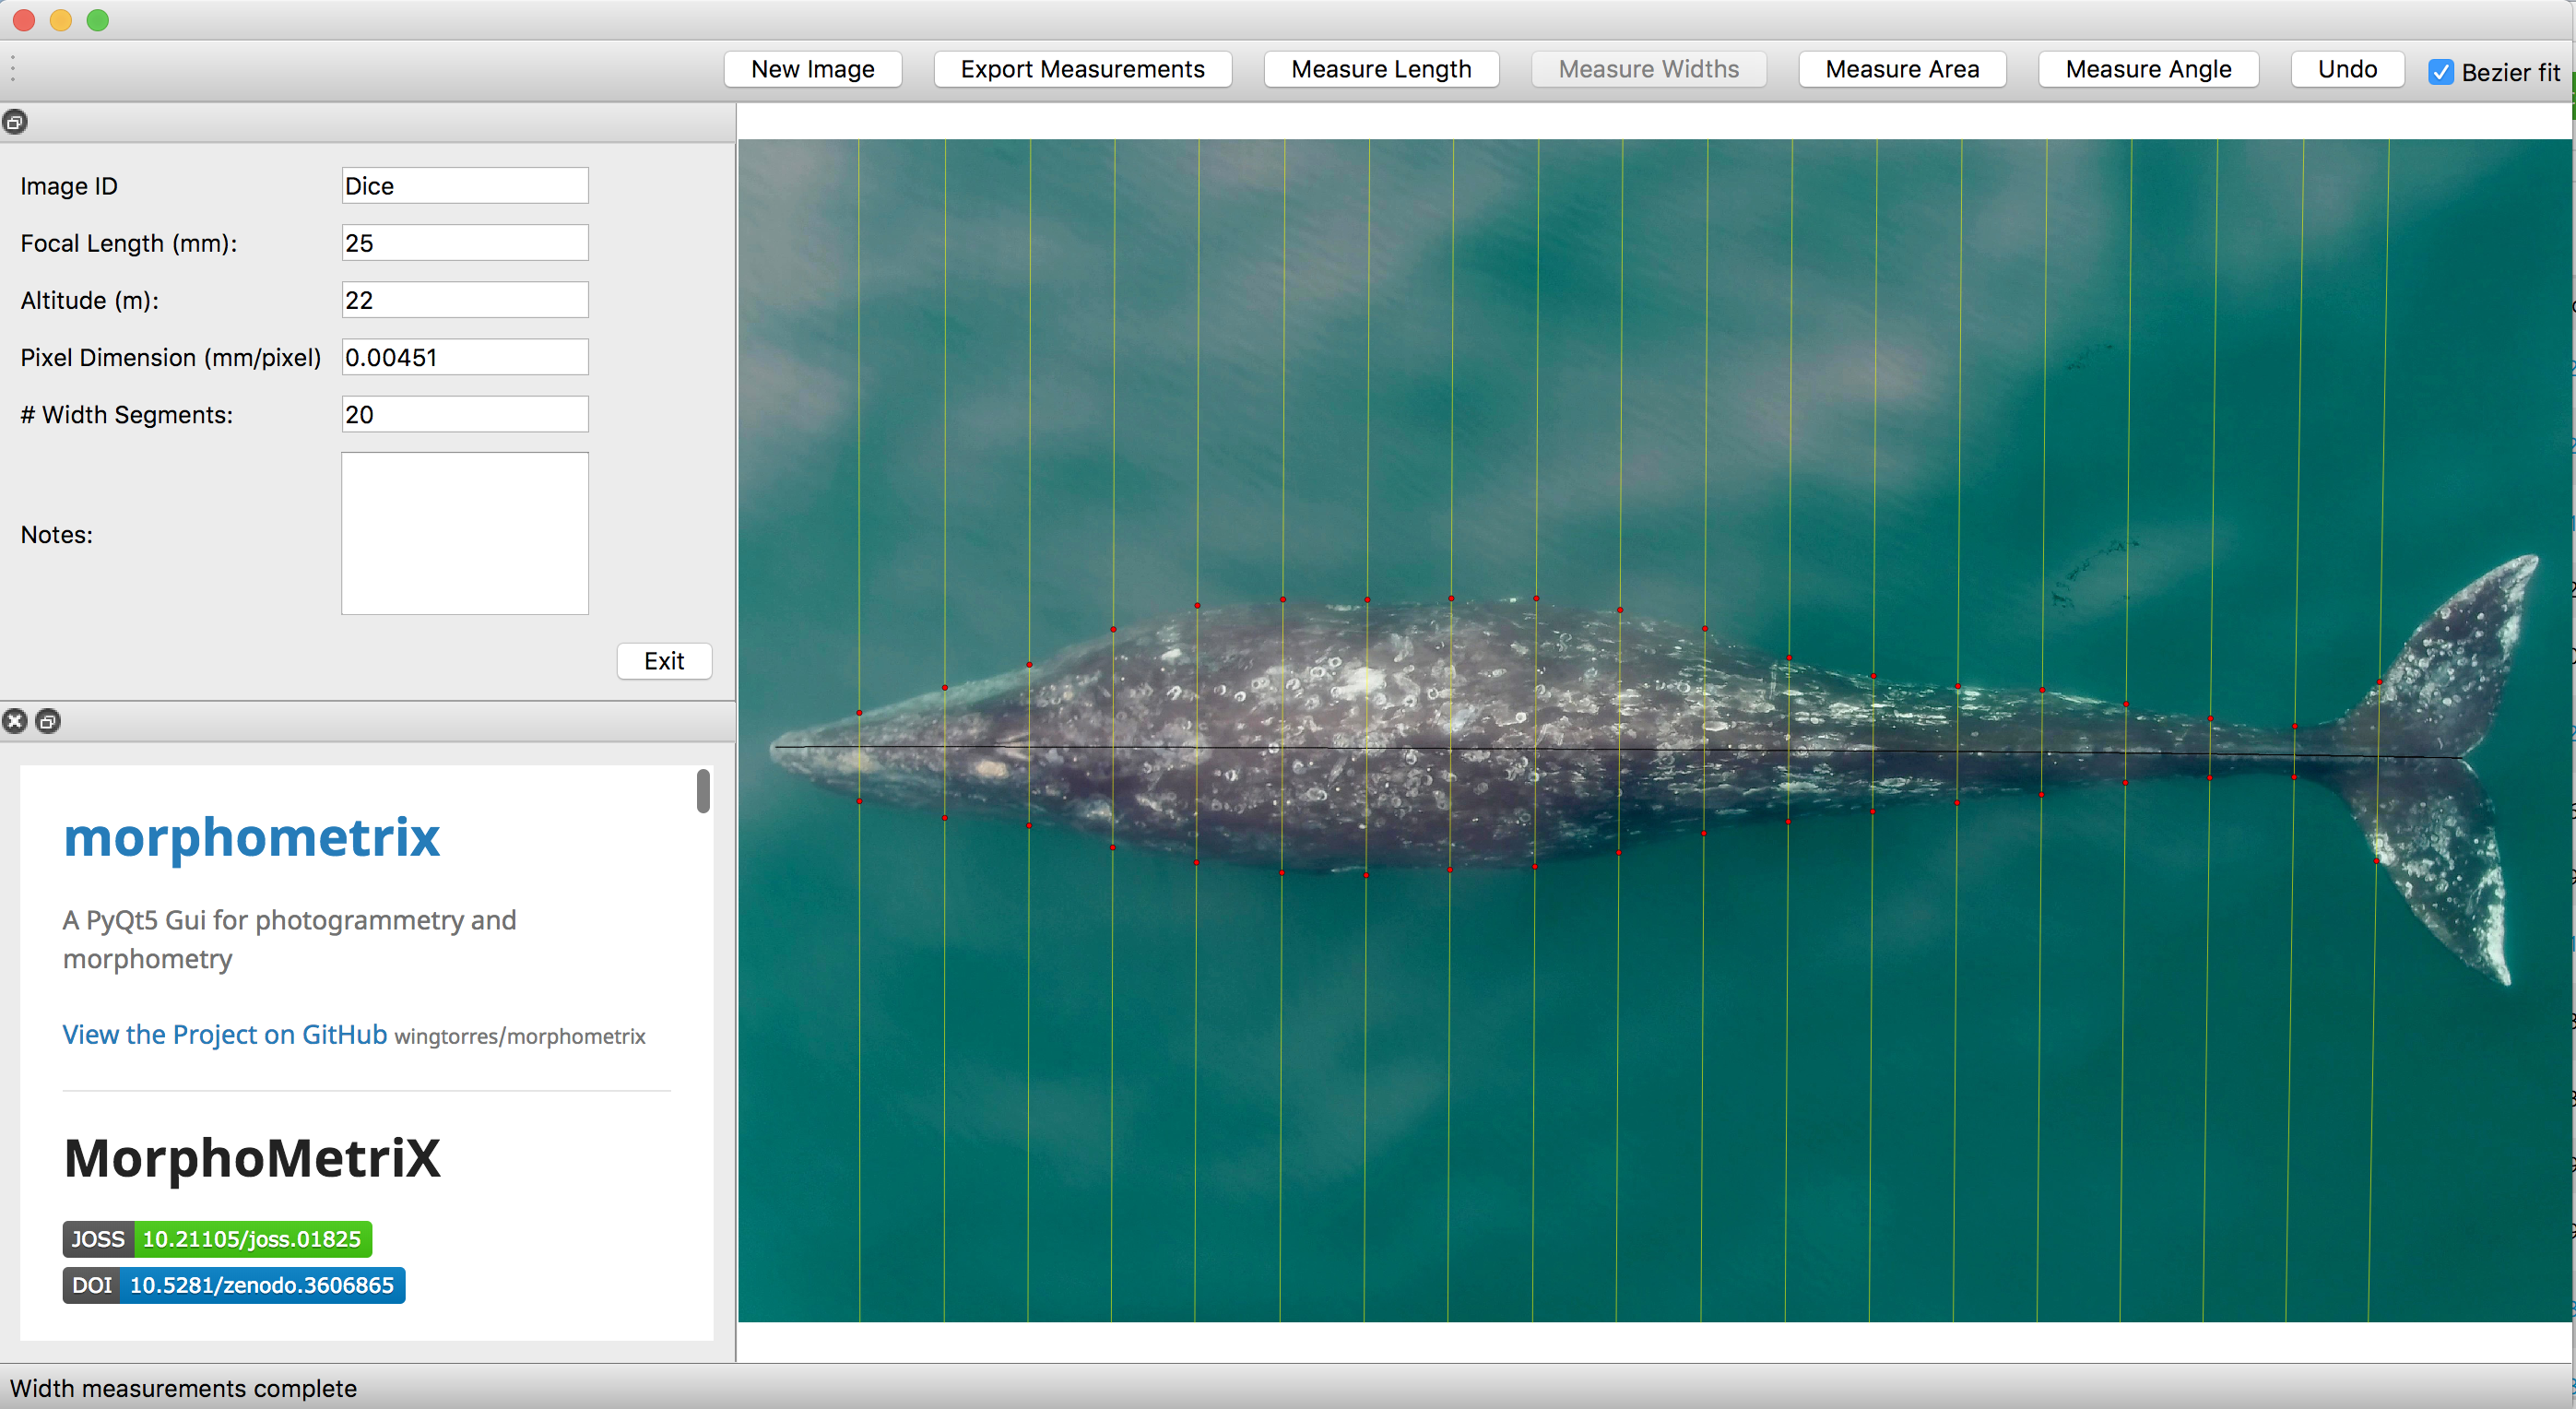
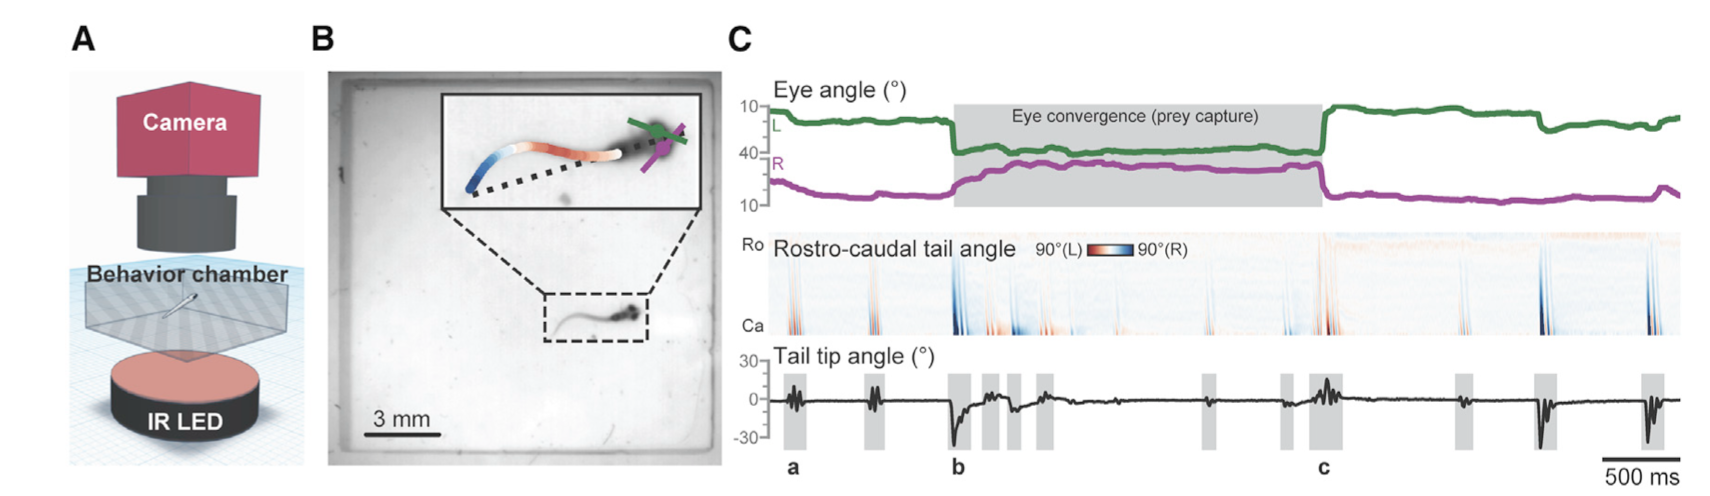
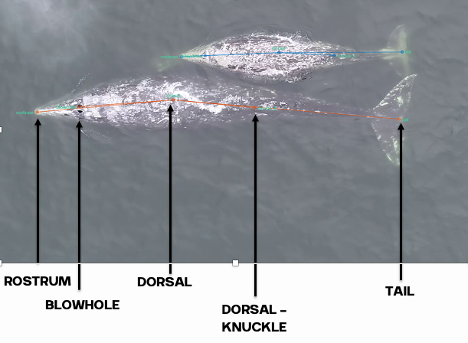
In order to establish a model within SLEAP, we split our mother-calf drone video dataset into training (n=9) and unseen/testing (n=3) videos. Training involves teaching the model to recognize gray whales, and necessitated me to label every four frames using the following labels (anatomical features): rostrum, blowhole, dorsal, dorsal-knuckle, and tail (Fig. 1). Once SLEAP was trained and able to successfully detect gray whales, we ran the model on unseen video. The purpose of using unseen video was to evaluate whether the model could adapt and perform on video it had never seen before, eliminating the need for a labeler to retrain it.
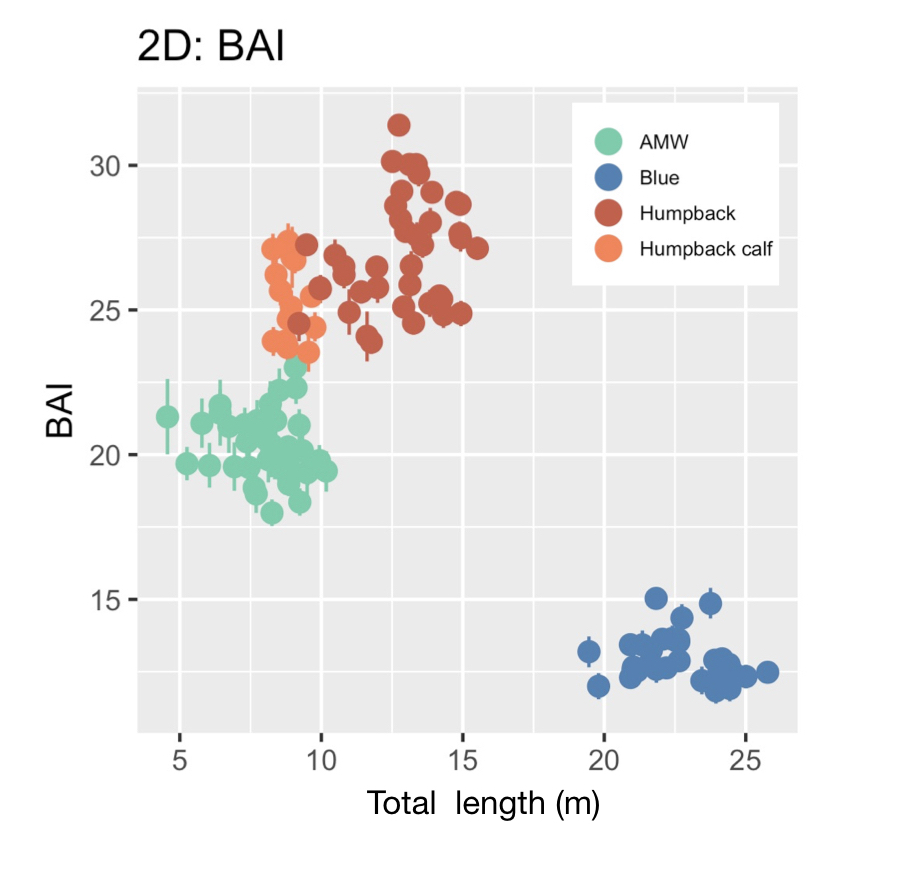
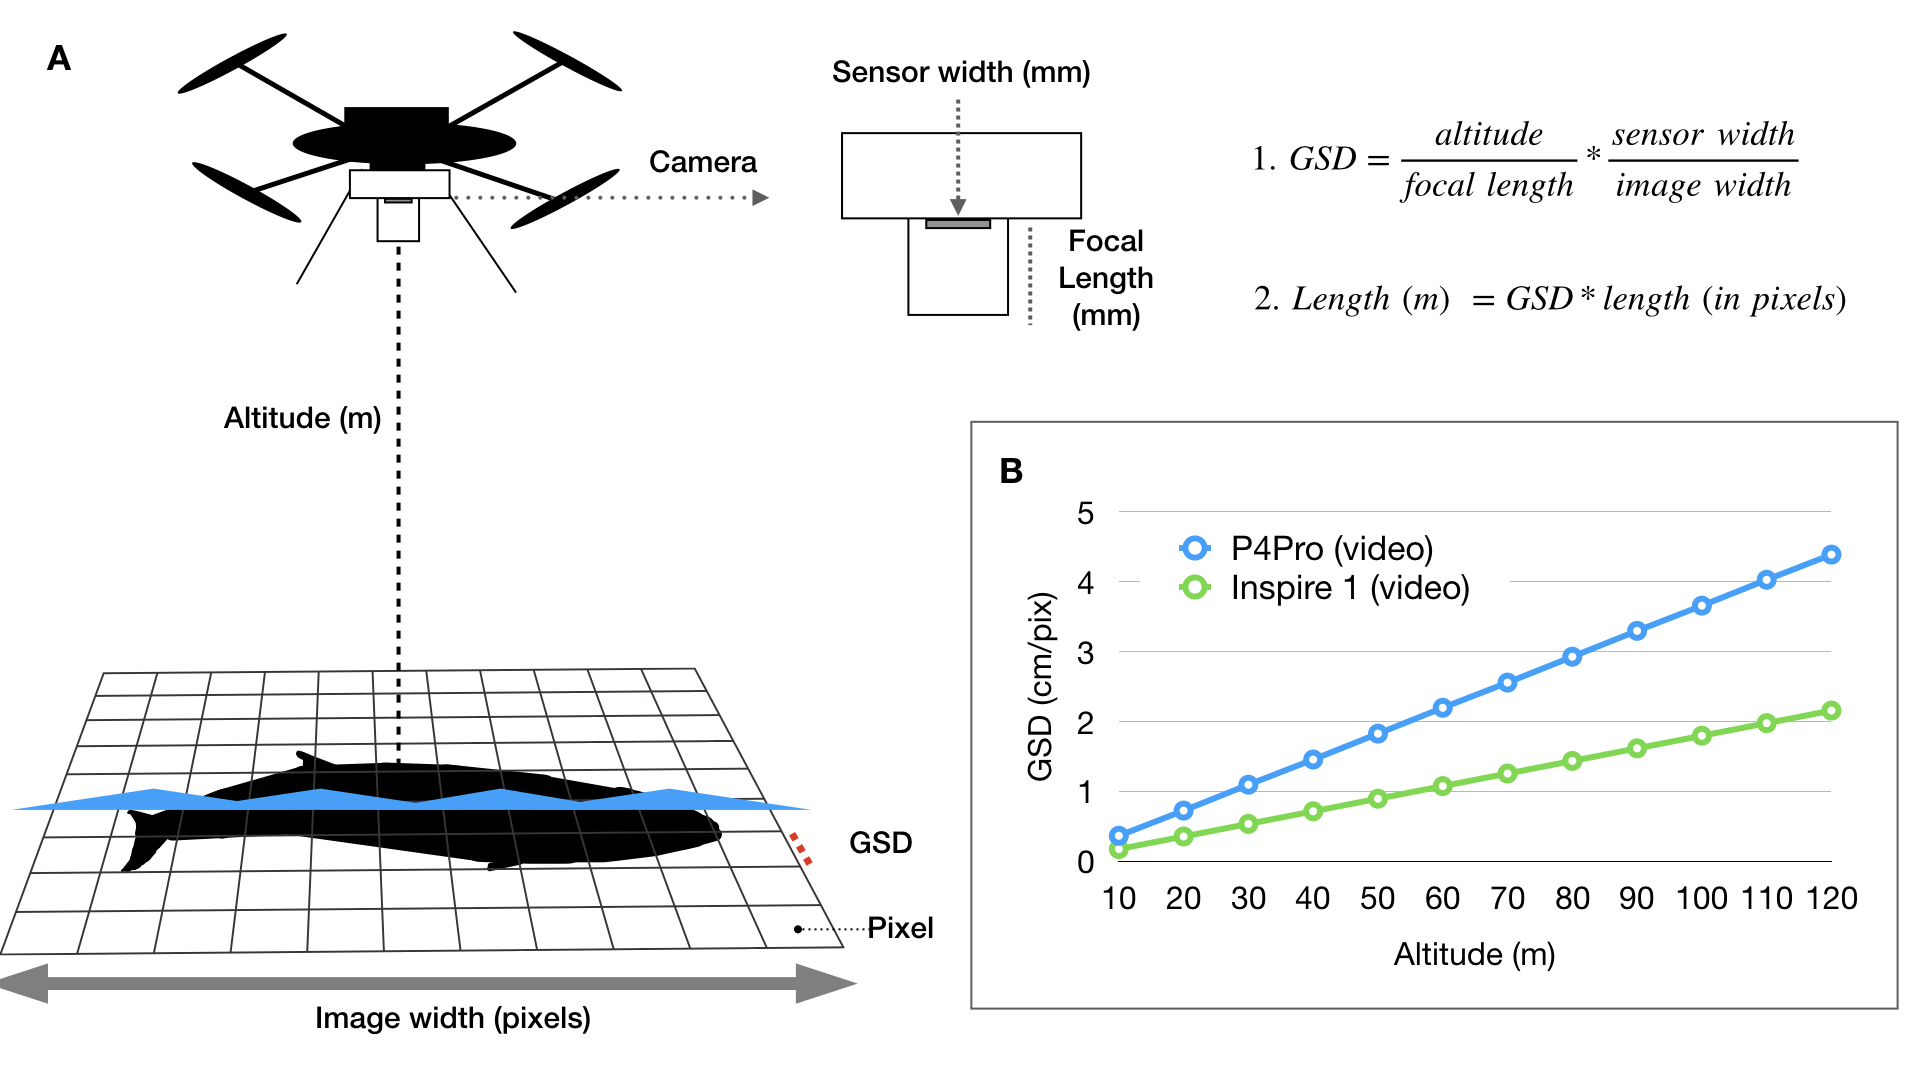
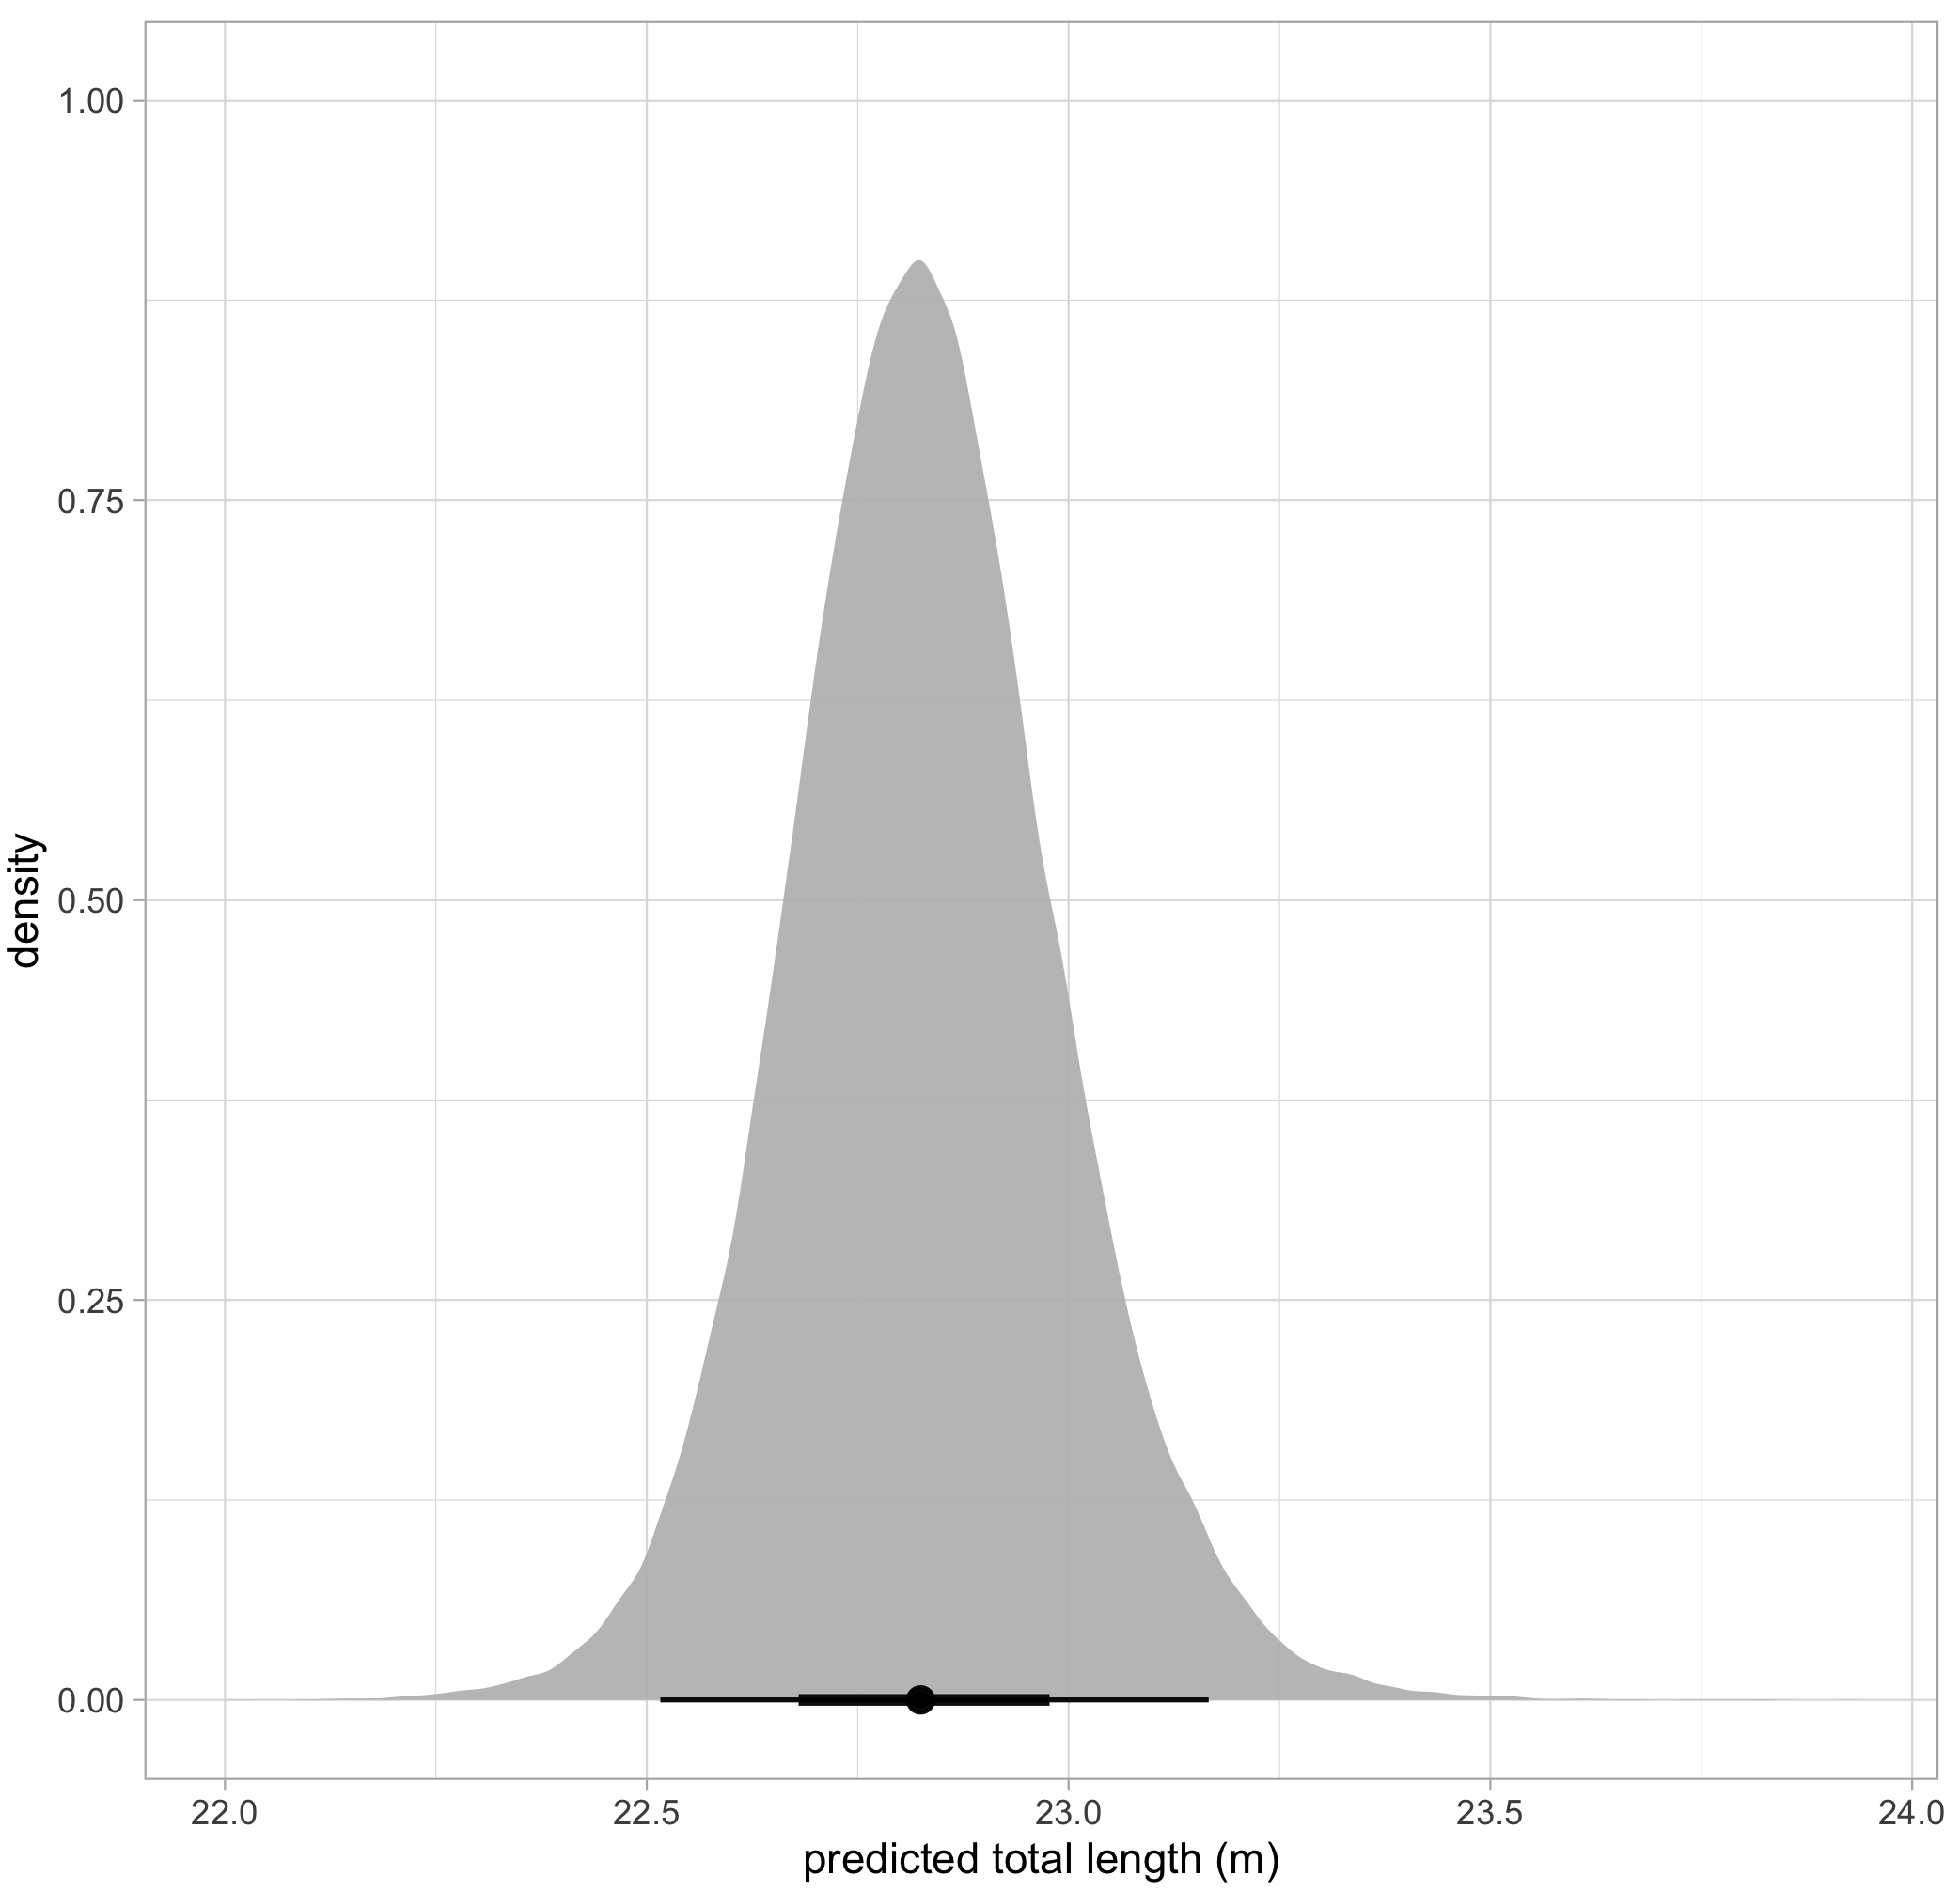
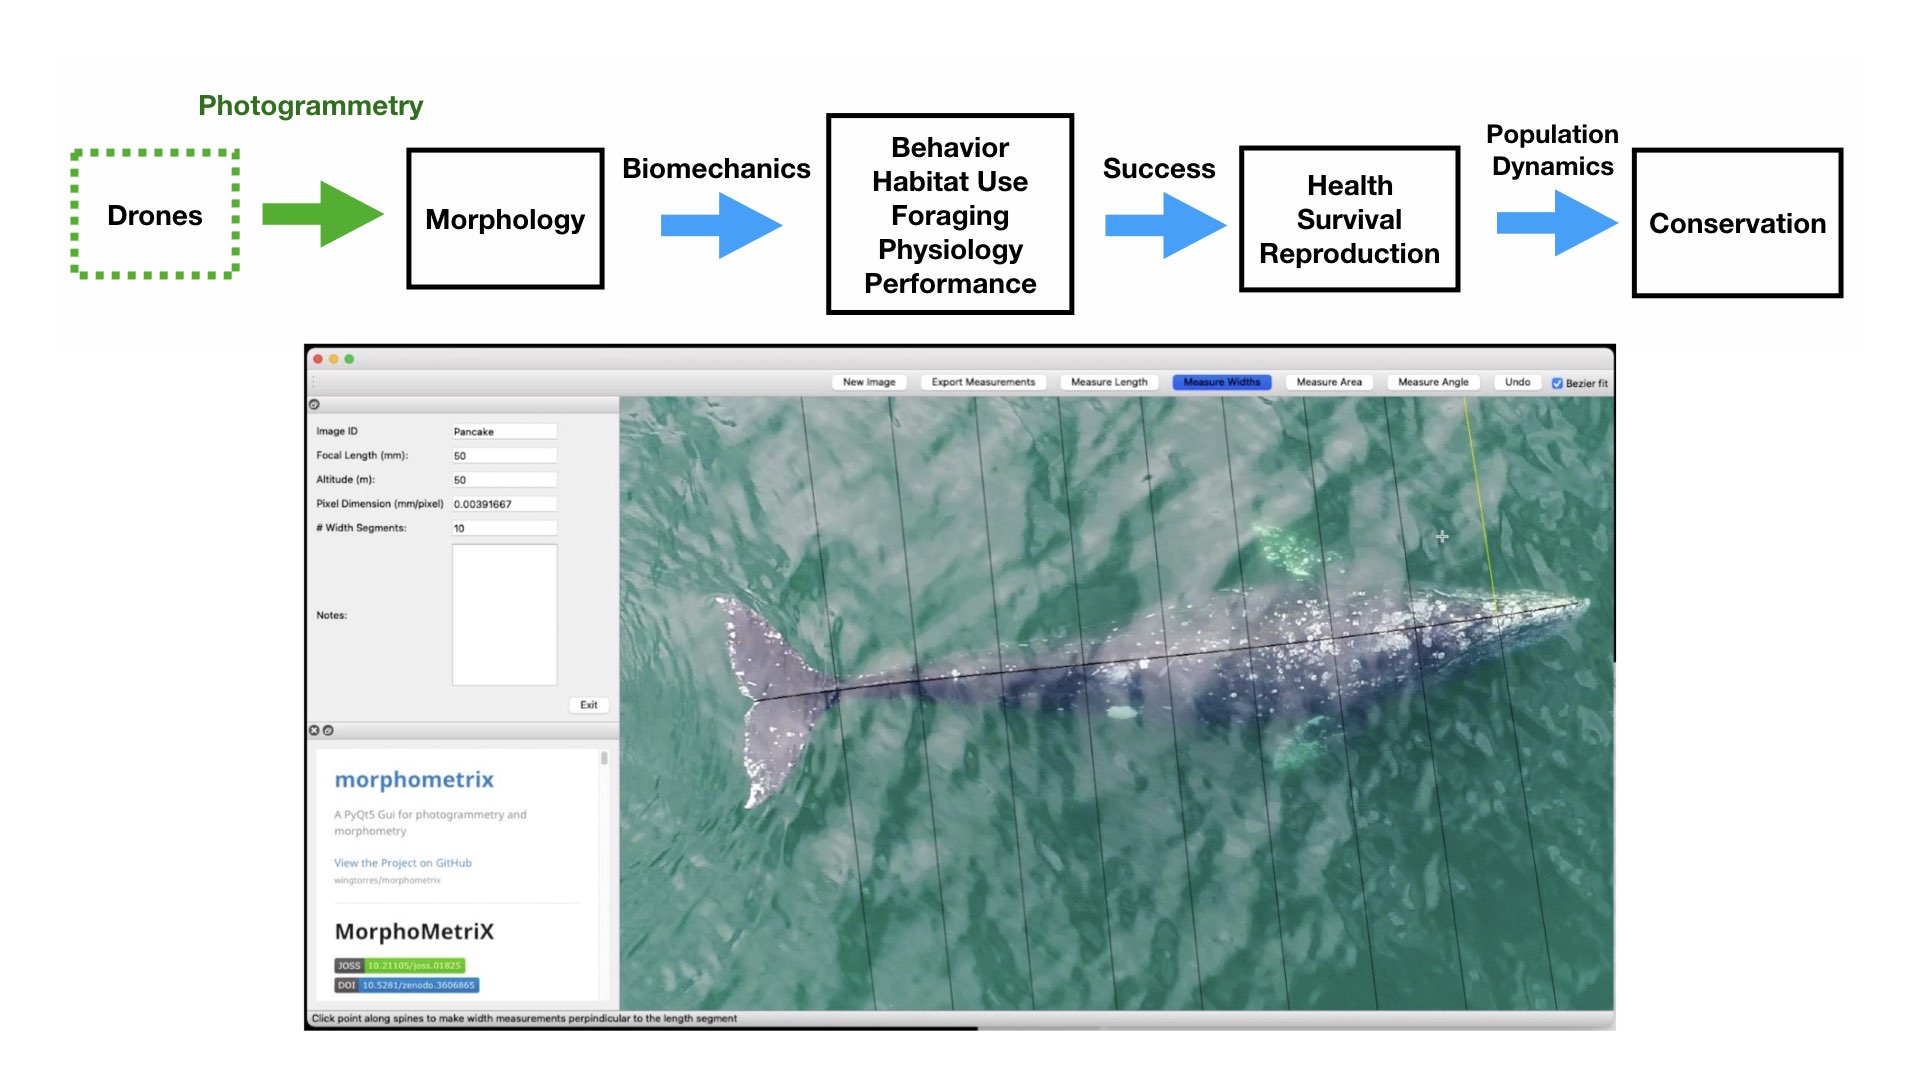
We then extracted the pixel coordinates for the mom and calf, calculated the distance between their respective dorsal knuckles, and converted the distance to meters using photogrammetry (see KC’s blog for a great explanation of these methods). The distance between each pair was then summarized on a daily scale as the average distance and the standard deviation. Standard deviation was explored to understand how variable the distance between mother-calf pair was throughout the day. We then looked at how distance and the standard deviation of distance varied by day of year, calf Total Length (TL), and calf Body Area Index (BAI; a measure of body condition). We hypothesized that these three metrics may be drivers of calf independence (i.e., as the calf gets longer or fatter it becomes more independent from its mother).
Results
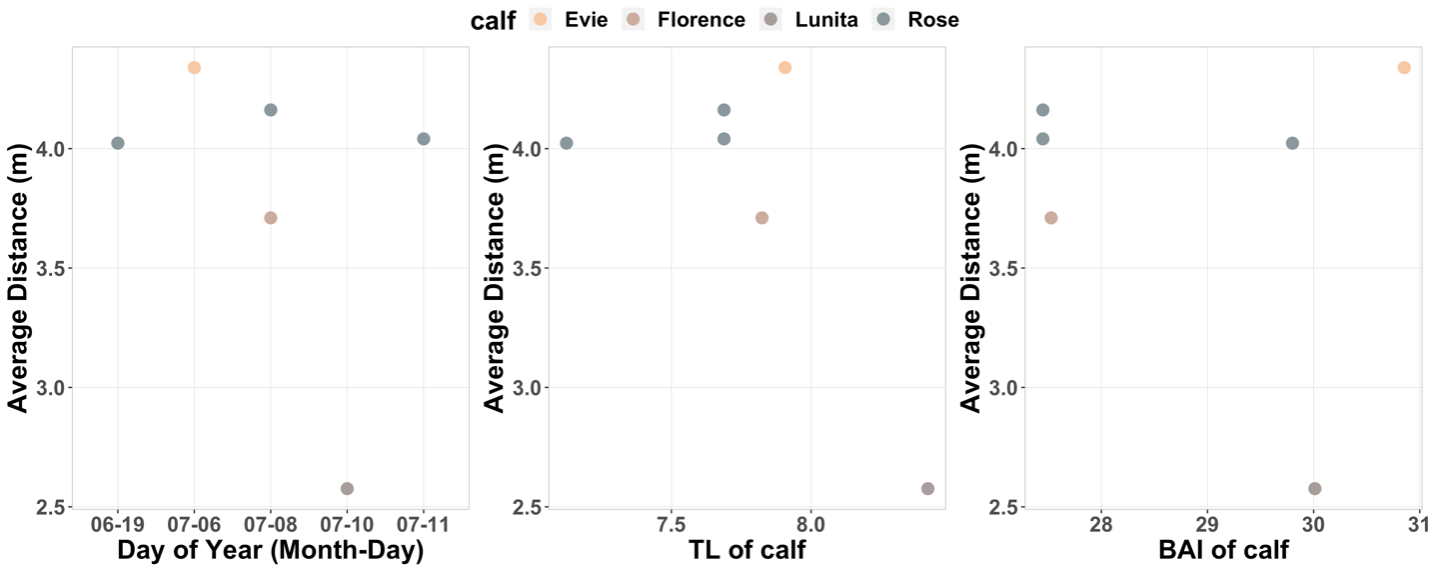
SLEAP A.I. was able to successfully detect and track gray whale mother-calf pairs across all videos (that’s a total of 1318 frames!). When evaluating how the average distance changed across Day of Year, calf Total length, and calf BAI, the plots did not demonstrate the positive relationship we anticipated (Fig 2A). However, when evaluating the standard deviation of distance across Day of Year, calf Total Length, and calf BAI, we did notice that there does appear to be an increase in variability of distance with an increase in Day of Year and calf Total length (Fig 2B)

Concluding thoughts
These results are monumental! We demonstrated the feasibility to use AI to create a model that can track gray whale pairs in drone footage, which is a fantastic tool that can be applied to updated datasets in the future. As more footage of gray whale mother-calf pairs are collected, this video can be quickly uploaded to SLEAP for model evaluation, predictions can be exported, and results subsequently included in the distance analysis to update our plots and increase our understanding. Our data currently provide a preliminary understanding of how the distance between mother-calf pairs changes with Day of Year, Total length, and BAI, but we are now able to continue updating our dataset as we collect more drone footage.
I suppose you can say I did mislead you a bit with my title, as I have lost some SLEEP recently. But, not over video analysis per say but rather in the form of inspiration. Inspiration toward expanding my understanding of machine learning so that it can be applied toward answering pressing ecological questions. This project has only propelled me to dig my heels in and investigate further the potential of machine learning to analyze dense datasets for huge knowledge gains.

Acknowledgements
This project was made possible in partnership by the continuous support by Clara Bird, Dr. Leigh Torres, KC Bierlich, and the entire GEMM Lab!
References
Nielsen, M., Sprogis, K., Bejder, L., Madsen, P., & Christiansen, F. (2019). Behavioural development in southern right whale calves. Marine Ecology Progress Series, 629, 219–234. https://doi.org/10.3354/meps13125
Pereira, Talmo D., Nathaniel Tabris, Junyu Li, Shruthi Ravindranath, Eleni S. Papadoyannis, Z. Yan Wang, David M. Turner, et al. “SLEAP: Multi-Animal Pose Tracking.” Preprint. Animal Behavior and Cognition, September 2, 2020. https://doi.org/10.1101/2020.08.31.276246.
Torres, Nieukirk, S. L., Lemos, L., & Chandler, T. E. (2018). Drone Up! Quantifying Whale Behavior From a New Perspective Improves Observational Capacity. Frontiers in Marine Science, 5. https://doi.org/10.3389/fmars.2018.00319