Dr. KC Bierlich, Postdoctoral Scholar, OSU Department of Fisheries, Wildlife, & Conservation Sciences, Geospatial Ecology of Marine Megafauna (GEMM) Lab
In my last blog, I discussed how to obtain morphological measurements from drone-based imagery of whales and the importance of calculating and considering uncertainty, as different drone platforms have varying levels of measurement uncertainty. But how does uncertainty scale and propagate when multiple measurements are combined, such as when measuring body condition of the whole animal? In this blog, I will discuss the different methods used for measuring body condition of baleen whales from drone-based imagery and how uncertainty differs between these metrics.
Body condition is defined as the energy stored in the body as a result of feeding and is assumed to indicate an animal’s overall health, as it reflects the balance between energy intake and investment toward growth, maintenance and reproduction (Peig and Green, 2009). Thus, body condition reflects the foraging success of an individual, as well as the potential for reproductive output and the quality of habitat. For example, female North American brown bears (Ursus arctos) in high quality habitats were in better body condition, produced larger litter sizes, and lived in greater population densities compared to females in lower quality habitats (Hilderbrand et al., 1999). As Dawn Barlow and Will Kennerley discussed in their recent blog, baleen whales are top predators and serve as ecosystem sentinels that shed light not only on the health of their population, but on the health of their ecosystem. As ocean climate conditions continue to change, monitoring the body condition of baleen whales is important to provide insight on how their population and ecosystem is responding.
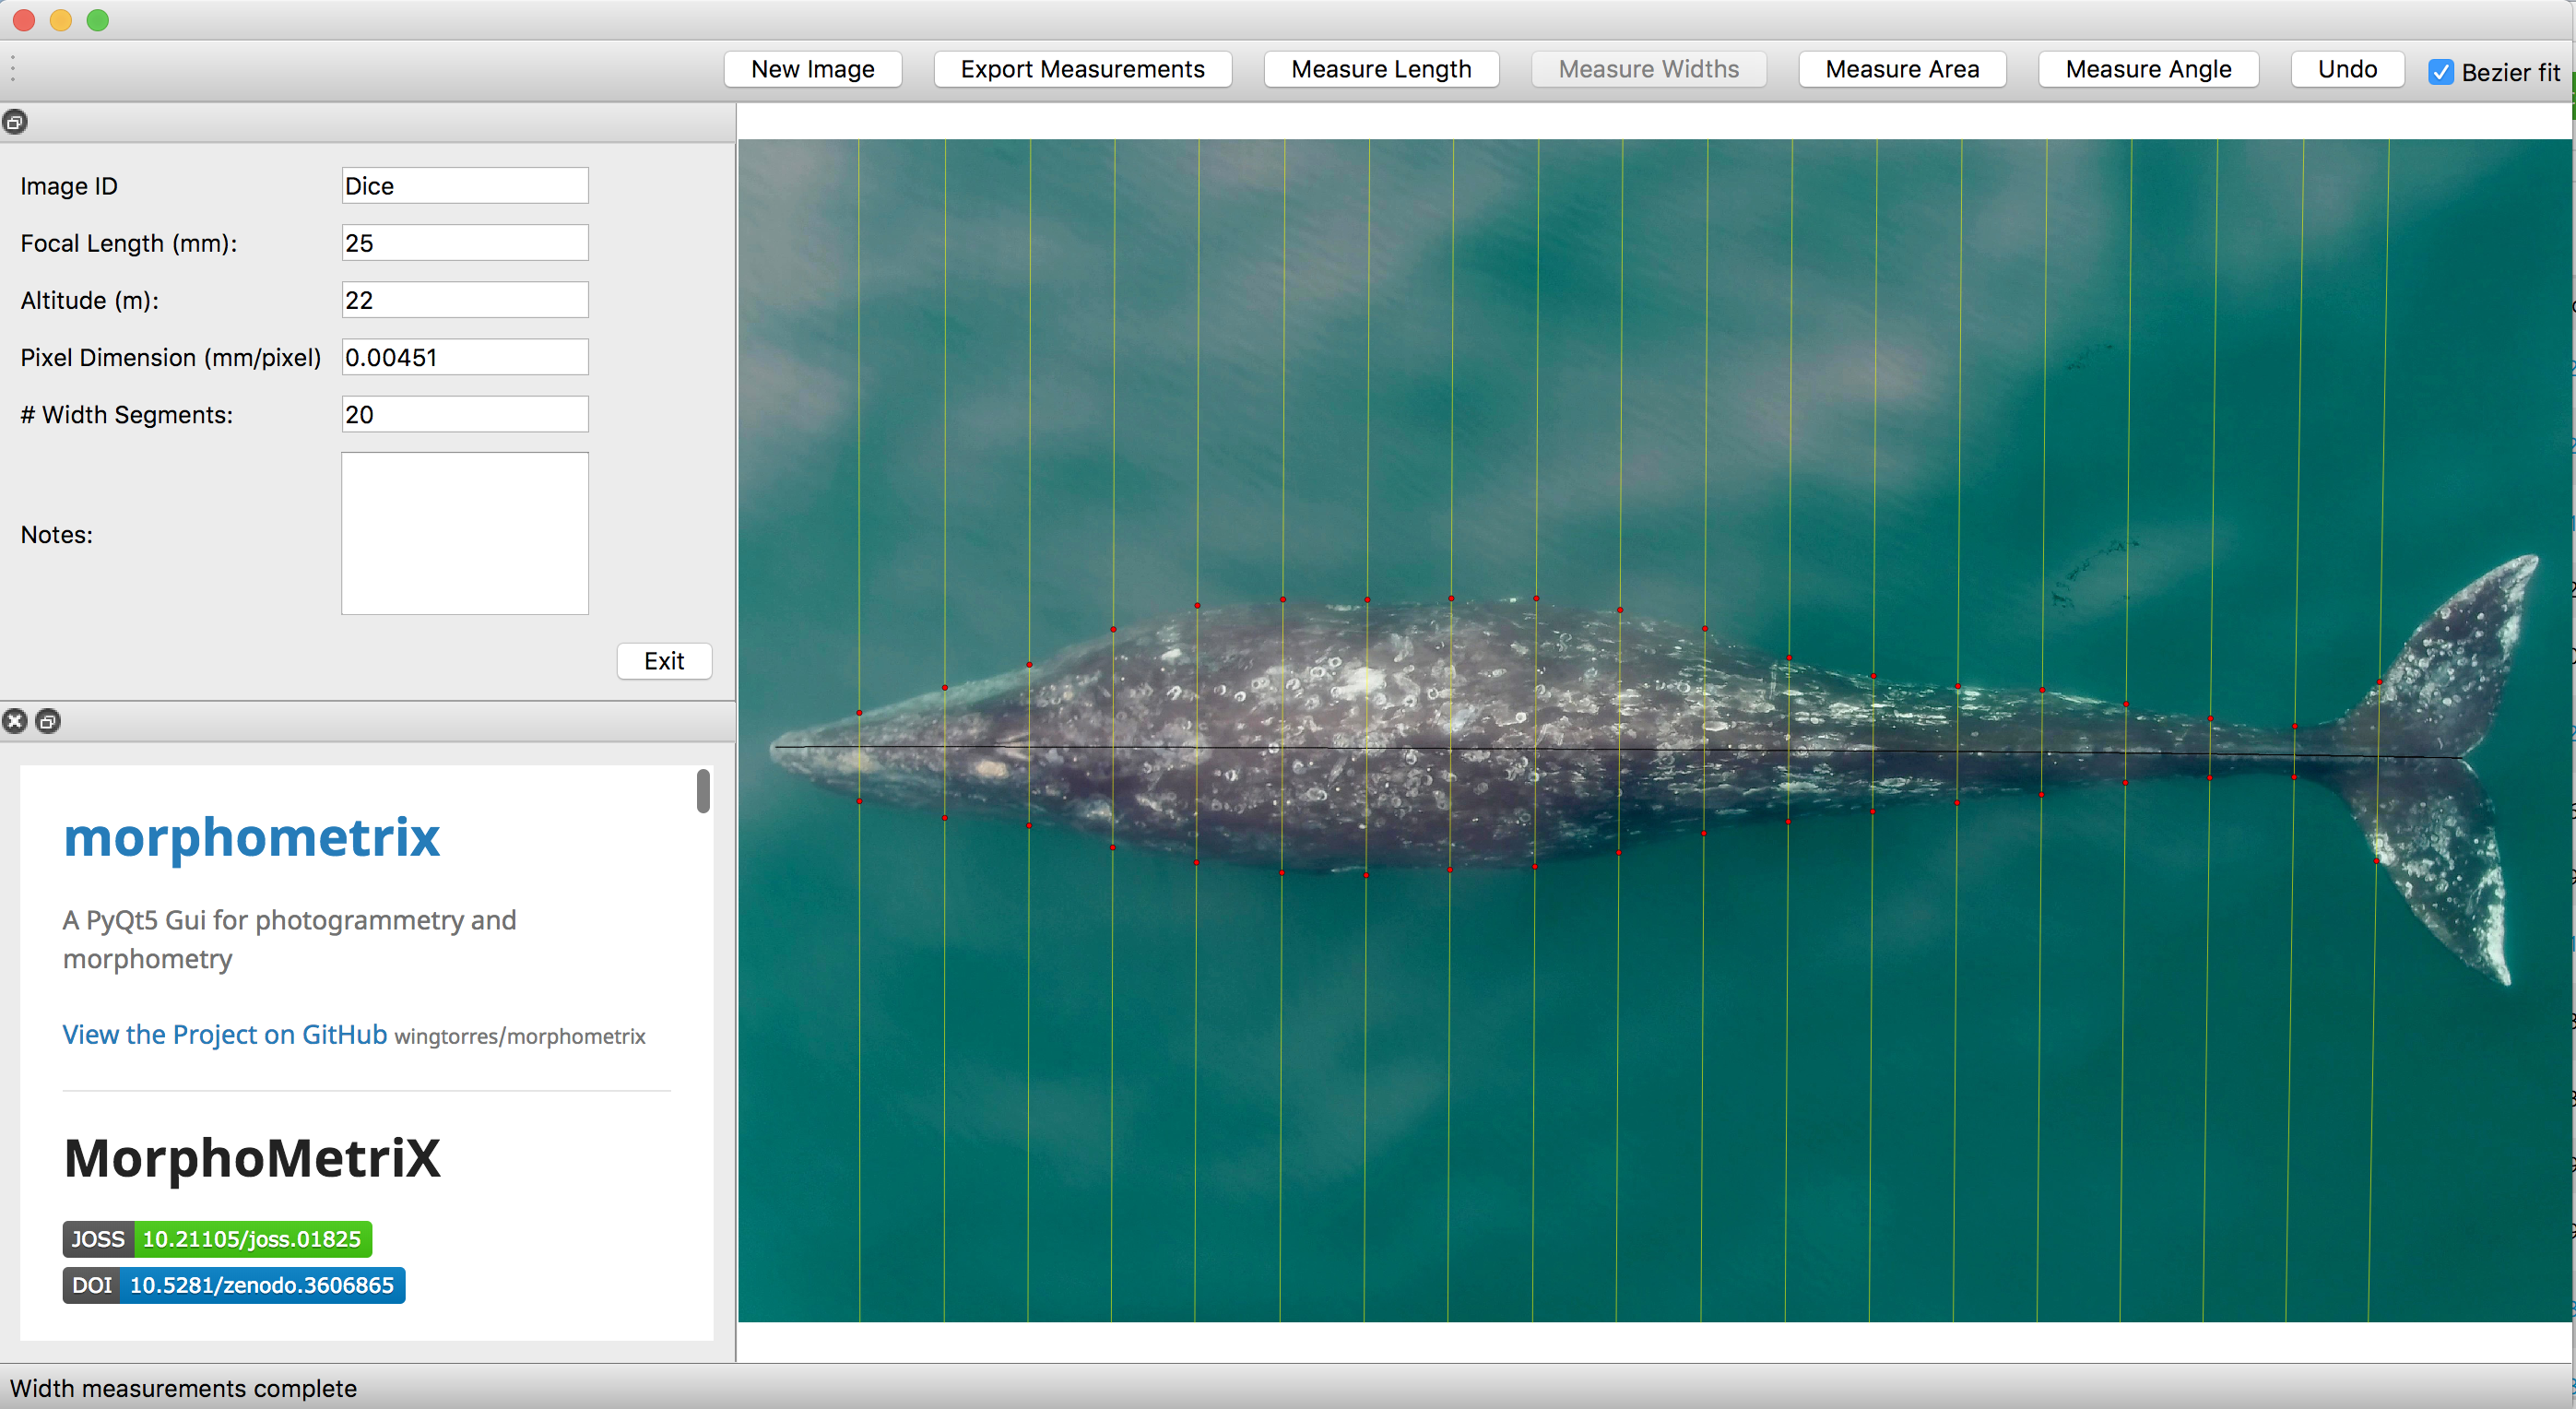
As discussed in a previous blog, drones serve as a valuable tool for obtaining morphological measurements of baleen whales to estimate their body condition. Images are imported into photogrammetry software, such as MorphoMetriX (Torres and Bierlich, 2020), to measure the total length of an individual and that is then divided into perpendicular width segments (i.e., in 5 or 10% increments) down the body (Fig. 1). These total length and width measurements are then used to estimate body condition in either 1-, 2-, or 3-dimensions: a single width (1D), a projected dorsal surface area (2D), or a body volume measure (3D). These 1D, 2D, and 3D measurements of body condition can then be standardized by total length to produce a relative measure of an individual’s body condition to compare among individuals and populations.
While several different studies have used each of these dimensions to assess whale body condition, it is unclear how these measurements compare amongst each other. Importantly, it is also unclear how measurement uncertainty scales across these multiple dimensions and influences inference, which can lead to misinterpretation of data. For example, the surface area and volume of two geometrically similar bodies of different sizes are not related to their linear dimensions in the same ratio, but rather to the second and third power, respectively (i.e., x2 vs. x3). Similarly, uncertainty should not be expected to scale linearly across 1D, 2D, and 3D body condition measurements.
The second chapter of my dissertation, which was recently published in Frontiers in Marine Science and includes Clara Bird and Leigh Torres as co-authors, compared the uncertainty associated with 1D, 2D, and 3D drone-based body condition measurements in three baleen whale species with different ranges in body sizes: blue, humpback, and Antarctic minke whales (Figure 2) (Bierlich et al., 2021). We used the same Bayesian model discussed in my last blog, to incorporate uncertainty associated with each 1D, 2D, and 3D estimate of body condition.

We found that uncertainty does not scale linearly across multi-dimensional measurements, with 2D and 3D uncertainty increasing by a factor of 1.45 and 1.76 compared to 1D, respectively. This result means that there is an added cost of increased uncertainty when utilizing a multidimensional body condition measurement. Our finding is important to help researchers decide which body condition measurement best suits their scientific question, particularly when using a drone platform that is susceptible to greater error – as discussed in my previous blog. However, a 1D measurement only relies on a single width measurement, which may be excluding other regions of an individual’s body condition that is important for energy storage. In these situations, a 2D or 3D measure may be more appropriate.
We found that when comparing relative measures of body condition (standardized by total length of the individual), each standardized metric was highly correlated with one another. This finding suggests that 1D, 2D, and 3D metrics will draw similar relative predictions of body condition for individuals, allowing researchers to be confident they will draw similar conclusions relating to the body condition of individuals, regardless of which standardized metric they use. However, when comparing the precision of each of these metrics, the body area index (BAI) – a 2D standardized metric – displayed the highest level of precision. This result highlights how BAI can advantageously detect small changes in body condition, which is useful for comparing individuals or even tracking the same individual over time.
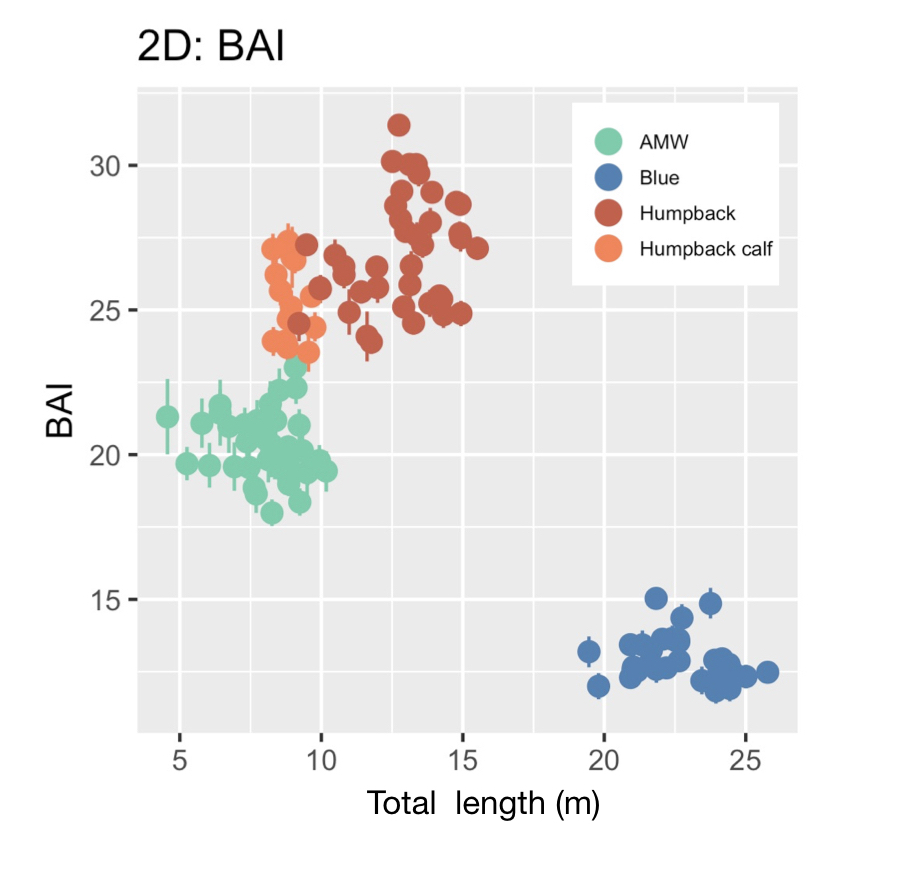
BAI was developed by the GEMM Lab (Burnett et al., 2018) and was designed to be similar to body mass index (BMI) in humans [BMI = mass (kg)/(height (m))2], where BAI uses the calculated surface area as a surrogate for body mass. In humans, a healthy BMI range is generally considered 18.5–24.9, below 18.5 is considered underweight, above 24.9 is considered overweight, and above 30 is considered obese (Flegal et al., 2012). Identifying a healthy range in BAI for baleen whales is challenged by a limited knowledge of what a “healthy” body condition range is for a whale. We found strong evidence that a healthy range of BAI is species-specific, as each species displayed a distinctive range in BAI: blue whales: 11–16; AMW: 17–24; humpback whales: 23–32; humpback whale calves: 23–28 (Fig. 3). These differences in BAI ranges likely reflect differences in the body shape of each species (Fig. 4). For example, humpbacks have the widest range of BAI compared to these other two species, which was also reflected in their larger variation in perpendicular widths (Figs. 2-4). Thus, it seems that BAI offers conditionally “scalefree” comparisons between species, yet it is unreasonable to set a single, all-whale BAI threshold to determine “healthy” versus “unhealthy” body condition. Collecting a large sample of body condition measurements across many individuals and demographic units over space and time with information on vital rates (e.g., reproductive capacity) will help elucidate a healthy BAI range for each species.

Over the past six years, the GEMM Lab has been collecting drone images of Pacific Coast Feeding Group (PCFG) gray whales off the coast of Oregon to measure their BAI (see GRANITE Project blog). Many of the individuals we encounter are seen across years and throughout the foraging season, providing an opportunity to evaluate how an individual’s BAI is influenced by environmental variation, stress levels, maturity, and reproduction. These data will in turn help determine what the healthy range in BAI for gray whales is. For example, linking BAI to pregnancy – whether a whale is currently pregnant or becomes pregnant the following season – will help determine what BAI is needed to support calf production. We are currently analyzing hundreds of body condition measurements from 2016 – 2021, so stay tuned for upcoming results!
References
Bierlich, K. C., Hewitt, J., Bird, C. N., Schick, R. S., Friedlaender, A., Torres, L. G., … & Johnston, D. W. (2021). Comparing Uncertainty Associated With 1-, 2-, and 3D Aerial Photogrammetry-Based Body Condition Measurements of Baleen Whales. Frontiers in Marine Science, 1729.
Burnett, J. D., Lemos, L., Barlow, D., Wing, M. G., Chandler, T., & Torres, L. G. (2018). Estimating morphometric attributes of baleen whales with photogrammetry from small UASs: A case study with blue and gray whales. Marine Mammal Science, 35(1), 108–139.
Flegal, K. M., Carroll, M. D., Kit, B. K., & Ogden, C. L. (2012). Prevalence of Obesity and Trends in the Distribution of Body Mass Index Among US Adults, 1999-2010. JAMA, 307(5), 491. https://doi.org/10.1001/jama.2012.39
Hilderbrand, G. V, Schwartz, C. C., Robbins, C. T., Jacoby, M. E., Hanley, T. A., Arthur, S. M., & Servheen, C. (1999). The importance of meat, particularly salmon, to body size, population productivity, and conservation of North American brown bears. Canadian Journal of Zoology, 77(1), 132–138.
Peig, J., & Green, A. J. (2009). New perspectives for estimating body condition from mass/length data: the scaled mass index as an alternative method. Oikos, 118(12), 1883–1891.
Torres, W., & Bierlich, K. C. (2020). MorphoMetriX: a photogrammetric measurement GUI for morphometric analysis of megafauna. Journal of Open Source Software, 5(45), 1825–1826.

