By Nicole Principe, second-year PhD student, OSU Dept of Fisheries, Wildlife and Conservation Sciences, GEMM Lab
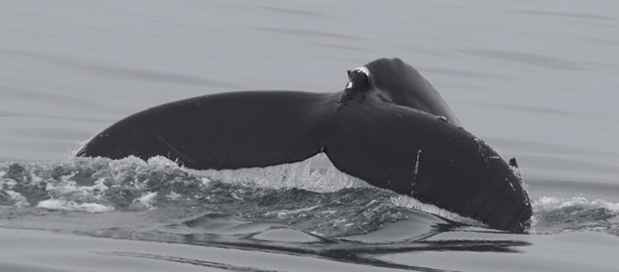
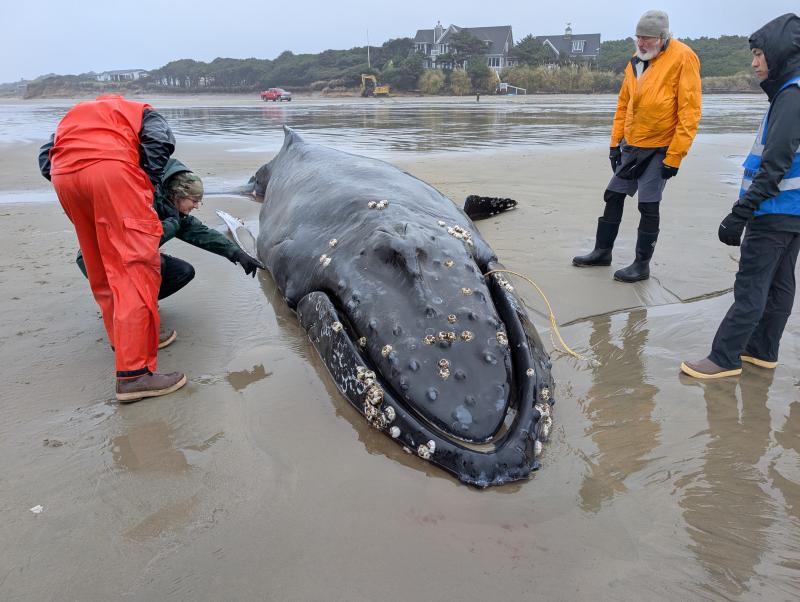
On November 15, 2025, a juvenile humpback whale stranded alive on the Oregon Coast, showing clear evidence of entanglement in gear linked to the 2023-2024 Oregon commercial Dungeness crab fishery1(Fig. 1). A large, multi-organization response followed, including groups from the West Coast Marine Mammal Stranding Network, OSU’s Marine Mammal Institute, Pacific Marine Mammal Center, Cascadia Research Collective, Oregon Coast Aquarium, SeaLife Response, Rehabilitation, Research, and more. After an unsuccessful attempt to help the whale return to sea, trained responders and veterinarians made the difficult decision to humanely euthanize it to prevent further suffering. A full necropsy (animal autopsy) was conducted afterwards to better understand the health of the whale and why it stranded
This event drew significant public attention, with community members gathering on the beach to witness this rare and emotional scene. Seeing a large, sentient animal like a humpback whale stranded on land is deeply upsetting and it naturally raised questions: Why did this happen? Was the whale sick or injured? Why couldn’t it be rescued? These are important and understandable questions and answering them openly is a core part of marine mammal science and education.
I worked as a marine mammal stranding technician in the Southeast US for almost two years, leading responses on numerous deceased and live stranded dolphins and whales. These experiences gave me insights about the realities of marine mammal response, how stranding networks operate, why marine mammals strand, how the public can safely assist when strandings occur, and efforts being done to mitigate human-related threats.
What is a Marine Mammal Stranding?
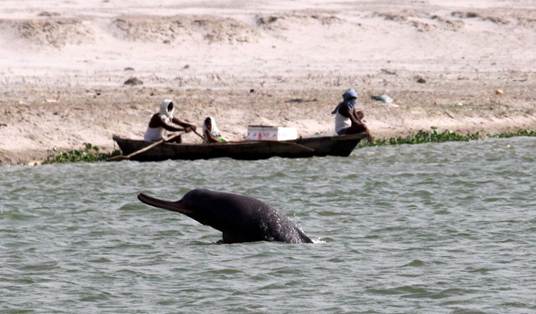
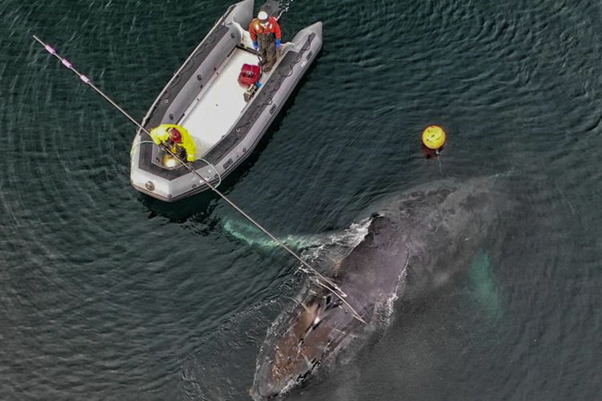
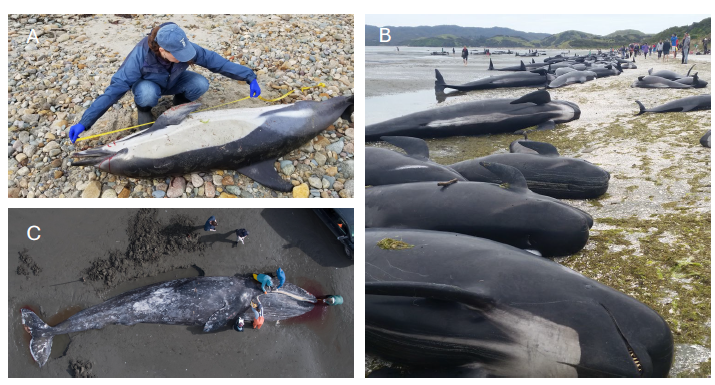
Before getting into the details of how responses work, it’s important to define what a marine mammal stranding is. The word “stranding” is used to describe sick, injured, entangled, distressed, or dead seals, sea lions, dolphins, porpoises, and whales. Cases vary with animals either washing ashore dead or live stranding on a beach or in shallow water and being unable to return to the water without assistance (Fig. 2). A mass-stranding involves two or more individual cetaceans of the same species stranding together. Each situation is different and requires various resources, equipment, and personnel2.
Stranding Networks
The National Oceanic and Atmospheric Administration (NOAA) Marine Mammal Health and Stranding Response Program (MMHSRP) was established under the Marine Mammal Protection Act and is the governing authority that oversees national responses to stranded pinnipeds and cetaceans. The MMHSRP works in collaboration with federal and state facilities as well as via networks of regional stranding responders, involving aquariums, academic institutions, and non-governmental organizations (NGOs). Network members have a Stranding Agreement from NOAA Fisheries, ensuring that all activities performed are safe for both responders and animals3.
Many stranding networks are made up of only a small number of paid employees and rely on support and assistance from community volunteer members. These networks also rely heavily on federal funding to maintain operations, including funding staff, ordering laboratory and necropsy supplies, facility maintenance, vessel and truck costs, sample shipment, pathology testing, and more. The John H. Prescott Marine Mammal Rescue Assistance Grant Program is a critical source of funding for many stranding groups. From 2001 through 2023, the Prescott Program awarded more than $75.4 million in grants to networks across the U.S4. Proposed budget cuts by the current administration put stranding networks at risk of losing this critical funding, which could impact the level of responses, limit necropsies, or reduce long-term monitoring efforts that are essential for detecting emerging threats to ocean and human health.
Key Steps to A Stranding Response
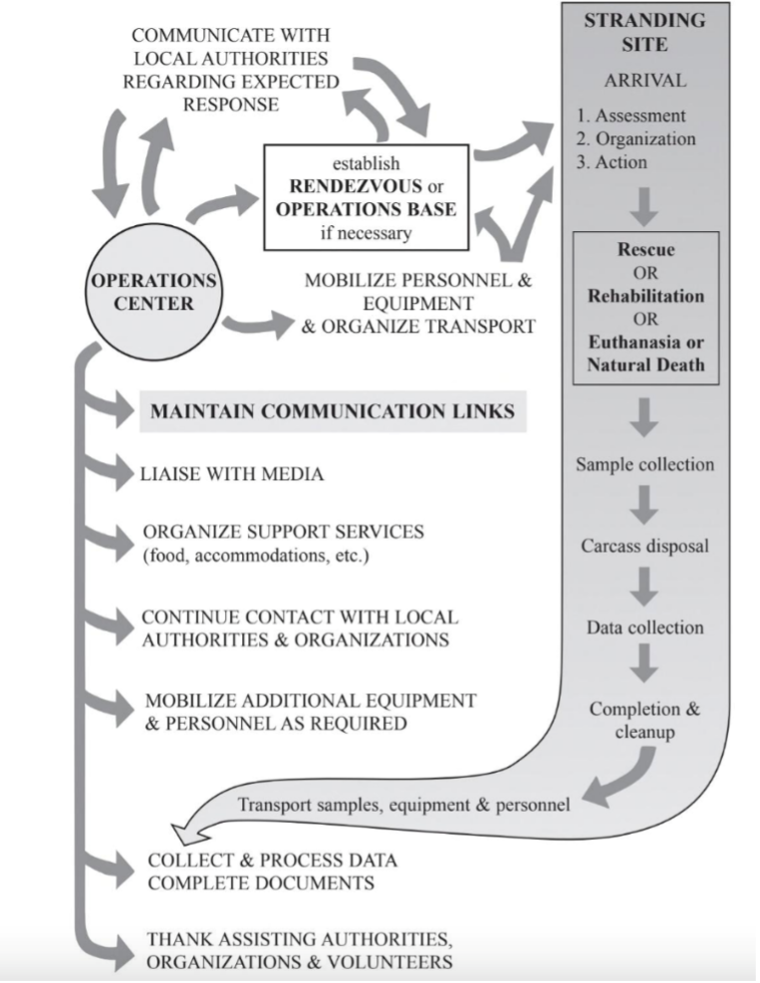
Step 1 – Stranding Network Receives a Call
Most marine mammal stranding networks operate a 24/7 hotline for the public to report stranded animals. These calls are critical for gathering information such as species, size, condition (alive or dead), location, and any visible injuries or entanglement. Photos and continued communication with the caller can greatly help responders coordinate an appropriate response.
Step 2 – Coordinating a Response
Every stranding is logistically complex, and response strategies differ greatly depending on whether the animal is alive or deceased.
Deceased animals
If an animal is found dead, it may be examined in the field or transported to a lab for further analysis. Accessing the carcass can be challenging due to tides, weather, terrain, and remoteness, often requiring coordination with volunteers and local agencies such as park officials, fire departments, or the Coast Guard.
Live Strandings
Live strandings are time-sensitive and require rapid decision-making. Once intervention is deemed necessary, responders may attempt to return the animal to sea, transport it to a rehabilitation facility, or, in some cases, humanely euthanize it. These decisions are based on the animal’s condition, likelihood of survival, resources available, and safety of both the animal and responders2.
Returning an animal to sea is a viable option only when the animal is deemed healthy and they can safely be returned to their natural habitat. Smaller animals like dolphins and porpoises may be more easily returned to the water or transported to a more appropriate location for release. Whales are typically given one to two tidal cycles to refloat on their own, but their own body weight causes immense pressure once stranded, which can lead to respiratory and circulatory collapse. Pulling a large whale back into the ocean can dislocate the tail, cause paralysis, or even break the spinal cord1. Rare, but successful refloats of whales have happened only when the animal wasn’t exhausted, the sea conditions and the slope of the beach were suitable, and heavy machinery and boats were accessible and usable5.
Rehabilitation and release can be successful for some species, particularly pinnipeds and certain small cetaceans, but outcomes vary widely6,7. Large whales, especially baleen whales, rarely survive rehabilitation due to their size and biological needs8.
Euthanasia is an option when it is necessary to end suffering of an animal in irreversibly poor condition, and the procedure can be carried out humanely, no rehab or care facility is available, rescue is not feasible, or the animal continually re-strands2. This option should only be done after all other options have been considered, proper authorities with NOAA have given approval, and a trained veterinarian is available to safely do the procedure. Oftentimes, veterinarians will administer a sedative to keep the animal calm before euthanasia. While the outcome can be sad, euthanasia is never a choice of convenience. It reflects a commitment to animal welfare, ensuring that when recovery is not possible, the animal does not endure unnecessary pain or distress.
Live Strandings Do’s and Don’ts
Well-intentioned public involvement can sometimes complicate response to a live stranding. Approaching a distressed animal puts human safety at risk and is illegal under the Marine Mammal Protection Act9. Attempting to push a stranded animal back into the water can increase stress, risk injury or drowning, or lead to re-stranding.
Before responders arrive, the public can help by keeping noise levels low, keeping pets away, and following instructions from authorities (Fig. 4). Once on site, response teams may establish boundaries to protect both people and the animal. Community support, such as providing access to private beaches or properties, supplying water or food, or assistance when requested, can play an important role in a smooth response.

Step 3 – Performing a Necropsy
A critical step after a marine mammal stranding is performing the necropsy to gain further insight into the cause of death. Preliminary information about the stranding itself is recorded, followed by identifying species and sex. Photos are taken of each part of the animal and measurements are collected to obtain morphometric data. A careful external examination is required to identify any signs of human interaction (i.e., entanglement, boat strike) or evidence of disease (i.e., skin lesions, blisters).
Upon opening the animal, each organ is examined and noted for abnormalities. Samples are collected from each organ for histopathology (to identify disease), virology, parasitology, or contaminant analysis. The number of samples that can be collected is influenced by how far along in the decomposition process the carcass is in, and how safely accessible the animal is (e.g., based on tides, daylight, weather).
Step 4 – Identifying Cause of Death
Determining the cause of death for stranded marine mammals is not always possible and rarely straightforward. But broadly, the causes of mortality fall into two categories: environmental factors and anthropogenic factors.
Environmental factors of mortality
Infectious and non-infectious diseases are among the leading causes of marine mammal mortality10. These include bacterial, viral, fungal, and parasitic infections that can affect multiple organ systems, impair feeding, and ultimately lead to emaciation or starvation11-13. Some pathogens, like cetacean morbillivirus and brucellosis, have caused large-scale mortality events and raise concerns for human health, highlighting the need for global monitoring14,15.
Marine mammals are also exposed to pollutants that bioaccumulate in marine ecosystems, including legacy contaminants such as DDT, PCBs, and heavy metals16-19. High contaminant loads have been linked to immunosuppression, increased disease susceptibility, reproductive impairment, endocrine disruption, and neoplasia20-23.
Harmful algal blooms (HABs) and the toxins they produce, such as domoic acid, have also caused mass mortality events in pinnipeds, sea otters, and cetaceans24-27. As HABs increase in frequency and intensity worldwide, they represent a growing threat to both marine mammals and ecosystem health.
Anthropogenic factors of mortality
In addition to natural and environmental causes, many marine mammal strandings are directly linked to human activities in the ocean. Collisions with vessels can result in severe injury or death and are often identified in stranded animals by propeller wounds or evidence of blunt force trauma observed during necropsy. While large, fast-moving ships are responsible for many fatalities involving large whales28,29, smaller recreational vessels also pose substantial risks to coastal species such as bottlenose dolphins and manatees30,31.
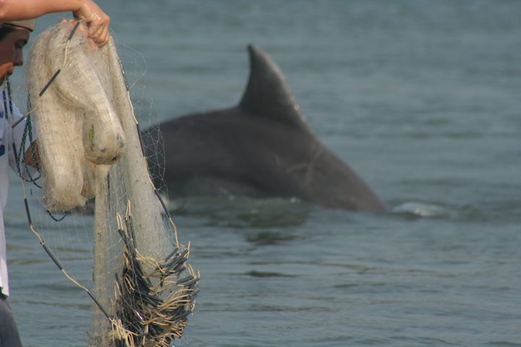
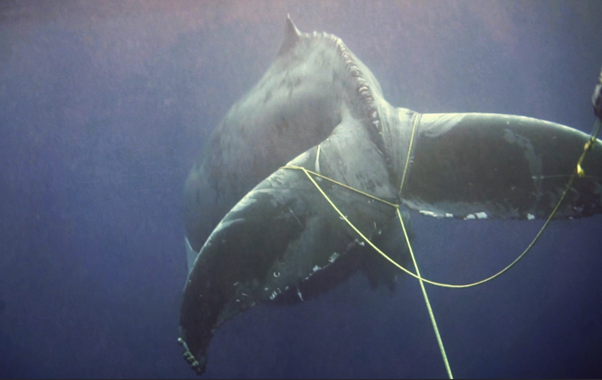
Entanglement in fishing gear is also a major source of human-caused mortality for marine mammals worldwide, affecting thousands of animals each year. Smaller species may drown from heavy gear, while large whales can become entangled and drag gear for weeks or months, leading to exhaustion, impaired feeding, infection, and drowning32.
Why do Marine Mammal Strandings Matter?
Marine mammal strandings play a critical role in monitoring ecosystem health. Through strandings and subsequent necropsies, scientists can identify the primary causes of mortality and detect patterns that would otherwise remain hidden in the open ocean. Marine mammals are particularly effective sentinels because they are long-lived, occupy mid- to high-trophic levels, and accumulate pollutants and toxins in their tissues, often providing early warning signs of emerging environmental stressors10.
Multiple stressors from both environmental and human-related threats can compound on a species, resulting in population declines. Continued monitoring through surveys on living animals and information gathered from stranded animals help provide data on what threats are most critical to inform conservation and management decisions and protect both marine ecosystems and human communities.
Preventing Strandings
Many efforts are being made to reduce mortality in marine mammals stemming from direct human impacts. NOAA has established regulations to implement speed restrictions in certain places and times to reduce lethal collisions. There is also a Whale Alert App that boaters can use to see where whales have recently been detected and avoid those areas. Remaining alert and vigilant on the water and transiting slowly in areas where marine mammals may be present can greatly reduce the risk of vessel strikes.
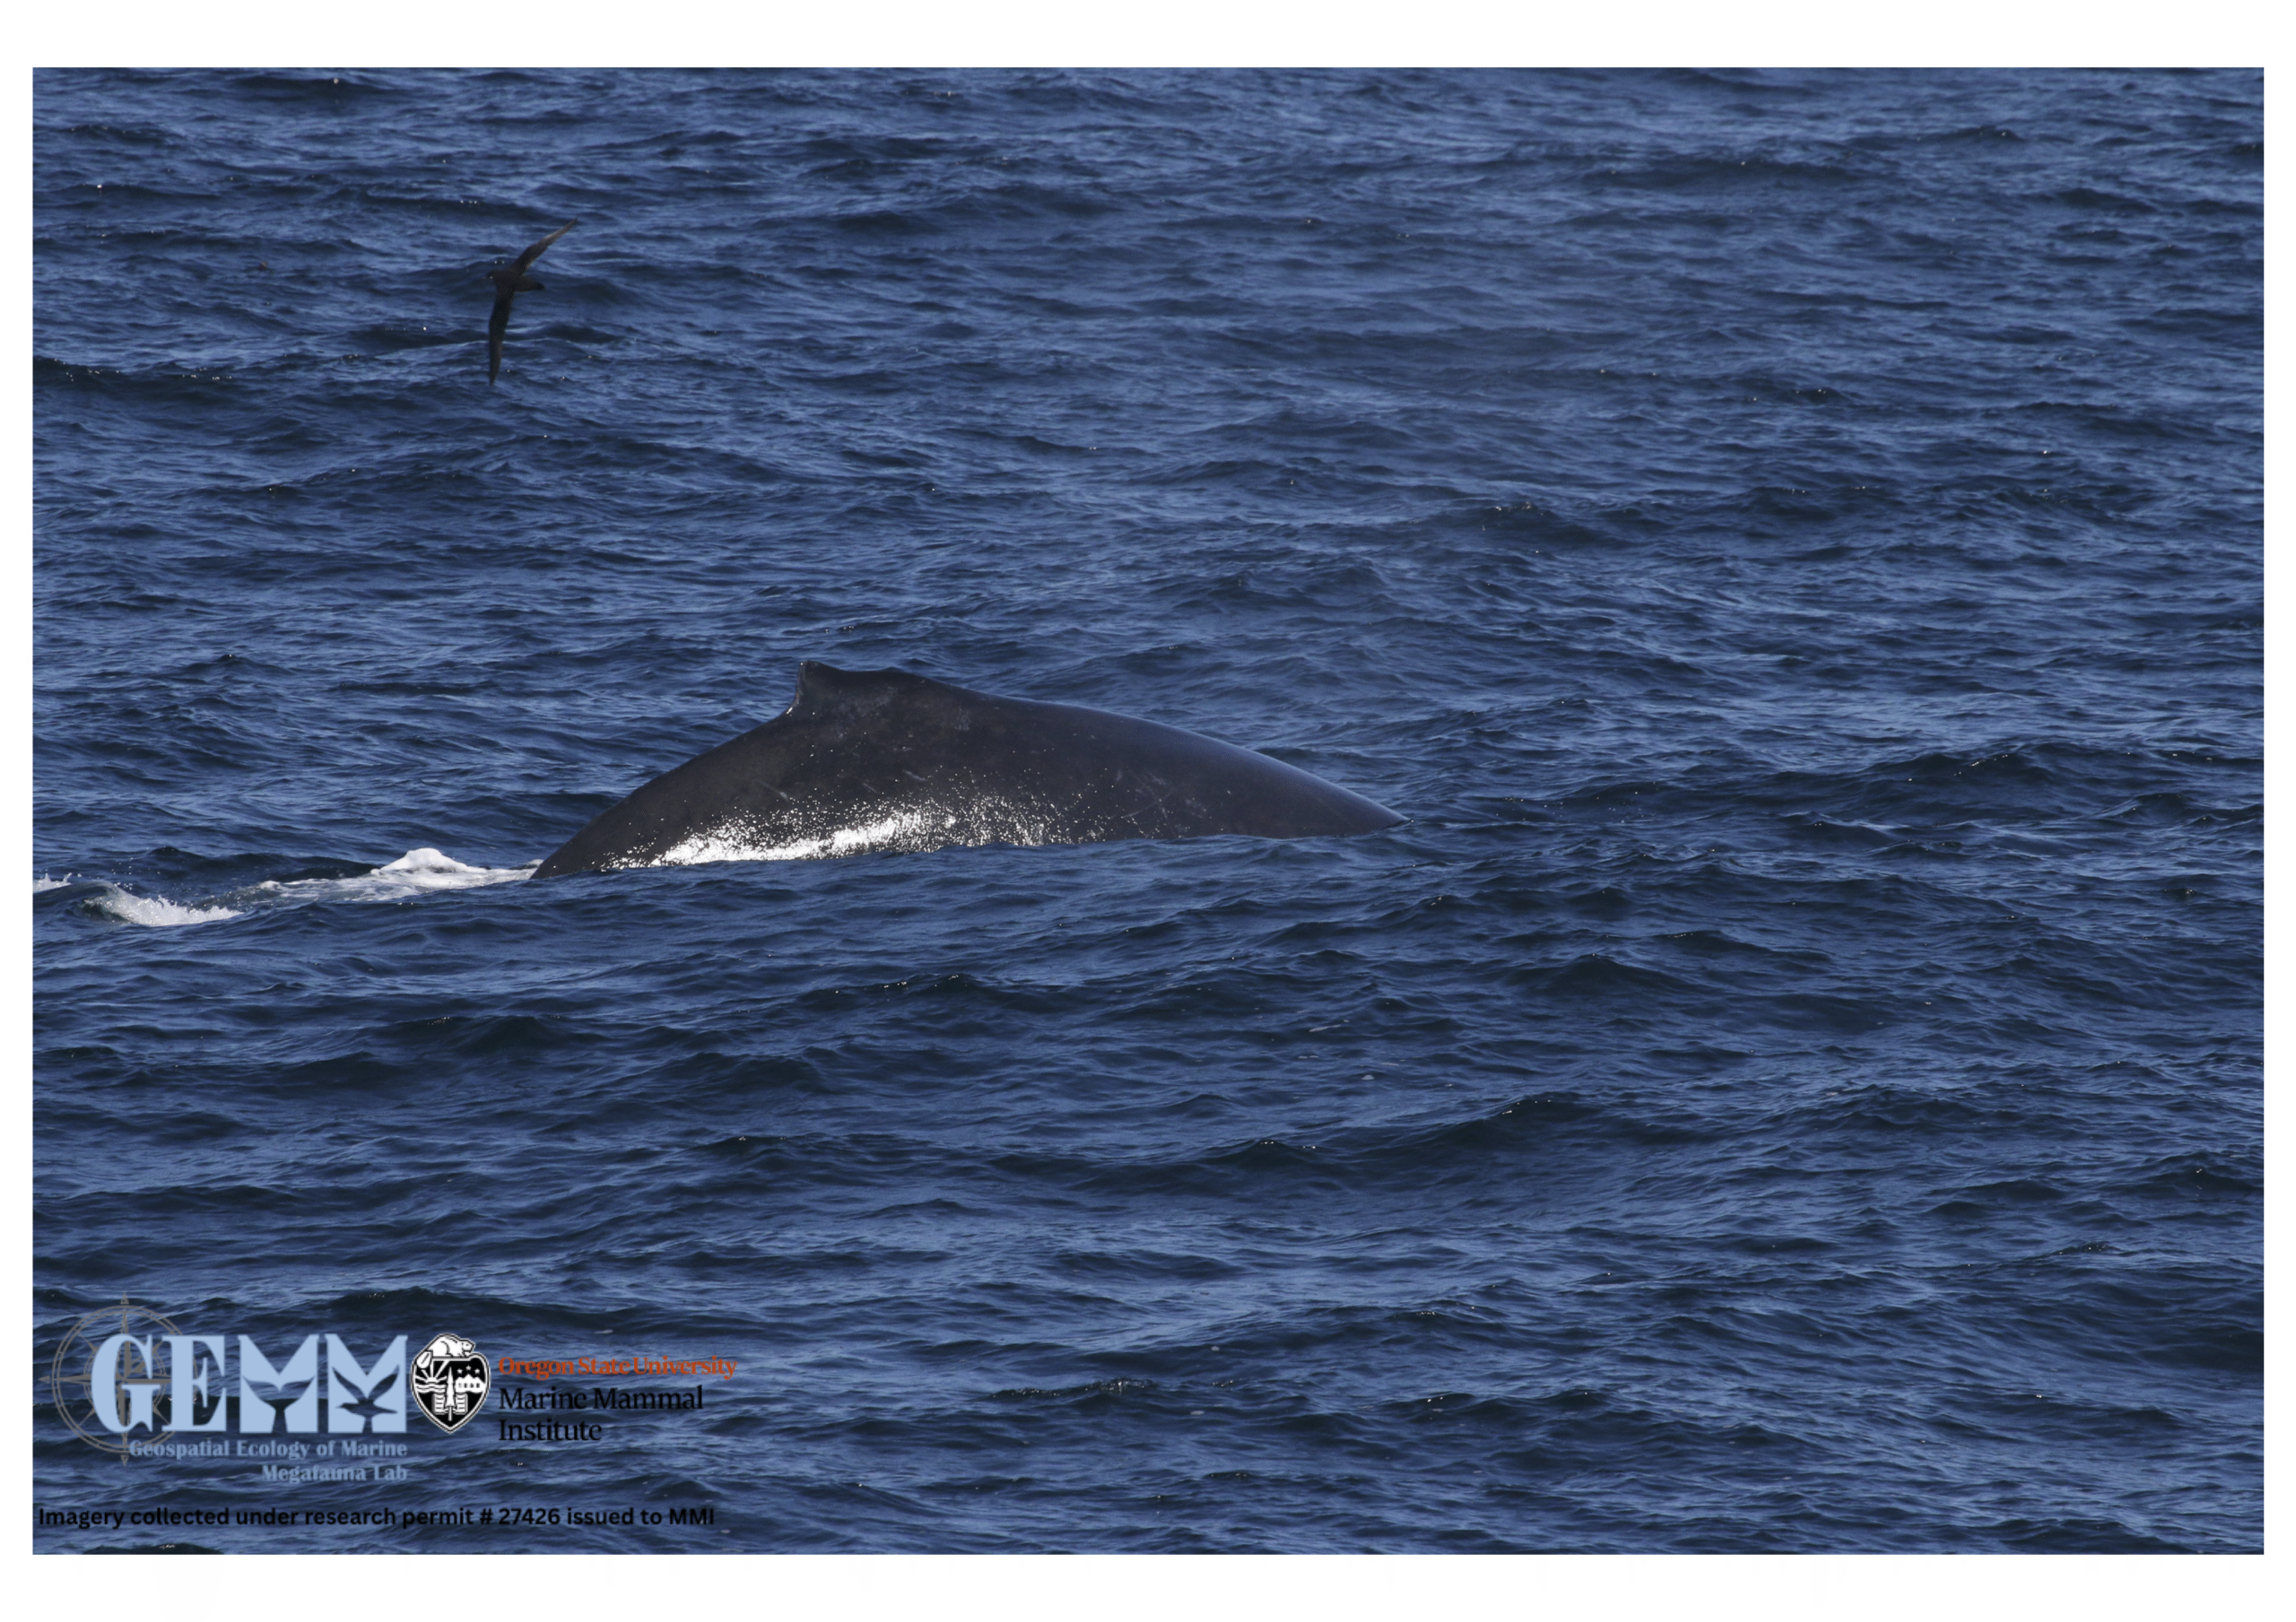
A significant amount of work worldwide is being done to better understand whale entanglements and develop solutions to reduce these events. In the GEMM Lab, Project OPAL was developed to identify co-occurrence between whales and fishing effort in Oregon to reduce entanglement risk. This collaborative project brings together scientists, managers from the Oregon Department of Fish and Wildlife, the commercial Oregon Dungeness crab fishery, and environmental nonprofits to discuss research methods and findings, and develop best practices and regulations to limit risk of entanglement while also ensuring a vibrant and profitable fishery.
If You Come Across a Stranded Marine Mammal
If you see a marine mammal stranding in Oregon, please make your first call to (541) 270-6830 to alert trained responders quickly. If you are in other U.S. regions, the hotlines can be found here.
References
- NOAA Fisheries. (2025). Experts Euthanize Oregon Humpback Whale After Unsuccessful Attempt to Free it from Beach. NOAA. https://www.fisheries.noaa.gov/feature-story/experts-euthanize-oregon-humpback-whale-after-unsuccessful-attempt-free-it-beach
- Geraci, J. R. & Lounsbury, V. J. (2005). Marine Mammals Ashore: A Field Guide for Strandings, 2nd Edition. National Aquarium in Baltimore.
- NOAA Fisheries. (2024). National Marine Mammal Stranding Response Network. NOAA. https://www.fisheries.noaa.gov/national/marine-life-distress/national-marine-mammal-stranding-response-network
- NOAA Fisheries (2023). John H. Prescott Marine Mammal Rescue Assistance Grant Program | NOAA Fisheries. NOAA. https://www.fisheries.noaa.gov/grant/john-h-prescott-marine-mammal-rescue-assistance-grant-program
- Neves, M. C., Neto, H. G., Cypriano-Souza, A. L., da Silva, B. M. G., de Souza, S. P., Marcondes, M. C. C., & Engel, M. H. (2020). Humpback Whale (Megaptera novaeangliae) Resighted Eight Years After Stranding. Aquatic Mammals, 46(5), 483–487.
- Mazzoil, M. S., McCulloch, S. D., Youngbluth, M. J., Kilpatrick, D. S., Murdoch, E. M., Mase-Guthrie, B., Odell, D. K., & Bossart, G. D. (2008). Radio-Tracking and Survivorship of Two Rehabilitated Bottlenose Dolphins (Tursiops truncatus) in the Indian River Lagoon, Florida. Aquatic Mammals, 34(1), 54–64.
- McHugh, K. A., Barleycorn, A. A., Allen, J. B., Bassos-Hull, K., Lovewell, G., Boyd, D., Panike, A., Cush, C., Fauquier, D., Mase, B., Lacy, R. C., Greenfield, M. R., Rubenstein, D. I., Weaver, A., Stone, A., Oliver, L., Morse, K., & Wells, R. S. (2021). Staying Alive: Long-Term Success of Bottlenose Dolphin Interventions in Southwest Florida. Frontiers in Marine Science, 7.
- Moore, M., Early, G., Touhey, K., Barco, S., Gulland, F., & Wells, R. (2007). Rehabilitation And Release Of Marine Mammals In The United States: Risks And Benefits. Marine Mammal Science, 23(4), 731–750.
- NOAA Fisheries. (2025a). Do Not Move Stranded Whales, Dolphins, or Porpoises. NOAA. https://www.fisheries.noaa.gov/marine-life-distress/do-not-move-stranded-whales-dolphins-or-porpoises
- Bossart, G. D. (2010). Marine Mammals as Sentinel Species for Oceans and Human Health. Veterinary Pathology, 48(3), 676–690.
- Bogomolni, A., Pugliares, K., Sharp, S., Patchett, K., Harry, C., LaRocque, J., Touhey, K., & Moore, M. (2010). Mortality trends of stranded marine mammals on Cape Cod and southeastern Massachusetts, USA, 2000 to 2006. Diseases of Aquatic Organisms, 88, 143–155.
- McFee, W. E., & Lipscomb, T. P. (2009). Major Pathologic Findings And Probable Causes Of Mortality In Bottlenose Dolphins Stranded In South Carolina From 1993 To 2006. Journal of Wildlife Diseases, 45(3), 575–593.
- Sanderson, C. E., & Alexander, K. A. (2020). Unchartered waters: Climate change likely to intensify infectious disease outbreaks causing mass mortality events in marine mammals. Global Change Biology, 26(8), 4284–4301.
- Taubenberger, J. K., Tsai, M.m Krafft, A. E., Lichy, J. H., Reid, A. H., Schulman, F. Y. & Lipscomb, T. P. (1996). Two morbilliviruses implicated in bottlenose dolphin epizootics. Emerging Infectious Diseases, 2(3), 213-216.
- Whatmore, A. M., Dawson, C. E., Groussaud, P., Koylass, M. S., King, A. C., Shankster, S. J., Sohn, A. H., Probert, W. S., & McDonald, W. L. (2008). Marine mammal Brucella genotype associated with zoonotic infection. Emerging Infectious Diseases, 14(3), 517-518.
- Becker, P. R. (2000). Concentration of Chlorinated Hydrocarbons and Heavy Metals in Alaska Arctic Marine Mammals. Marine Pollution Bulletin, 40(10), 819–829.
- Fair, P. A., Mitchum, G., Hulsey, T. C., Adams, J., Zolman, E., McFee, W., Wirth, E., & Bossart, G. D. (2007). Polybrominated Diphenyl Ethers (PBDEs) in Blubber of Free-Ranging Bottlenose Dolphins (Tursiops Truncatus) from Two Southeast Atlantic Estuarine Areas. Archives of Environmental Contamination and Toxicology, 53(3), 483–494.
- Lee, K., Alava, J. J., Cottrell, P., Cottrell, L., Grace, R., Zysk, I., & Raverty, S. (2022). Emerging Contaminants and New POPs (PFAS and HBCDD) in Endangered Southern Resident and Bigg’s (Transient) Killer Whales (Orcinus orca): In Utero Maternal Transfer and Pollution Management Implications. Environmental Science & Technology, 57(1), 360–374.
- Noël, M., & Brown, T. M. (2021). Contaminants as a Conservation Threat to Marine Mammals. Wildlife Biodiversity Conservation, 401–420.
- Colborn, T., & Smolen, M.J.(2003). Cetaceans and contaminants. In Vos, J. G., Bossart, G. D., Fournier, M., & O’Shea, T. (Eds.). Toxicology of Marine Mammals (pp. 291-232). Taylor & Francis, London.
- Murphy, S., Pierce, G. J., Law, R. J., Bersuder, P., Jepson, P. D., Learmonth, J. A., Addink, M., Dabin, W., Santos, M. B., Deaville, R., Zegers, B. N., Mets, A., Rogan, E., Ridoux, V., Reid, R. J., Smeenk, C., Jauniaux, T., López, A., Alonso Farré, J. M., & González, A. F. (2010). Assessing the effect of persistent organic pollutants on reproductive activity in common dolphins and harbour porpoises. Journal of Northwest Atlantic Fishery Science, 42, 153–173.
- Ross, P. S. (2002). The Role of Immunotoxic Environmental Contaminants in Facilitating the Emergence of Infectious Diseases in Marine Mammals. Human and Ecological Risk Assessment: An International Journal, 8(2), 277–292.
- Tanabe, S. (2002). Contamination and toxic effects of persistent endocrine disrupters in marine mammals and birds. Marine Pollution Bulletin, 45(1-12), 69–77.
- Fire, S. E., Wang, Z., Byrd, M., Whitehead, H. R., Paternoster, J., & Morton, S. L. (2011). Co-occurrence of multiple classes of harmful algal toxins in bottlenose dolphins (Tursiops truncatus) stranding during an unusual mortality event in Texas, USA. Harmful Algae, 10(3), 330–336.
- Häussermann, V., Gutstein, C. S., Bedington, M., Cassis, D., Olavarria, C., Dale, A. C., Valenzuela-Toro, A. M., Perez-Alvarez, M. J., Sepúlveda, H. H., McConnell, K. M., Horwitz, F. E., & Försterra, G. (2017). Largest baleen whale mass mortality during strong El Niño event is likely related to harmful toxic algal bloom. PeerJ, 5, e3123.
- Miller, M. A., Kudela, R. M., Mekebri, A., Crane, D., Oates, S. C., Tinker, M. T., Staedler, M., Miller, W. A., Toy-Choutka, S., Dominik, C., Hardin, D., Langlois, G., Murray, M., Ward, K., & Jessup, D. A. (2010). Evidence for a Novel Marine Harmful Algal Bloom: Cyanotoxin (Microcystin) Transfer from Land to Sea Otters. PLoS ONE, 5(9), e12576.
- Smith, J., Cram, J. A., Berndt, M. P., Hoard, V., Shultz, D., & Deming, A. C. (2023). Quantifying the linkages between California sea lion (Zalophus californianus) strandings and particulate domoic acid concentrations at piers across Southern California. Frontiers in Marine Science, 10.
- Laist, D. W., Knowlton, A. R., Mead, J. G., Collet, A. S., & Podesta, M. (2001). COLLISIONS BETWEEN SHIPS AND WHALES. Marine Mammal Science, 17(1), 35–75.
- Schoeman, R. P., Patterson-Abrolat, C., & Plön, S. (2020). A Global Review of Vessel Collisions With Marine Animals. Frontiers in Marine Science, 7.
- Calleson, C., & Kipp Frohlich, R. (2007). REVIEW: Slower boat speeds reduce risks to manatees. Endangered Species Research, 3, 295–304.
- Wells, R. S., & Scott, M. D. (1997). Seasonal Incidence Of Boat Strikes On Bottlenose Dolphins Near Sarasota, Florida. Marine Mammal Science, 13(3), 475–480.
- Cassoff, R., Moore, K., McLellan, W., Barco, S., Rotstein, D., & Moore, M. (2011). Lethal entanglement in baleen whales. Diseases of Aquatic Organisms, 96(3), 175–185.