Dr. Alejandro A. Fernández Ajó, Postdoctoral Scholar, Marine Mammal Institute – OSU Department of Fisheries, Wildlife, & Conservation Sciences, Geospatial Ecology of Marine Megafauna (GEMM) Lab.
The Eastern North Pacific (ENP) gray whale population has experienced at least two recorded Unusual Mortality Events (UMEs), from 1999–2000 and from 2019 to 2024, during which many gray whales stranded along the Pacific coast from northern Mexico to the Alaskan Arctic, USA (Martínez-Aguilar et al., 2019; Urbán, 2020). Several factors have been considered as possible causes for the high number of gray whale’s strandings, including variation in Arctic prey availability and the duration of their feeding season caused by the timing of sea ice formation and breakup (Stewart et al., 2023), starvation, anthropogenically derived toxicants, biotoxins, infectious diseases, parasites, fisheries interactions, and ship strikes (F. Gulland et al., 2005). In the most recent UME, many of the stranded whales showed signs of emaciation, indicating malnutrition as a causal factor of death (Christiansen et al., 2021; Torres et al., 2022). While the poor condition of many of the stranded whales supports the idea of starvation as a cause for these mortalities, the underlying causes of malnutrition are unknown, and it is also unclear whether the whales’ decline in body condition was rapid or gradual.

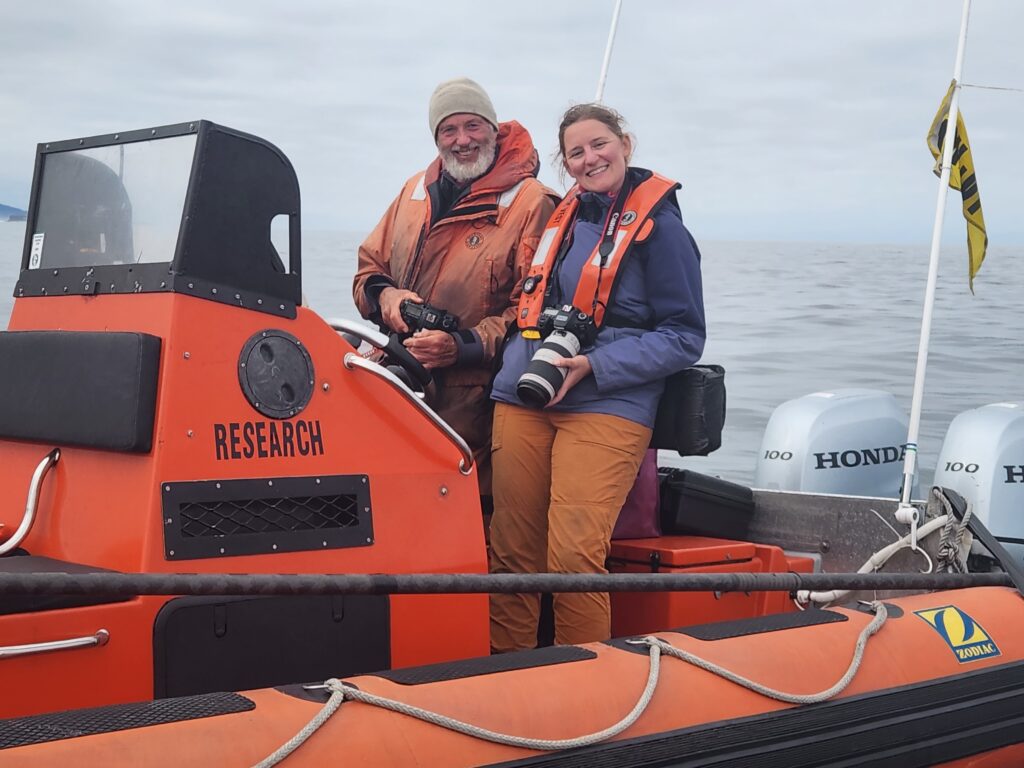
Large whales face a multitude of stressors in their environment, ranging from ocean noise to contaminants, climate change, and prey shifts. Understanding how individual whales respond to these disturbances is crucial for assessing potential impacts on the population as a whole. However, monitoring the health parameters and vital rates of whales presents significant challenges due to their large size, mobility, and the vast ranges of their marine habitat. Studying stranded whales can provide valuable insights into health risks, disease susceptibility, and the impacts of pollutants and other stressors on whale populations, thus informing conservation strategies (see post). Nonetheless, the quality of information obtained from necropsies heavily relies on the timeliness of stranding reports, as decomposition begins immediately after death, limiting detailed investigations into the cause of death. Therefore, establishing a robust network capable of promptly reporting and addressing stranding events is essential (Gulland & Stockin, 2020). An effective network involves having well-trained staff, proper infrastructure, sufficient funding, and the expertise and tools necessary to gather and analyze data and samples to infer their health and causes of mortality.
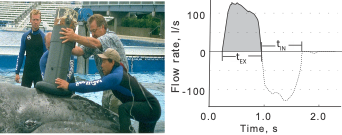
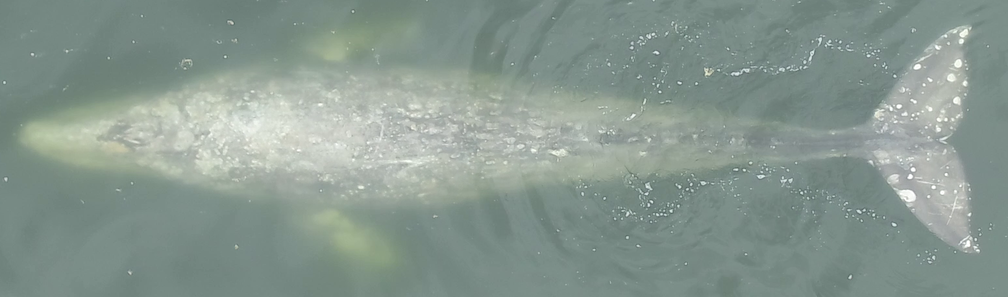
During my doctoral dissertation, I worked to develop and ground truth the endocrine analyses of whale baleen as a novel sample type that can be used for retrospective assessments of the whale’s physiology (see my previous post & post). Baleen, the filter-feeding apparatus of mysticetes whales (Figure 1), consists of long fringed plates of keratinized tissue that grow continuously and slowly downward from the whale’s upper jaw. These plates are routinely collected at necropsies; and unlike other tissue types, they are durable and have minimum storage requirements; they can be preserved dry at room temperature, allowing for the analysis of both historical and current whale populations. Moreover, while most sample types used for studying whale health and physiology provide a single time-point measure of current circulating hormone levels (e.g., skin or respiratory vapor) or hold integrated information from the previous few hours or days (e.g., urine and feces), baleen tissue provides a unique opportunity for retrospective and longitudinal analyses of multiple biological parameters of the individual during the time that the tissue was grown, i.e., months to years prior to death, helping to describe the whale’s physiology, migration patterns, and exposure to pollutants (see my previous post).
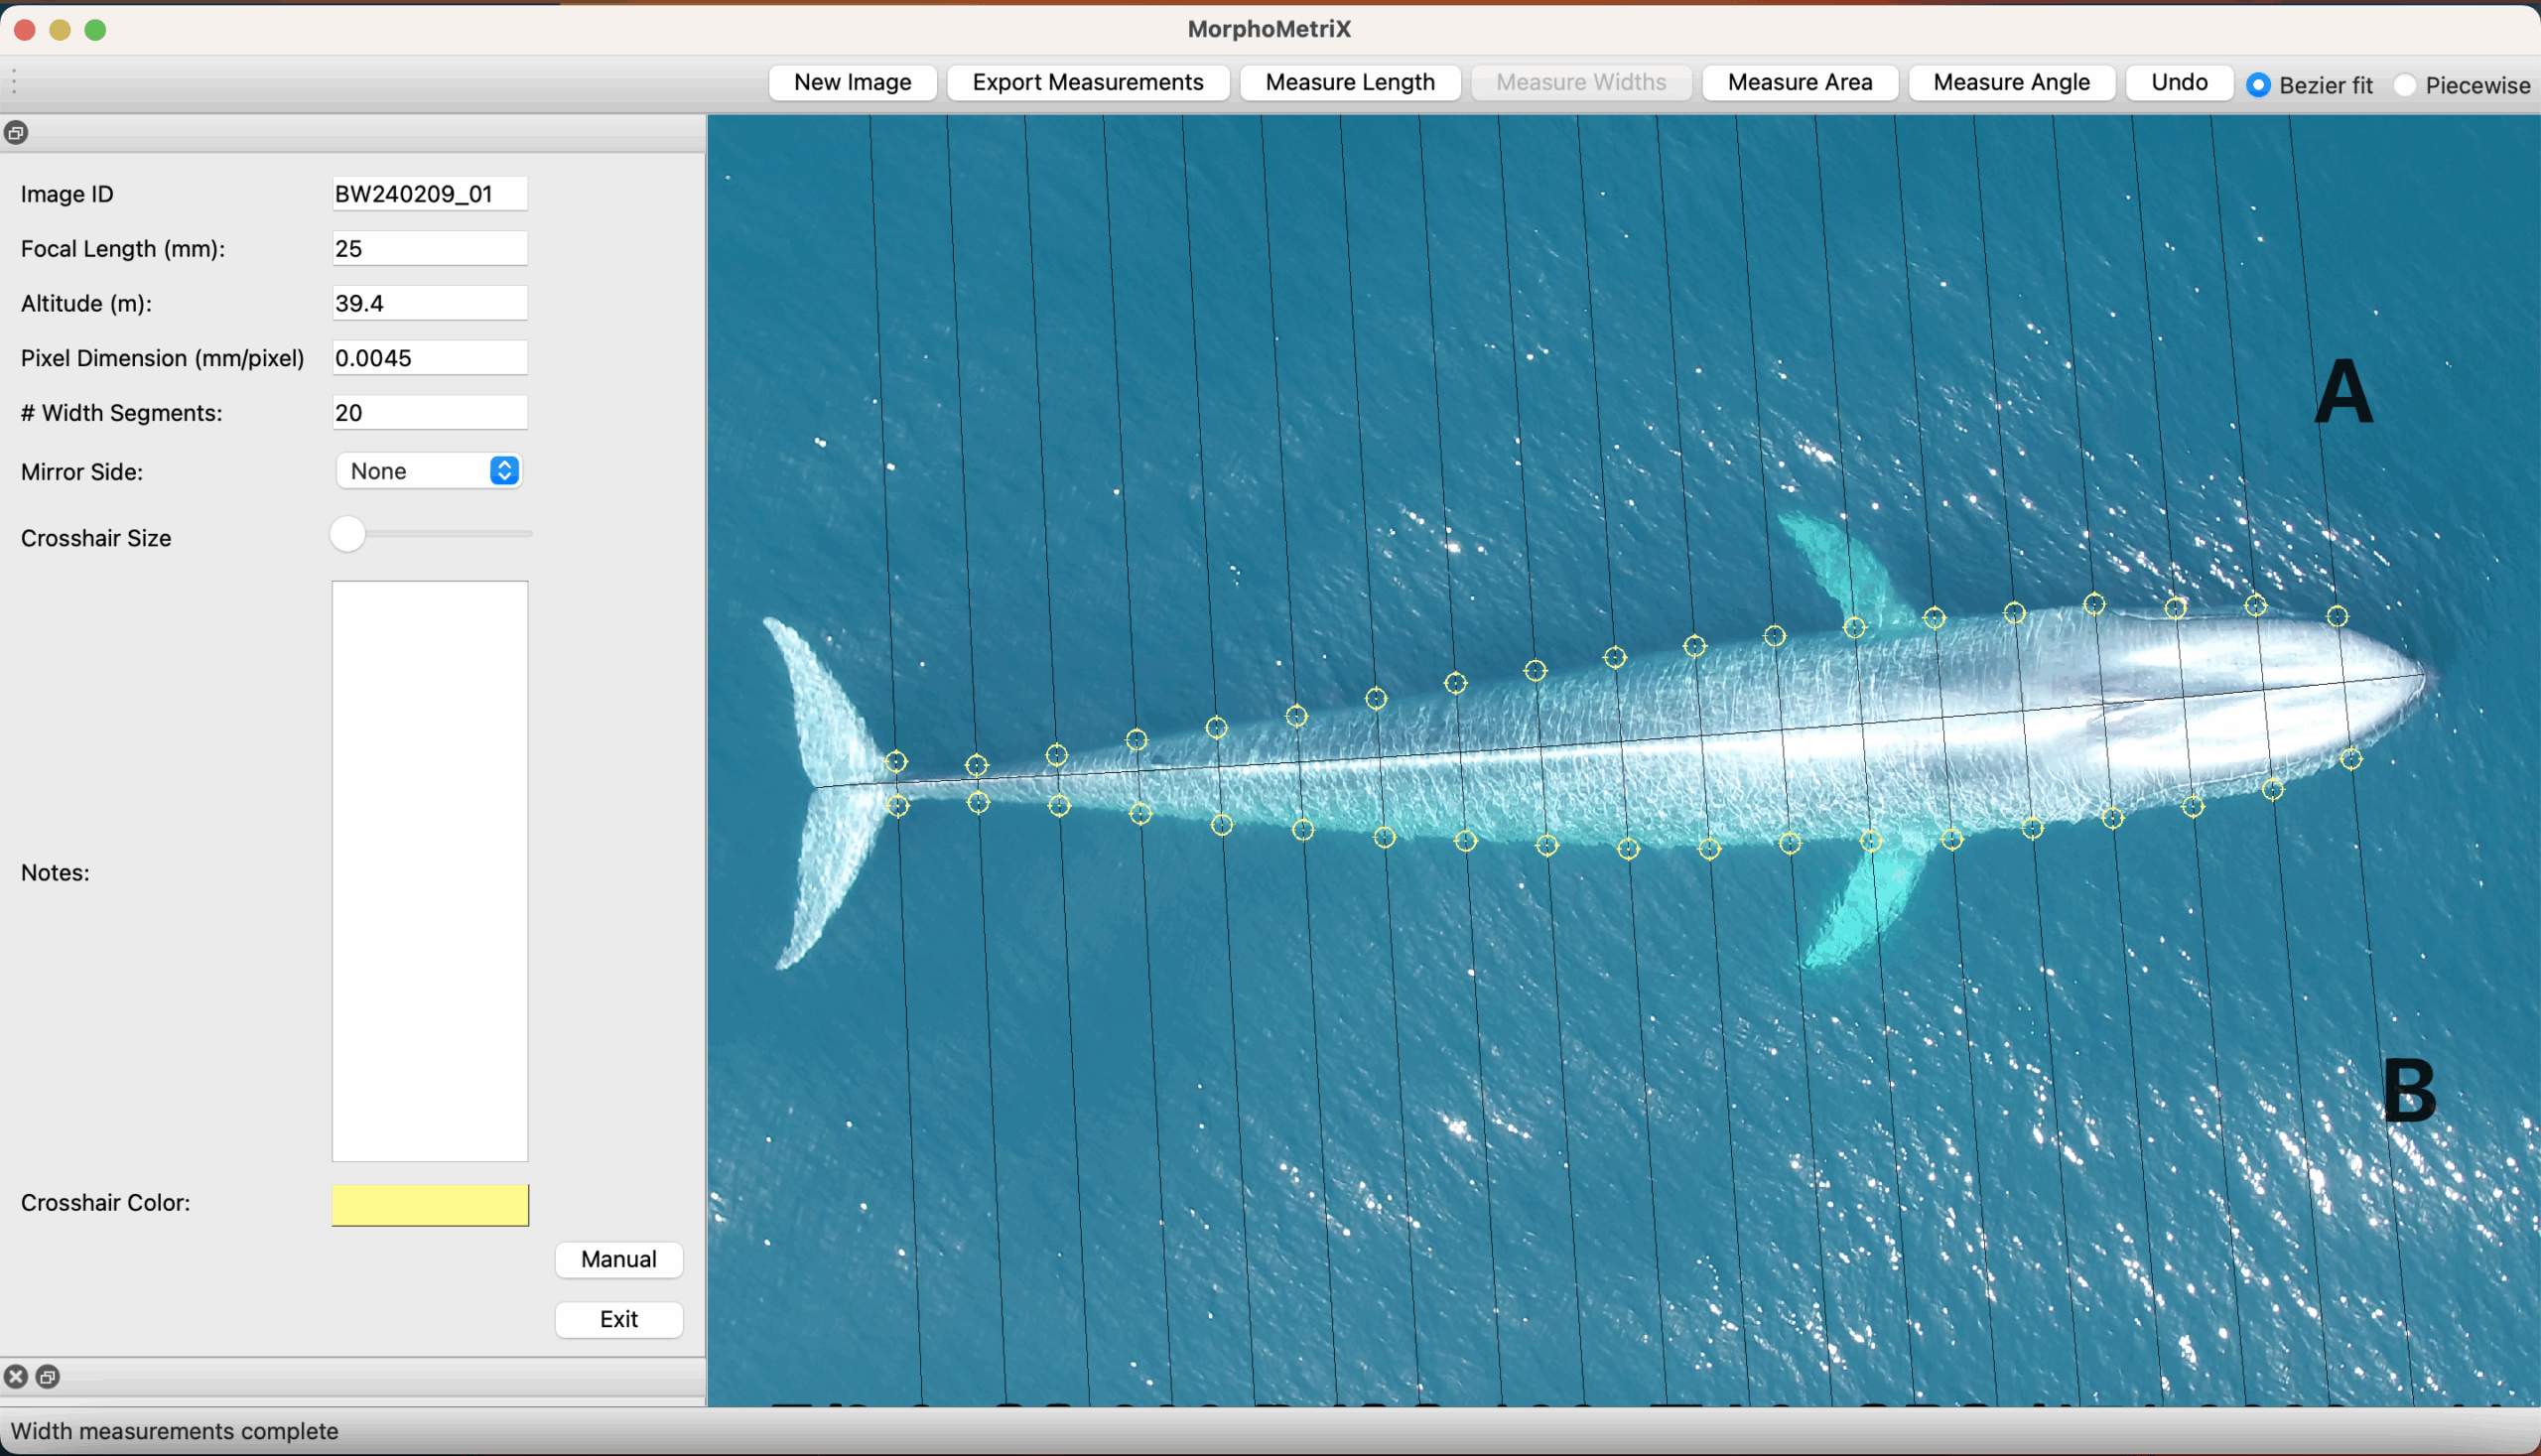
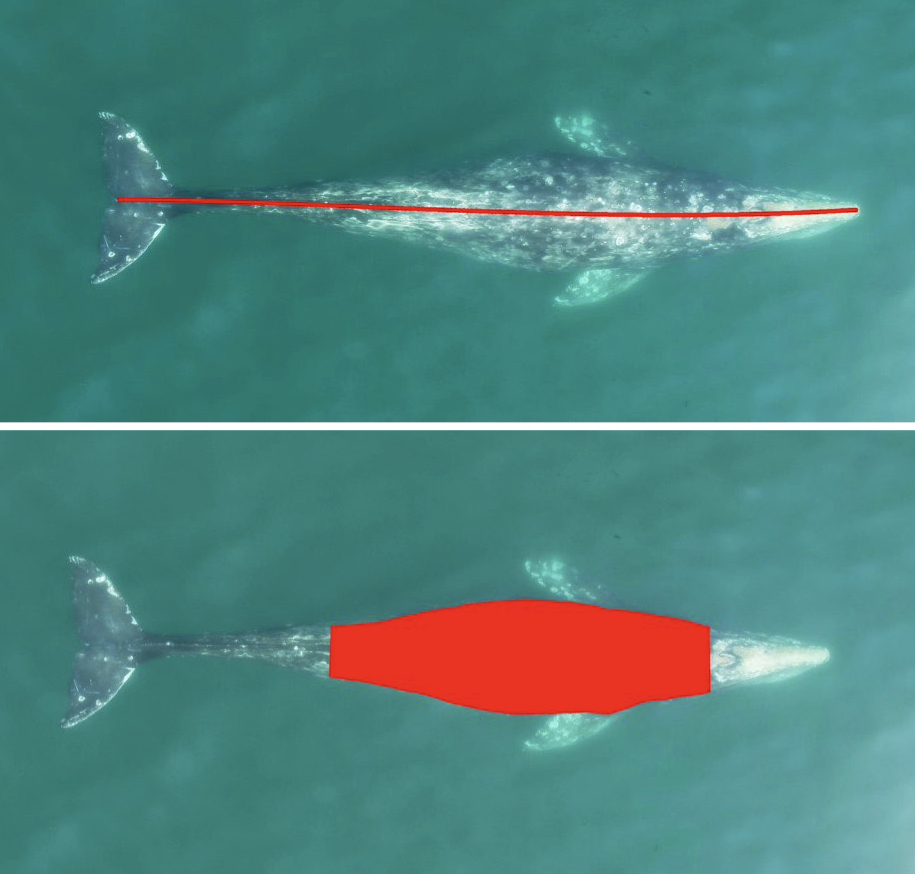
In our recent study, “A longitudinal study of endocrinology and foraging ecology of subadult gray whales prior to death based on baleen analysis”, published in the journal General and Comparative Endocrinology, we examine isotope and hormone levels in the baleen of five young gray whales stranded in central Oregon during the most recent UME. Our primary objectives were to retrospectively examine the hormone and isotopic profiles of the individual whales prior to mortality, assess potential factors contributing to death, and identify the timing for the onset of chronic illness leading to mortality. Our analysis included tracing longitudinal changes in (1) stable isotope values in baleen (δ13C and δ15N), which allowed us to infer the baleen growth rate and assess the seasonal changes in diet and foraging location in large whales (Figure 2), along with the quantification of (2) two adrenal glucocorticoid steroids that are biomarkers for the whale’s stress response, (3) one thyroid hormone (triiodothyronine, T3) as an indicator of nutritional state, and (4) two sex hormones, progesterone and testosterone, to infer about reproductive status and sexual maturity. By integrating isotopic and hormonal methodologies, our study demonstrates how baleen analysis offers a comprehensive narrative of the endocrine and trophic ecology of individual whales over time.

Our endocrine assessments revealed detailed profiles of stress-related hormones (glucocorticoids, cortisol) and thyroid hormones along the lengths of the baleen. We found increased levels of cortisol in whales that died from unknown causes, starting about eight months prior to their deaths. This suggests these whales were under prolonged stress before dying. In contrast, in the case of a whale killed acutely by a killer whale, cortisol levels were low and constant prior to death, indicating this individual was likely in good health prior to the sudden attack. In terms of thyroid activity, indicated by T3 hormone levels, we found a gradual increase over several months in the whales that died of unknown causes. This pattern is not typically expected, as stress usually suppresses thyroid function. This anomaly could suggest an adaptive response to maintain body temperature and metabolism in potentially malnourished whales. Regarding the sex hormones, as expected for this age class, we found no significant fluctuations or spikes that would indicate sexual maturity in these young whales (Figure 3).

Although commercial whaling is currently banned and several whale populations show evidence of recovery, today’s whales are exposed to a variety of other human stressors that cause significant lethal and non-lethal impacts (e.g., entanglement in fishing gear, vessel strikes, shipping noise, climate change, etc.; reviewed in Thomas et al., 2016). The recovery and conservation of large whale populations is particularly important to the oceanic environment due to their key ecological role and unique biological traits (See my previous post). Our research demonstrates the strengths of using baleen as a tool for the retrospective assessments of whale endocrinology and trophic ecology. As the Eastern North Pacific gray whale population faces recurring challenges, indicated by fluctuating numbers and unusual mortality events, innovative techniques like the baleen analysis presented here, are essential to investigate the causes of mortality and inform management, helping us understand not only the immediate causes of death but also broader environmental and ecological changes affecting their survival. Broadly implementing this approach with a greater sample size of baleen collected across a larger spatial and temporal range could significantly improve our strategies for conservation and management of baleen whales.
Did you enjoy this blog? Want to learn more about marine life, research, and
conservation? Subscribe to our blog and get a weekly message when we post a new
blog. Just add your name and email into the subscribe box below.
References
Christiansen, F., Rodríguez-González, F., Martínez-Aguilar, S., Urbán, J., Swartz, S., Warick, H., Vivier, F., & Bejder, L. (2021). Poor body condition associated with an unusual mortality event in gray whales. Marine Ecology Progress Series, 658, 237–252. https://doi.org/10.3354/meps13585
Gulland, F. M. D., & Stockin, K. A. (2020). Harmonizing global strandings response. European Cetacean Society Special Publication Series.
Gulland, F., Pérez-Cortés, H., Urbán, J. R., Rojas-Bracho, L., Ylitalo, G., Weir, J., Norman, S., Muto, M., Rugh, D., Kreuder, C., & Rowles, T. (2005). Eastern North Pacific gray whale (Eschrichtius robustus) unusual mortality event, 1999-2000. U.S. Department of Commerce. NOAA Technical Memorandum. NMFS-AFSC-150., March, 33 pp. http://www.afsc.noaa.gov/publications/AFSC-TM/NOAA-TM-AFSC-150.pdf
Martínez-Aguilar, S., Mariano-Meléndez, E., López-Paz, N., Castillo-Romero, F., Zaragoza-aguilar, G. A., Rivera-Rodriguez, J., Zaragoza-Aguilar, A., Swartz, S., Viloria-Gómora, L., & Urbán, J. R. (2019). Gray whale (Eschrichtius robustus) stranding records in Mexico during the winter breeding season in 2019. Report of the International Whaling Commission. Document SC/68A/CMP/14, May.
Stewart, J. D., Joyce, T. W., Durban, J. W., Calambokidis, J., Fauquier, D., Fearnbach, H., Grebmeier, J. M., Lynn, M., Manizza, M., Perryman, W. L., Tinker, M. T., & Weller, D. W. (2023). Boom-bust cycles in gray whales associated with dynamic and changing Arctic conditions. Science, 382(6667), 207–211. https://doi.org/10.1126/science.adi1847
Torres, L. G., Bird, C. N., Rodríguez-González, F., Christiansen, F., Bejder, L., Lemos, L., Urban R, J., Swartz, S., Willoughby, A., Hewitt, J., & Bierlich, KC. (2022). Range-Wide Comparison of Gray Whale Body Condition Reveals Contrasting Sub-Population Health Characteristics and Vulnerability to Environmental Change. Frontiers in Marine Science, 9. https://doi.org/10.3389/fmars.2022.867258
Urbán, R. (2020). Gray whale stranding records in Mexico during the 2020 winter breeding season. Unpublished Paper SC/68B/CMP/13 Presented to the IWC Scientific Committee, Cambridge.