By Lisa Hildebrand, MSc student, OSU Department of Fisheries and Wildlife, Geospatial Ecology of Marine Megafauna Lab
It seems unfathomable to me that one year and two months ago I had never used a theodolite before, never been in an ocean kayak before, never identified zooplankton before, never seen a Time-Depth-Recorder (TDR) before. Now, one year later, it seems like all of those tools, techniques and things are just a couple of old friends with which I am being reunited with again. My second field season as the project team lead of the gray whale foraging ecology project in Port Orford (PO) is slowly getting underway and so many of the lessons I learned from my first field season last year have already helped me tremendously this year. I know how to interpret weather forecasts and determine whether it will be a kayak-appropriate day. I know how to figure out the quirks of Pythagoras, the program we use to interface with our theodolite which helps us track whales from our cliff site. I know how to keep track of a budget and feed a team of hungry researchers after a long day of work. Knowing all of these things ahead of this year’s field season have made me feel a little more prepared and at ease with the training of my team and the work to be done. Nevertheless, there are always new curveballs to be thrown my way and while they can often be frustrating, I enjoy the challenges that being a team leader has to offer as it allows me to continue to grow as a field research scientist.

2019 marks the fifth year that this project has been taking place in PO. Back in the summer of 2015, former GEMM Lab Master’s student Florence Sullivan started this project together with Leigh. That year the research focused more on investigating vessel disturbance to gray whales by comparing sites of heavy (Boiler Bay) to low boat traffic (Port Orford). The effort found that there were significant differences in gray whale activity budgets between the heavy and low boat traffic conditions (Sullivan & Torres 2018). The following year, the focus of the research switched to being more on the foraging ecology side of things and the project was based solely out of Port Orford, as it continues to be to this day. Being in our fifth year means that we are starting to build a humbly-sized database of sightings across multiple years allowing me to investigate potential individual specialization of the whales that we document. Similarly, multiple years of prey sampling is starting to reveal temporal and spatial trends of prey community assemblages.
It has become a tradition to come up with a name for the field team that spends 6 weeks at the Oregon State University (OSU) Port Orford Field Station to collect the data for the project. It started with Team Ro“buff”stus in 2015, which I believe carried through until 2017. This is understandable since it’s such a clever name. It’s a play on the species name for gray whales, robustus, but the word “Buff” has been substituted in the center. Buffs are pieces of cloth sewn into a cylindrical shape, often with fun patterns or colors, that can be used as face masks, headbands, and scarves, which come in very handy when your face is exposed to the elements. Doing this project, we can be confronted by wind, sun, fog and sea water all in one day, so Buffs have definitely served the team members very well over the years. Last year, as the project’s torch was passed from Florence to myself, I felt a new team name was apt, and so last year’s team decided our name would be Team Whale Storm. I believe it was because we said we would take the whale world by storm with our insanely good theodolite tracking and kayak sampling skills. With a new year and new team upon us, a new team name was in order. As the title of this blog post indicates, this year the team is called Crew Cinco. The reason behind this name is that we are the fifth team to carry out this field work. Since the gray whales breed in the lagoons of Baja California, Mexico, I like to think that their native language is Spanish. Hence, we have decided that instead of being Crew Five, we are Crew Cinco, as cinco is the Spanish word for five (besides, alliteration makes for a much better team name).
Now that you are up to speed on the history of the PO gray whale project, let me tell you a little about who is part of Crew Cinco and what we have been up to already.
This year’s Marine Studies Initiative OSU undergraduate intern is Mia Arvizu. Mia has just finished her sophomore year at OSU and majors in Environmental Science. Besides being my co-captain this year in the field, Mia is also undertaking an independent research project which focuses on the relationship between sea urchin abundance, kelp health and gray whale foraging. She will tell you all about this project in a few weeks when she takes over the GEMM lab blog. Aside from her interest in ecology and the way science can be used to help local communities in a changing environment, Mia is a dancer, having performed in several dances in OSU’s annual luau this year, and she is currently teaching herself Spanish and Hawaiian.
Both of our high school interns this year are from Astoria. Anthony Howe has just graduated from Astoria High School and will be starting at Clatsop Community College in the fall. His plan is to transfer to OSU and to pursue his interest in marine biology. Anthony, like myself, was born in Germany and lived there until he was six, which means that he is able to speak fluent German. He also introduced the team to the wonders of the Instant Pot, which has made cooking for a team of four hungry scientists much simpler.
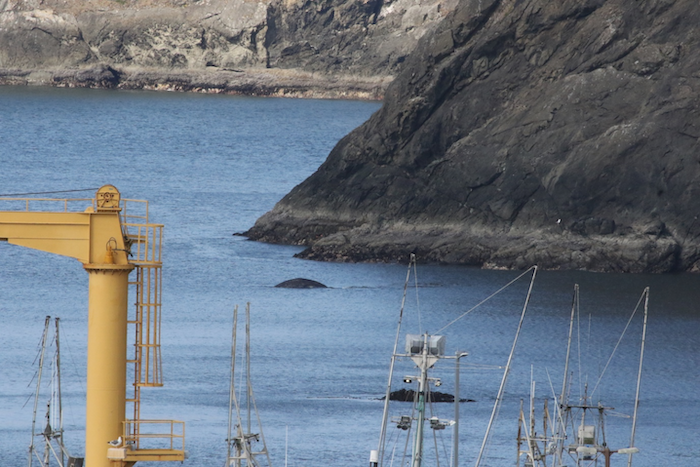
Donovan Burns is our other high school intern. He will be going into his junior year in the fall. Donovan never ceases to amaze us with the seemingly endless amounts of general knowledge he has, often sharing facts about Astoria’s history to Asimov’s Laws of Robotics to pickling vegetables, specifically carrots, with us during dinner or while scanning for whales on the cliff site. He also named the first whale we saw here this season – Speckles.
Crew Cinco has already been in PO for two weeks now. After having a full team meeting with Leigh in Newport and a GEMM lab summer pizza party, we headed south to begin our 6-week field season. It’s hard to believe that the two training weeks are already over. The team worked hard to figure out the subtleties of the theodolite, observe different gray whales and start to understand their dive and foraging patterns, undertake a kayak paddle & safety course, as well as CPR and First Aid training, learn about data processing and management, and how to use a variety of gizmos to aid us in data collection. But it hasn’t all been work. We enjoyed a day in the Californian Redwoods on one of our day’s off and picked blueberries at the Twin Creek Ranch, stocking our freezer with several bags of juicy berries. We have played ‘Sorry!’ perhaps one too many times already (we are in desperate need of some more boardgames if anyone wants to send some our way to the field station!), and enjoyed many walks and runs on beautiful Battle Rock Beach.

Crew Cinco in awe of the Redwoods 
Crew Cinco’s blueberry harvest 
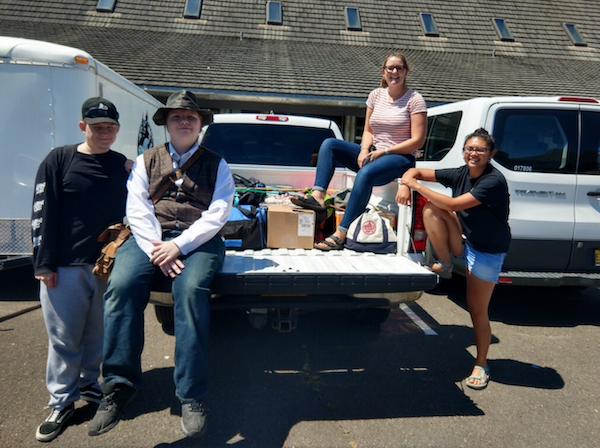
Crew Cinco after their kayak paddle & safety course South Coast Tours
The next four weeks will not be easy – very early mornings, lots of paddling and squinting into the sun, followed by several hours in the lab processing samples and backing up data. But the next four weeks will also be extremely rewarding – learning lots of new skills that will be valuable beyond this 6-week period, revealing ecological trends and relationships, and ultimately (the true reason for why Mia, Anthony, Donovan and myself are more than happy to put in 6 weeks-worth of hard work), the chance to see whales every day up close and personal. Follow Crew Cinco’s journey over the next few weeks as my interns will be posting to the blog for the next three weeks!
References
Sullivan, F.A., & Torres L.G. Assessment of vessel disturbance to gray whales to inform sustainable ecotourism. Journal of Wildlife Management, 2018. 82: 896-905.


