Kelp to whales: New GEMM Lab publication explores indirect effects of a classic trophic cascade on gray whales

By Lisa Hildebrand, PhD candidate, OSU Department of Fisheries, Wildlife, & Conservation Sciences, Geospatial Ecology of Marine Megafauna Lab

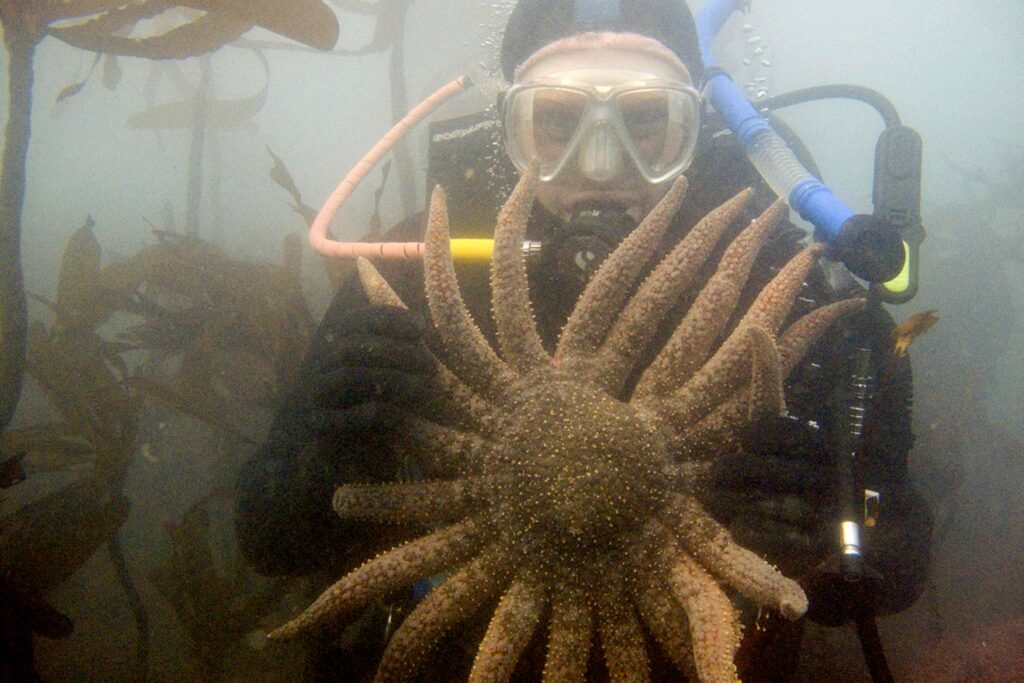
As many of our avid readers already know, the Pacific Coast Feeding Group (PCFG) of gray whales employs a wide range of foraging tactics to feed on a number of different prey items in various benthic substrate types (Torres et al. 2018). One example foraging tactic is when PCFG whales, particularly when they are in the Oregon portion of their feeding range, forage on mysid shrimp in and near kelp beds on rocky reefs. We have countless drone video clips of whales weaving their large bodies through kelp and many photographs of whales coming to the surface to breath completely covered in kelp, looking more like a sea monster than a whale (Figure 1). So, when former intern Dylan Gregory made an astute observation during the 2018 TOPAZ/JASPER field season in Port Orford about a GoPro video the field team collected that showed many urchins voraciously feeding on an unhealthy-looking kelp stalk (Figure 2a), it made us wonder if and how changes to kelp forests may impact gray whales. 
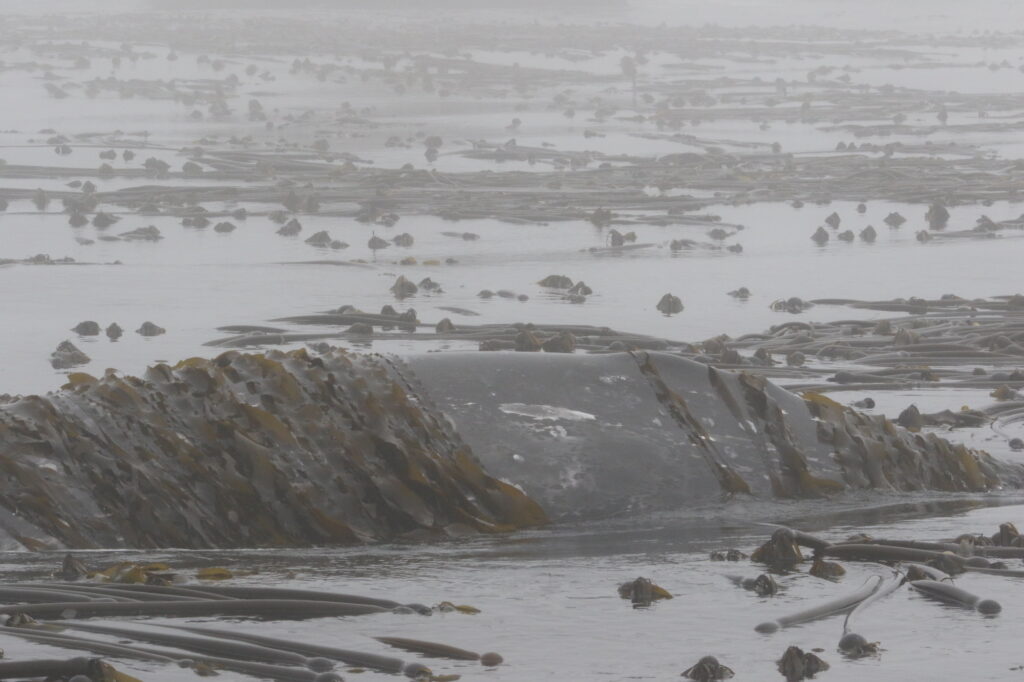
Fig 1. Gray whale surfacing in a large kelp patch. Photograph captured under NOAA/NMFS research permit #16111. Source: GEMM Lab.

Kelp forests are widely used as a marine example of trophic cascades. Trophic cascades are trigged by the addition/removal of a top predator to/from a system, which causes changes further down the trophic chain. Sea urchins are common inhabitants of kelp forests and in a balanced, healthy system, urchin populations are regulated by predators as they behave cryptically by hiding in crevices in the reef and individual urchins feed passively on drift kelp that breaks off from larger plants. When we think about who controls urchins in kelp forests, we probably think of sea otters first. However, sea otters have been absent from Oregon waters for over a century (Kone et al. 2021), so who controls urchins here? The answer is the sunflower sea star (Figure 2b). Sunflower sea stars are large predators with a maximum arm span of up to 1 m! Unfortunately, a disease epidemic that started in 2013 known as sea star wasting disease caused 80-100% population decline of sunflower sea stars along the coastline between Mexico and Alaska (Harvell et al. 2019). Shortly thereafter, a record-breaking marine heatwave caused warm, nutrient-poor water conditions to persist in the northeast Pacific Ocean from 2014 to 2016 (Jacox et al. 2018). These co-occurring stressors caused unprecedented and long-lasting decline of a previously robust kelp forest in northern California (Rogers-Bennett & Catton 2019), where sea otters are also absent. Given the biogeographical similarity between southern Oregon and northern California and the observation made by Dylan in 2018, we decided to undertake an analysis of the eight years of data collected during the TOPAZ/JASPER project in Port Orford starting in 2016, to investigate the trends of four trophic levels (purple sea urchins, bull kelp, zooplankton, and gray whales) across space and time. The results of our study were published last week in Scientific Reports and I am excited to be able to share them with you today.

Every day during the TOPAZ/JASPER field season, two teams head out to collect data. One team is responsible for tracking gray whales from shore using a theodolite, while the other team heads out to sea on a tandem research kayak to collect prey data (Figure 3). The kayak team samples prey in multiple ways, including dropping a GoPro camera at each sampling station. When the project was first developed, the original goal of these GoPro videos was to measure the relative abundance of prey. Since the sampling stations occur on or near reefs that are shallow with dense surface kelp, traditional methods to assess prey density, such as using a boat with an echosounder, are not suitable options. Instead, GEMM Lab PI Leigh Torres, together with the first Master’s student on this project Florence Sullivan, developed a method to score still images extracted from the GoPro videos to estimate relative zooplankton abundance. However, after we saw those images of urchins feeding on kelp in 2018, we decided to develop another protocol that allowed us to use these GoPro videos to also characterize sea urchin coverage and kelp condition. Once we had occurrence values for all four species, we were able to dig into the spatiotemporal trends.

Figure 3. Map of Port Orford, USA study area showing the 10 kayak sampling stations (white circles) within the two study sites (Tichenor Cove and Mill Rocks). The white triangle represents the cliff top location where theodolite tracking of whales was conducted. Figure and caption taken from Hildebrand et al. 2024.

When we examined the trends for each of the four study species across years, we found that purple sea urchin coverage in both of our study sites within Port Orford increased dramatically within our study period (Figure 4). In 2016, the majority of our sampled stations contained no visible urchins. However, by 2020, we detected urchins at every sampling station. For kelp, we saw the reverse trend; in 2016 all sampling stations contained kelp that was healthy or mostly healthy. But by 2019, there were many stations that contained kelp in poor health or where kelp was absent entirely. Zooplankton and gray whales experienced similar temporal trends as the kelp, with their occurrence metrics (abundance and foraging time, respectively) having higher values at the start of our study period and declining steadily during the eight years. While the rise in urchin coverage across our study area occurred concurrently with the decrease in kelp condition, zooplankton abundance, and gray whale foraging, we wanted to explicitly test how these species are related to one another based on prior ecological knowledge.
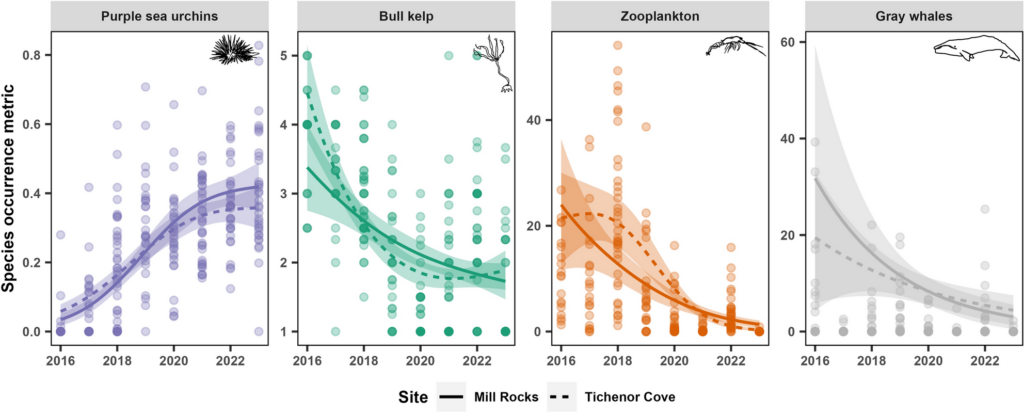
Figure 4. Temporal trends of purple sea urchin coverage, bull kelp condition, relative zooplankton abundance, and gray whale foraging time by year across the eight-year study period (2016–2023), from the generalized additive models. The colored ribbons represent approximate 95% confidence intervals. Line types represent the two study sites, Mill Rocks (MR; solid) and Tichenor Cove (TC; dashed). All curves are statistically significant (P < 0.05). Figure and caption taken from Hildebrand et al. 2024.

To test whether urchin coverage had an effect on kelp condition, we hypothesized that increased urchin coverage would be correlated with reduced kelp condition based on the decades of research that has established a negative relationship between the two when a trophic cascade occurs in kelp forest systems. Next, we wanted to test whether kelp condition had an effect on zooplankton abundance and hypothesized that increased kelp condition would be correlated with increased zooplankton abundance. We based this hypothesis on several pieces of prior knowledge, particularly as they pertain to mysid shrimp: (1) high productivity within kelp beds provides food for mysids, including kelp zoospores (VanMeter & Edwards 2013), (2) current velocities are one third slower inside kelp beds compared to outside (Jackson & Winant 1983), which might support the retention of mysids within kelp beds since they are not strong swimmers, and (3) the kelp canopy may serve as potential protection for mysids from predators (Coyer 1984). Finally, we wanted to test whether both kelp condition and zooplankton abundance have an effect on gray whales and we hypothesized that increased values for both would be correlated with increased gray whale foraging time. While the reasoning behind our hypothesized correlation between zooplankton prey and gray whales is obvious (whales eat zooplankton), the reasoning behind the kelp-whale connection may not be. We speculated that since kelp habitat may aggregate or retain zooplankton prey, gray whales may use kelp as an environmental cue to find prey patches. 

When we tested our hypotheses through generalized additive models, we found that increased urchin coverage was significantly correlated with decreased kelp condition in both study sites, providing evidence that a shift from a kelp forest to an urchin barren may have occurred in the Port Orford area. Additionally, increased kelp condition was correlated with increased zooplankton abundance, supporting our hypothesis that kelp forests are an important habitat and resource for nearshore zooplankton prey. Interestingly, this relationship was bell-shaped in one of our two study sites, suggesting that there are other factors besides healthy bull kelp that influence zooplankton abundance, which likely include upwelling dynamics, habitat structure, and local oceanographic characteristics. For the whale model, we found that increased kelp condition was significantly correlated with increased gray whale foraging time, which may corroborate our hypothesis that gray whales use kelp as an environmental cue to locate prey. Zooplankton abundance was significantly correlated with gray whale foraging time in one of our two sites. Once again, this relationship was bell-shaped, which suggests other factors influence gray whale foraging time, including prey quality (Hildebrand et al. 2022) and density.
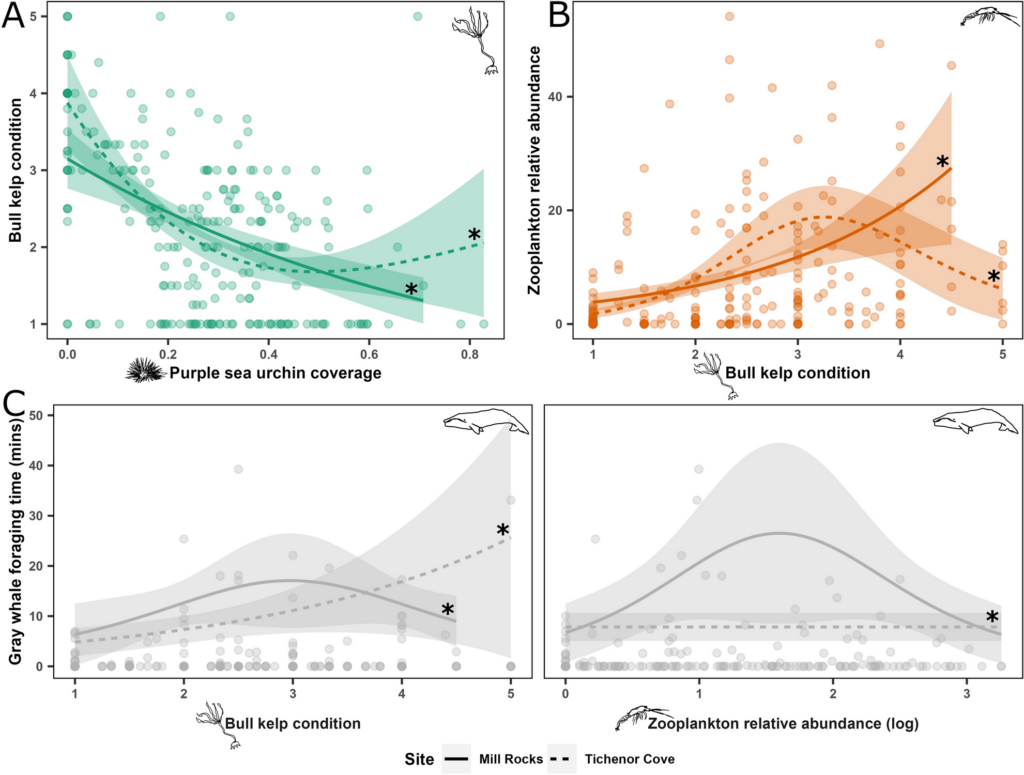
Figure 5. Effects derived from trophic path generalized additive models of purple sea urchin coverage on kelp condition (A), kelp condition on relative zooplankton abundance (B), and kelp condition and relative zooplankton abundance on gray whale foraging time (C). The colored ribbons represent approximate 95% confidence intervals. Line types represent the two study sites, Mill Rocks (MR; solid) and Tichenor Cove (TC; dashed). Curves with asterisks indicate statistically significant (P < 0.05) relationships. Figure and caption taken from Hildebrand et al. 2024.

Our results highlight the potential larger impacts of reduced gray whale foraging time as a result of these trophic dynamics may cause at the individual and population level. If an area that was once a reliable source of food (like Port Orford) is no longer favorable, then whales likely search for other areas in which to feed. However, if the areas affected by these dynamics are widespread, then individuals may spend more time searching for, and less time consuming, prey, which could have energetic consequences. While our study took place in a relatively small spatial area, the trophic dynamics we documented in our system may be representative of patterns across the PCFG range, given ecological and topographic similarities in habitat use patterns. In fact, in the years with the lowest kelp, zooplankton, and whale occurrence (2020 and 2021) in Port Orford, the GRANITE field team also noted low whale numbers and minimal surface kelp extent in the central Oregon field site off of Newport. However, ecosystems are resilient. We are hopeful that the dynamics we documented in Port Orford are just short-term changes and that the system will return to its former balanced state with less urchins, more healthy bull kelp, zooplankton, and lots of feeding gray whales.

If you are interested in getting a more detailed picture of our methods and analysis, you can read our open access paper here: https://www.nature.com/articles/s41598-024-59964-x

Did you enjoy this blog? Want to learn more about marine life, research, and conservation? Subscribe to our blog and get a weekly message when we post a new blog. Just add your name and email into the subscribe box below.

Loading

References

Coyer, J. A. (1984). The invertebrate assemblage associated with the giant kelp, Macrocystis pyrifera, at Santa Catalina Island, California: a general description with emphasis on amphipods, copepods, mysids, and shrimps. Fishery Bulletin, 82(1), 55-66.

Harvell, C. D., Montecino-Latorre, D., Caldwell, J. M., Burt, J. M., Bosley, K., Keller, A., … & Gaydos, J. K. (2019). Disease epidemic and a marine heat wave are associated with the continental-scale collapse of a pivotal predator (Pycnopodia helianthoides). Science advances, 5(1), eaau7042.

Hildebrand, L., Sullivan, F. A., Orben, R. A., Derville, S., & Torres, L. G. (2022). Trade-offs in prey quantity and quality in gray whale foraging. Marine Ecology Progress Series, 695, 189-201.

Jackson, G. A., & Winant, C. D. (1983). Effect of a kelp forest on coastal currents. Continental Shelf Research, 2(1), 75-80.

Jacox, M. G., Alexander, M. A., Mantua, N. J., Scott, J. D., Hervieux, G., Webb, R. S., & Werner, F. E. (2018). Forcing of multi-year extreme ocean temperatures that impacted California Current living marine resources in 2016. Bull. Amer. Meteor. Soc, 99(1).

Kone, D. V., Tinker, M. T., & Torres, L. G. (2021). Informing sea otter reintroduction through habitat and human interaction assessment. Endangered Species Research, 44, 159-176.

Rogers-Bennett, L., & Catton, C. A. (2019). Marine heat wave and multiple stressors tip bull kelp forest to sea urchin barrens. Scientific reports, 9(1), 15050.

Torres, L. G., Nieukirk, S. L., Lemos, L., & Chandler, T. E. (2018). Drone up! Quantifying whale behavior from a new perspective improves observational capacity. Frontiers in Marine Science, 5, 319.

VanMeter, K., & Edwards, M. S. (2013). The effects of mysid grazing on kelp zoospore survival and settlement. Journal of Phycology, 49(5), 896-901.

Lingering questions on the potential to bring sea otters back to Oregon

By Dominique Kone, Masters Student in Marine Resource Management

By now, I’m sure you’re aware of recent interests to reintroduce sea otters to Oregon. To inform this effort, my research focuses on predicting suitable sea otter habitat and investigating the potential ecological effects if sea otters are reintroduced in the future. This information will help managers gain a better understanding of the potential for sea otters to reestablish in Oregon, as well as how Oregon’s ecosystems may change via top-down processes. These analyses will address some sources of uncertainties of this effort, but there are still many more questions researchers could address to further guide this process. Here, I note some lingering questions I’ve come across in the course of conducting my research. This is not a complete list of all questions that could or should be investigated, but they represent some of the most interesting questions I have and others have in Oregon.

Credit: Todd Mcleish

The questions, and our associated knowledge on each of these topics:

Is there enough available prey to support a robust sea otter population in Oregon?

Sea otters require approximately 30% of their own body weight in food every day (Costa 1978, Reidman & Estes 1990). With a large appetite, they not only need to spend most of their time foraging, but require a steady supply of prey to survive. For predators, we assume the presence of suitable habitat is a reliable proxy for prey availability (Redfern et al. 2006). Whereby, quality habitat should supply enough prey to sustain predators at higher trophic levels.

In making these habitat predictions for sea otters, we must also recognize the potential limitations of this “habitat equals prey” paradigm, in that there may be parcels of habitat where prey is unavailable or inaccessible. In Oregon, there could be unknown processes unique to our nearshore ecosystems that would support less prey for sea otters. This possibility highlights the importance of not only understanding how much suitable habitat is available for foraging sea otters, but also how much prey is available in these habitats to sustain a viable otter population in the future. Supplementing these habitat predictions with fishery-independent prey surveys is one way to address this question.

Credit: Suzi Eszterhas via Smithsonian Magazine

How will Oregon’s oceanographic seasonality alter or impact habitat suitability?

Sea otters along the California coast exist in an environment with persistent Giant kelp beds, moderate to low wave intensity, and year-round upwelling regimes. These environmental variables and habitat factors create productive ecosystems that provide quality sea otter habitat and a steady supply of prey; thus, supporting high densities of sea otters. This environment contrasts with the Oregon coast, which is characterized by seasonal changes in bull kelp and wave intensity. Summer months have dense kelp beds, calm surf, and strong upwellings. While winter months have little to no kelp, weak upwellings, and intense wave climates. These seasonal variations raise the question as to how these temporal fluctuations in available habitat could impact the number of sea otters able to survive in Oregon.

In Washington – an environment like Oregon – sea otters exhibit seasonal distribution patterns in response to intensifying wave climates. During calm summer months, sea otters primarily forage along the outer coast, but move into more protected areas, such as the Strait of Juan de Fuca, during winter months (Laidre et al. 2009). If sea otters were reintroduced to Oregon, we may very well observe similar seasonal movement patterns (e.g. dispersal into estuaries), but the degree to which this seasonal redistribution and reduction in foraging habitat could impact sea otter reestablishment and recovery is currently unknown.

Credit: Oregon Coast Aquarium

In the event of a reintroduction, do northern or southern sea otters have a greater capacity to adapt to Oregon environments?

In the early 1970’s, Oregon’s first sea otter translocation effort failed (Jameson et al. 1982). Since then, hypotheses on the potential ecological differences between northern and southern sea otters have been proposed as potential factors of the failed effort, potentially due to different abilities to exploit specific prey species. Studies have demonstrated that northern and southern sea otters have slight morphological differences – northern otters having larger skulls and teeth than southern otters (Wilson et al. 1991). This finding has created the hypothesis that the northern otter’s larger skull and teeth allow it to consume prey with denser exoskeletons, and thereby can exploit a greater diversity of prey species. However, there appears to be a lack of evidence to suggest larger skulls and teeth translate to greater bite force. Based on morphology alone, either sub-species could be just as successful in exploiting different prey species.

A different direction to address questions around adaptability is to look at similarities in habitat and oceanographic characteristics. Sea otters exist along a gradient of habitat types (e.g. kelp forests, estuaries, soft-sediment environments) and oceanographic conditions (e.g. warm-temperature to cooler sub-Arctic waters) (Laidre et al. 2009, Lafferty et al. 2014). Yet, we currently don’t know how well or quickly otters can adapt when they expand into new habitats that differ from ones they are familiar with. Sea otters must be efficient foragers and need to acquire skills that allow them to effectively hunt specific prey species (Estes et al. 2003). Hypothetically, if we take sea otters from rocky environments where they’ve developed foraging skills to hunt sea urchins and abalones, and place them in a soft-sediment environment, how quickly would they develop new foraging skills to exploit soft-sediment prey species? Would they adapt quickly enough to meet their daily prey requirements?

Credit: Eric Risberg/Associated Press via The Columbian

In Oregon, specifically, how might climate change impact sea otters, and how might sea otters mediate climate impacts?

Climate change has been shown to directly impact many species via changes in temperature (Chen et al. 2011). Some species have specific thermal tolerances, in which they can only survive within a specified temperature range (i.e. maximum and minimum). Once the temperature moves out of that range, the species can either move with those shifting water masses, behaviorally adapt or perish (Sunday et al. 2012). It’s unclear if and how changing temperatures will impact sea otters, directly. However, sea otters could still be indirectly affected via impacts to their prey. If prey species in sea otter habitat decline due to changing temperatures, this would reduce available food for otters. Ocean acidification (OA) is another climate-induced process that could indirectly impact sea otters. By creating chemical conditions that make it difficult for species to form shells, OA could decrease the availability of some prey species, as well (Gaylord et al. 2011).

Interestingly, these pathways between sea otters and climate change become more complex when we consider the potentially mediating effects from sea otters. Aquatic plants – such as kelp and seagrass – can reduce the impacts of climate change by absorbing and taking carbon out of the water column (Krause-Jensen & Duarte 2016). This carbon sequestration can then decrease acidic conditions from OA and mediate the negative impacts to shell-forming species. When sea otters catalyze a tropic cascade, in which herbivores are reduced and aquatic plants are restored, they could increase rates of carbon sequestration. While sea otters could be an effective tool against climate impacts, it’s not clear how this predator and catalyst will balance each other out. We first need to investigate the potential magnitude – both temporal and spatial – of these two processes to make any predictions about how sea otters and climate change might interact here in Oregon.

Credit: National Wildlife Federation

In Summary

There are several questions I’ve noted here that warrant further investigation and could be a focus for future research as this potential sea otter reintroduction effort progresses. These are by no means every question that should be addressed, but they do represent topics or themes I have come across several times in my own research or in conversations with other researchers and managers. I think it’s also important to recognize that these questions predominantly relate to the natural sciences and reflect my interest as an ecologist. The number of relevant questions that would inform this effort could grow infinitely large if we expand our disciplines to the social sciences, economics, genetics, so on and so forth. Lastly, these questions highlight the important point that there is still a lot we currently don’t know about (1) the ecology and natural behavior of sea otters, and (2) what a future with sea otters in Oregon might look like. As with any new idea, there will always be more questions than concrete answers, but we – here in the GEMM Lab – are working hard to address the most crucial ones first and provide reliable answers and information wherever we can.

References:

Chen, I., Hill, J. K., Ohlemuller, R., Roy, D. B., and C. D. Thomas. 2011. Rapid range shifts of species associated with high levels of climate warming. Science. 333: 1024-1026.

Costa, D. P. 1978. The ecological energetics, water, and electrolyte balance of the California sea otter (Enhydra lutris). Ph.D. dissertation, University of California, Santa Cruz.

Estes, J. A., Riedman, M. L., Staedler, M. M., Tinker, M. T., and B. E. Lyon. 2003. Individual variation in prey selection by sea otters: patterns, causes and implications. Journal of Animal Ecology. 72: 144-155.

Gaylord et al. 2011. Functional impacts of ocean acidification in an ecologically critical foundation species. Journal of Experimental Biology. 214: 2586-2594.

Jameson, R. J., Kenyon, K. W., Johnson, A. M., and H. M. Wight. 1982. History and status of translocated sea otter populations in North America. Wildlife Society Bulletin. 10(2): 100-107.

Krause-Jensen, D., and C. M. Duarte. 2016. Substantial role of macroalgae in marine carbon sequestration. Nature Geoscience. 9: 737-742.

Lafferty, K. D., and M. T. Tinker. 2014. Sea otters are recolonizing southern California in fits and starts. Ecosphere.5(5).

Laidre, K. L., Jameson, R. J., Gurarie, E., Jeffries, S. J., and H. Allen. 2009. Spatial habitat use patterns of sea otters in coastal Washington. Journal of Marine Mammalogy. 90(4): 906-917.

Redfern et al. 2006. Techniques for cetacean-habitat modeling. Marine Ecology Progress Series. 310: 271-295.

Reidman, M. L. and J. A. Estes. 1990. The sea otter (Enhydra lutris): behavior, ecology, and natural history. United States Department of the Interior, Fish and Wildlife Service, Biological Report. 90: 1-126.

Sunday, J. M., Bates, A. E., and N. K. Dulvy. 2012. Thermal tolerance and the global redistribution of animals. Nature: Climate Change. 2: 686-690.

Wilson, D. E., Bogan, M. A., Brownell, R. L., Burdin, A. M., and M. K. Maminov. 1991. Geographic variation in sea otters, Ehydra lutris. Journal of Mammalogy. 72(1): 22-36.