By Stephanie Loredo, Seabird Oceanography Lab, OSU
Photo credit: Seabird Oceanography Lab
Common murres (Uria aalgee) are the most abundant seabird on the Oregon Coast. At least half of the population in the California Current Ecosystem breeds on the Oregon Coast (half a million seabirds). This makes them ecologically important consumers of forage fish, especially during the breeding season when they use state-waters.
While they spend most of their time at sea, murres must come to shore to breed. During this time, they are highly visible by humans as they breed in large masses on rocky islands. While they are not the most agile on land, due to their short and stubby legs, they are actually amazing divers. Their short flipper-like wings help them swim, and they typically reach depths of 30-60m to catch their prey.
Aside from their underwater aviation skills, they make great parents as well. Both parents will incubate and care for their chick – murres only lay one egg a year – until they fledge; once they leave the rock, male murres take full responsibility for their chicks while the moms go on vacation (they worked hard to lay the egg so they need some time to recuperate). After the breeding season, murres leave the rock in large quantities – this is often the last time humans will see them this year in large aggregations from shore.
Despite their omnipresence and importance as a marine predator in Oregon, there is still a lot we don’t know about murres. Where do murres go when they are not breeding? Do they migrate? Where do they feed during the breeding and non-breeding period? What habitat characteristics are associated with feeding areas? By answering these questions, we increase knowledge of murre ecology in Oregon. Moreover, a more comprehensive understanding of the year-round movements of murres aids marine spatial planners take more informed actions on the current decisions regarding offshore renewable energy development. This is what I hope to achieve through my Masters research project at OSU.
Most of what is known about the offshore distribution of murres in Oregon comes from vessel observations. However, vessel data only provide snapshots in time, and not a continuous picture of area-use. Within the Seabird Oceanography Lab (SOL), we are using individual satellite tracking devices to follow the movements of murres associated with the Yaquina Head colony, which is a prominent breeding colony in Oregon located near Newport.
A common murre displaying a satellite tag prior to release.
SOL was able to track 15 common murres associated with the Yaquina Head colony in 2015 and 2016. These tags were deployed periodically throughout the breeding period and have been successful in tracking birds for up to three months. Thus far, we have tracking data ranging from May to December (only one bird tracked during December).
Tracking data from 2015 and 2016 of murres off the Yaquina Head colony provide an interesting comparison. In both years, murres experienced warmer ocean conditions, high Bald eagle disturbance rates, and consequently high Western gull egg predation at the colony. Some data also indicate low prey availability. The combination of all these factors is most likely the reason for the observed reproductive failure at the colony in both years. Tracking data showed that 13 of the 15 birds tagged dispersed from the colony earlier than expected. The maps below summarize the dispersal of birds by year and by time of deployment.
Each map (Left: 2015, Right: 2016) illustrates all birds that dispersed from the colony and did not engage in central-place foraging (feeding trips to and from the colony). Sample size: n2015=7, n2016_spring=1, n2016_summer=3.
Most birds made a northward movement and traveled as far north as British Columbia, Canada. Along their movement north, they used inlets and bays, but one of the most prominent areas used was the Columbia River plume. Birds used the Columbia River mouth area during the summer and fall, with the most time spent there during the summer. Dispersal from the colony was not what we expected; we expected individuals to breed on colony and engage in central-place foraging (feeding to and from the breeding site) nearshore until mid-August when they usually leave the rock. However, we are still interested in the habitat characteristics of feeding areas and the conditions that led to movement from one feeding area to the next.
Prior to examining habitat associations of murre feeding areas, we must first determine their behavior state at each point location derived from the satellite tags. After data cleaning and filtering out erroneous locations, we applied a behavioral analysis (Residence in Space and Time method) to determine behaviors associated with each point location. This analysis has allowed us to distinguish between intensive foraging, transiting, and extensive foraging. Extensive foraging locations can be interpreted as a set of locations that are mostly spread out in space, where murres searched for prey. On the other hand, intensive foraging locations can be interpreted as a set of locations that are very close together in space where murres likely found prey, and thus spent more time.
We are finalizing the extraction of environmental data for each point location from satellite data. Once all data are extracted, we can begin analysis for determining what environmental conditions were sought during dispersal and what types of habitats are preferred. Some of the ocean conditions that will be examined are sea surface temperate, wind, upwelling index, and primary net productivity. Some other habitat descriptors we are interested in assessing are substrate, distance to river mouth, salinity, depth, distance to the 200-m isobath, and distance to shore. For now, exploration of data indicates differences in habitat associations by behavior and between seasons.
Sample size means everything in a study like this so I am happy to say that more data is yet to come: SOL plans to deploy 15 more tags during spring and summer of 2017. I am excited to see what the additional tagged murres will do, and whether they will follow a pattern similar to those tracked in 2015 and 2016. However this time around, we will deploy tags as late in the summer/early fall as we can, in hope of acquiring some novel winter data to fill this knowledge gap. If we are successful, we may finally have a better idea of what life is like for common murres during more of the year beyond the rock.
By Florence Sullivan MSc student, Department of Fish and Wildlife.
Another grad student once told me that in order to survive grad school, I would need three things:
(1) an exercise routine, (2) a pet, and (3) a hobby. My Pilates class on Wednesdays is a great mid-week reminder to stretch. I don’t have a pet, so that advice gets fulfilled vicariously through friends. As for my hobby, I think you’ll find that even when scientists take a break from work, we really don’t get that far away from the subject matter…..
Board games have evolved significantly since the early ‘90s when I grew up on such family staples as Monopoly, Risk, Sorry!, Candyland, and Chutes and Ladders, etc. Now, table-top games tend to fall into three loose categories – “Euro-games” that focus on strategy and economic themes as well as keeping all players in the game until the end, “American-style” that tend toward luck and direct player contact so that not everyone plays until the end, and “Party” that are easy to learn and are often played in large groups as social icebreakers or to provide entertainment.
Today, let’s talk about my current favorite – Evolution. It is immediately obvious that the game designers responsible are either giant nerds (I use this in the most loving way possible) or have spent some quality time with ecologists. Not only is the art work beautiful, and the game play smooth, but the underlying mechanics allow serious ecological theories such as ‘predator and prey mediated population cycles’, ‘co-evolution’ and ‘evolutionary arms-races’ to be acted out and easily understood.
Players set up their species (1 green/yellow tile = 1 species) around the watering hole, and contemplate their next moves.
In game play, as in life, the point of the game is to eat – victory is achieved by the player who has managed to ‘digest’ the most food tokens. All players begin with a single species, and with each turn, can either add traits (ie. fat tissue, scavenger, etc.) to the species, increase the body size of a species, gain a population level, or gain additional species. Next, players take food from a limited, random supply until there is no food left. Species that have not been fed to their full capacity (population levels) will starve, and can even become extinct – much like the reality of environmental cycles. Finally, all food that has been ‘eaten’ is digested, and the next round begins.
Since a player can never be sure how much food will appear on the watering hole each turn, it is a good strategy to capitalize on traits like foraging which allows a species to take twice as much food every time it feeds. If your species cooperates with another, that means that it gets to eat every time you feed the first species. A player who combines foraging traits with multiple cooperating species in a “cooperation chain” can quickly empty the watering hole before any other players get a chance. Much like a species perfectly adapted to its niche in the real world will out compete more generalist species.
The pack-hunting carnivore on the left can easily take down the fertile defensive herding species in the upper right. The efficient foraging species in the middle is protected by its horns, and cooperates with the next species to the right. The burrowing species is protected from carnivores only as long as it is full (and presumably no longer needs to venture out of its burrow).
One way to avoid the competition for food at the watering hole is to play the carnivore trait. This species must now consume other species in order to feed itself. A few caveats; a carnivore must be larger in body size than anything it tries to eat, and can no longer eat plant food as it is an obligate carnivore. As soon as a carnivore appears on the board, the evolutionary arms-race begins in earnest! Traits such as burrowing, climbing, hard shells, horns, defensive herding and warning calls become vital to survival. But carnivores can be clever, and apply ambush to species with warning call, or pack-hunting to a species with defensive herding. In everything, there is a certain balance, and quickly, players will find themselves acting out a classic ‘boom and bust population growth cycle’ scenario, where herbivores go extinct due to low food supply at the watering hole and/or high predation pressure, and carnivores soon follow when there are no un-protected species for them to feed upon.
A flying creature must first pay the ‘upkeep cost’ of its body size in food, before it can feed its population. Good thing it has the extra cliff-side food source that is only accessible to other species with wings!
An expansion has been released for the game – it is called Flight – and introduces traits such as flight, camouflage, good eyesight, and others. From an ecologist’s perspective, it fits the original game well both scientifically and thematically. To achieve flight, a higher price must be paid (in terms of cards discarded) to gain the trait card, and unlike other species, an ‘upkeep cost’ must be gathered in food tokens before the species actually eats any food tokens during the round. However, flight also gives access to a cliff-side watering hole that is not accessible to earthbound species. This neatly mirrors the real world where flight is an energetically costly activity that also opens new niches.
The next expansion is just arriving in stores, and I can’t wait to play it! It’s called Climate, and adds traits such as nocturnal, claws, and insectivore. Perhaps more exciting though, are the ‘event cards’ which will trigger things like desertification, cold snaps, heatwaves, volcanic eruptions and meteor strikes. A climate tracker will keep track of whether the planet is in an ice age or a warming period, and certain traits will make your species more or less likely to survive – can you guess which ones might be useful in either scenario? I think it will be enormously fun to play through different climate scenarios and see how traits stack and species interactions evolve. Perhaps this new addition to the game will even cause a new game review in Nature – check out their initial assessment here: http://www.nature.com/nature/journal/v528/n7581/full/528192a.html
Games like evolution are useful thought exercises for students and researchers because they promote discussion of adaptive traits, predator-prey cycles, climate, and ecosystem dynamics as related to our own projects. Watching a story unfold in front of you is a great way to truly understand some of the core principles of ecology (and other subjects). This is especially relevant in the GEMM lab where we continuously ask ourselves why our study species act the way they do? How do they find prey, and how are/will they adapt(ing) to our changing climate?
Our third day aboard the Oceanus began in the misty morning fog before the sun even rose. We took the first CTD cast of the day at 0630am because the physical properties of the water column do not change much with the arrival of daylight. Our ability to visually detect marine mammals, however, is vastly improved with a little sunlight, and we wanted to make the best use of our hours at sea possible.
Randall Munroe www.XKCD.com
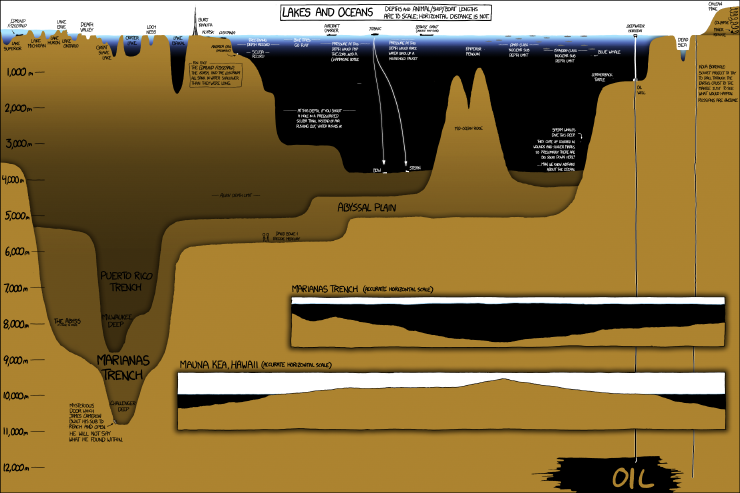
Our focus on day three was the Astoria canyon – a submarine feature just off the Oregon and Washington coast. Our first oceanographic station was 40 miles offshore, and 1300 meters deep, while the second was 20 miles offshore and only 170 meters deep. See the handy infographic below to get a perspective on what those depths mean in the grand scheme of things. From an oceanographic perspective, the neatest finding of the day was our ability to detect the freshwater plume coming from the Columbia River at both those stations despite their distance from each other, and from shore! Water density is one of the key characteristics that oceanographers use to track parcels of water as they travel through the ocean conveyor belt. Certain bodies of water (like the Mediterranean Sea, or the Atlantic or Pacific Oceans) have distinct properties that allow us to recognize them easily. In this case, it was very exciting to “sea” the two-layer system we had gotten used to observing overlain with a freshwater lens of much lower salinity, higher temperature, and lower density. This combination of freshwater, saltwater, and intriguing bathymetric features can lead to interesting foraging opportunities for marine megafauna – so, what did we find out there?
Morning conditions were almost perfect for marine mammal observations – glassy calm with low swell, good, high, cloud cover to minimize glare and allow us to catch the barest hint of a blow….. it should come as no surprise then, that the first sightings of the day were seabirds and tuna!
I didn’t catch any photos of the tuna, so here’s some sunfish we spotted. photo credit: Florence Sullivan
One of the best things about being at sea is the ability to look out at the horizon and have nothing but water staring back at you. It really drives home all the old seafaring superstitions about sailing off the edge of the world. This close to shore, and in such productive waters, it is rare to find yourself truly alone, so when we spot a fishing trawler, there’s already a space to note it in the data log. Ships at sea often have “follower” birds – avians attracted by easy meals as food scraps are dumped overboard. Fishing boats usually attract a lot of birds as fish bycatch and processing leftovers are flushed from the deck. The birders groan, because identification and counts of individuals get more and more complicated as we approach other vessels. The most thrilling bird sighting of the day for me were the flocks of a couple hundred fork-tailed storm petrels.
I find it remarkable that such small birds are capable of spending 80% of their life on the open ocean, returning to land only to mate and raise a chick. Their nesting strategy is pretty fascinating too – in bad foraging years, the chick is capable of surviving for several days without food by going into a state of torpor. (This slows metabolism and reduces growth until an adult returns.)
Just because the bird observers were starting to feel slightly overwhelmed, doesn’t mean that the marine mammal observers stopped their own survey. The effort soon paid off with shouts of “Wait! What are those splashes over there?!” That’s the signal for everyone to get their binoculars up, start counting individuals, and making note of identifying features like color, shape of dorsal fin, and swimming style so that we can make an accurate species ID. The first sighting, though common in the area, was a new species for me – Pacific white sided dolphins!
A Pacific white sided dolphin leaps into view. photo credit: Florence Sullivan. Taken under NMFS permit 16111 John Calambokidis
A pod of thirty or so came to ride our bow wake for a bit, which was a real treat. But wait, it got better! Shortly afterward, we spotted more activity off the starboard bow. It was confusing at first because we could clearly see a lot of splashes indicating many individuals, but no one had glimpsed any fins to help us figure out the species. As the pod got closer, Leigh shouted “Lissodelphis! They’re lissodelphis!” We couldn’t see any dorsal fins, because northern right whale dolphins haven’t got one! Then the fly bridge became absolute madness as we all attempted to count how many individuals were in the pod, as well as take pictures for photo ID. It got even more complicated when some more pacific white sided dolphins showed up to join in the bow-riding fun.
Northern right whale dolphins are hard to spot! photo credit: Florence Sullivan Taken under NMFS permit 16111 John Calambokidis
All told, our best estimates counted about 200 individuals around us in that moment. The dolphins tired of us soon, and things continued to calm down as we moved further away from the fishing vessels. We had a final encounter with an enthusiastic young humpback who was breaching and tail-slapping all over the place before ending our survey and heading towards Astoria to make our dock time.
Humpback whale breach. photo credit: Florence Sullivan. Taken under NMFS permit 16111 John Calambokidis
As a Washington native who has always been interested in a maritime career, I grew up on stories of The Graveyard of the Pacific, and how difficult the crossing of the Columbia River Bar can be. Many harbors have dedicated captains to guide large ships into the port docks. Did you know the same is true of the Columbia River Bar? Conditions change so rapidly here, the shifting sands of the river mouth make it necessary for large ships to receive a local guest pilot (often via helicopter) to guide them across. The National Motor Lifeboat School trains its students at the mouth of the river because it provides some of “the harshest maritime weather conditions in the world”. Suffice it to say, not only was I thrilled to be able to detect the Columbia River plume in our CTD profile, I was also supremely excited to finally sail across the bar. While a tiny part of me had hoped for a slightly more arduous crossing (to live up to all the stories you know), I am happy to report that we had glorious, calm, sunny conditions, which allowed us all to thoroughly enjoy the view from the fly bridge.
Cape Disappointment Lighthouse at the Columbia River Bar.
Finally, we arrived in Astoria, loaded all our gear into the ship’s RHIB (Ridged Hulled Inflatable Boat), lowered it into the river, descended the rope ladder, got settled, and motored into port. We waved goodbye to the R/V Oceanus, and hope to conduct another STEM cruise aboard her again soon.
Now if the ground would stop rolling, that would be just swell.
Last but not least, here are the videos we promised you in Oceanus Day Two – the first video shows the humpback lunge feeding behavior, while the second shows tail slapping. Follow our youtube channel for more cool videos!
The GEMM lab is adventuring out into the wild blue yonder of open ocean sampling and educational outreach! Leigh is the chief scientist onboard the R/V Oceanus for the next two days as we sail through Oregon waters in search of marine megafauna. Also onboard are four local teachers and five high school students who are learning the tricks of the trade. Amanda and I are here to help teach basic oceanography and distance sampling techniques to our enthusiastic students.
Science Party musters in the dry lab for safety debrief. photo credit: Florence Sullivan
We started the morning with safety briefings, and headed out through the Newport breakwater, direction: Stonewall Bank. Stonewall is a local bathymetric feature where upwelling often occurs, leading to a productive ecosystem for both predators and prey. Even though our main sampling effort will be offshore this trip, we didn’t even make out of the harbor before recording our first gray whale and California sea lion sightings.
California Sea Lions on the Newport buoy. Taken under NMFS permit 16111 John Calambokidis
Our students (and their teachers) are eager and quick to catch on as we teach them new methodologies. Amanda and I had prepared presentations about basic oceanographic and distance sampling methods, but really the best way to learn is to jump in and go. We’ve set up a rotation schedule, and everyone is taking turns scanning the ocean for critters, deploying and recovering the CTD, logging data, and catching plankton.
A small pod of Orca. Photo credit: Florence Sullivan. Taken under NMFS permit 16111 John Calambokidis
So far, we have spotted gray whales, sea lions, a pod of (lightning speed) killer whales, lots of seagulls, northern fulmars, sooty shearwaters, storm petrels, and cormorants, but today’s highlight has to the last sighting of ~42 humpback whales. We found them at the Northern edge of Heceta Bank – a large rocky reef which provides structural habitat for a wide variety of marine species. As we approached the area, we spotted one whale, and then another. At first, our spotters had no trouble inputting the data, getting photo-ID shots, and distinguishing one whale from the next, but as we continued, we were soon overwhelmed. With whale blows surrounding us on all sides, it was hard to know where to look first – here a surface lunge, there, a breach, a spout, a fluke, a flipper slap! The surface activity was so dense and enthralling, it took a few moments before realizing there were some sea lions in the feeding frenzy too!
Five humpback whales surface at once. photo credit: Leigh Torres. Taken under NMFS permit 16111 John Calambokidis
We observed the group, and tried to document as many individuals as possible as the sunset faded into night. When poor visibility put a stop to the visuals, we hurried to do a plankton tow and CTD cast to find some environmental insights for such a gathering. The CTD revealed a stratified water column, with two distinct layers, and the plankton tow brought up lots of diatoms and krill. As one of the goals of this cruise is to explore how marine mammals vary with ocean gradients, this is a pretty cool way to start.
A humpback whale lunge feeds. Photo credit: Leigh Torres. Taken under NMFS permit 16111 John Calambokidis
A long day observing has left us all exhausted, but not too tired to share our excitement. Stay tuned for more updates from the briny blue!
Follow this link for real time view of our beautiful ship! : http://webcam.oregonstate.edu/oceanus
Humpback flukes for photo ID. photo credit: Leigh Torres. Taken under NMFS permit 16111 John Calambokidis
By: Cathryn Wood, Lawrence University ’17, summer REU in the GEMM Lab
Greetings from Port Orford! My name is Cathryn, and I am the fourth member of the GEMM Lab’s gray whale foraging ecology research team, which includes Florence, Kelli, and the other Catherine (don’t worry, I go by Cat). Nearly 5 weeks into field season, I am still completely amazed with my first West Coast experience and doing what I’ve always dreamt of: studying marine mammals. Coming from Michigan’s Upper Peninsula, this may seem slightly out of place, but my mom can attest; she read “Baby Beluga” to me every night when I was a toddler. Now a rising senior majoring in biology at Lawrence University, I’ve been focusing my coursework on aquatic and marine ecology to prepare for graduate school where I plan to specialize in marine science. Being part of this research is a very significant step for me into the field.
So how did I end up here, as part of this amazing project and dream, women-in-science team? I am interning through OSU’s Ocean Sciences REU program at the Hatfield Marine Science Center, where the GEMM Lab is located. REU stands for “Research Experience for Undergraduates”, and is an NSF-funded research internship program found in numerous universities around the country. These internships allow undergrads to conduct independent research projects under the guidance of a faculty mentor at the program’s institution. I applied to several REUs this past winter, and was one of 12 undergrads accepted for the program at HMSC. Each of us is paired with different faculty members to work on various projects that cover a diverse range of topics in the marine sciences; everything from estuarine ecology, to bioacoustics. I was ecstatic to learn that I had been paired with Dr. Torres as my faculty mentor to work on Florence’s gray whale project, which had been my first choice during the application process.
My particular research this summer is going to complement Florence’s master’s thesis work by asking new questions regarding the foraging data. While her project focuses on the behavioral states of foraging whales, I will be looking at the whale tracks to see if there are patterns in their foraging behavior found at the individual level. Traditionally, ecological studies have accepted classical niche theory, treating all individuals within a population as ecological equivalents with the same niche width. Any variances present among individuals are often disregarded as having an insignificant consequence on the population dynamics as a whole, but this simplification can overlook the true complexity of that population . The presence of niche variation among conspecifics is known to occur in at least 93 species across a diverse array of taxa, so the concept of individual specialization, and how it can affect ecological processes is gaining recognition progressively in the field (Bolnick et al., 2003). My goal is to determine whether or not the gray whales in this study, and presumably others in the Pacific Coast Feeding Group (PCFG), exhibit individual specialization in their foraging strategies . There are many ways in which individuals can specialize in foraging, but I will be specifically determining if fine scale spatial patterns in the location of foraging bouts exists, regardless of time.
To address my question, I am using the whale tracking data from both 2015 and 2016, and learning to use some very important software in the spatial ecology world along the way through a method that Dr. Torres introduced to me. Starting in ArcGIS, I generate a kernel density layer of a raw track (Fig. 1 ), which describes the relative distribution of where the tracked whale spent time (Fig. 2 ). Next, using the isopleth function in the software Geospatial Modelling Environment, I generate a 50% density contour line that distinguishes where the whale spent at least 50% of its time during the track (Fig. 3 ). Under the assumption that foraging took place in these high density areas, we use these 50% contour lines to describe foraging bout locations. I now go back to ArcGIS to make centroids within each 50% line, which mark the exact foraging bout locations (Fig. 4 ).
Fig. 1 Raw individual whale track.Fig. 2 Kernel Density map of whale track.Fig. 3 50% isopleth contours of locations with highest foraging densitiesFig. 4 Final centroids to signify foraging bouts
These centroids will be determined for every track by an individual whale, and then compared relative to foraging locations of all tracked whales to determine if the individual is foraging in different locations than the population. Then, the tracks of individuals who repeatedly visit the site at least three times will be compared with one another to determine if the repeat whales show spatial and/or temporal patterns in their foraging bout locations, and if specialization at a fine scale is occurring in this population. If you did not quite follow all those methods, no worries, it was a lot for me to take in at first too. I’ve finally gotten the hang of it though, and am grateful to now have these skills going into grad school.
Because I am interested in behavioral ecology and the concept of individuality in animal populations, I am extremely excited to see how this research plays out. Results could be very eye-opening into the fine scale foraging specialization of the PCFG sub-population because they already demonstrate diet specialization on mysid (as opposed to their counterparts in the Bering Sea who feed on benthic organisms) and large scale individual residency patterns along the Pacific Northwest (Newell, 2009; Calambokidis et al., 2012). Most significantly, understanding how individuals vary in their feeding strategies could have very important implications for future conservation measures for the whales, especially during this crucial foraging season where they replenish their energy reserves. Management efforts geared for an “average population” of gray whales could ultimately be ineffective if in fact individuals vary from one another in their foraging strategies. Taking into account the ways in which variation occurs amongst individuals is therefore crucial knowledge for successful conservation approaches.
My project is unique from those of the other REUs because I am simultaneously in the midst of assisting in field season number two of Florence’s project. While most of the other interns are back at Hatfield spending their days in the lab and doing data analyses like a 9-5 job, I am with the team down in Port Orford for field season. This means we’re out doing research every dawn as weather allows. Though I may never have an early bird bone in my body, the sleepy mornings are totally worth it because ecology field work is my favorite part of research. To read more about our methods in the field, check out Florence’s post.
Since Catherine’s last update, we’ve had an eventful week. To our dismay, Downrigger Debacle 2.0 occurred. (To read about the first one, see Kelli’s post). This time it was not the line – our new line has been great. It was a little wire that connected the downrigger line to the pipe that the GoPro and TDR are connected to. It somehow snapped due to what I presume was stress from the currents. Again, it was Catherine and I in the kayak, with a very successful morning on the water coming to a close when it happened. Again, I was in the bow, and she was in the stern deploying the equipment – very déjà vu. When she reeled in an equipment-less line, we at first didn’t know how to break it to Florence and Kelli who were up on the cliff that day. Eventually, Catherine radioed “Brace yourselves…” and we told them the bad news. Once again, they both were very level-headed, methodical, and un-blaming in the moments to follow. We put together the same rescue dive team as last time, and less than a week later, they set off on the mission using the GPS coordinates I had marked while in the kayak. Apparently, between the dredging taking place in the harbor and the phytoplankton bloom, visibility was only about 2 feet during the dive, but they still recovered the equipment, with nothing but baked goods and profuse thanks as payment. We are very grateful for another successful recovery, and are confident that our new attachment mechanism for the downrigger will not require a third rescue mission (Fig. 6-8). Losing the equipment twice now has taught us some very important things about field work. For one, no matter how sound you assume your equipment to be, it is necessary to inspect it for weak points frequently – especially when salt water and currents are in the picture. Perhaps even more importantly, we’ve gotten to practice our problem solving skills and see firsthand how necessary it is to act efficiently and calmly when something goes wrong. In ecological field research you have to be prepared for anything.
Fig. 5 Original setup of GoPro and TDR.Fig. 6 Photo taken after the wire that connected the pole to the downrigger line snapped.Fig. 7 New mechanism for attaching the pole to the downrigger line.Fig. 8 Equipment rescue team: Aaron Galloway and Taylor Eaton diving, Greg Ryder operating the boat, and Florence on board to direct the GPS location of where the equipment was lost.
In other news, unlike our slow-whale days during the first two weeks of the project, we have recently had whales to track nearly every day from the cliff! In fact, the same, small, most likely juvenile, whale pictured in Catherine’s last post has returned several times, and we’ve nicknamed her “Buttons” due to two distinguishing white spots on her tail peduncle near the fluke. Though we tend to refer to Buttons as “her”, we cannot actually tell what the sex is definitively…until now. Remember in Catherine’s post when she described how Buttons defecated a lot, and how our team if, given the opportunity, is supposed to collect the feces when we’re out in the kayak for Leila’s project? Everything from hormone levels to reproductive status to, yes, sex, is held in that poop! Well, Miss (or Mr.) Buttons was in Tichenor Cove today, and to our delight, she performed well in the defecation department once again. Florence and I were on cliff duty tracking her and Kelli and Catherine were in Tichenor on the kayak when we first noticed the defecation. I then radioed down to the kayak team to stop what they were doing and paddle quickly to go collect it before it sank (Fig. 9). Even in these situations, it is important to stay beyond 100 yards of the animal, as required by the MMPA. Florence and I cheered them on and our ladies did indeed get the poop sample, without disturbing the whale (Fig. 10). It was a sight to behold.
Fig. 9 Kelli and Catherine on a mission.Fig. 10 Kelli and Catherine collecting the feces.
We were able to track Buttons for the remainder of our time on the cliff, and were extremely content with the day’s work as we packed all the gear up later in the afternoon. Right before we were about to leave, however, Buttons had one more big treat for us. As we looked to the harbor before starting the trek back to the truck, we paused briefly after noticing a large, white splash in the middle of the harbor, not far from the dock. We paused for a second and thought “No, it can’t be, was that —?” and then we see it again and unanimously yelled “BREACH!” Buttons breached about five times on her way back to Tichenor Cove from where she had been foraging in Mill Rocks. It is rare to see a gray whale breach, so this was really special. Florence managed to capture one of the breaches on video:
At first I thought a big ole humpback had arrived, but nope, it was our Buttons! I am in awe of this little whale, and am forever-grateful to be in the presence of these kinds of moments. She’s definitely made her splash here in Port Orford. I think our team has started to as well.
Bolnick, D. I., Svanback, R., Fordyce, J. A., Yang, L. H., Davis, J. M., Hulsey, C. D., & Forrister, M. L. (2003). Ecology of Individuals: Incidence and Implications of Individual Specialization. The American Naturalist, 161(1), 28.
Calambokidis, J., Laake, J. L., & Klimek, A. (2012). Updated analysis of abundance and population structure of seasonal gray whales in the Pacific Northwest, 1998-2010 (Vol. 2010).
Newell, C. (2009). Ecological Interrelationships Between Summer Resident Gray Whales (Eschrichtius robustus) and Their Prey, Mysid Shrimp (Holmesimysis sculpta and Neomysis rayi) along the Central Oregon Coast.
By: Catherine Lo, Research Intern, Oregon State University ‘16
Hello everyone! My name is Catherine Lo and I am a recent graduate from Oregon State University with a Bachelor’s of Science in Biology with a focus in Marine Biology. It has been an incredible whirlwind leading up to this point: long nights studying for finals, completing my degree, and planning the next steps for my future. I am fortunate to be working as a summer research intern for the GEMM Lab under the supervision of Dr. Leigh Torres and Msc. student Florence Sullivan in their research on the foraging ecology of gray whales. I have dreamed of working with marine mammals, potentially as a research veterinarian and so, capturing this position has been a great opportunity to begin my career.
The days go slow, but the weeks go fast. It’s already week 4 of our field season and the team and I are definitely in the groove of our research. The alarm(s) goes off at 5:00 AM…okay maybe closer to 5:30 AM (oops!), getting dressed for either the kayak or cliff based work, scarfing down breakfast that is usually a diet consisting of toast and peanut butter, and then heading off to the beach to launch the kayak. But this week it was different. A dredging event in Port Orford coordinated by the US Army Corps of Engineers is now taking place right next to the port’s jetty near our study site (Figure 1). This is an important process to move the sediment built up during the year in order for ships to safely navigate in and out of the port. We knew this was going to happen at some point over the summer, and worried that it might impact our research methods and objectives, but at the same time it offers some new opportunities: the chance to see how our GoPro and mysid sampling methods in Tichenor Cove are impacted by the sediment flow from the dredging activities.
Figure 1. View of the dredger from the cliff field site in Port Orford.
My teammate Kelli and I were stationed on the cliff during the first deposit of sediment after the dredge’s first night and morning’s worth of scooping sand. None of us knew where the actual deposit site would be so we kept a good eye on it. The ship headed past the jetty. Turned around and, as a concerned feeling mustered within our field team, it began lowering the platform holding the sand just 250 yards away from our primary study site in Tichenor Cove! At this point, we knew things were going to be different in our samples. Unfortunately along with the sediment stirring up from dredging, we think a phytoplankton bloom is occurring simultaneously. Our GoPro footage lately has been rather clouded making it difficult to identify any mysid relative to our past footage. You can compare Figure 2 to the GoPro image found in Figure 2 of a previous post. It is times like these that we learn how dynamic the ocean is, how human activity can alter the ocean ecosystem, and how to adapt to changes, whether these adaptations are within our reach or not. We are interested to see how our sample sites will change again over time as the dredging operation finishes and the phytoplankton bloom ends.
Figure 2. This GoPro image taken in Tichenor Cove illustrates exactly how murky our view of the water column is with the sediment dredging operation in close proximity.
Aside from the current water clarity situation, we’ve also had some exciting moments! Given how few whales we’ve seen thus far and how the ones we have tracked are predominately hanging by Mill Rocks, which is ~1km east of Tichenor Cove, Dr. Leigh Torres—our head advisor—thought it would be a good idea to check out the mysid scene over there to see what the attraction was. So, we sent our kayak team over there to conduct a few GoPro drops and zooplankton net tows and figure out what is so enticing for the whales.
While conducting this sampling work at Mill Rocks, I and my teammate were lucky enough to encounter a gray whale foraging. And believe me, we were going “off-the-walls” as soon as we heard from the cliff team and saw a blow as the whale surfaced nearby. It was one of those “best time of my life” moments where my dreams of kayaking this close to a whale came true. We fumbled around for our waterproof camera to get clear shots of its lateral flanks for photo identification while also trying to contain our excitement to a more decent level, and at the same time we had to make sure we were not in the whale’s path. There it was; surface after surface, we admired the immense size and beauty of a wild animal before our eyes. The worst part of it was when our camera battery died not long after taking a few pictures, but in a way it gave us a chance to really appreciate the existence of these animals. Note to self during research: always check your batteries are fully charged before heading out!
It baffles me how so often people walk along beaches or drive by without knowing an animal as incredible as this whale is just outside of the shoreline. Every time I’m inside pulling out time stamps or doing photo identification, I always think, “I wonder if there’s a whale in Tichenor Cove or at Mill Rocks right now…Yeah, there probably is one”. Alas, the data management work needs to be done and there’s always the next day for an opportunity of a sighting.
For a few days, our kayak team wasn’t able to work due to a small craft advisory. If you’ve ever been to Port Orford, you’d understand the severity of how windy it gets here. Ranging between 15 knots to 25 knots as early as 7am, so it gets rather difficult to maintain position at each of our sampling stations in our kayak. Fortunately our cliff team was able to set out. We were lucky to see a small whale foraging inside Tichenor Cove and later move onto Mill Rocks. This little one was giving us quite a show! Almost every time it came to the surface, defecation was observed shortly after. As unpleasant as feces might be, it can actually provide an abundance of information about a specific whale including sex, reproductive status, hormone levels, and much more. While doing our research, we are always keeping an eye out for signs of defecation in order to collect samples for another lab member’s PhD work. Here you can check out more information about Leila’s research. Figure 3 depicts a great image of defecation captured by our cliff team.
Figure 3. Gray whale defecating as it dives into the water in Tichenor Cove.Figure 4. Gray whale swimming in Tichenor Cove taken by fellow intern Cathryn Wood.
In addition to helping out Leila’s work, we recently began a collaboration with Aaron Galloway from The Oregon Institute of Marine Biology (OIMB). Aaron and his post-doc are looking at the fatty acid composition of mysid as an approach to eventually infer the diet of an aquatic animal. Check out his website which is linked to his name to learn more about the basis of his approach! While we collect mysid samples for them, in return they give us substantial information about the energy content of the mysid. This information on the energetic content of mysid will help the GEMM Lab answer questions about how much mysid gray whales need to eat.
Oregon State University and University of Oregon have a long-standing, intense rivalry. However, as an Alumna from Oregon State, I am amazed and thrilled to see how these two institutions can come together and collaborate. I mean, we’re all here for the same thing. Science, right? It creates the opportunity to apply integrative research by taking advantage of various expertise and resources. If we have those chances to reach out to others, why not make the most of it? In the end, sound science is what really matters, not rooting for the ducks or beavers.
My marine science background is based on my experiences looking at tidepools and hopping around on rocks to understand how vast intertidal communities range from invertebrates to algae. These experiences were an incredible part of my life, but now I look at the ocean unsure of what animals or environmental situations I might encounter. That’s what makes it so attractive. Don’t get me wrong. The intertidal will always hold a special place in my heart, but the endless possibilities of being a part of this marine mammal research team is priceless. I have learned so much about myself including my strengths and weaknesses. Living in Port Orford, which is a small coastal town with just a little over 1,000 people gives you a new perspective. The community has been very welcoming and I have appreciated how so much interest is placed on the kind of work we do. As I eat my nightly bowl of ice cream, I think about how, from here on out, the good and the bad can only bring a lifetime of skills and memories.
Figure 5. Me being extremely happy to be out on the kayak on a beautiful morning.
By: Kelli Iddings, MSc Student, Duke University, Nicholas School of the Environment
The excitement is palpable as I wait in anticipation. But finally, “Blow!” I shout as I notice the lingering spray of seawater expelled from a gray whale as it surfaces to breathe. The team and I scurry about the field site taking our places and getting ready to track the whale’s movements. “Gray whale- Traveling- Group 1- Mark!” I exclaim mustering enough self-control to ignore the urge to drop everything and stand in complete awe of what in my mind is nothing short of a miracle. I’ve spotted a gray whale searching and foraging for food! As a student of the Master of Environmental Management program at Duke University, I am collaborating on a project in Port Orford, Oregon where my team and I are working to gain a better understanding of the interactions between the Pacific Coast Feeding Group (PCFG) gray whales and their prey. Check out this blog post written earlier by my teammate Florence to learn more about the methods of the project and what motivated us to take a closer look at the foraging behavior of this species.
Understanding the dynamics of gray whale foraging within ecosystems where they are feeding is essential to paint a more comprehensive picture of gray whale health and ecology—often with the intent to protect and conserve them. A lot of our recent effort has been focused on developing and testing methods that will allow us to answer the questions that we are asking. For example, what species of prey are the PCFG whales feeding on in Port Orford? Based on the results of a previous study (Newell and Cowles 2006) that was conducted in Depoe Bay, Oregon, and a lot of great knowledge from the local fisheries and the Port Orford community, we hypothesized that the whales were feeding on a small, shrimp-like crustacean in the order Mysida. Given the results of our videos, and the abundance of mysid, it looks like we are right (Fig. 1)!
Figure 1: Mysids, only 5-25mm in length, collected in Tichenor Cove using a downrigger to lower a weighted plankton net into the water column from our kayak.Mysids are not typically the primary food source of gray whales. In their feeding grounds in the Bering and Chukchi Seas near Alaska, the whales feed on benthic amphipods on the ocean floor by sucking up sediment and water and pushing it through baleen plates that trap the food as the water and sediment is filtered out. However, gray whales demonstrate flexible feeding strategies and are considered opportunistic feeders, meaning they are not obligate feeders on one prey item like krill-dependent blue whales. In Oregon, mysid congregate in dense swarms by the billions, which we hypothesize, makes it energetically worthwhile for the massive 13-15m gray whales to hang around and feed! Figure 2 illustrates a mysid swarm of this kind in Tichenor Cove.
Figure 2: Image captured using a Hero 4 Black GoPro. Rocky Substrate is visible in lower portion of image and a clear swarm of mysid is aggregated around this area.
Once we know what the gray whales are eating, and why, we ask follow up questions like how is the distribution of mysid changing across space and time, if at all? Are there patterns? If so, are the patterns influencing the feeding behavior and movement of the whales? For the most part, we are having success characterizing the relative abundances of mysid. No conclusions can be made yet, but there are a few trends that we are noticing. For instance, it seems that the mysid are, as we hypothesized, very dense and abundant around the rocky shoreline where there are kelp beds. Could these characteristics be predictors of critical habitat that whales seek as foraging grounds? Is it the presence of kelp that mysid prefer? Or maybe it’s the rocky substrate itself? Distance to shore? Time and data analysis will tell. We have also noticed that mysid seem to prefer to hang out closer to the bottom of the water column. Last, but certainly not least, we are already noticing differences in the sizes and life stages of the mysid over the short span of one week at our research site! We are excited to explore these patterns further.
The biggest thing we’re learning out here, however, is the absolute necessity for patience, ingenuity, adaptability, and perseverance in science. You heard that right, as with most things, I am learning more from our failures, than I am from our successes. For starters, understanding mysid abundance and distribution is great in and of itself, but we cannot draw any conclusions about how those factors are affecting whales if the whales don’t come! We were very fortunate to see whales while training on our instruments in Newport, north of our current study site. We saw whales foraging, whales searching, mother/calf pairs, and even whales breaching! Since we’ve been in Port Orford, we have seen only three whales, thrown in among the long hours of womanpower (#WomenInScience) we have been putting in! We are now learning the realities of ecological science that >gasp< fieldwork can be boring! Nevertheless, we trust that the whales will hear our calls (Yes, our literal whale calls. Like I said, it can get boring up on the cliff) and head on over to give the cliff team in Port Orford some great data—and excitement!
Then, there is the technology. Oh, the joys of technology. You see I’ve never considered myself a “techie.” Honestly, I didn’t even know what a hard drive was until some embarrassing time in the not-so-distant past. And now, here I am working on a project that is using novel, technology rich approaches to study what I am most passionate about. Oh, the irony. Alas, I have been putting on my big girl britches, saddling up, and taking the whale by the fluke. Days are spent syncing a GoPro, Time-Depth Recorder (TDR), GPS, associated software, and our trusty rugged laptop, all the while navigating across multiple hard drives, transferring and organizing massive amounts of data, reviewing and editing video footage, and trouble shooting all of it when something, inevitably, crashes, gets lost, or some other form of small tragedy associated with data management. Sounds fun, right? Nonetheless, within the chaos and despair, I realize that technology is my friend, not my foe. Technology allows us to collect more data than ever before, giving us the ability to see trends that we could not have seen otherwise, and expending much less physical effort doing so. Additionally, technology offers many alternatives to other invasive and potentially destructive methods of data collection. The truth is if you’re not technologically savvy in science these days, you can expect to fall behind. I am grateful to have an incredible team of support and such an exciting project to soften the blow. Below (Fig. 3) is a picture of myself embracing my new friend technology.
Figure 3: Retrieving the GoPro, and some tag-a-long kelp, from the water after a successful deployment in Tichenor Cove.
Last but not least, there are those moments that can best be explained by the Norwegian sentiment “Uff da!” I was introduced to the expression while dining at The Crazy Norwegian, known famously for having the best fish and chips along the entire west coast and located dangerously close to the field station. The expression dates back to the 19th century, and is used readily to concisely convey feelings of surprise, astonishment, exhaustion, and sometimes dismay. This past week, the team was witness to all of these feelings at once as our GoPro, TDR, and data fell swiftly to the bottom of the 42-degree waters of Tichenor cove after the line snapped during deployment. Uff da!!! With our dive contact out of town, red tape limiting our options, the holiday weekend looming ahead, and the dreadful thought of losing our equipment on a very tight budget, the team banded together to draft a plan. And what a beautiful plan it was! The communities of Port Orford, Oregon State University, and the University of Oregon’s Institute of Marine Biology came together in a successful attempt to retrieve the equipment. We offer much gratitude to Greg Ryder, our retrieval boat operator, OSU dive safety operator Kevin Buch, and our divers, Aaron Galloway and Taylor Eaton! After lying on the bottom of the cove for almost three days, the divers retrieved our equipment within 20 minutes of the dive – thanks to the quick and mindful action of our kayak team to mark a waypoint on the GPS at the time of the equipment loss. Please enjoy this shot (Fig. 4) of Aaron and Taylor surfacing with the gear as much as we do!
Figure 4: Aaron Galloway and Taylor Eaton surface with our lost piece of equipment after a successful dive retrieval mission.
The moral of the story is that science isn’t easy, but it’s worth it. It takes hard work, long hours, frustration, commitment, collaboration, and preparedness. But moments come along when your team sits around a dining room table, exhausted from waking and paddling at 5 am that morning, and continues to drive forward. You creatively brainstorm, running on the fumes of the passion and love for the ocean and creatures within it that brought everyone together in the first place; each person growing in his or her own right. Questions are answered, conclusions are drawn, and you go to bed at the end of it all with a smile on your face, anxiously anticipating the little miracles that the next day’s light will bring.
References
Newell, C. and T.J. Cowles. (2006). Unusual gray whale Eschrichtius robustus feeding in the summer of 2005 off the central Oregon Coast. Geophysical Research Letters, 33:10.1029/2006GL027189
Hello Everyone, and welcome back for season two of our ever-expanding research project(s) about the gray whales of the Oregon coast!
Overall, our goal is document and describe the foraging behavior and ecology of the Pacific Coast Feeding Group of Gray Whales on the Oregon Coast. For a quick recap on the details of this project read these previous posts:
During this summer season, the newest iteration of team ro”buff”stus will be heading back down to Port Orford, Oregon to try to better understand the relationship between gray whales and their mysid prey. Half the team will once again use the theodolite from the top of Graveyard Point to track gray whales foraging in Tichenor Cove, the Port of Port Orford, and the kelp beds near Mill Rocks. Meanwhile, the other half of the team will use the R/V Robustus (i.e. a tandem ocean kayak named after our study species – Eschrichtius robustus, the gray whale) to repeatedly deploy a GoPro camera at several sampling locations in Tichenor cove. We hope that by filming vertical profiles of the water column, we will be able to create an index of abundance for the mysid to describe their temporal and spatial distribution of their swarms. We’re particularly interested in the differences between mysid swarm density before and after a whale forages in an area, and how whale behaviors might change based on the relative density of the available prey.
Ready to take the R/V Robustus out for her maiden voyage in Port Orford to test some of our new equipment. photo credit: Leigh Torres
In theory, asking these questions seems simple – get in the boat, drop the camera, compare images to the whale tracklines, get an answer! In reality, this is not the case. A lot of preparatory work has been going on behind the scenes over the last six months. First, we had to decide what kind of camera to use, and decide what sort of weighted frame to build to get it to sink straight to the bottom. Then came the questions of deployment by hand versus using a downrigger,
Example A why it is a bad idea to try to sample during a diatom bloom – You can’t see anything but green.
what settings to use on the camera, how fast to send it down and bring it back up, what lens filters are needed (magenta) and other logistical concerns. (Huge thank you to our friends at ODFWMarine Reserves Program for the help and advice they provided on many of these subjects.) We spent some time in late May testing our deployment system, and quickly discovered that sampling during a diatom bloom is completely pointless because visibility is close to nil.
However, this week, we were able to test the camera in non-bloom conditions, and it works! We were able to capture images of a few small mysid swarms very near the bottom of the water column, and we didn’t need external lights to do it. We were worried that adding extra lights would artificially attract mysid to the camera, and bias our measurements, as well as potentially disturbing the whale’s foraging behavior. (Its also a relief because diving lights are expensive, and would have been one more logistical thing that could go wrong. General advice: Always follow the KISS method when designing a project – keep it simple, ——!)
This image is taken at a depth of ~10 meters, with no color corrective filter on the lens – notice how blurry the mysid are.This is empty water, in the mid water columnMuch clearer Mysid! This time with a magenta filter on the lens to correct the colors for us.
My advisor recently introduced me to the concept of the “7 Ps”; Proper Prior Planning Prevents Piss Poor Performance. To our knowledge, we are the first group to try to use GoPro cameras to study the spatial and temporal patterns of zooplankton aggregations. With new technology comes new opportunities, but we have to be systematic and creative in how we use them. Trial and error is an integral part of developing new methods – to find the best technique, and so that our work can be replicated by others. Now that we know the GoPro/Kayak set-up is capable of capturing useable imagery, we need to develop a protocol for how to process and quantify the images, but that’s a work in progress and can wait for another blog post. Proper planning also includes checking last year’s equipment to make sure everything is running smoothly, installing needed computer programs on the new field laptop, editing sampling protocols to reflect things that worked well last year, and expanding the troubleshooting appendixes so that we have a quick reference guide for when things go wrong in the field. I am sure that we will run into more weird problems like last year’s “Chinese land whale”, but I also know that we would have many more difficulties if we had not been planning this field effort for the last several months.
Planning our sampling pattern in Tichenor Cove.
Team Ro”buff”stus is from all over the place this year – we will have members from Oregon, North Carolina and Michigan – and we are all meeting for the first time this week. The next two weeks are going to be a whirlwind of introductions, team bonding, and learning how to communicate effectively while using the theodolite, our various computer programs, GoPro, Kayak, and more! We will keep the blog updated with our progress, and each team member will post at least once over the course of the summer. Wish us luck as we watch for whales, and feel free to join in the fun on pretty much any cliff-side in Oregon (as long as you’ve got a kelp bed nearby, chances are you’ll see them!)
By: Erin Pickett, MS student, Biotelemetry and Behavioral Ecology Laboratory & GEMM Lab, MMI
Buckeye anecdote
I recently found myself sitting at a Sunday brunch at the Westin in Washington, D.C., talking to my uncle about my research on the foraging ecology of penguins. Our entire extended family had gathered for a cousin’s wedding, and it was the first family gathering in a long time that I had been able to attend due to always being “out on some island”, as my cousin puts it. In fact, I got a shout-out during one of the dinner reception speeches for coming all the way from Antarctica for the wedding.
My uncle asked me about my research while our surrounding family members sipped their coffee and OJ and recounted the highlights of the previous night’s wedding reception. This conversation with my uncle was the first I’d had with a family member all weekend that had progressed past my ‘elevator speech’ of what I was studying in school. After I described my research questions about resource partitioning between Adelie and gentoo penguins, my uncle glanced around the room full of family members and said to me, “You know what….”? And then he went on to describe his thoughts about how our aunts, uncles, cousins and in-laws all occupied distinct niches within our family.
The definition of the word niche is broad, and for this reason it can be used to describe the roles of younger siblings, matriarchs, sisters, and Ohio State Buckeye fans within their families or communities. Take for example my entire family on the dance floor chanting O-H-I-O during the bands requisite rendition of “Hang on Sloopy” at the wedding reception. As Buckeyes, we were occupying a role distinct from that of the bride’s family, who are Notre Dame Fans. Within our immediate families, the roles of every sibling and parent are further differentiated. My uncle and I looked around the room and saw a family who despite a wide range of personalities and football allegiances, was managing to enjoy a pretty good time together!
Ecological niche theory and sympatric penguins
In ecology, the term niche is used to describe the ecological role that a species occupies within an ecosystem (Hutchinson 1957). The concept of an ecological niche is typically used in ecology to describe how similar species coexist within the same space. This coexistence is made possible through segregation mechanisms that facilitate resource partitioning, such as spatial or temporal differences in foraging location, or dietary segregation (Pianka 1974). With this in mind, the main objective of my master’s research is to quantify the ecological niches of Adelie and gentoo penguins in terms of space, time and diet, in order to investigate whether foraging competition is occurring between these two species. You’ll find more background on this project here.
The first step in my investigation of resource partitioning was to assess the extent and consistency of dietary overlap between these two species. The diets of Adelie and gentoo penguins vary regionally, but along the Antarctic Peninsula the prey of both species is typically dominated by Antarctic krill. This was the case when I studied the diets of these two species at Palmer Station in Antarctica. I also found that both species consume the same size classes of krill and that this was consistent across both low and high prey availability years (Figure 1).
Figure 1. Length-frequency distribution of Antarctic krill found in penguin diet samples (2010-2015). Krill size class bins shown on x-axis with the proportion of those size classes depicted on the y-axis. Palmer LTER unpublished data.
The next step of my project is to assess the foraging habits and space-use patterns of these two species. They share food, but do they forage in the same areas? I am in the process of analyzing spatial data obtained from satellite and TDR (time depth recording) tags temporarily attached to Adelie and gentoo penguins during the breeding season to determine the core foraging areas. I am using kernel density estimate (KDE) techniques to visually and quantitatively determine the size and extent of spatial overlap between both species foraging areas (Figure 2).
Figure 2. An example plot of 3D kernel density estimates outlining 95% and 50% volume contours of foraging penguins during the 2010 breeding season. Orange and green depict the core foraging areas of gentoo and Adelies, respectively. Horizontal axes show northing and easting values and depth is shown in meters on the vertical axis.
The KDE method allows me to turn hundreds of satellite tag derived location points into a probability density surface which depicts where an animal is most likely to be found (Kie et al. 2010). 2D KDEs are sufficient to describe the ranges of many terrestrial animals, however, 3D KDEs are a more appropriate description of the space-use patterns of diving seabirds. By failing to incorporate the depth at which these two species are foraging, 2D KDEs might overestimate the extent of spatial overlap between two species who are foraging in the same location but at different depths. Similar to other studies (Cimino et al. 2016 & Wilson 2010), I am finding that Adelie and gentoo penguins may be partitioning resources by foraging at different depths, with gentoo penguins diving deeper than Adelies. By foraging at different depths, these two species are limiting foraging competition.
While I am working on these analyses, I am also thinking about my next step, which will be to determine whether foraging niche overlap between Adelie and gentoo penguins is a function of prey availability. Resource availability is a critical component of niche segregation. When resources are abundant, there is typically a higher tolerance for niche overlap (Pianka 1974, Torres 2009). Conversely, niches may become more distinct as resources decrease and successfully partitioning these resources will become more important to minimize competition. In order to address the effect of resource availability on niche partitioning between Adelie and gentoo penguins, I will be comparing their foraging niches during years of both low and high prey availability. This will allow me to truly evaluate the potential occurrence of foraging competition between these two species.
Conclusion
I’ll keep you updated on my progress with data analysis in future blogs, but before I go I’ll share one last piece of wisdom about niche theory that I’ve learned from my family. There is a niche for everyone unless you are a Michigan fan, then no amount of spatial or dietary partitioning in a room full of Ohio State Buckeyes will save you.
References
Cimino, Megan A., et al. “Climate-driven sympatry may not lead to foraging competition between congeneric top-predators.” Scientific reports 6 (2016).
Hutchinson, G.E. “Concluding remarks. Population Studies: Animal Ecology and Demography.” Cold Spring Harbor Symposia on Quantitative Biology 22 (1957): 415-427.
Kie, John G., et al. “The home-range concept: are traditional estimators still relevant with modern telemetry technology?” Philosophical Transactions of the Royal Society of London B: Biological Sciences 365.1550 (2010): 2221-2231.
Pianka, Eric R. “Niche overlap and diffuse competition.” Proceedings of the National Academy of Sciences 71.5 (1974): 2141-2145.
Torres, Leigh G. “A kaleidoscope of mammal, bird and fish: habitat use patterns of top predators and their prey in Florida Bay.” Marine Ecology Progress Series 375 (2009): 289-304.
Florence here with an update about the final numbers from this summer’s gray whale field season.
For folks just hearing about the project, my team of interns and I spent the summer alternating between study sites at Depoe Bay and Port Orford to conduct fine-scale focal follows of gray whales foraging in near-shore Oregon waters using a theodolite. That is to say, we gathered 10,186 ‘marks’ or ‘locations’ where whales came to the surface, and by connecting the dots, we are able to create tracklines and analyze their movement patterns. The idea is to document and describe gray whale foraging behavior in order to answer the questions: Are there patterns in how the whales use the space? Is there a relationship between foraging success and proximity to kelp beds? Do behaviors vary between individuals, location, or over time during the season?
All these tracklines are from one whale, Keyboard, visiting the same area multiple times over the course of a month. I’ll break this figure down a little later in the post. Notice how the whale consistently returns to the bay just west of the port jetty
While at our study sites, we often received questions about vessel disturbance on the whale’s behavior. Over the course of the summer, we saw whales completely ignore boats, approach boats, and actively avoid boats. Therefore, we documented these vessel interactions in order to ask questions such as: Does vessel disturbance alter behavior? How close is too close? Does the potential for vessel disturbance vary depending on (1) size of motor, (2) speed of approach, (3) type of vessel, i.e. kayak, fishing boat, tour boat, (4) the number of vessels already in the area, (5) amount of time a vessel has been following a whale, (6) time of season, (7) the presence of a calf or other whales? The end goal, once the data have been analyzed, is to bring our results to local vessel operators (commercial and recreational) and work together to write reasonable, effective, and scientifically informed guidelines for vessel operations in the presence of gray whales.
And now, the numbers you’ve all been waiting for, here is the tally of our data collection this summer:
Table 1. Summary of survey effort for gray whale foraging ecology field season summer 2015
Whale named “Keyboard” visits graveyard head multiple times. Green track: 7.21.15, Pink track: 7.21.15, Teal track: 7.30.15. The orange polygons are approximate locations of kelp patches.“Keyboard” continues to visit. Red trackline: 8.27.15, white trackline: 8.28.15, purple trackline: 8.28.15
Whale 130 foraged near Boiler Bay for 5.5 hours on Aug 12. Trying to look at the whole trackline in one go is a little complicated, so let’s break it down by hour.This panel shows hours 4-6 of the track. Things get more complex as various vessels use the same area. Whale 130 is always in red.
So, what does this all mean? Well, the unsatisfying answer is of course: we don’t know yet. However, it is my job to find out! I will spend the fall and winter processing data, writing and running behavioral models, communicating my successes and frustrations, and finally presenting my results to the community.
The human eye is well adapted to pick out patterns. Test yourself – what trends can you see in these images? Are there areas that the whales seem to prefer over other areas? In the Port Orford images with Keyboard & our kelp patches, does our theory of a relationship between whale presence and kelp patches seem valid?
This field season would not have been possible without the help of some truly excellent people. Thank you Cricket and Justin and Sarah for making up the core of Team Ro”buff”stus. It was a pleasure working with you this summer. Thank you to guest observers and photographers Era, Steven, Diana, Cory, Kelly, Shea and Brittany for filling in when we needed extra help! Thank you to our support network down in Port Orford: Tom, Tyson and the team at the Port Orford Field Station – we appreciate the housing and warm welcome, and to Jim and Karen Auborn and the Port of Port Orford for allowing us access to such a fantastic viewing location. Thank you to Oregon State Parks for allowing us access to the field sites at Boiler Bay and Humbug. Finally, thank you to Depoe Bay Pirate Coffee Company for keeping us warm and caffeinated on many foggy, cold early mornings. This work was funded by the William and Francis McNeil Fellowship Award, the Wild Rivers Coast Alliance, and the American Cetacean Society: Oregon Chapter.


![DSCF0776[3]](http://blogs.oregonstate.edu/gemmlab/files/2016/07/DSCF07763-e1468372770128.jpg)


