Drivers of close encounters between albatross and fishing vessels

By Rachael Orben

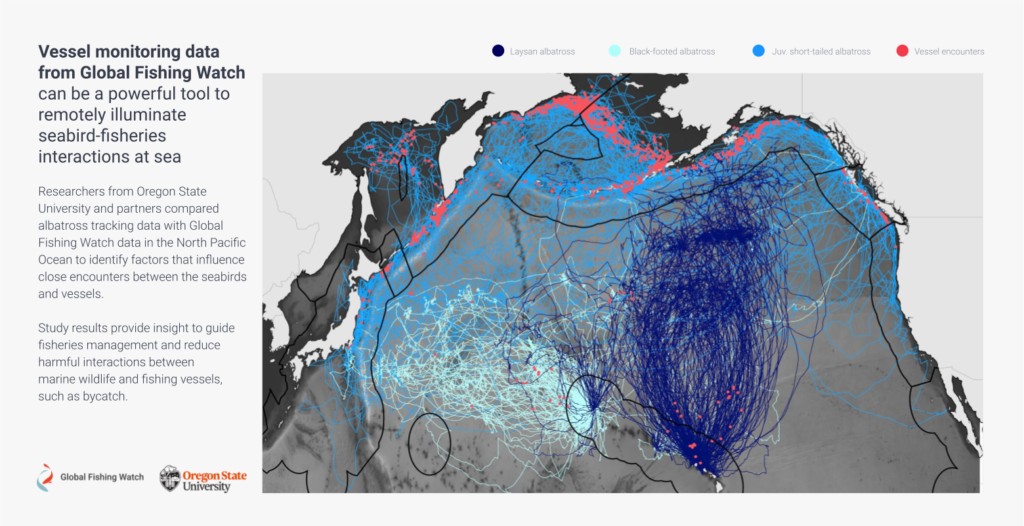
In September of 2016, Leigh Torres, associate professor at Oregon State University, and I attended the 6th International Albatross and Petrel Conference. Somehow, amid all of the science that filled the week, Leigh first saw the Global Fishing Watch fishing map. She shouted with joy. She immediately envisioned a study to assess interactions between seabirds and fishing boats, and started considering a spatial overlap analysis between telemetry tracks of albatross with the Global Fishing Watch database. Such a study could help reduce bycatch, or the incidental catch of non-target species, like seabirds, in fisheries. Five years later, we executed that study in partnership with Global Fishing Watch, one of the first to look at fine-scale overlap between fishing vessels and marine life on the high seas (Orben et al. 2021).   

Transparent data means opportunity for analysis

Despite knowing that bycatch from fisheries is a real, significant problem for many albatross populations, we have long struggled to know where birds go, where boats fish, and where the two interact in the vast ocean, especially in largely unregulated international waters. Albatross are long-lived seabirds and 15 out of the 22 species are threatened with extinction. Scientists have been tracking albatross for three decades, but assessing individual seabird encounters with vessels has traditionally been limited by a lack of transparency in fishing activity data. Some seabirds are attracted to fishing vessels because of the bait and offal, but we don’t know the whole story of why some birds approach vessels while others don’t.

When we first put our relatively large datasets together – 9,992 days of albatross tracking data from 150 birds and Global Fishing Watch fishing effort data from 2012-2016 – we weren’t sure what we would find. The ocean is a big place, and so finding where one bird and one vessel overlap is kind of like trying to find a needle in a haystack. Would we have enough encounters between birds and boats for an analysis? Would birds encounter fishing vessels as often as we think?
Measuring encounters between albatross and vessels

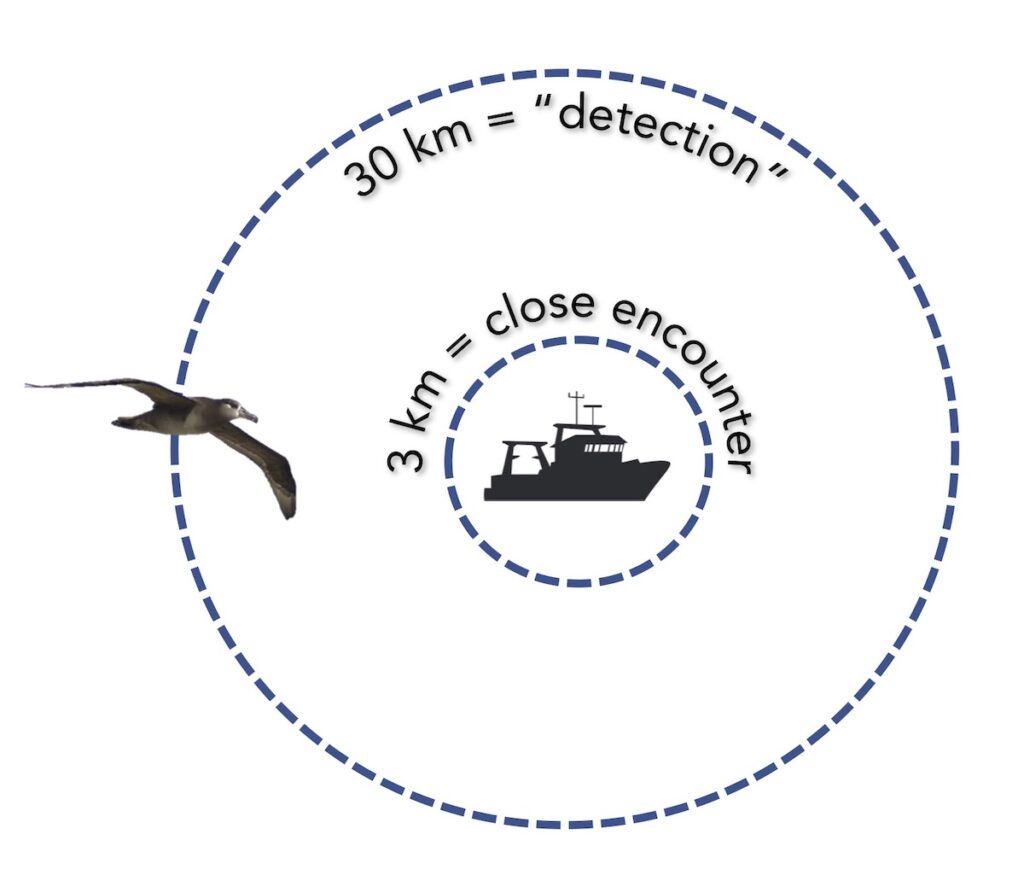
After overlaying the tracking data with a gridded daily layer of fishing effort, we identified potential encounters between birds and fishing boats. We identified when an albatross could detect a vessel, at a radius or 30 kilometers, and when an albatross had a close encounter with a vessel, within a radius of 3 kilometers (following methods developed in Collet Patrick & Weimerskirch, 2015). Then, we investigated factors that influenced the occurrence and duration of close encounters, considering the bird’s behavior, environmental conditions and habitat, fishing vessel and fisheries characteristics, and temporal variables, such as time of day and month.

Species variation of encounters

We conducted our analysis for three species of albatross that forage in the north Pacific ocean, Laysan albatross, black-footed albatross, and short-tailed albatross.

  • Adult black-footed albatrosses approached vessels for a close encounter 61.9 percent of the time they detected a fishing vessel. 
  • Adult Laysan albatross had close encounters with a fishing boat 35.7 percent of the time they detected a vessel. 
  • Juvenile short-tailed albatross had a lower frequency of close encounters (28.6 percent), 

Understanding close encounters and their duration

Due to a low sample size of encounters, we were unable to investigate the reason for close encounters or their duration for black-footed albatrosses. More tracking data is critical to understand factors influencing the impact of vessels on this vulnerable species.

Laysan albatross were more likely to approach fishing vessels when fishing effort was high, but fishing boat density was low. Laysan albatross also had close encounters with vessels more frequently while they were foraging. Due to sample size, we could not further investigate the reason for the duration of encounters for this species.

Short-tailed albatrosses were also more likely to approach fishing vessels when they were searching for prey, fishing effort was high, and fishing boat density was low. They were more likely to have close encounters with vessels during the day and in habitats with water depths from 75-1500 meters. 

Vessel attendance by short-tailed albatrosses was longer when sea surface temperatures were warmer and less productive, and during periods with lower wind speeds. 

A useful approach

The information available to fisheries managers in order to reduce bycatch is most often limited to data collected from the perspective of the fishing vessels. Our analysis provides an alternative view – an albatross’ view of when and where boats are encountered in the seascape. While our analysis didn’t specifically look at bycatch, our estimates of proximity between birds and boats can be considered a proxy for  increased bycatch risk.

For the endangered short-tailed albatross, bycatch events are few, but they come with high consequences for the bird population and fishing industry. Extending our study in a dynamic ocean management framework to provide an early warning system to predict when short-tailed albatross might make close and longer encounters with fishing vessels could be the next step. Furthermore, our analysis methods to assess when, where and why marine animals interact with fishing vessels can be applied to many other marine species in order to understand and reduce conflicts with fisheries. 

This blog was for the Global Fishing Watch blog at globalfishingwatch.org

References

Collet, J., Patrick, S. C., & Weimerskirch, H. (2015). Albatrosses redirect flight towards vessels at the limit of their visual range. Marine Ecology Progress Series, 526, 199–205. http://doi.org/10.3354/meps11233

Orben, RA J Adams, M Hester, SA Shaffer, R Suryan, T Deguchi, K Ozaki, F Sato, LC Young, C Clatterbuck, MG Conners, DA Kroodsma, LG Torres. 2021. Across borders: External factors and prior behavior influence North Pacific albatross associations with fishing vessels. Journal of Applied Ecology. https://besjournals.onlinelibrary.wiley.com/doi/10.1111/1365-2664.13849

Murre versus Penguin: Happy World Penguin Day!

Rachael Orben PhD, PI Seabird Oceanography Lab

Happy World Penguin Day (officially April 25th)!  I have been contemplating what to write for my tern at the GEMM lab blog. Most of my ideas were a little bit dark, but happily when I loaded my Twitter feed Saturday morning I was greeted with many beautiful photos of penguins and the hashtag #WorldPenguinDay so that inspired something more light hearted.

To be fair, it really should be Alcidae vs. Spheniscidae (scientific family names for auks and penguins). However, I have spent many months in the field studying murres (an alcid), and I find them fascinating. Soon it will be time for them to lay their eggs at colonies along the Oregon coast, including Yaquina Head. Murres have some amazing life history characteristics.

Some of the flamboyant alcid species found in the North Pacific. These species are all crevice or burrow nesters like some penguins including Magellanic, African, and little blue penguins.  

So how do murres stack up against penguins?

At first glance, murres and penguins are fairly similar. They are deep diving seabirds that forage on crustaceans and forage fish. Like murres, penguins have countershading, with black feathers on their backs and white feathers on their front. This coloring is thought to help provide camouflage when they are foraging (Cairns 1986).

There are two species of murres: common murres and thick-billed murres. Both species have a circumpolar distribution in the northern hemisphere with thick-billed murres nesting a colonies in the Arctic and common murres nesting in more temperate latitudes as far south as the central California coast. Their distributions overlap in the subarctic where they often share colonies (Irons et al. 2008).  

Movement

I am under the impression that one of the reasons people love penguins so much is because they waddle. Murres aren’t so graceful either, but they spend much less of their time walking around since they commute between the sea and their colonies by flying. However, murres have to work harder to fly than they do to dive (Elliott et al. 2013). This is because they have high wing-loading. Essentially, they have big bodies and relatively small wings that they use for flying through air and water. Bigger wings would be better for air, but smaller wings are better for moving through water.

Thick-billed murres flying home with fish, St. Paul Island, AK. Photo R. Orben

It really gets interesting when we start comparing the diving ability of alcids and penguins. Murres are the largest alcid species, and as dive depth scales with body size, they can dive the deepest. If we control for body size, alcids dive deeper then penguins (Burger 1991)! For instance, the deepest depth recorded from a thick-billed murres is 210 meters and the deepest dive of the smallest penguin (just a few hundred grams larger then the typical murre at ~1.5 kg), the little blue penguin, is a mere 69 meters (Penguiness.net).

Colonies & Nests

Murres typically nest in colonies on cliffs, off-shore sea stacks, and occasionally low lying predator free islands. Common murres use wider ledges and nest in very close proximity to each other while thick-billed murres prefer narrow ledges. Murres don’t build nests and simply lay their eggs on the rock ledge.

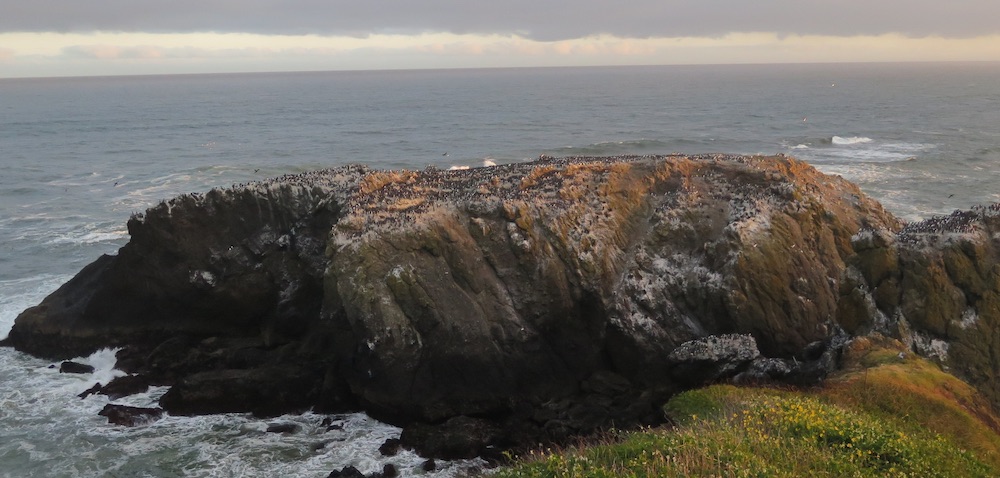
Common murres on Main Colony Rock at Yaquina Head, Newport Oregon. Photo R. Orben

Penguin nesting colonies can take a variety of forms. Colonies of the “brush-tailed” penguins (chinstrap, Adélie and gentoo penguins) are found in places that are snow free for most of the summer. These colonies tend to form as a meandering collection of sub-colonies.  These species build nests out of small rocks that they diligently collect. The rocks help keep their eggs out of snow meltwater. Emperor and king penguins stand together in a group. Burrow nesting penguins like Magellanic penguins can spread their colonies out across large areas where there is suitable habitat for burrowing.

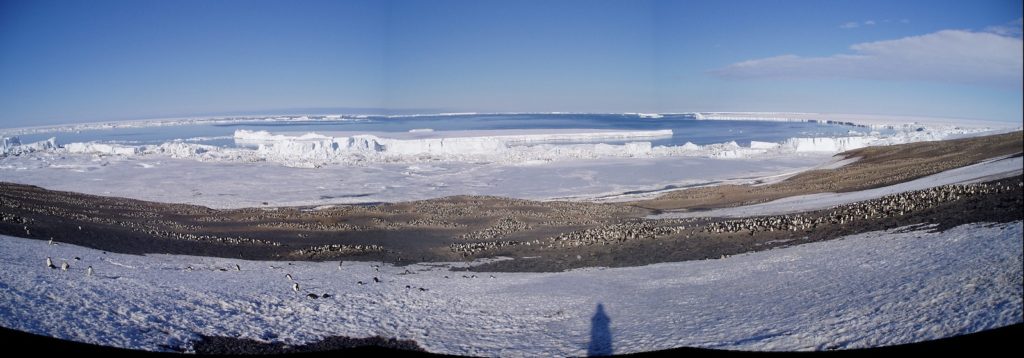
A small portion of the Adélie penguin colony at Cape Crozier, Antarctica. Photo R. Orben

Eggs

Murres lay one large pyriform (pear-shaped) speckled egg that ranges in color from pale cream to brilliant turquoise. This variation allows them to recognize their own eggs (Gaston et al 1993)! The purpose of the shape of murre eggs is something that has been continually puzzled over, but the shape appears to help the blunt end stay cleaner, is stronger, and is more stable on sloping surfaces (Birkhead et al. 2017, 2018).

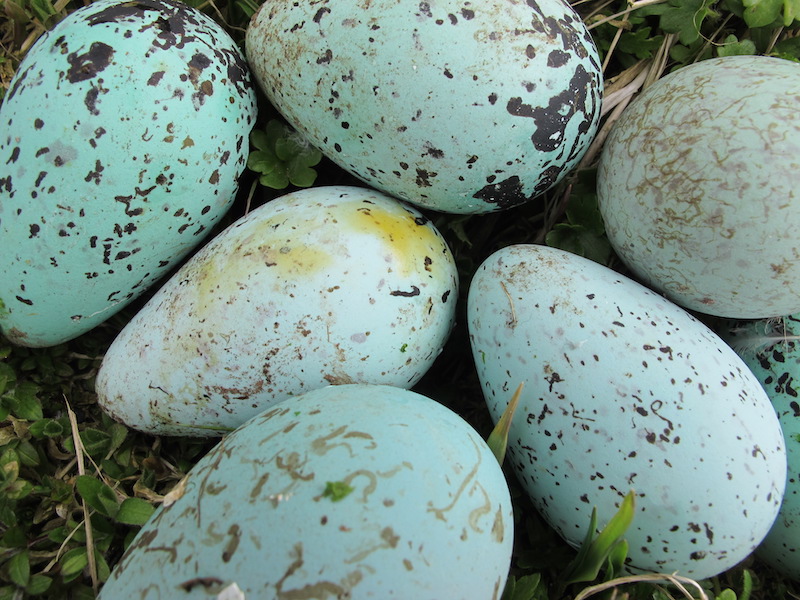
Predated thick-billed murre eggs collected at the top of the cliffs on St. George Island, AK. Photo R. Orben

In comparison, penguin eggs don’t look that remarkable. Many penguin species lay two eggs (e.g. Adélie, chinstrap, rockhopper, gentoo), but king penguins and emperor penguins will just lay one, incubating it on top of their feet. The first egg that macaroni penguins lay is 55-75% smaller than their second egg, potentially due to constraints imposed by migration (Crossin et al. 2010).

Song

Seabirds are not generally known for their melodious songs, but they are still an important part of their social lives. For this comparison I recommend an exploration of the Cornell Lab of Ornithology’s Macaulay Library. Start with the murres and then explore some penguin species. Recently it was discovered that penguins make short noises underwater (Thiebault 2019). Perhaps murres do as well.

If you are interesting a hearing a seabird that can sing, search for Light Mantled Sooty Albatross.

Parent-Offspring Relationship

Murres bring whole fish back to the colony to feed their chick. One fish for each trip. Murre chicks fledge before their flight feathers are fully grown. They jump from the cliffs and glide down to the ocean (hopefully) where they are joined by their male parent. Then the pair paddle out to find good foraging grounds. The male parent needs to feed the growing chick frequently and by bringing the chick to the food is able to meet these demands.

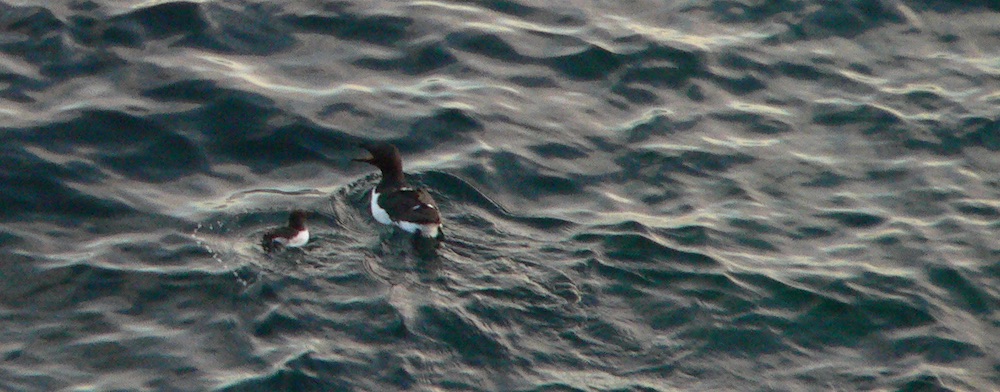
The male parent greets its newly fledged chick. Late evening on St. Paul Island, Alaska. Photo R. Orben

In contrast, penguins regurgitate their stomach contents to feed their offspring. They are able to carry large amounts of food this way. For instance a chinstrap penguin might bring back ~610 grams of food, almost 15% of its body weight (Miller et al. 2010). Adult penguins still have to balance their needs and the demands of their growing chicks. So the adults will leave their chicks alone once they are large enough. The chicks stand in groups known as créches to help protect them against predators like skuas.

Molt

Feather molt is an important part of all birds’ life histories. Feathers don’t last forever and need to be replaced. Both murres and penguins have unique strategies for replacing their feathers. For any flighted bird, replacing primary feathers is especially important. Murres become flightless during molt, which happens in the fall (Birkhead & Taylor 1977). This is actually thought to help their diving as with smaller wings they should be able to fly underwater more easily (Thompson et al. 1998). They replace their body feathers gradually to maintain waterproofing and warmth.

Penguins have solved this problem in another way. Instead of gradually replacing their feathers they undergo a “catastrophic molt” and replace all their feathers at once. Penguins need to be out of the water during this time and will fast, so it is advantageous to quickly grow a new coat of feathers. They too molt after their chicks are fledged.

I will let you decide which seabirds you find most fascinating, because really I find them all amazing and in need of our continued protection.  Thanks for reading!

References

Birkhead TR, Taylor AM (1977) Moult of the Guillemot Uria aalge. Ibis 119:80–85

Birkhead TR, Thompson JE, Jackson D, Biggins JD (2017) The point of a Guillemot’s egg. Ibis 159:255–265

Burger, A. E. (1991). Maximum diving depths and underwater foraging in alcids and penguins. In Studies of High-Latitude Seabirds. 1. Behavioural, Energetic and Oceanographic Aspects of Seabird Feeding Ecology (ed. W. A. Montevecchi and A. J. Gaston), pp. 9-15. Canada: Canadian Wildlife Service Occasional Paper.

Crossin GT, Trathan PN, Phillips RA, Dawson A, Le Bouard F, Williams TD (2010) A Carryover Effect of Migration Underlies Individual Variation in Reproductive Readiness and Extreme Egg Size Dimorphism in Macaroni Penguins. Am Nat 176:357–366

Elliott KH, Ricklefs RE, Gaston AJ, Hatch SA, John R Speakmane F, Davoren GK (2013) High flight costs, but low dive costs, in auks support the biomechanical hypothesis for flightlessness in penguins. PNAS:9380–9384

Irons DB, Anker-Nilssen T, Gaston AJ, Byrd GV, Falk K, Gilchrist G, Hario M, Hjernquist M, Krasnov YV, Mosbech A, Olsen B, Petersen A, Reid JB, Robertson GJ, Strøm H, Wohl KD (2008) Fluctuations in circumpolar seabird populations linked to climate oscillations. Global Change Biology 14:1455–1463

Miller AK, Kappes MA, Trivelpiece SG, Trivelpiece WZ (2010) Foraging-Niche Separation of Breeding Gentoo and Chinstrap Penguins, South Shetland Islands, Antarctica. The Condor 112:683–695

Thiebault A (2019) First evidence of underwater vocalizations in hunting penguins. PeerJ:1–16

Thompson CW, Wilson ML, Melvin EF, Pierce DJ (1998) An unusual sequence of flight-feather molt in Common Murres and its evolutionary implications. The Auk 115:653–669

Are Oregon gulls trash birds?

By Stephanie Loredo, MSc student

“Violent” and “greedy” are words often used to describe gulls in populous areas where food or trash are readily available.  Humans are used to seeing gulls in parking lots, parks, and plazas eating left over crumbs. Many people have even experienced menacing gulls ripping food away from their hands. Anecdotes like these have caused people to have negative perceptions of gulls. But could the repulsive attitude towards these birds be changed with evidence that not all gulls are the same? Well, Oregon may be home to an odd bunch.

Last year, the Seabird Oceanography Lab in conjunction with the GEMM Lab began putting GPS trackers on western gulls (Laurus occidentalis) off the Oregon Coast. One of the goals was to determine where gulls scavenge for food while raising chicks: at sea or on land in association with humans. We were particularly interested to see if western gulls in Oregon would behave similarly to western gulls in California, some of which make trips to the nearest landfill during the breeding season to bring not only food but also potentially harmful pathogens back to the colony.

During the 2015 breeding season, 10 commercially brand ‘i-gotU’ GPS data loggers were placed on gulls from ‘Cleft-in-the-Rock’ colony in Yachats, Oregon. The tags provided GPS locations at intervals of two minutes that determined the general habitat use areas (marine vs. terrestrial). After a two-week period, we were able to recapture six birds, remove tags, and download the data.   We found that these western gulls stayed close to the colony and foraged in nearby intertidal and marine zones (Figure 1). Birds showed high site faithfulness by visiting the same foraging spots away from colony. It was interesting to see that inland habitat use did not extend past 1.3 miles from shore and the only waste facility within such boundaries did not attract any birds (Figure 1). Tagged birds never crossed the 101 Highway, but rather occurred at beaches in state parks such as Neptune and Yachats Ocean Road.

Figure 1. Tracks from 6 western gulls, each color representing a unique bird, from the Cleft-in-the-Rock colony carrying micro-GPS units.

While it is hard to determine whether gulls avoided anthropogenic sources of food at the beach, preliminary analysis shows a high percentage of time spent in marine and intertidal habitat zones by half of the individuals (Figure 2). At a first glance, this is not as much as it seemed on the tracking map (Figure 1), but it nonetheless confirms that these gulls seek food in natural areas. Moreover, time spent at the colony is represented as time spent on coastal habitat on the graph, and thus “coastal” foraging values are over represented. To get a more exact estimate of coastal habitat use, future analysis will have to exclude colony locations and distinguish foraging versus resting behaviors.

Figure 2. Bar plot of the percentage of time spent in three distinct habitats for each gull carrying a GPS unit. The three-letter code represents the unique Bird ID.

‘Cleft-in-the-Rock’ is unique and its surroundings may explain why there was high foraging in intertidal and marine zones rather than within city limits. (The Cleft colony can also be tricky to get to, with a close eye on the tide at all times – See video below).  The colony site is close to the Cape Perpetua Scenic Area and surrounded by recently established conservation zones: the Cape Perpetua Marine Reserve Area, Marine Protected Area, and Seabird Protected Area (Figure 1).  Each of these areas has different regulatory rules on what is allowed to take, which you can read about here. The implication of these protected areas in place means there is more food for wildlife!  Moreover, the city of Yachats has a small population of 703 inhabitants (based on 2013 U.S Census Bureau). The small population allows the city to be relatively clean, and the waste facility is not spewing rotten odors into the air like in many big cities such as Santa Cruz (population of 62,864) where our collaborative gull study takes place. Thus, in Yachats, there is more limited odor or visual incentive to attract birds to landfills.

Field crew descends headland slope to reach ‘Cleft-in-the-Rock’ gull island in Yachats, OR (colony can be seen in distance across the water). The team must wear wetsuits and carry equipment in dry bags for protection during water crossing.

In order to determine whether gull habitat use in Yachats is a trend for all western gulls in Oregon, we need to track birds at more sites and for a longer time. That is why during the breeding season of 2016, we will be placing 30 new tags on gulls and include a new colony into the study, ‘Hunters Island’. The new colony is situated near the Pistol River, between Gold Beach and Brookings in southern Oregon, and it is part of the Oregon Islands Wildlife Refuge.

We will have 10 ‘i-gotU’ tags (Figure 3) and 20 CATS tags (Figure 4), the latter are solar powered and can collect data for several weeks, months, and hopefully even years! These tags do not need to be retrieved for data download; rather data can be accessed remotely, providing minimal disturbance to the gulls and colony. With long-term data, we can explore further into the important feeding areas for western gulls, examine rates of foraging in different habitats, and determine how extensive intertidal and marine foraging is throughout the year.

Figure 3. Taping an i-gotU tag for temporary attachment on the tail feathers of a gull.


Figure 4. Rehearsing the placement and harness attachment of a CATS tag which must be secured on the bird‘s back, looping around the wings and hips.

We are excited to kick start our field season in the next couple of weeks and see how well the new tags work. We know that some questions will be solved and many new questions will arise; and we cannot wait to start this gull-filled adventure!

References

Osterback, A.M., Frechette, D., Hayes, S., Shaffer, S., & Moore, J. (2015). Long-term shifts in anthropogenic subsidies to gulls and implications for an imperiled fish. Biological Conservation191: 606–613.

Following Tracks: A Summer of Research in Quantitative Ecology

**GUEST POST** written by Irina Tolkova from the University of Washington.

R, a programming language and software for statistical analysis, gives me an error message.

I mull it over. Revise my code. Run it again.

Hey, look! Two error messages.

I’m Irina, and I’m working on summer research in quantitative ecology with Dr. Leigh Torres in the GEMM Lab. Ironically, as much as I’m interested in the environment and the life inhabiting it, my background is actually in applied math, and a bit in computer science.

vl-dsc04212

(Also, my background is the sand dunes of Florence, OR, which are downright amazing.)

When I mention this in the context of marine research, I usually get a surprised look. But from firsthand experience, the mindsets and skills developed in those areas can actually be very useful for ecology. This is partly because both math and computer science develop a problem-solving approach that can apply to many interdisciplinary contexts, and partly because ecology itself is becoming increasingly influenced by technology.

Personally, I’m fascinated by the advancement in environmentally-oriented sensors and trackers, and admire the inventors’ cleverness in the way they extract useful information. I’ve heard about projects with unmanned ocean gliders that fly through the water, taking conductivity, temperature, depth measurements (Seaglider project by APL at the University of Washington), which can be used for oceanographic mapping. Arrays of hydrophones along the coast detect and recognize marine mammals through bioacoustics (OSU Animal Bioacoustics Lab), allowing for analysis of their population distributions and potentially movement. In the GEMM lab, I learned about light and small GPS loggers, which can be put on wildlife to learn about their movement, and even smaller lighter ones that determine the animal’s general position using the time of sunset and sunrise. Finally, scientists even made artificial nest mounds which hid a scale for recording the weight of breeding birds — looking at the data, I could see a distinctive sawtooth pattern, since the birds lost weight as they incubated the egg, and gained weight after coming home from a foraging trip…

On the whole, I’m really hopeful for the ecological opportunities opened up by technology. But the information coming in from sensors can be both a blessing and a curse, because — unlike manually collected data — the sample sizes tend to be massive. For statistical analysis, this is great! For actually working with the data… more difficult. For my project, this trade-off shows as R and Excel crash over the hundreds of thousands of points in my dataset… what dataset, you might ask? Albatross GPS tracking data.

In 2011, 2012, and 2013, a group of scientists (including Dr. Leigh!) tagged grey-headed albatrosses at Campbell Island, New Zealand, with small GPS loggers. This was done in the summer months, when the birds were breeding, so the GPS tracks represent the birds’ flights as they incubated and raised their chicks. A cool fact about albatrosses: they only raise one chick at a time! As a result, the survival of the population is very dependent on chick survival, which means that the health of the albatrosses during the breeding season, and in part their ability to find food, is critical for the population’s sustainability. So, my research question is: what environmental variables determine where these albatrosses choose to forage?

The project naturally breaks up into two main parts.

  • How can we quantify this “foraging effort” over a trajectory?
  • What is the statistical relationship between this “foraging effort metric” and environmental variables?

Luckily, R is pretty good for both data manipulation and statistical analysis, and that’s what I’m working on now. I’ve just about finished part (1), and will be moving on to part (2) in the coming week. For a start, here are some color-coded plots showing two different ways of measuring the “foraging value” over one GPS track:

track89518

Most of my time goes into writing code, and, of course, debugging. This might sound a bit dull, but the anticipation of new results, graphs, and questions is definitely worth it. Occasionally, that anticipation is met with a result or plot that I wasn’t quite expecting. For example, I was recently attempting to draw the predicted spatial distribution of an albatross population. I fixed some bugs. The code ran. A plot window opened up. And showed this:

pretty_circles

I stared at my laptop for a moment, closed it, and got some hot tea from the lab’s electronic kettle, all the while wondering how R came up with this abstract art.

All in all, while I spend most of my time programming, my motivation comes from the wildlife I hope to work for. And as any other ecologist, I love being out there on the Oregon coast, with the sun, the rain, sand, waves, valleys and mountains, cliff swallows and grey whales, and the rest of our fantastic wild outdoors.

SONY DSC

Irina5