Drivers of close encounters between albatross and fishing vessels

By Rachael Orben

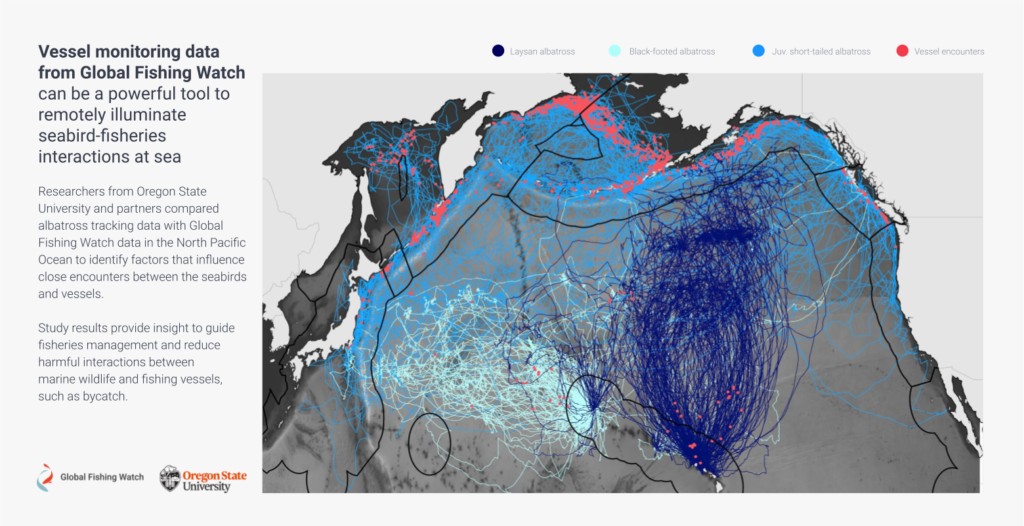
In September of 2016, Leigh Torres, associate professor at Oregon State University, and I attended the 6th International Albatross and Petrel Conference. Somehow, amid all of the science that filled the week, Leigh first saw the Global Fishing Watch fishing map. She shouted with joy. She immediately envisioned a study to assess interactions between seabirds and fishing boats, and started considering a spatial overlap analysis between telemetry tracks of albatross with the Global Fishing Watch database. Such a study could help reduce bycatch, or the incidental catch of non-target species, like seabirds, in fisheries. Five years later, we executed that study in partnership with Global Fishing Watch, one of the first to look at fine-scale overlap between fishing vessels and marine life on the high seas (Orben et al. 2021).   

Transparent data means opportunity for analysis

Despite knowing that bycatch from fisheries is a real, significant problem for many albatross populations, we have long struggled to know where birds go, where boats fish, and where the two interact in the vast ocean, especially in largely unregulated international waters. Albatross are long-lived seabirds and 15 out of the 22 species are threatened with extinction. Scientists have been tracking albatross for three decades, but assessing individual seabird encounters with vessels has traditionally been limited by a lack of transparency in fishing activity data. Some seabirds are attracted to fishing vessels because of the bait and offal, but we don’t know the whole story of why some birds approach vessels while others don’t.

When we first put our relatively large datasets together – 9,992 days of albatross tracking data from 150 birds and Global Fishing Watch fishing effort data from 2012-2016 – we weren’t sure what we would find. The ocean is a big place, and so finding where one bird and one vessel overlap is kind of like trying to find a needle in a haystack. Would we have enough encounters between birds and boats for an analysis? Would birds encounter fishing vessels as often as we think?
Measuring encounters between albatross and vessels

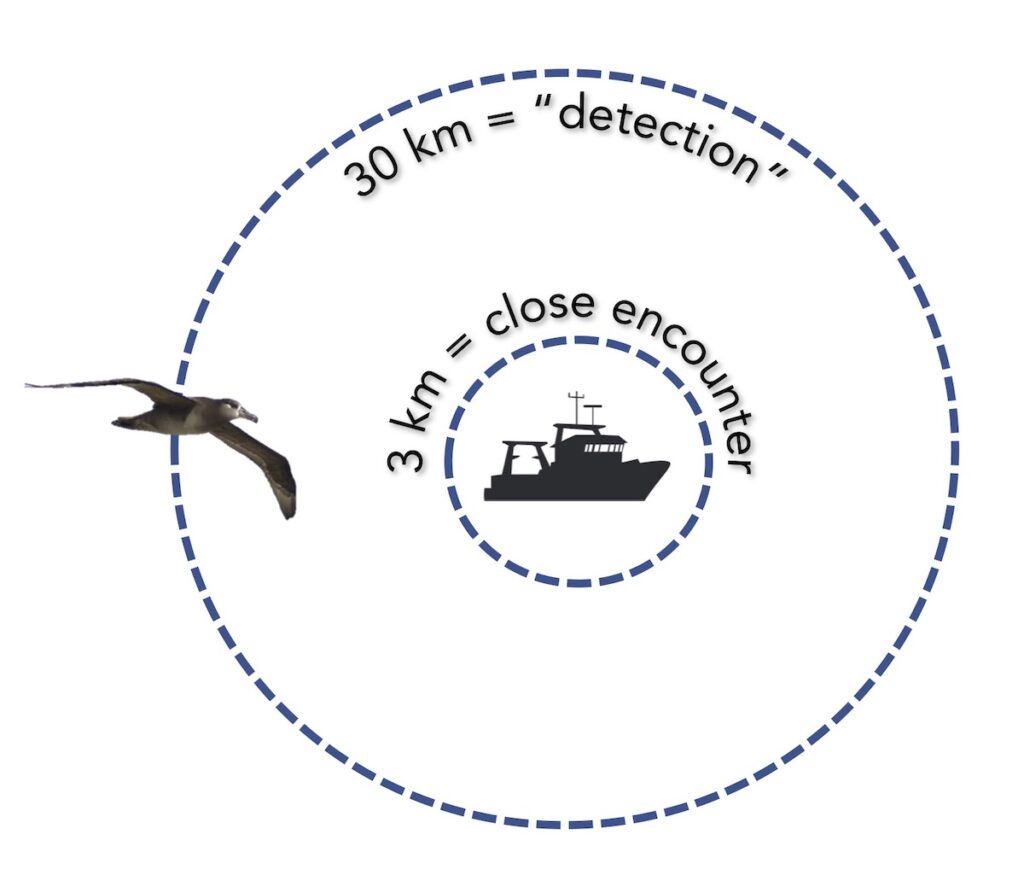
After overlaying the tracking data with a gridded daily layer of fishing effort, we identified potential encounters between birds and fishing boats. We identified when an albatross could detect a vessel, at a radius or 30 kilometers, and when an albatross had a close encounter with a vessel, within a radius of 3 kilometers (following methods developed in Collet Patrick & Weimerskirch, 2015). Then, we investigated factors that influenced the occurrence and duration of close encounters, considering the bird’s behavior, environmental conditions and habitat, fishing vessel and fisheries characteristics, and temporal variables, such as time of day and month.

Species variation of encounters

We conducted our analysis for three species of albatross that forage in the north Pacific ocean, Laysan albatross, black-footed albatross, and short-tailed albatross.

  • Adult black-footed albatrosses approached vessels for a close encounter 61.9 percent of the time they detected a fishing vessel. 
  • Adult Laysan albatross had close encounters with a fishing boat 35.7 percent of the time they detected a vessel. 
  • Juvenile short-tailed albatross had a lower frequency of close encounters (28.6 percent), 

Understanding close encounters and their duration

Due to a low sample size of encounters, we were unable to investigate the reason for close encounters or their duration for black-footed albatrosses. More tracking data is critical to understand factors influencing the impact of vessels on this vulnerable species.

Laysan albatross were more likely to approach fishing vessels when fishing effort was high, but fishing boat density was low. Laysan albatross also had close encounters with vessels more frequently while they were foraging. Due to sample size, we could not further investigate the reason for the duration of encounters for this species.

Short-tailed albatrosses were also more likely to approach fishing vessels when they were searching for prey, fishing effort was high, and fishing boat density was low. They were more likely to have close encounters with vessels during the day and in habitats with water depths from 75-1500 meters. 

Vessel attendance by short-tailed albatrosses was longer when sea surface temperatures were warmer and less productive, and during periods with lower wind speeds. 

A useful approach

The information available to fisheries managers in order to reduce bycatch is most often limited to data collected from the perspective of the fishing vessels. Our analysis provides an alternative view – an albatross’ view of when and where boats are encountered in the seascape. While our analysis didn’t specifically look at bycatch, our estimates of proximity between birds and boats can be considered a proxy for  increased bycatch risk.

For the endangered short-tailed albatross, bycatch events are few, but they come with high consequences for the bird population and fishing industry. Extending our study in a dynamic ocean management framework to provide an early warning system to predict when short-tailed albatross might make close and longer encounters with fishing vessels could be the next step. Furthermore, our analysis methods to assess when, where and why marine animals interact with fishing vessels can be applied to many other marine species in order to understand and reduce conflicts with fisheries. 

This blog was for the Global Fishing Watch blog at globalfishingwatch.org

References

Collet, J., Patrick, S. C., & Weimerskirch, H. (2015). Albatrosses redirect flight towards vessels at the limit of their visual range. Marine Ecology Progress Series, 526, 199–205. http://doi.org/10.3354/meps11233

Orben, RA J Adams, M Hester, SA Shaffer, R Suryan, T Deguchi, K Ozaki, F Sato, LC Young, C Clatterbuck, MG Conners, DA Kroodsma, LG Torres. 2021. Across borders: External factors and prior behavior influence North Pacific albatross associations with fishing vessels. Journal of Applied Ecology. https://besjournals.onlinelibrary.wiley.com/doi/10.1111/1365-2664.13849

Murre versus Penguin: Happy World Penguin Day!

Rachael Orben PhD, PI Seabird Oceanography Lab

Happy World Penguin Day (officially April 25th)!  I have been contemplating what to write for my tern at the GEMM lab blog. Most of my ideas were a little bit dark, but happily when I loaded my Twitter feed Saturday morning I was greeted with many beautiful photos of penguins and the hashtag #WorldPenguinDay so that inspired something more light hearted.

To be fair, it really should be Alcidae vs. Spheniscidae (scientific family names for auks and penguins). However, I have spent many months in the field studying murres (an alcid), and I find them fascinating. Soon it will be time for them to lay their eggs at colonies along the Oregon coast, including Yaquina Head. Murres have some amazing life history characteristics.

Some of the flamboyant alcid species found in the North Pacific. These species are all crevice or burrow nesters like some penguins including Magellanic, African, and little blue penguins.  

So how do murres stack up against penguins?

At first glance, murres and penguins are fairly similar. They are deep diving seabirds that forage on crustaceans and forage fish. Like murres, penguins have countershading, with black feathers on their backs and white feathers on their front. This coloring is thought to help provide camouflage when they are foraging (Cairns 1986).

There are two species of murres: common murres and thick-billed murres. Both species have a circumpolar distribution in the northern hemisphere with thick-billed murres nesting a colonies in the Arctic and common murres nesting in more temperate latitudes as far south as the central California coast. Their distributions overlap in the subarctic where they often share colonies (Irons et al. 2008).  

Movement

I am under the impression that one of the reasons people love penguins so much is because they waddle. Murres aren’t so graceful either, but they spend much less of their time walking around since they commute between the sea and their colonies by flying. However, murres have to work harder to fly than they do to dive (Elliott et al. 2013). This is because they have high wing-loading. Essentially, they have big bodies and relatively small wings that they use for flying through air and water. Bigger wings would be better for air, but smaller wings are better for moving through water.

Thick-billed murres flying home with fish, St. Paul Island, AK. Photo R. Orben

It really gets interesting when we start comparing the diving ability of alcids and penguins. Murres are the largest alcid species, and as dive depth scales with body size, they can dive the deepest. If we control for body size, alcids dive deeper then penguins (Burger 1991)! For instance, the deepest depth recorded from a thick-billed murres is 210 meters and the deepest dive of the smallest penguin (just a few hundred grams larger then the typical murre at ~1.5 kg), the little blue penguin, is a mere 69 meters (Penguiness.net).

Colonies & Nests

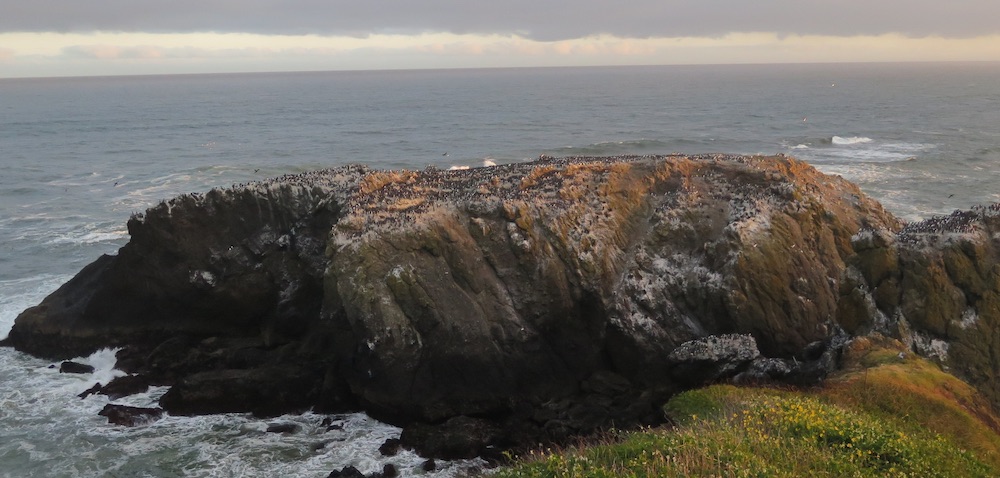
Murres typically nest in colonies on cliffs, off-shore sea stacks, and occasionally low lying predator free islands. Common murres use wider ledges and nest in very close proximity to each other while thick-billed murres prefer narrow ledges. Murres don’t build nests and simply lay their eggs on the rock ledge.

Common murres on Main Colony Rock at Yaquina Head, Newport Oregon. Photo R. Orben

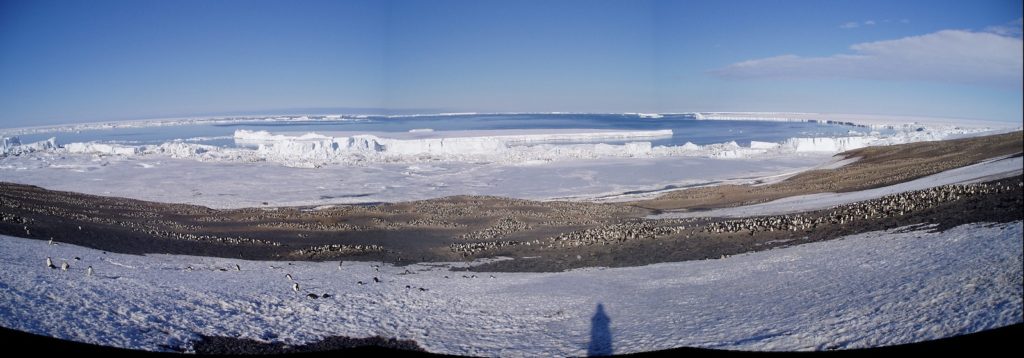
Penguin nesting colonies can take a variety of forms. Colonies of the “brush-tailed” penguins (chinstrap, Adélie and gentoo penguins) are found in places that are snow free for most of the summer. These colonies tend to form as a meandering collection of sub-colonies.  These species build nests out of small rocks that they diligently collect. The rocks help keep their eggs out of snow meltwater. Emperor and king penguins stand together in a group. Burrow nesting penguins like Magellanic penguins can spread their colonies out across large areas where there is suitable habitat for burrowing.

A small portion of the Adélie penguin colony at Cape Crozier, Antarctica. Photo R. Orben

Eggs

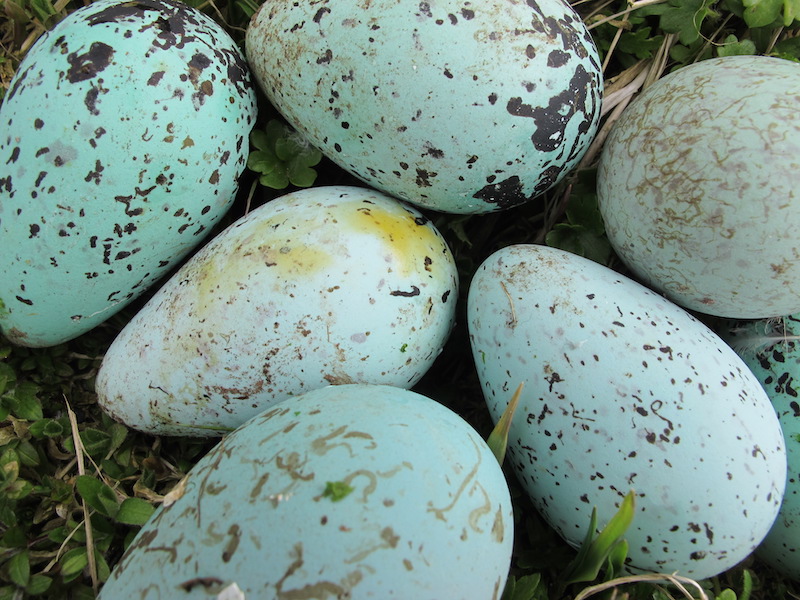
Murres lay one large pyriform (pear-shaped) speckled egg that ranges in color from pale cream to brilliant turquoise. This variation allows them to recognize their own eggs (Gaston et al 1993)! The purpose of the shape of murre eggs is something that has been continually puzzled over, but the shape appears to help the blunt end stay cleaner, is stronger, and is more stable on sloping surfaces (Birkhead et al. 2017, 2018).

Predated thick-billed murre eggs collected at the top of the cliffs on St. George Island, AK. Photo R. Orben

In comparison, penguin eggs don’t look that remarkable. Many penguin species lay two eggs (e.g. Adélie, chinstrap, rockhopper, gentoo), but king penguins and emperor penguins will just lay one, incubating it on top of their feet. The first egg that macaroni penguins lay is 55-75% smaller than their second egg, potentially due to constraints imposed by migration (Crossin et al. 2010).

Song

Seabirds are not generally known for their melodious songs, but they are still an important part of their social lives. For this comparison I recommend an exploration of the Cornell Lab of Ornithology’s Macaulay Library. Start with the murres and then explore some penguin species. Recently it was discovered that penguins make short noises underwater (Thiebault 2019). Perhaps murres do as well.

If you are interesting a hearing a seabird that can sing, search for Light Mantled Sooty Albatross.

Parent-Offspring Relationship

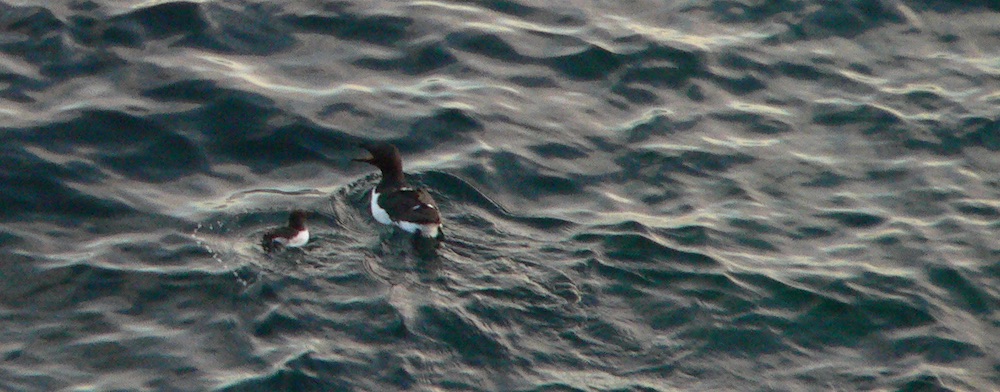
Murres bring whole fish back to the colony to feed their chick. One fish for each trip. Murre chicks fledge before their flight feathers are fully grown. They jump from the cliffs and glide down to the ocean (hopefully) where they are joined by their male parent. Then the pair paddle out to find good foraging grounds. The male parent needs to feed the growing chick frequently and by bringing the chick to the food is able to meet these demands.

The male parent greets its newly fledged chick. Late evening on St. Paul Island, Alaska. Photo R. Orben

In contrast, penguins regurgitate their stomach contents to feed their offspring. They are able to carry large amounts of food this way. For instance a chinstrap penguin might bring back ~610 grams of food, almost 15% of its body weight (Miller et al. 2010). Adult penguins still have to balance their needs and the demands of their growing chicks. So the adults will leave their chicks alone once they are large enough. The chicks stand in groups known as créches to help protect them against predators like skuas.

Molt

Feather molt is an important part of all birds’ life histories. Feathers don’t last forever and need to be replaced. Both murres and penguins have unique strategies for replacing their feathers. For any flighted bird, replacing primary feathers is especially important. Murres become flightless during molt, which happens in the fall (Birkhead & Taylor 1977). This is actually thought to help their diving as with smaller wings they should be able to fly underwater more easily (Thompson et al. 1998). They replace their body feathers gradually to maintain waterproofing and warmth.

Penguins have solved this problem in another way. Instead of gradually replacing their feathers they undergo a “catastrophic molt” and replace all their feathers at once. Penguins need to be out of the water during this time and will fast, so it is advantageous to quickly grow a new coat of feathers. They too molt after their chicks are fledged.

I will let you decide which seabirds you find most fascinating, because really I find them all amazing and in need of our continued protection.  Thanks for reading!

References

Birkhead TR, Taylor AM (1977) Moult of the Guillemot Uria aalge. Ibis 119:80–85

Birkhead TR, Thompson JE, Jackson D, Biggins JD (2017) The point of a Guillemot’s egg. Ibis 159:255–265

Burger, A. E. (1991). Maximum diving depths and underwater foraging in alcids and penguins. In Studies of High-Latitude Seabirds. 1. Behavioural, Energetic and Oceanographic Aspects of Seabird Feeding Ecology (ed. W. A. Montevecchi and A. J. Gaston), pp. 9-15. Canada: Canadian Wildlife Service Occasional Paper.

Crossin GT, Trathan PN, Phillips RA, Dawson A, Le Bouard F, Williams TD (2010) A Carryover Effect of Migration Underlies Individual Variation in Reproductive Readiness and Extreme Egg Size Dimorphism in Macaroni Penguins. Am Nat 176:357–366

Elliott KH, Ricklefs RE, Gaston AJ, Hatch SA, John R Speakmane F, Davoren GK (2013) High flight costs, but low dive costs, in auks support the biomechanical hypothesis for flightlessness in penguins. PNAS:9380–9384

Irons DB, Anker-Nilssen T, Gaston AJ, Byrd GV, Falk K, Gilchrist G, Hario M, Hjernquist M, Krasnov YV, Mosbech A, Olsen B, Petersen A, Reid JB, Robertson GJ, Strøm H, Wohl KD (2008) Fluctuations in circumpolar seabird populations linked to climate oscillations. Global Change Biology 14:1455–1463

Miller AK, Kappes MA, Trivelpiece SG, Trivelpiece WZ (2010) Foraging-Niche Separation of Breeding Gentoo and Chinstrap Penguins, South Shetland Islands, Antarctica. The Condor 112:683–695

Thiebault A (2019) First evidence of underwater vocalizations in hunting penguins. PeerJ:1–16

Thompson CW, Wilson ML, Melvin EF, Pierce DJ (1998) An unusual sequence of flight-feather molt in Common Murres and its evolutionary implications. The Auk 115:653–669

Sea lions eat prey bigger than their heads

By Rachael Orben, Assistant Professor (Senior Research), Seabird Oceanography Lab

There aren’t that many Steller sea lions that call the Pribilof Islands home. The way I learned to spot them, was to watch for excited groups of kittiwakes materializing out of nowhere, just off-shore. The kittiwakes circle, periodically dipping down to grab something from the water. Then a sea lion head emerges from the water and more often than not, the lion would have a flatfish. The sea lion whips the fish back and forth, splashing and causing pieces to break off. The kittiwakes drop down and pick up the little bits. The black-legged kittiwakes that we were tracking with GPS dataloggers often flew in laps around the island (Paredes et al. 2012, 2014); stopping at the outflow of the fish processing plant, and perhaps, also on the lookout for foraging Steller sea lions to pick up an extra snack.

A Steller’s sea lion with a small flock of kittiwakes viewed from the cliffs of St. George Island. Photo: R. Orben

Gape limitation

At first glance, one might assume that sea lions are gape-limited. What do I mean by this? Basically, gape limitation means that predators can’t consume anything that doesn’t fit into their mouths whole. This idea is typically considered in the context of fish but does come up in seabird and marine mammal ecology from time-to-time. Specifically, when a predator doesn’t have a method for pulling its prey apart so is required to consume it whole. For instance, seabirds that feed their chicks whole fish can encounter this problem (e.g. puffins, terns, murres). Small chicks can starve if parents are bringing back fish that are too large to fit into the gape of the chick.

Gape limitation of cartoon fishes. Art: R. Orben

Sea lions and their eclectic large prey

I don’t know if the flatfish consumed by the Steller sea lions are too large to be swallowed whole. But, I do know that they use a strategy known as ‘shake feeding’ (Kienle et al. 2017). This feeding style is important as it offers the behavioral mechanism that allows sea lions to consume prey that exceeds their gape limitations. When sea lions are observed eating large prey it often occurs in surprising circumstances, but I suspect this foraging tactic is fairly common (e.g. Hocking et al. 2016). I have compiled a few examples both from the scientific literature and the internet to see.

Observations

Galapagos sea lions and tuna. This example is amazing and features Galapagos sea lions working together to herd tuna into shallow lagoons. Compared to the sea lions, the tuna are large! (When you are done looking at the amazing photos please return and finish reading my blog.)

Besides the flatfish I observed Steller’s sea lions eating, there is an observation of a Steller catching a shark (the online photo account stops before the shark is consumed so I don’t know what happened) and catching and consuming northern fur seal pups (Gentry & Johnson, 1981).

Gentry & Johnson 1981, include a particularly gruesome description of the predation events: “Fur seal young most often were caught by the abdomen and eviscerated with a sideways shake of the sea lion’s head (in the same manner used to tear apart large fish). Sea lions most often dived with the prey still moving and surfaced father offshore, usually beyond the kelp beds, with the pup motionless. …Larger sea lions broke apart their prey under water, surfacing only to swallow large bits of tissue. Smaller sea lions vigorously shook the carcass at the surface using the same sideways snapping motion used to eviscerate the pup at capture.”

Photo of a Steller Sea Lion and its prey: a northern fur seal pup. Photo: Gentry & Johnson 1981.

I found a fascinating series of photographs of a California Sea Lion and a Mola Mola. It is a little hard to tell what is going on, but the photographer has labeled his photos “A California Sea Lion kills, and eats, a Mola Mola”.

Southern sea lions consume large prey in the form of penguins and more surprisingly fur seals. Thus far these observations are limited to males.

Eating octopus

Sea lions also use shake feeding to consume octopus. Though an octopus might be smalled enough to be eaten in one gulp, they are a smart and agile prey whose tentacles make them harder to swallow. I have seen Southern sea lions flipping octopus at the surface using the ‘shake feeding’ mode. Once I watched a young juvenile bring one ashore to eat (photos below). Perhaps foraging on octopus offers some opportunities for learning how to eat large prey?

References

Gentry, R. L., & Johnson, J. H. (1981). Predation by sea lions on northern fur seal neonates. Mammalia, 45(4), 423–430. http://doi.org/10.1515/mamm.1981.45.4.423

Hocking DP, Ladds MA, Slip DJ, Fitzgerald EMG, Evans AR (2016) Chew, shake, and tear: Prey processing in Australian sea lions (Neophoca cinerea). Marine Mammal Sci 33:541–557

Kienle SS, Law CJ, Costa DP, BERTA A, Mehta RS (2017) Revisiting the behavioural framework of feeding in predatory aquatic mammals. Proc Biol Sci 284:20171035–4

Paredes R, Harding AMA, Irons DB, Roby DD, Suryan RM, Orben RA, Renner HM, Young R, Kitaysky AS (2012) Proximity to multiple foraging habitats enhances seabirds’ resilience to local food shortages. Mar Ecol Prog Ser 471:253–269

Paredes R, Orben RA, Suryan RM, Irons DB, Roby DD, Harding AMA, Young RC, Benoit-Bird KJ, Ladd C, Renner H, Heppell S, Phillips RA, Kitaysky AS (2014) Foraging Responses of Black-Legged Kittiwakes to Prolonged Food-Shortages around Colonies on the Bering Sea Shelf. PLoS ONE 9:e92520

Midway Atoll: the next two weeks at the largest albatross colony in the world (two years later)

By Rachael Orben, Assistant Professor (Senior Research), Seabird Oceanography Lab

This February I had the opportunity to spend two weeks at Midway Atoll National Wildlife Refuge in the Papahānaumokuākea Marine National Monument. I was there to GPS track black-footed and Laysan albatross during their short chick-brooding foraging trips. Two weeks is just enough time since the albatross are taking short trips (3-5 days) to feed their rapidly growing chicks.

My first visit to Midway (2016 blog post) occurred right as the black-footed albatross chicks were hatching (quickly followed by the Laysan albatross chicks). This time, we arrived almost exactly when I had left off. The oldest chicks were just about two weeks old. This shift in phenology meant that, though subtle, each day offered new insights for me as I watched chicks transform into large aware and semi-mobile birds. By the time we left, unattended chicks were rapidly multiplying as the adults shifted to the chick-rearing stage. During chick rearing, both parents leave the chick unattended and take longer foraging trips.

Our research goal was to collect tracking data from both species that can be used to address a couple of research questions. First of all, winds can aid, or hinder albatross foraging and flight efficiency (particularly during the short brooding trips). In the North Pacific, the strength and direction of the winds are influenced by the ENSO (El Niño Southern Oscillation) cycles. The day after we left Midway, NOAA issued an El Niño advisory indicating weak El Nino conditions. We know from previous work at Tern Island (farther east and farther south at 23.87 N, -166.28 W) that El Niño improves foraging for Laysan albatrosses during chick brooding, while during La Niña reproductive success is lower (Thorne et al., 2016). However, since Midway is farther north, and farther west the scenario might be different there. Multiple years of GPS tracking data are needed to address this question and we hope to return to collect more data next year (especially if  La Niña follows the El Niño as is often the case).

We will also overlap the tracking data with fishing boat locations from the Global Fishing Watch database to assess the potential for birds from Midway to interact with high seas fisheries during this time of year (project description, associated blog post). Finally, many of the tags we deployed incorporated a barometric pressure sensor and the data can be used to estimate flight heights relative to environmental conditions such as wind strength. This type of data is key to assessing the impact of offshore wind energy (Kelsey et al., 2018).

How to track an albatross

To track an albatross we use small GPS tags that we tape to the back feathers. After the bird returns from a foraging trip, we remove the tape from the feathers and take the datalogger off. Then we recharge the battery and download the data!

This research is a collaboration between Lesley Thorne (Stony Brook University), Scott Shaffer (San Jose State University), myself (Oregon State University), and Melinda Conners (Washington State University). The field effort was generously supported by the Laurie Landeau Foundation via the Minghua Zhang Early Career Faculty Innovation Fund at Stoney Brook University to Lesley Thorne.

My previous visit to Midway occurred just after house mice were discovered attacking incubating adult albatrosses. Since then, a lot of thought and effort had gone into developing a plan to eradicate mice from Midway. You can find out more via Island Conservation’s Midway blogs and the USFWS.

References

Kelsey, E. C., Felis, J. J., Czapanskiy, M., Pereksta, D. M., & Adams, J. (2018). Collision and displacement vulnerability to offshore wind energy infrastructure among marine birds of the Pacific Outer Continental Shelf. Journal of Environmental Management, 227, 229–247. http://doi.org/10.1016/j.jenvman.2018.08.051

Thorne, L. H., Conners, M. G., Hazen, E. L., Bograd, S. J., Antolos, M., Costa, D. P., & Shaffer, S. A. (2016). Effects of El Niño-driven changes in wind patterns on North Pacific albatrosses. Journal of the Royal Society Interface, 13(119), 20160196. http://doi.org/10.1098/rsif.2016.0196

Surprises from the field: Winter in the Falkland Islands

By Rachael Orben, Assistant Professor, Seabird Oceanography Lab

Fieldwork often comes with the unexpected. It is the reason why field work is so exciting – not only discovering something new about a species and ecosystem, but it is also often the catalyst for the development of novel ideas and projects. However, designing a successful field campaign to a new location (and acquiring funding) requires preconceived expectations that are not too far off from reality. Working with colonial breeding seabirds and pinnipeds has its advantages since these animals are predictably found at their colonies during the breeding period.  However, breeding failures can be worse than expected (see my blog on red-legged kittiwakes) and as I just learned, sometimes almost everything can be surprising.

At the end of August, I returned from a 6-week winter field campaign on Bird Island in the Falkland Islands led by Dr. Alastair Baylis a Senior Research Fellow at the South Atlantic Environmental Research Institute. We were there to study the fine-scale foraging ecology of South American fur seals. Despite a healthy research community in the Falklands, very little is known about South American fur seals in the region. Our time on Bird Island was probably the first time people had been on the island in winter since the days of sealing.

So, what did I find surprising?

I will list them here from slightly mundane to the very surprising.

1) First of all, it was winter and I expected it to be cold.

This is probably a case of me not doing my pre-field season research, but it was pleasantly not as cold as I expected. Generally, the temperatures were above freezing, which made doing everything much easier. Of course, I still wore lots of layers and drank lots of hot drinks, but overall it was fairly mild.  It was also less windy and less rainy than I had imagined and we had some beautiful sunny days.

2) I had hay fever!

Not something usually anticipated for winter field work, but the tussac grass was flowering and that left me with itchy eyes, a stuffy nose and lots of sneezes. I should mention that tussac grass is everywhere and many of the tussacs are taller than a person!

Now for the science surprises.

3) FEMALE Fur Seals took foraging trips That were much longer than we had anticipated.

We had a couple of females leave the colony and go on foraging trips for 10 days, others for ~2 weeks, and others for over 3 weeks! Previous work on the island indicated that female fur seals might take 4.1­ +/- 2 day trips (Thompson et al. 2003). Fortunately, we were on the island for the long-haul (6-weeks shower free) so we were able to wait them out and retrieve the tags (and the data) when the females came home. The differences in trip duration could simply reflect annual changes in prey availability, but we know very little about what fur seals are eating, especially during the winter (Baylis et al. 2013).

4) albatrosses were attending their colony.

As a reminder, this was the middle of winter. Generally, black-browed albatrosses do not return to their colonies until September since they lay eggs in October (Strange, 1992). There weren’t many birds the day we arrived in mid-July (n=9), but even so, that was odd enough that I began taking photos of the colony each day with the plan to count birds and quantify colony attendance.

…and for the most surprising of all…

5) South American Sea Lions males were killing and eating female South American fur seals!

We were slow to realize what was happening since it was so unexpected. After we deployed our tracking tags on fur seals we spent many hours at the colony simply observing. We started to see things that didn’t quite make sense. Females cautiously approaching the water. Male sea lions hanging out in the water. Then Dr. Baylis saw a male sea lion go up into the colony and grab a pup and eat it! Shortly after that, we saw two male sea lions chase a female out of the water and up the hill towards the colony. One male eventually came back down to a tide pool with a female he had killed in his mouth. From that point, it because very clear what was happening and we saw multiple kills.

It is unknown how often male southern sea lions eat fur seals, but it has been observed in the Falklands before, both in the 1970s and in more recent years (Gentry & Johnson 1981).  Worldwide, sea lions are known to occasionally eat fur seal pups (Gentry & Johnson 1981, Harcourt 1993, Bradshaw et al. 1998), but people have rarely observed sea lions predating females.

Our three scientific surprises are really what field work is all about. We came home with the tracking data we were hoping for and we came home with something arguably more valuable. We can use these new observations to make informed hypotheses about how marine predators fit into the ecosystem in ways that before our visit to Bird Island we would have never have expected. Hopefully, we will have a chance to go back!

References

Baylis AMM, Arnould JPY, Staniland IJ (2013) Diet of South American fur seals at the Falkland Islands. Marine Mammal Sci 30:1210–1219

Bradshaw CJA, Lalas C, Mcconkey S (1998) New Zealand sea lion predation on New Zealand fur seals. New Zealand Journal of Marine and Freshwater Research 32:101–104

Gentry RL, Johnson JH (1981) Predation by sea lions on northern fur seal neonates. Mammalia 45

Harcourt R (1993) Individual variation in predation on fur seals by southern sea lions (Otaria byronia) in Peru. Canadian Journal of Zoology 71:1908–1911

Strange, IJ (1992) Field Guide to the Wildlife of the Falkland Islands and South Georgia (Collins Pocket Guide)

Thompson DR, Moss S, Lovell P (2003) Foraging behaviour of South American fur seals Arctocephalus australis: extracting fine scale foraging behaviour from satellite tracks. Mar Ecol Prog Ser 260:285–296

When are seabirds at their breeding colonies?

By Rachael Orben PhD., Research Associate in the Seabird Oceanography Lab and GEMM Lab

When are seabirds at their breeding colonies? 

As the weather warms-up, and spring arrives to the Oregon Coast, seabirds (and seabird biologists) are starting to get busy. One vital task is monitoring annual trends in seabird abundance. Identifying whether seabird populations have increased, declined or remained stable over time is an important ecosystem indicator and a conservation management metric.

Most seabirds arrive at breeding colonies just prior to egg laying, and then leave after their chicks fledge. Within this time seabirds reunite with their mate, defend their nesting territory, build a nest, lay eggs, and feed their chicks. Biologists often count individual birds or nests to estimate population size. This method works well when birds are nesting in easy to observe locations. However, seabirds often nest on inaccessible cliff faces, or in underground burrows. How do we count these difficult to reach and difficult to see species?

This is an important challenge, because burrow nesting seabirds comprise roughly 45% of all seabird species, yet typically little is known about colony specific population trends of these species. 

This slideshow requires JavaScript.

Metrics of abundance

For these cases where counts of seabirds are logistically difficult, the alternative metric of colony attendance becomes important.  Like count data, a meaningful index of abundance can be compared from year to year to follow population changes. For burrow nesting seabirds, this is probably the best method to understanding population dynamics. But, abundance metrics, counts of birds or calls, are complicated and can be influenced by multiple factors, including weather, predators, time of day, time of the breeding cycle, and proportion of non-breeders in a population. (Harding et al. 2005, Cadiou 2008, Mallory et al. 2009).

I conducted a quick search for scientific papers in the Web of Science database and found that although colony attendance is assessed in seabird studies, it is currently nowhere near as “hot” a research topic as tracking the spatial movements of seabirds. This pattern makes sense when you consider the importance of understanding where birds find their food, and that the tracking technology to do this was not available until the early 2000s (Burger & Shaffer 2008). We are still at a point where new species are being tracked as technology improves, and movement patterns are revealing the many facets of seabird ecology.

This slideshow requires JavaScript.

Developing Technology

Technology has also improved for monitoring colony attendance. Instead of sitting at a puffin colony in the wind and rain making repeated counts throughout the day, biologists can now use cameras or even acoustic recorders to record activity (Huffeldt & Merkel 2013, Borker et al. 2015). Then the data processing and counting happen back in the office (with a warm cup of coffee in hand). Through automated processing of sound and image files suddenly seabird colony attendance becomes a “Big Data” problem (see red-legged kittiwake detection with Azure ML Workbench).

Selected images from a trail camera set up to monitor Leach’s storm petrels. Photos: Seabird Oceanography Lab.

There is much we still don’t know about when and why seabirds attend their breeding colonies, and these new tools have much to offer in terms of data quantity. With dense datasets, it becomes possible to tease apart multiple factors that sometimes make interpretation challenging. Colony attendance data has many uses, including testing for anthropogenic effects, understanding seabird responses to weather, and detecting changes in populations over time. If you are reading this consider using cameras or acoustic recorders to monitor colony attendance at your favorite seabird colony!

References

Borker AL, Halbert P, McKown MW, Tershy BR, Croll DA (2015) A comparison of automated and traditional monitoring techniques for marbled murrelets using passive acoustic sensors. Wildlife Society Bulletin 39:813–818

Burger AE, Shaffer SA (2008) Application of Tracking and Data-Logging Technology in Research and Conservation of Seabirds. The Auk 125:253–264

Cadiou B (2008) Attendance off breeders and prospectors reflects the quality off colonies in the Kittiwake Rissa tridactyla. Ibis 141:321–326

Harding AMA, Piatt JF, Byrd GV, Hatch SA, Konyukhov NB, Golubova EU, Williams JC (2005) Variability in Colony Attendance of Crevice- Nesting Horned Puffins: Implications for Population Monitoring (Peterson, Ed.). Journal of Wildlife Management 69:1279–1296

Huffeldt NP, Merkel FR (2013) Remote Time-lapse Photography as a Monitoring Tool for Colonial Breeding Seabirds: A Case Study Using Thick-billed Murres (Uria lomvia). Waterbirds 36:330–341

Mallory ML, Gaston AJ, Forbes MR, Gilchrist HG (2009) Factors Influencing Colony Attendance by Northern Fulmars in the Canadian Arctic. Arctic 62:151–158


Do I have the time?

By Rachael Orben PhD., Research Associate in the Seabird Oceanography Lab and GEMM Lab

So, there is something called work-life balance. I am still trying to find mine.

As an undergraduate it was easy. I sailed a lot and my grades suffered. In hindsight that was the best choice I could have made.  I learned to sail, spent time on the water and in the end, I think I turned out ok. Following that I spent ~7 years working as a field technician in remote, stunningly beautiful places, with lots of seabirds. I would sum these years up as having very little life balance with lots of experience.

From there I started grad school. At age 29, I relearned how to live in a town and bought my first car. I spent 5.5 years in grad school, but 14 months of this time were spent in the field (not all for my PhD research). During the last phase of my PhD I was often too mentally exhausted on the weekends to even consider trying to write or to analyze data.  I tracked my working hours with RescueTime and I found that after a weekend at play my Monday at work was often very focused and productive. Then through the week my productivity would drop.

That seemed promising. Playing more equaled more efficient work hours. The tales are true.

And then I started post doc life.  A new town, more rain, and more projects that come with deadlines. For the most part, my attempts for a work-life balance went out the window as I adjusted to the new locale. I still do field work and within that experience I can catch my academic breath – while working just as hard.

Evening on High Bluffs, St. George AK

One can read ad nauseam about struggles academic scientists have balancing work and life. There is lots of sage advice out there (e.g. here) and dismay with a system that asks so much of a person (here). As I continue on this career path I know that demands on my time will only become more and more frequent. There is a part of me that likes the idea of curling up on a rainy Saturday morning and crunching out some data analysis even though in the long run this probably isn’t a good approach. And maybe that is the problem – I love most of what I do!

For now, I am still learning. What do I focus on? What do I spend my time on? How do I meet deadlines without a dose of panic? How do I restrain my growing to-do list?

**In order to make sure that I didn’t over or under achieve on this blog post I asked the internet ‘how long should a blog post be?’  It turns out the answers are varied.  But somewhere between 700 and 1,600 words is a good target. I made it to 488.  Today there is a dog that wants a walk, a talk to be written, a manuscript to revise, dinner to cook…

Walking along the Oregon Coast.


Meeting to disentangle factors influencing albatross bycatch in the deep-set Hawaii Longline Fishery

By Rachael Orben PhD., Research Associate in the Seabird Oceanography Lab and GEMM Lab

Seabird bycatch is a global problem (e.g. Anderson et al 2011). Humans like eating fish and seabirds do too. Fishing vessels provide a food source for seabirds through discards, bait, and target fish. Different types of fishing gear pose different risks for seabirds. The good news is there are things that we can do to decrease these risks.

Albatrosses and petrels are particularly vulnerable to being hooked by longlines as the baited hooks are set overboard. Albatrosses and petrels are long lived (e.g., Wisdom the 65-year-old Laysan Albatross) and have a limited number of off-spring. Therefore fishery mortalities can have devastating impacts on populations if left unchecked. Currently all 22 species of albatrosses have IUCN statuses ranging from Near Threatened to Critically Endangered.

North Pacific Albatrosses

Longlines are used to catch a number of target species including tuna, swordfish, halibut, black cod, and toothfish. Just like the diversity of species this type of fishing gear is used to catch, there are a number of ways to set long-lines and ways to mitigate seabird bycatch and a method that works well in one instance may not work so well in other places. Tori Lines (a.k.a. streamer lines), side setting, night setting, faster sinking lines, and discard regulations are a few of the methods used.

Tori lines work by scaring birds away from baited longline hooks while they sink. Once the hooks sink past a few meters albatrosses are not able to reach them. Photo by Ed Melvin/Washington Sea Grant

In early November, I had the opportunity to attend a workshop in Honolulu, Hawaii hosted by the Western Pacific Regional Fishery Management Council. The workshop was held due to a dramatic increase in black-footed albatross bycatch by the Hawaii deep-set longline fishery in 2015 and 2016 (see the figure below). It was our job to figure out why, or more realistically pave the path for future analysis and data collection to answer this question.

Recently Leigh Torres and I were funded by the NOAA Bycatch Reduction Engineering Program to characterize fine-scale fishery-albatross interactions using previously collected albatross tracking data and tracks of fishing boats processed in real time by Global Fishing Watch. The workshop provided the perfect opportunity for me to learn more about the Hawaii longline fisheries.

Reasons for Albatross Bycatch

Rates of bycatch can change due to many factors, including where or when the fish are being caught, subtle choices made by fishermen, changes in seabird distributions, changes in prey of fish or seabirds, and so on. So, it can be very challenging to pin-point the exact reasons for an increase in bycatch. But, across the North Pacific, 2015 and 2016, were very strange years oceanographically. There was the warm water phenomena known as ‘the Blob’ along with a strong El Niño, and a positive Pacific Decadal Oscillation (PDO). So perhaps, bycatch levels will drop off again as we move into a La Niña, but perhaps not. It is good to know that fishery managers and scientists are paying attention.

Implications

From the perspective of the fisherman in the Hawaiian longline fleet, albatrosses are hardly ever caught; they are pulled in at a barely perceptible level of less than one bird per set and only from about December to July. Although one occasional dead bird among the menagerie of fish doesn’t seem like much, it can add up: there are ~140 boats in the deep-set longline fleet, that set 40-52 million hooks a year, plus the multiple other fisheries and fleets encountered by albatrosses across the North Pacific, and enough albatrosses could be killed to make a difference in their population numbers. And, we need to also consider the cumulative impacts since fisheries aren’t the only threat  (e.g., sea level rise, storm surges, introduced predators; see Bakker et al 2018).

Inspecting the Catch

On the morning of the last day of the workshop we took a field trip to the Honolulu Fish Market at Pier 38 in Honolulu where the Hawaiian long-line fishing vessels dock to offload and sell their catch. We checked out some of the boats, watched fish being craned off a vessel into a large cart and went inside the cooler room to see where the fish are auctioned.

In the cooler room, the catch from one vessel was laid out on brilliant blue pallets. The tails of each tuna were sliced so the deep pink color of the meat could be assessed. A core sample of each fish was laid out on an identification tag. Then the auctioneer and the buyers visited each fish, rapidly bidding on a price per pound. Their quick words were basically incomprehensible to my untrained ear.

The prize-catch of the fishery, and the fish that gets the highest price per pound, is the big eye tuna. A number of other large and beautiful pelagic species are also caught and sold including: long and narrow marlins, with their bills cut off for packing, side table size pomfrets, speckled white with red accents; and the distinctive blunt headed mahimahi, with yellow bellies. Once the fish are sold, they are moved out of the auction room, packed and loaded into the trucks that whisk them away toward markets and restaurants in Hawaii, the U.S. Mainland, and beyond.

Sustainable management of these commercially valuable fish is dependent on a better understanding of their pelagic ecosystem, including when, where, and why albatrosses interact with fishing vessels. Hopefully, our current research project will help to answer some of these questions.

Where are the eggs? Studying red-legged kittiwakes in a time of change

By Rachael Orben, Research Associate, Department of Fisheries and Wildlife, Oregon State University

In late May, I returned to St. George Island, Alaska to study the foraging ecology of red-legged kittiwakes using a mix of high-tech biologging tags, physiology measurements, and observations.  The study was designed to identify differences in behavior and physiology between birds that reproduce successfully and birds that don’t and then to see how this might carry over to the winter season (and vice versa).  Things didn’t go as planned.

A red-legged kittiwake on St. George Island. Photo C. Kroeger

This was my fourth spring on the island, and like prior seasons we arrived in late May, when birds should be building nests. However, unlike previous seasons, red-legged kittiwake’s didn’t look like they had done much nest building. I was accompanied by Abram Fleishman, a superstar MS student from San Jose State who is studying the winter spatial ecology of red-legged kittiwakes in relationship to mercury concentration in their feathers.

We immediately set about recapturing birds that had carried geolocation data loggers over the winter. We wanted to catch as many as possible before eggs were laid, so that their blood samples would represent the pre-lay period. The weather was wonderful, so it wasn’t until three weeks after we arrived that we had our first day-off. It was at about this time that I finally lost my optimism and realized the majority of red-legged kittiwakes were not going to lay eggs. By late June kittiwakes are usually incubating eggs. We only saw a handful of eggs and very few of these were being incubated. Most birds didn’t even build nests, or if they did, the nest was dismantled by other birds when the nest building pair didn’t stick around to guard their pile of mud and moss.

Nests in 2016. Laying success was also low in 2016, but even if birds didn’t lay many pairs built nests.

Same cliff (and birds) without nests in 2017.

When I designed the study, I thought collecting enough data to answer my questions about successful versus failed breeders would be hard, since failed breeders would be challenging to work with and red-legged kittiwakes typically have high breeding success, meaning that sample sizes of failed breeders would be small. Instead our three seasons occurred with progressively worse breeding success and we will now have to shift the focus of our analysis to see if we can find differences between birds that laid eggs and birds that didn’t, if we have the sample sizes! With ~80% laying success in the 9 years preceding the beginning of our study in 2015, this is something I would never have expected! The egg laying failure of 2017 is unprecedented in the productivity monitoring time series collected by the Alaska Maritime Wildlife Refuge.

Seabirds are often touted as indicator species of marine health (Cairns 1988, Piatt et al 2007), and while there are always caveats and additional questions to be answered, seabirds are reliant on the ocean for food and observing their behavior and condition tells us something about how easy (or hard) it is for them to find food.

So, what do I think the red-legged kittiwakes told us this year? I think they were squawking loud and clear, that they were not able to find myctophid fishes within their foraging range to the south and west of the Pribilofs. Myctophids are small fatty mesopelagic bioluminescent fish that come to the surface at night where red-legged kittiwakes catch them.

Besides just observing the laying failure, we were able to GPS track a few birds, collect a few diet samples, catch birds for blood and feather samples, and resight banded individuals. It is these pieces of information that I will be analyzing in the coming months to try to understand why some individuals were able to lay eggs during our study years, while most were not.  These years should also help us understand what capacity red-legged kittiwakes have to cope (or not) with changes in prey availability. However, after three years, I still don’t know what a ‘good’ year looks like for red-legged kittiwakes. Fingers crossed next season is finally a decent year for this sentinel seabird of the pelagic Bering Sea.

Pre-lay foraging trips of red-legged kittiwakes in 2015.

Pre-lay foraging trips of red-legged kittiwake in 2017. Two birds were heading north when their GPS loggers stopped recording.

You can read more about our red-legged kittiwake research in a series of blog posts written for the Seabird Youth Network, a partnership between the Pribilof School District, the Aleut Community of St. Paul Island, the City of St. Paul, Tanadgusix Corporation, the St. George Traditional Council, St. George Island Institute, the Alaska Maritime National Wildlife Refuge, and the wider scientific community. The network creates opportunities for youth to learn about seabirds with the aim of building local capacity for the collection of long-term seabird monitoring data on the Pribilof Islands.

Simple behavior classification of tracking data with residence in space and time

By Rachael Orben PhD., Postdoctoral Scholar in the Seabird Oceanography Lab and the Geospatial Ecology and Marine Megafauna Lab 

At 2pm, Jan 3, our paper entitled “Classification of Animal Movement Behavior through Residence in Space and Time” was published. At 14:03 I clicked on the link and there it was, type-set and crisp as a newly minted Open Access scientific contribution.

So, what is this paper about? It presents a simple – yes simple – method of identifying simple behaviors states in two-dimensional animal tracking data (think latitude and longitude). Since the paper is open access you can go find the methods there. Categorizing these “dots on a map” into behaviors allows us to ask questions about how often, why, when and where simple behaviors happen. These behaviors really are simple (hopefully the somewhat grating repetitiveness of the word ‘simple’ has driven that point home by now!). We are identifying three basic, but fundamental, states:

1) transit, characterized by fast somewhat straight line movement from a to b,

2) a sedentary state characterized by relatively more time spent in an area with little distance traveled (such as resting behavior) and

3) an active state characterized by lots of time spent in an area where an animal is also moving around a lot and covering a lot of ground.

This new method, that we termed Residence in Space and Time (RST), can assist the fast-growing, sophisticated, big-data generating, conservation-orientated field of animal movement ecology. One of the first hurdles is data exploration and visualization. Modern ecologists deploy tracking devices that collect location data remotely to understand animal distribution and behavior. But at first glance tracks (like the figure below) can look like spaghetti dinner. Identifying movement behaviors can help to us see patterns in the tangles.

24 GPS tracks of grey-headed albatross incubation foraging trips; tracked from Campbell Island, New Zealand.

So how might this method work? First, let’s start with a track. Below is a very short foraging trip from a thick-billed murre tracked with a GPS logger during chick rearing from St. Paul Island in Alaska (see Parades et al 2015).

p1080393
A thick-billed murre (Uria lomvia), St. Paul Island, Alaska.

The track below has points every second and we can imagine the murre flying from the colony, landing on the water, and then diving (indicated by the lack of GPS position data when the bird dives below the water to forage). Then the bird flies back to the colony to feed its chick. This trip is roughly 14 minutes long.

murretrack

So I can take this track and run RST to identify three behavior states. As color-coded below, the black points indicate transit, red indicates relatively stationary behavior, and blue indicates points where the bird was flying in a less direct manner than pure transit potentially circling around before landing and moving between dives. The high resolution of the GPS data really helps us to understand how this bird was moving. Such behavior information is easily conserved in a high-resolution track like this. Though in this case, the bird did a lot of transiting and only exhibited different movement behaviors in the vicinity of the two dives.

murretrack_1sec_rst-copy

Logging locations at 1-second intervals is a stretch for the battery life of these miniaturized GPS loggers (~15g), and more often than not we would like the loggers to last much longer than 14 mins. So instead of 1 second we typically have tracks with less frequent locations. To me, this is akin to taking a 1-second track and then taking off my glasses and trying to see the same behaviors. Deciphering behavior states becomes a bit (or a lot) fuzzier. In the case of this murre track, when we down-sample the locations to every 10 seconds much of the resolution of this track is lost (see plot below). What happens when we run RST?

murretrack_10sec_rst-copy

As you can see some of the behavior is maintained and some of it is a bit fuzzier.

A good rule of thumb is that if a behavior happens faster than the sampling interval the logger is recording at, then the behavior is not recorded. Seems simple, but it is an important consideration when programming loggers and designing animal movement studies. For murres, these quick trips to forage for their chicks are easily lost even at a 5-minute sampling interval, which is often used in seabird tracking studies where the birds are at sea for days. Often we work with such lower resolution location data and, instead of one trip from one bird, we have many trips from many individuals. RST allows a fast way to quickly and accurately identify simple behaviors in order to help with initial data exploration efforts and for answering more complex questions such as behavior specific habitat models.

So, if you have some tracking data – of birds, marine mammals, or your dog! – you can learn how RST works (basically by summing up time and distance covered within a circle). I keep an updated version of the R code, a short guide, an example dataset on a GitHub repository: https://github.com/raorben/RST.

Here is the spaghetti from above (tracks of Grey-headed albatrosses) with the behavioral states labeled using RST:  93,481 points and this behavior classification took only 14 seconds to run!  albatrosstracks_rst