The learning curve never stops as the GRANITE project begins its seventh field season

Clara Bird, PhD Student, OSU Department of Fisheries, Wildlife, and Conservation Sciences, Geospatial Ecology of Marine Megafauna Lab

When I thought about what doing fieldwork would be like, before having done it myself, I imagined that it would be a challenging, but rewarding and fun experience (which it is). However, I underestimated both ends of the spectrum. I simultaneously did not expect just how hard it would be and could not imagine the thrill of working so close to whales in a beautiful place. One part that I really did not consider was the pre-season phase. Before we actually get out on the boats, we spend months preparing for the work. This prep work involves buying gear, revising and developing protocols, hiring new people, equipment maintenance and testing, and training new skills. Regardless of how many successful seasons came before a project, there are always new tasks and challenges in the preparation phase.

For example, as the GEMM Lab GRANITE project team geared up for its seventh field season, we had a few new components to prepare for. Just to remind you, the GRANITE (Gray whale Response to Ambient Noise Informed by Technology and Ecology) project’s field season typically takes place from June to mid-October of each year. Throughout this time period the field team goes out on a small RHIB (rigid hull inflatable boat), whenever the weather is good enough, to collect photo-ID data, fecal samples, and drone imagery of the Pacific Coast Feeding Group (PCFG) gray whales foraging near Newport, OR, USA. We use the data to assess the health, ecology and population dynamics of these whales, with our ultimate goal being to understand the effect of ambient noise on the population. As previous blogs have described, a typical field day involves long hours on the water looking for whales and collecting data. This year, one of our exciting new updates is that we are going out on two boats for the first part of the field season and starting our season 10 days early (our first day was May 20th). These updates are happening because a National Science Foundation funded seismic survey is being conducted within our study area starting in June. The aim of this survey is to assess geophysical structures but provides us with an opportunity to assess the effect of seismic noise on our study group by collecting data before, during, and after the survey. So, we started our season early in order to capture the “before seismic survey” data and we are using a two-boat approach to maximize our data collection ability.

While this is a cool opportunistic project, implementing the two-boat approach came with a new set of challenges. We had to find a second boat to use, buy a new set of gear for the second boat, figure out the best way to set up our gear on a boat we had not used before, and update our data processing protocols to include data collected from two boats on the same day. Using two boats also means that everyone on the core field team works every day. This core team includes Leigh (lab director/fearless leader), Todd (research assistant), Lisa (PhD student), Ale (new post-doc), and me (Clara, PhD student). Leigh and Todd are our experts in boat driving and working with whales, Todd is our experienced drone pilot, I am our newly certified drone pilot, and Lisa, Ale, and myself are boat drivers. Something I am particularly excited about this season is that Lisa, Ale, and I all have at least one field season under our belts, which means that we get to become more involved in the process. We are learning how to trailer and drive the boats, fly the drones, and handling more of the post-field work data processing. We are becoming more involved in every step of a field day from start to finish, and while it means taking on more responsibility, it feels really exciting. Throughout most of graduate school, we grow as researchers as we develop our analytical and writing skills. But it’s just as valuable to build our skillset for field work. The ocean conditions were not ideal on the first day of the field season, so we spent our first day practicing our field skills.

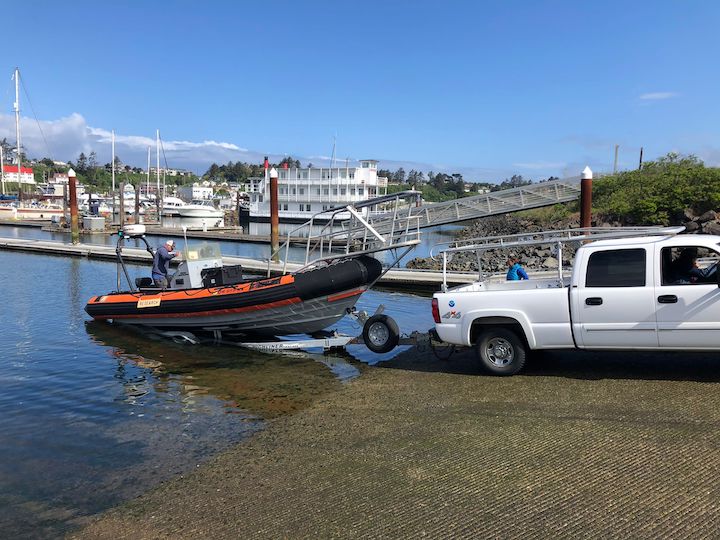
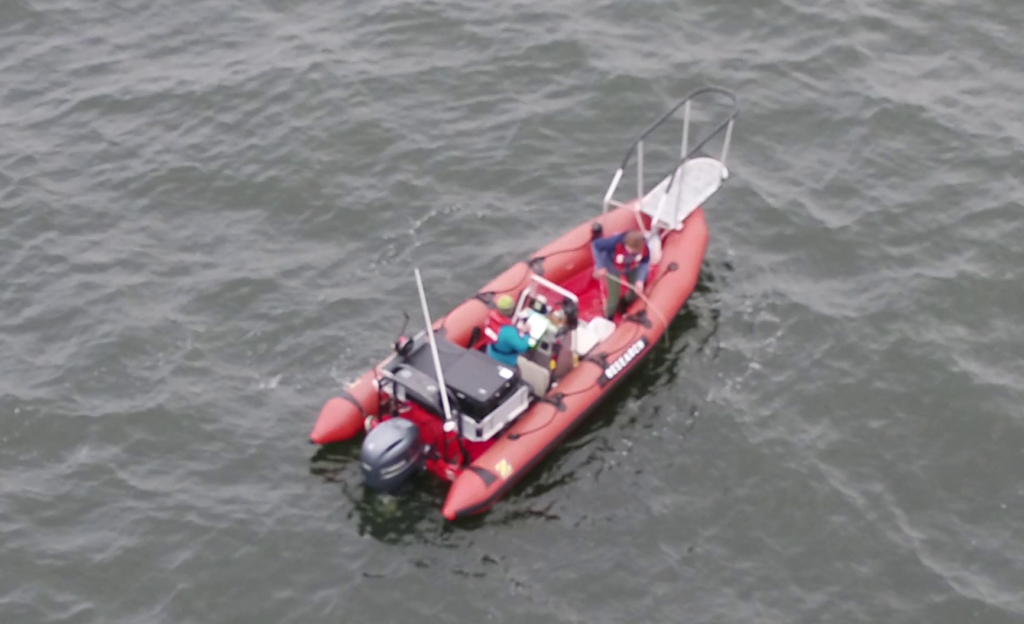
For our “dry run” of a field day, we went through the process of a typical day, which mostly involved a lot of learning from Leigh and Todd. Lisa practiced her trailering and launching of the boat (figure 1), Ale and Lisa practiced driving the boat, and I practiced flying the drone (figure 2). Even though we never left the bay or saw any whales, I thoroughly enjoyed our dry run. It was useful to run through our routine, without rushing, to get all the kinks out, and it also felt wonderful to be learning in a supportive environment. Practicing new skills is stressful to say the least, especially when there is expensive equipment involved, and no one wants to mess up when they’re being watched. But our group was full of support and appreciation for the challenges of learning. We cheered for successful boat launchings and dockings, and drone landings. I left that day feeling good about practicing and improving my drone piloting skills, full of gratitude for our team and excited for the season ahead.

Figure 1. Lisa (driving the truck) launching the boat.
Figure 2. Clara (seated, wearing a black jacket) landing the drone in Ale’s hands.

All the diligent prep work paid off on Saturday with a great first day (figure 3). We conducted five GoPro drops (figure 4), collected seven fecal samples from four different whales (figure 5), and flew four drone flights over three individuals including our star from last season, Sole. Combined, we collected two trifectas (photo-ID images, fecal samples, and drone footage)! Our goal is to get as many trifectas as possible because we use them to study the relationship between the drone data (body condition and behavior) and the fecal sample data (hormones). We were all exhausted after 10 hours on the water, but we were all very excited to kick-start our field season with a great day.

Figure 3. Lisa on the bow pulpit during our first sighting of the day.
Figure 4. Lisa doing a GoPro drop, she’s lowering the GoPro into the water using the line in her hands.
Figure 5. Clara and Ale collecting a fecal sample.

On Sunday, just one boat went out to collect more data from Sole after a rainy morning and I successfully flew over her from launching to landing! We have a long season ahead, but I am excited to learn and see what data we collect. Stay tuned for more updates from team GRANITE as our season progresses!

The right tool for the job: examining the links between animal behavior, morphology and habitat

Clara Bird, PhD Student, OSU Department of Fisheries and Wildlife, Geospatial Ecology of Marine Megafauna Lab

In order to understand a species’ distribution, spatial ecologists assess which habitat characteristics are most often associated with a species’ presence. Incorporating behavior data can improve this analysis by revealing the functional use of each habitat type, which can help scientists and managers assign relative value to different habitat types. For example, habitat used for foraging is often more important than habitat that a species just travels through. Further complexity is added when we consider that some species, such as gray whales, employ a variety of foraging tactics on a variety of prey types that are associated with different habitats. If individual foraging tactic specialization is present, different foraging habitats could be valuable to specific subgroups that use each tactic. Consequently, for a population that uses a variety of foraging tactics, it’s important to study the associations between tactics and habitat characteristics.

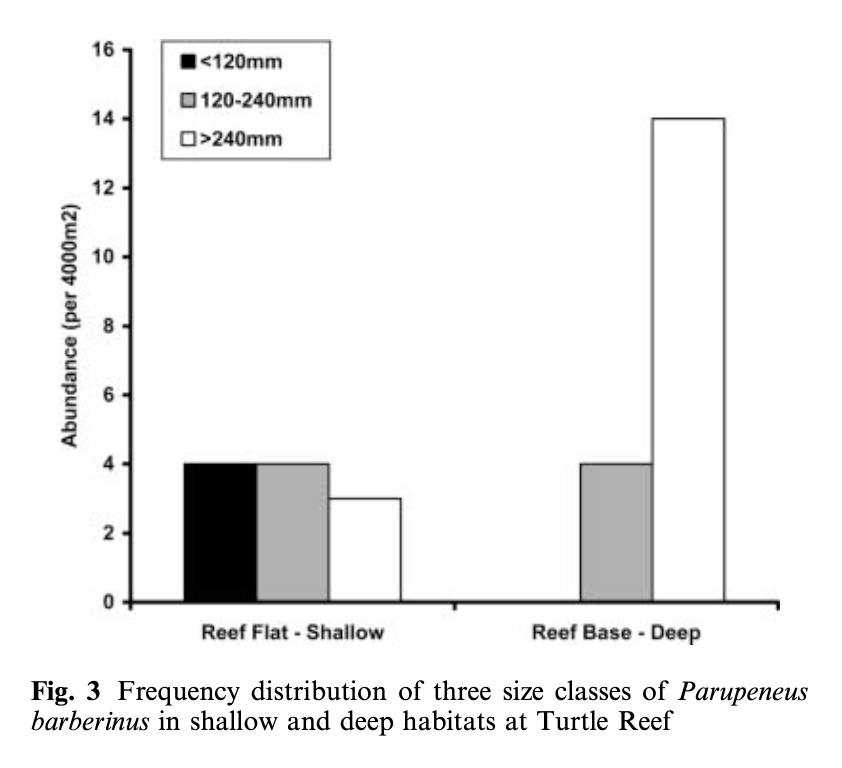
Lukoschek and McCormick’s (2001) study investigating the spatial distribution of a benthic fish species’ foraging behavior is a great example of combining data on behavior, habitat, and morphology.  They collected data on the diet composition of individual fish categorized into different size classes (small, medium, and large) and what foraging tactics were used in which reef zones and habitat types. The foraging tactics ranged from feeding in the water column to digging (at a range of depths) in the benthic substrate. The results showed that an interesting combination of fish behavior and morphology explained the observed diet composition and spatial distribution patterns. Small fish foraged in shallower water, on smaller prey, and primarily employed the water column and shallow digging tactics. In contrast, large fish foraged in deep water, on larger prey, and primarily fed by digging deeper into the seafloor (Figure 1). This pattern is explained by both morphology and behavior. Morphologically, the size of the feeding apparatus (mouth gape size) affects the size of the prey that a fish can feed on. The gape of the small fish is not large enough to eat the larger prey that large fish are able to consume. Behaviorally, predation risk also affects habitat selection and tactic use. Small fish are at higher risk of being predated on, so they remain in shallow areas where they are more protected from predators and they don’t dig as deep to forage because they need to be able to keep an eye out for predators. Interestingly, while they found a relationship between the morphology of the fish and habitat use, they did not find an association between specific feeding tactics and habitat types.

Figure 1. Figure from Lukoschek and McCormick (2001) showing that small fish (black bar) were found in shallow habitat while large fish (white bar) were found in deep habitat.

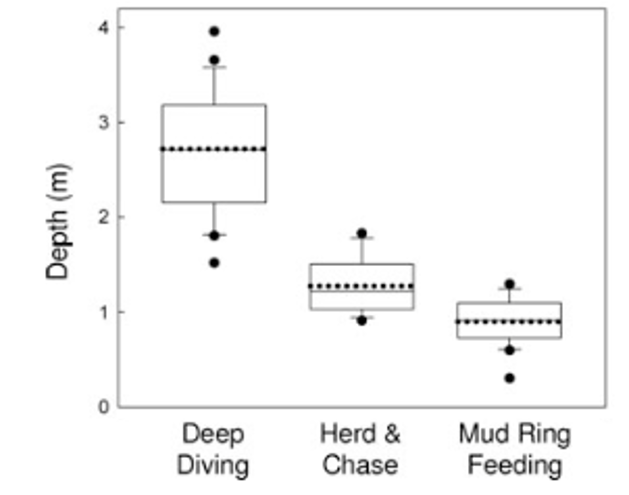
Conversely, Torres and Read (2009) did find associations between theforaging tactics of bottlenose dolphins in Florida Bay, FL and habitat type. Dolphins in this bay employ three foraging tactics: herd and chase, mud ring feeding, and deep diving. Observations of the foraging tactics were linked to habitat characteristics and individual dolphins. The study found that these tactics are spatially structured by depth (Figure 2), with deep diving occurring in deep water whereas mud ring feeding occurrs in shallower water. They also found evidence of individual specialization! Individuals that were observed deep diving were not observed mud ring feeding and vice-versa. Furthermore, they found that individuals were found in the habitat type associated with their preferred tactic regardless of whether they were foraging or not. This result indicates that individual dolphins in this bay have a foraging tactic they prefer and tend to stay in the corresponding habitat type. These findings are really intriguing and raise interesting questions regarding how these tactics and specializations are developed or learned. These are questions that I am also interested in asking as part of my thesis.

Figure 2. Figure from Torres and Read (2009) showing that deep diving is associated with deeper habitat while mud ring feeding is associated with shallow habitat.

Both of these studies are cool examples that, combined, exemplify questions I am interested in examining using our study population of Pacific Coast Feeding Group (PCFG) gray whales. Like both studies, I am interested in assessing how specific foraging tactics are associated with habitat types. Our hypothesis is that different prey types live in different habitat types, so each tactic corresponds to the best way to feed on that prey type in that habitat. While predation risk doesn’t have as much of an effect on foraging gray whales as it does on small benthic fish, I do wonder how disturbance from boats could similarly affect tactic preference and spatial distribution. I am also curious to see if depth has an effect on tactic choice by using the morphology data from our drone-based photogrammetry. Given that these whales forage in water that is sometimes as deep as they are long, it stands to reason that maneuverability would affect tactic use. As described in a previous blog, I’m also looking for evidence of individual specialization. It will be fascinating to see how foraging preference relates to space use, habitat preference, and morphology.

These studies demonstrate the complexity involved in studying a population’s relationship to its habitat. Such research involves considering the morphology and physiology of the animals, their social, individual, foraging, and predator-prey behaviors, and the relationship between their prey and the habitat. It’s a bit daunting but mostly really exciting because better understanding each puzzle piece improves our ability to estimate how these animals will react to changing environmental conditions.

While I don’t have any answers to these questions yet, I will be working with a National Science Foundation Research Experience for Undergraduates intern this summer to develop a habitat map of our study area that will be used in this analysis and potentially answer some preliminary questions about PCFG gray whale habitat use patterns. So, stay tuned to hear more about our work this summer!

References

Lukoschek, V., & McCormick, M. (2001). Ontogeny of diet changes in a tropical benthic carnivorous fish, Parupeneus barberinus (Mullidae): Relationship between foraging behaviour, habitat use, jaw size, and prey selection. Marine Biology, 138(6), 1099–1113. https://doi.org/10.1007/s002270000530

Torres, L. G., & Read, A. J. (2009). Where to catch a fish? The influence of foraging tactics on the ecology of bottlenose dolphins ( Tursiops truncatus ) in Florida Bay, Florida. Marine Mammal Science, 25(4), 797–815. https://doi.org/10.1111/j.1748-7692.2009.00297.x

Defining Behaviors

Clara Bird, PhD Student, OSU Department of Fisheries and Wildlife, Geospatial Ecology of Marine Megafauna Lab

When I started working on my thesis, I anticipated many challenges related to studying the behavioral ecology of gray whales. From processing five-plus years of drone footage to data analysis, there has been no shortage of anticipated and unexpected issues. I recently hit an unexpected challenge when I started video processing that piqued my interest. As I’ve discussed in a previous blog, ethograms are lists of defined behaviors that help us properly and consistently collect data in a standardized approach. Ethograms form a crucial foundation of any behavior study as the behaviors defined ultimately affect what questions can be asked and what patterns are detected. Since I am working off of the thorough ethogram of Oregon gray whales from Torres et al. (2018), I had not given much thought to the process of adding behaviors to the ethogram. But, while processing the first chunk of drone videos, I noticed some behaviors that were not in the original ethogram and struggled to decide whether or not to add them. I learned that ethogram development can lead down several rabbit holes. The instinct to try and identify every movement is strong but dangerous. Every minute movement does not necessarily need to be included and it’s important to remember the ultimate goal of the analysis to avoid getting bogged down.

Fundamental behavior questions cannot be answered without ethograms. For example, Baker et al. (2017) developed an ethogram for bottlenose dolphins in Ireland in order to conduct an initial quantitative behavior analysis. They did so by reviewing published ethograms for bottlenose dolphins, consulting with multiple experts, and revising the ethogram throughout the study. They then used their data to test inter-observer variability, calculate activity budgets, and analyze how the activity budgets varied across space and time.

Howe et al. (2015) also developed an ethogram in order to conduct quantitative behavior analyses. Their goals were to use the ethogram and subsequent analyses to better understand the behavior of beluga whales in Cook Inlet, AK, USA and to inform conservation. They started by writing down all behaviors they observed in the field, then they consolidated their notes into a formal ethogram that they used and refined during subsequent field seasons. They used their data to analyze how the frequencies of different behaviors varied throughout the study area at different times. This study served as an initial analysis investigating the effect of anthropogenic disturbance and was refined in future studies.

My research is similarly geared towards understanding behavior patterns to ultimately inform conservation. The primary questions of my thesis involve individual specialization, patterns of behavior across space, the relationship between behavior and body condition, and social behavior (check out this blog to learn more). While deciding what behaviors to add to my ethogram I’ve had to remind myself of these main questions and the bigger picture. The drone footage lets us see so much detail that it’s tempting to try to define every movement we can observe. One rabbit hole I’ve had to avoid a few times is locomotion. From the footage, it is possible to document fluke beats and pectoral fin strokes. While it could be interesting to investigate how different whales move in different ways, it could easily become a complicated mess of classifying different movements and take me deep into the world of whale locomotion. Talking through what that work would look like reminded me that we cannot answer every question and trying to assess all exciting side projects can cause us to lose focus on the main questions.

While I avoided going down the locomotion rabbit hole, there were some new behaviors that I did add to my ethogram. I’ll illustrate the process with the examples of two new behaviors I recently added: fluke swish and pass under (Clips 1 and 2). Clip 1 shows a whale rapidly moving its fluke to the side. I chose to add fluke swish because it’s such a distinct movement and I’m curious to see if there’s a pattern across space, time, individual, or nearby human activity that might explain its function. Clip 2 shows a calf passing under its mom.  It’s not nursing because the calf doesn’t spend time under its mom, it just crosses underneath her. The calf pass under behavior could be a type of mom-calf tactile interaction. Analyzing how the frequency of this behavior changes over time could show how a calf’s dependency on its mom changes over as it ages.

In defining these behaviors, I had to consider how many different variations of this behavior would be included in the definition. This process involves considering at what point a variation of that behavior could serve a different function, even without knowing the function of the original behavior. For fluke swish this process involved deciding to only count a behavior as a fluke swish if it was a big, fast movement. A small and slow movement of the fluke a little to the side could serve a different function, such as turning, or be a random movement.

Clip 1: Fluke swish behavior (Video filmed under NOAA/NMFS research permit #16111​​ by certified drone pilot Todd Chandler).
Clip 2: Pass under behavior (Video filmed under NOAA/NMFS research permit #16111​​ by certified drone pilot Todd Chandler).

The next step involved deciding if the behavior would be a ‘state’ or ‘point’ event. A state event is a behavior with a start and stop moment; a point event is instantaneous and assigned to just a point in time. I would categorize a behavior as a state event if I was interested in questions about its duration. For example, I could ask “what percentage of the total observation time was spent in a certain behavior state?” A point event would be a behavior where duration is not applicable, but I could ask a question like “Did whale 1 perform more point event A than whale 2?”. Both fluke swish and pass under are point events because they only happen for an instant. In a pass under the calf is passing under its mom for just a brief point in time, making it a point event. The final step was to name the behavior. As I discussed in this blog, the name of the behavior does not matter as much as the definition but it is important that the name is clear and descriptive. We chose the name fluke swish because the fluke rapidly moves from side to side and pass under because the calf crosses under its mom.

Frankly, in the beginning, I was a bit overwhelmed by the realization that the content of my ethogram would ultimately control the questions I could answer. I could not help but worry that after processing all the videos, I would end up regretting not defining more behaviors. However, after reading some of the literature, chatting with Leigh, and reviewing the initial chunk of videos several times, I am more confidence in my judgment and my ethogram. I have accepted the fact that I can’t anticipate everything, and I am confident that the behaviors I need to answer my research questions are included. The process of reviewing and updating my ethogram has been a rewarding challenge that resulted in a valuable lesson that I will take with me for the rest of my career.

References

Baker, I., O’Brien, J., McHugh, K., & Berrow, S. (2017). An ethogram for bottlenose dolphins (Tursiops truncatus) in the Shannon Estuary, Ireland. Aquatic Mammals, 43(6), 594–613. https://doi.org/10.1578/AM.43.6.2017.594

Howe, M., Castellote, M., Garner, C., McKee, P., Small, R. J., & Hobbs, R. (2015). Beluga, Delphinapterus leucas, ethogram: A tool for cook inlet beluga conservation? Marine Fisheries Review, 77(1), 32–40. https://doi.org/10.7755/MFR.77.1.3

Torres, L. G., Nieukirk, S. L., Lemos, L., & Chandler, T. E. (2018). Drone up! Quantifying whale behavior from a new perspective improves observational capacity. Frontiers in Marine Science, 5(SEP). https://doi.org/10.3389/fmars.2018.00319

Are there picky eaters in the PCFG?

Clara Bird, PhD Student, OSU Department of Fisheries and Wildlife, Geospatial Ecology of Marine Megafauna Lab

As anyone who has ever been, or raised, a picky eater knows, humans have a wide range of food preferences. The diversity of available cuisines is a testament to the fact that we have individual food preferences. While taste is certainly a primary influence, nutritional benefits and accessibility are other major factors that affect our eating choices. But we are not the only species to have food preferences. In cetacean research, it is common to study the prey types consumed by a population as a whole. Narrowing these prey preferences down to the individual level is rare. While the individual component is challenging to study and to incorporate into population models, it is important to consider what the effects of individual foraging specialization might be.

To understand the role and drivers of individual specialization in population ecology, it is important to first understand the concepts of niche variation and partitioning. An animal’s ecological niche describes its role in the ecosystem it inhabits (Hutchinson, 1957). A niche is multidimensional, with dimensions for different environmental conditions and resources that a species requires. One focus of my research pertains to the dimensions of the niche related to foraging. As discussed in a previous blog, niche partitioning occurs when ecological space is shared between competitors through access to resources varies across different dimensions such as prey type, foraging location, and time of day when foraging takes place. Niche partitioning is usually discussed on the scale of different species coexisting in an ecosystem. Pianka’s theory stating that niche partitioning will increase as prey availability decreases uses competing lizard species as the example (Pianka, 1974). Typically, niche partitioning theory considers inter-specific competition (competition between species), but niche partitioning can take place within a species in response to intra-specific competition (competition between individuals of the same species) through individual niche variation.

A species that consumes a multitude of prey types is considered a generalist while one with a specific prey type is considered a specialist. Gray whales are considered generalists (Nerini, 1984). However, we do not know if each individual gray whale is a generalist or if the generalist population is actually composed of individual specialists with different preferences. One way to test for the presence of individual specialization is to compare the niche width of the population to the niche width of each individual (Figure 1, Bolnick et al., 2003).  For example, if a population eats five different types of prey and each individual consumed those prey types, those individuals would be generalists. However, if each individual only consumed one of the prey types, then those individuals would be specialists within a generalist population.

Figure 1. Figure from Bolnick et al. 2003. The thick curve represents the total niche of the population and the thin curves represent individual niches. Note that in both panels the population has the same total niche. In panel A, the individual curves overlap and are all pretty wide. These curves represent individual generalists that make up a generalist population. In panel B, the thin curves are narrower and do not overlap as much as those in panel A. These curves represent individual specialists that make up a generalist population.

If individual specialization is present in a population the natural follow-up question is why? To answer this, we look for common characteristics between the individuals that are similarly specialized. What do all the individuals that feed on the same prey type have in common? Common characterizations that may be found include age, sex, or distinct morphology (such as different beak or body shapes) (Bolnick et al., 2003).

Woo et al. (2008) studied individual specialization in Brünnich’s guillemot, a generalist sea bird species, using diet and tagging data. They found individual specialization in both diet (prey type) and behavior (dive depth, shape, and flight time). Specialization occurred across multiple timescales but was higher over short-time scales. The authors found that it was more common for an individual to specialize in a prey-type/foraging tactic for a few days than for that specialization to continue across years, although a few individuals were specialists for the full 15-year period of the study. Based on reproductive success of the studies birds, the authors concluded that the generalist and specialist strategies were largely equivalent in terms of fitness and survival. The authors searched for common characteristics in the individuals with similar specialization and they found that the differences between sexes or age classes were so small that neither grouping explained the observed individual specialization. This is an interesting result because it suggests that there is some missing attribute, that of the authors did not examine, that might explain why individual specialists were present in the population.

Hoelzel et al. (1989) studied minke whale foraging specialization by observing the foraging behaviors of 23 minke whales over five years from a small boat. They identified two foraging tactics: lunge feeding and bird-associated feeding. Lunge feeding involved lunging up through the water with an open mouth to engulf a group of fish, while bird-associated feeding took advantage of a group of fish being preyed on by sea birds to attack the fish from below while they were already being attacked from above. They found that nine individuals used lunge feeding, and of those nine, six whales used this tactic exclusively. Five of those six whales were observed in at least two years. Seventeen whales were observed using bird-associated feeding, 14 exclusively. Of those 14, eight were observed in at least two years. Interestingly, like Woo et al. (2008), this study did not find any associations between foraging tactic use and sex, age, or size of whale. Through a comparison of dive durations and feeding rates, they hypothesized that lunge feeding was more energetically costly but resulted in more food, while bird-associated feeding was energetically cheaper but had a lower capture rate. This result means that these two strategies might have the similar energetic payoffs.

Both of these studies are examples of questions that I am excited to ask using our data on the PCFG gray whales feeding off the Oregon coast (especially after doing the research for this blog). We have excellent individual-specific data to address questions of specialization because the field teams for  this project always carefully link observed behaviors with individual whale ID.  Using these data, I am curious to find out if the whales in our study group are individual specialists or generalists (or some combination of the two). I am also interested in relating specific tactics to their energetic costs and benefits in order to assess the payoffs of each foraging tactic. I then hope to combine the results of both analyses to assess the payoffs of each individual whale’s strategy.

Figure 2. Example images of two foraging tactics, side swimming (left) and headstanding (right). Images captured under NOAA/NMFS permit #21678.

Studying individual specialization is important for conservation. Consider the earlier example of a generalist population that consumes five prey items but is composed of individual specialists. If the presence of individual specialization is not accounted for in management plans, then regulations may protect certain prey types or foraging tactics/areas of the whales and not others. Such a management plan could be a dangerous outcome for the whale population because only parts of the population would be protected, while other specialists are at risk, thus potentially losing genetic diversity, cultural behaviors, and ecological resilience in the population as a whole. A plan designed to maximize protection for all the specialists would be better for the population because populations with increased ecological resilience are more likely to persist through periods of rapid environmental change. Furthermore, understanding individual specialization could help us better predict how a population might be affected by environmental change. Environmental change does not affect all prey species in the same way. An individual specialization study could help identify which whales might be most affected by predicted environmental changes. Therefore, in addition to being a fascinating and exciting research question, it is important to test for individual specialization in order to improve management and our overall understanding of the PCFG gray whale population.

References

Bolnick, D. I., Svanbäck, R., Fordyce, J. A., Yang, L. H., Davis, J. M., Hulsey, C. D., & Forister, M. L. (2003). The ecology of individuals: Incidence and implications of individual specialization. American Naturalist, 161(1), 1–28. https://doi.org/10.1086/343878

Hoelzel, A. R., Dorsey, E. M., & Stern, S. J. (1989). The foraging specializations of individual minke whales. Animal Behaviour, 38(5), 786–794. https://doi.org/10.1016/S0003-3472(89)80111-3

Hutchinson, G. E. (1957). Concluding Remarks. Cold Spring Harbor Symposia on Quantitative Biology, 22(0), 415–427. https://doi.org/10.1101/sqb.1957.022.01.039

Nerini, M. (1984). A Review of Gray Whale Feeding Ecology. In The Gray Whale: Eschrichtius Robustus (pp. 423–450). Elsevier Inc. https://doi.org/10.1016/B978-0-08-092372-7.50024-8

Pianka, E. R. (1974). Niche Overlap and Diffuse Competition. 71(5), 2141–2145.

Woo, K. J., Elliott, K. H., Davidson, M., Gaston, A. J., & Davoren, G. K. (2008). Individual specialization in diet by a generalist marine predator reflects specialization in foraging behaviour. Journal of Animal Ecology, 77(6), 1082–1091. https://doi.org/10.1111/j.1365-2656.2008.01429.x

Remembering Alexa

The GEMM Lab

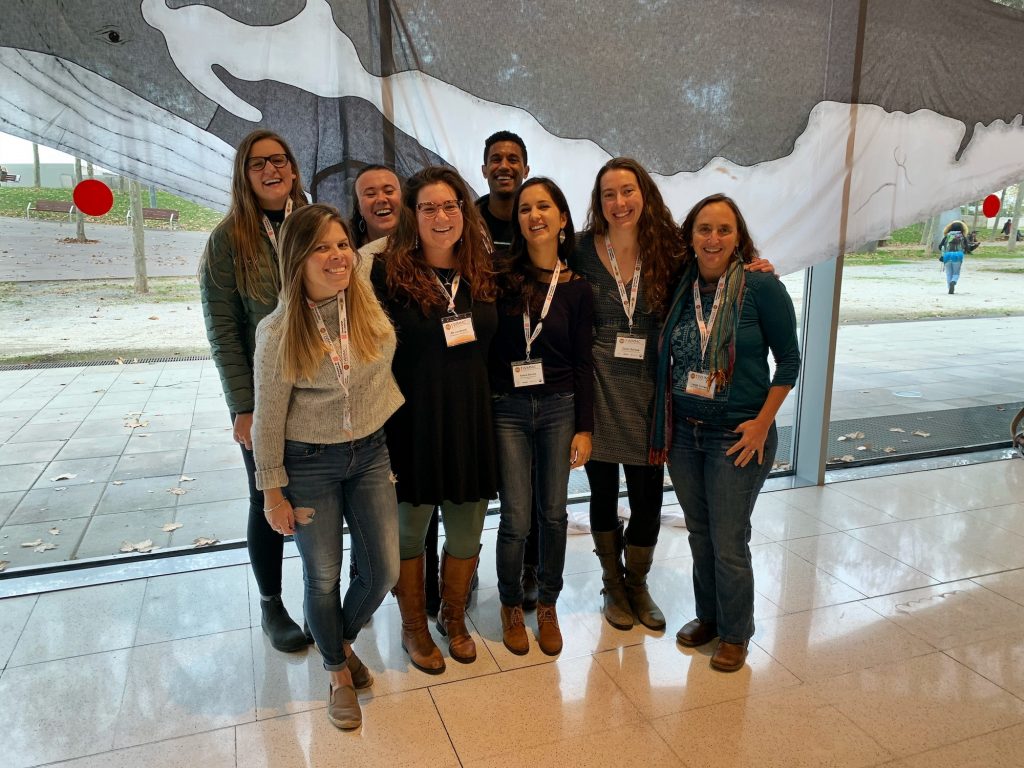
Alexa Kownacki first contacted me in October 2016 to enquire about being my PhD student and joining the GEMM Lab. She spoke with passion, intellect, curiosity and honesty, to which I was immediately drawn. Over the next four years, we were privileged to have her brilliance, kindness, wit and effervescence in our world. I am devastated to communicate here – on the GEMM Lab blog that Alexa frequently contributed to with enthusiasm and talent – that Alexa Kownacki passed away on Tuesday, November 17, 2020. The GEMM Lab has been shocked and deeply saddened by losing Alexa from our lives. She embodied joy, and recognized and relished beauty everywhere, and in each of us. Her ability to give support, love, and understanding was limitless, as was her passion for marine conservation and education. Our sorrow is profound, but we want to remember Alexa’s life with the brightness, color and laughter it deserves, for that’s how she lived. Below are memories of Alexa from each of us in the GEMM Lab who knew and loved Alexa, followed by a video montage of Alexa in life. Please visit this memorial website to contribute your stories of Alexa, as well as read other tributes and post photos.

Leigh

Alexa loved the ocean and seemed more at-home while at-sea than almost anyone I know. I asked Alexa to join me aboard the RV Oceanus for a STEM research cruise in September 2018 where we took high school students and teachers to sea to teach them how we collect marine mammal and oceanographic data. (Alexa wrote a lovely blog about this cruise.) I was not surprised by her enthusiasm – that was her nature – but I was utterly amazed at how easily Alexa mentored the students, communicated with the crew, balanced teaching with humor and humility, created learning moments everywhere, and supported everyone on-board so they felt welcomed and comfortable. During this cruise, Alexa was my partner, my teammate. We were both in our element and shared so much joy with the privilege to be at-sea, laughter at the excitement and adventure, inspiration at watching the next generation of marine scientists learn, and awe for the beauty that the ocean holds. This is how I will remember you, Alexa. Your free, beautiful, kind, joyous spirit will always be with me.

Dom

For anyone who knew Alexa, you knew she had an uncanny ability to connect with others on such a personal level that made you feel truly valued and loved. No matter the circumstances, she made it a point to always show up for those she cared about, which makes it extremely difficult to choose just one memory to remember her by. Instead, I’m choosing to remember her by the way she made me feel, as a human and a friend. Even during the most challenging of times, Alexa always wanted to know how I was doing and what I was doing outside of school to take care of myself. I can’t count the number of times she pulled me away from my work to go out dancing at the Peacock or drag shows, hiking on our weekends, or even making short donut runs to Benny’s Donuts. She understood that even scientists have basic needs for personal connection, fun and enjoyment, and love. If there’s anything Alexa’s passing has taught me, it is this: always show up for your fellow scientists and colleagues as people and friends first, because our support for one another will no doubt leave a longer-standing and greater impact on this world than our achievements and discoveries. Her passing will be my constant reminder that we all deserve to be treated and valued with love and dignity. Alexa, thank you for teaching me this valuable lesson, and I hope I get the chance to impact someone else’s life, as much as you have mine. I love you, and I promise I’ll visit San Diego soon.

Lisa

Alexa, there are so many memories, experiences, and moments we had together that I will never forget, least of all the very first day I met you (fasten your seatbelts everyone, this story is a wildly unbelievable, yet very true, roller coaster ride). Summers were always extremely busy for you in San Diego. Yet, despite that, you didn’t hesitate when Leigh asked you to come up to Oregon in July 2018 to teach me, the newest GEMM Lab member, all there was to know about the Port Orford gray whale project. You had never met me before and you had only participated in the Port Orford project for a week the previous summer, but none of that stopped you. You flew to Portland from San Diego and made your way to Newport. We loaded up the MMI truck with all the gear and headed south towards Port Orford. So far, so good. Great, even! You pulled off the highway any chance we got so I could marvel at the beauty of the Oregon coast. But that all changed when we got to Coos Bay where we planned to stock up on groceries. You, ever so organized & thoughtful, had already compiled a grocery list but as we were going up and down the aisle, adding things to our cart, you suddenly realized that your phone was missing. We retraced our steps. Nothing. As always, you were quick on your feet, and connected to the Safeway wifi on your tablet to use the ‘Find My iPhone’ app to help solve the mystery. Lo-and-behold, your phone was no longer in the store…We drove to the location and arrived at what we always describe as a “creepy-looking motel” (although under any other circumstance the motel would have probably looked totally normal). We surveyed our surroundings and made notes (I still have that note on my phone) about all the people and vehicles we saw. One person in particular drew our attention because out of the back of his car he pulled out several…Safeway grocery bags!!! Feeling giddy about our amateur-sleuthing but also nervous because we were sitting in a pretty conspicuous white government truck in a motel parking lot, you decided that it was probably time to call the police. Two officers arrived and it soon was revealed that the man we had seen with Safeway bags had indeed just been at Safeway with his daughter. Apparently, his daughter had a habit of stealing and he told the officers he was confident that his daughter had stolen the phone and that he would call them as soon as he found it. There wasn’t much for us to do so you decided it would be best to drive to Port Orford, get settled in and once we heard from the police, we could drive back to Coos Bay. We did eventually hear from the police and drove all the way back to Coos Bay in the dark, only to find that your phone was completely destroyed. The night involved more adventures (including sleeping on the floor but that’s a whole other story), yet, the next day (the 4th of July), you let none of these events stop us from making s’mores (my first ones ever!) and watching the dinghy race & fireworks from the field station. You blazed on, with your unparalleled optimism and determination, to ensure that I not only learned everything that I needed to know to be able to run the project, but that we also had a great time while learning. Alexa, I will cherish the time we had together forever and I miss you so incredibly much.

Dawn

The day Alexa moved to Oregon to start graduate school, she learned that we were sailing here in Newport as part of Yaquina Bay Yacht Club’s Wednesday night race series. She had yet to move into her apartment, but she hopped on a sailboat that very evening. Alexa was in her element, with wind in her hair and salt spray on her face. She smiled through it all as her signature laughter rang out across the bay, and by the end of the evening she had easily become friends with the entire community. This was Alexa’s way of life. She leapt at opportunities, she poured her whole self into everything she did, and she connected with everyone immediately, deeply, and genuinely. Her optimism was unending. After long, stormy weather days at sea she would enthusiastically send a sunset photo with the caption “Red sky at night, sailors delight!” She lived every moment to the fullest, and she helped all of us see beauty, humor, and joy through her eyes. “Let’s document this, I’m taking a picture!” she’d say. Oftentimes, I’d roll my eyes. “Hey, Dawn you’re not in the picture. Lean in!” she’d insist. Now I have so many photos and memories to cherish. What a constant joy it was, dear Alexa, to be your labmate and your friend. What a heartbreaking reminder your sudden departure is to take nothing for granted, to live life to the absolute fullest, to dance often and sing loudly, and to hold nothing back. Fair winds and following seas, you beautiful, bright spirit. We love and miss you dearly. Thank you for sharing your time on earth with all of us.

Leila

Alexa was a light in my life since I met her in Oregon. I first met Alexa while living in the dorms in Newport and got to be her roommate for that summer. She would always wake up in the morning and head to the basketball court with her laptop to do some exercises, always so energetic and enthusiastic! I also shared rooms with her on multiple other occasions, including my house when she needed a place and at all of the conferences we went to together. While I was pretty much dead after an entire day of talks and was ready to go to bed, she was getting ready to go dancing. She was always SO full of energy and life. Alexa indeed knew how to enjoy life, and did it graciously. 

She easily became one of my greatest friends in Oregon. She was my confidant during the struggles of grad life and was always supportive no matter what happened. Last year we were in Barcelona for a conference and my passport got lost in the mail system. She saw how nervous I was and made sure to accompany me to the other side of the city to go check if my passport had arrived, even if she already had plans for that night. Also, when I was about to defend my Ph.D. she would go do groceries for me to make sure I had enough ice cream while struggling with my presentation practice. Alexa had problems, many problems, but still went above and beyond to make sure all of her friends were taken care of. 

We both loved dancing and were taking dance classes in grad school. We tried to find a dance style that we both liked so we could go to dance together, but I was already taking hip hop classes and loved it. Alexa would not accept going to hip hop as she thought it was not an inclusive and diverse space and she wanted to spend her time meeting and cherishing diverse people. She was always so thoughtful and probably one of the most inclusive people I have ever met. 

Alexa’s contagious laugh, caring and optimism left me a deep mark that I am going to carry close to my heart throughout my life. She is such a great inspiration for how we should live our lives. I love you Alexa and miss you dearly. Thank you for everything. Rest in peace and keep shining wherever you are. I am sure this is just a “see you later”.

Alejandro

I had the joy to meet Alexa when I first visited the GEMM Lab in 2018, I will always remember her for her vibrant smile, her friendly kind, and for making me feel so welcomed when I arrived in Newport, she instantly made me feel among friends. I meet her so briefly because she was heading to San Diego for the summer to work on her research, she let me borrow her desk for me to work on while she was away and she left me a note written in Spanish, my native language, which meant a lot to me, and speaks about the kind of person she was, someone who would make you feel welcomed and would try finding things in common to engage and connect. We kept connected ever since, exchanging emails about work, whales, dolphins, or just to know about how we were doing, hoping to reunite again but, unfortunately, last summer due to COVID we could not meet again. The news about her leaving us just left me shocked, although I met her briefly she really impacted me, I want to be a bit like her, and be able to share the things I love in the way she did, with passion and vibrant enthusiasm. She will be missed.

Rachael

Alexa and I haven’t been in the same place at the same time for a while. On the top of my list for next time we crossed paths was to catch-up with her about her trip through the Northwest Passage and quiz her about the seabirds, the islands, and the polar bears. In September 2018, I agreed to join the R/V Oceanus on a STEM outreach cruise as a seabird observer. It was my first time as a seabird observer as I typically do better on land. I spent most of the first day in my bunk (I have queasy memories of making it up to the flying bridge, seeing the ocean, and quickly retreating). Luckily the cruise was long enough for me to gain my sea legs. I didn’t take any photos, but Alexa did and I can look back on those days through her eyes and remember the wonderful calm beautiful evening we spent on the back deck, her excitement and skill when we encountered whales, and her kind laughter when we spotted an albatross through the portal (and I wasn’t quite ready to go up to the flying bridge). I admired her outgoing confidence and enthusiasm and I will miss her presence in the GEMM lab family. In our field, people have the habit of coming round full circle and I also miss the future: reuniting with Alexa 10 years from now on a research cruise somewhere. Alexa – thank you for those moments we shared, your vision of life, and your efforts to make the ‘world a better place for all living creatures’.

Karen

Alexa threw kindness around like it was confetti and life was one big dance party. She freely gave of her time and energy and sought to raise those near her to her own level of excellence. Through her own example, she constantly reminded me, and many others, that being a kind, welcoming, and goodhearted person was just as important as academic or scientific success. Alexa always made me feel welcome in the GEMM lab (even though I’m adopted) for which I will always be grateful. What I admire most about Alexa is her strength and perseverance, and stubborn refusal to let anything life threw at her knock her off the course she chose for herself. Knowing Alexa was truly a gift. After receiving such a gift in my life, more than anything I want to say thank you to her. And so, to Alexa:Thank you for the beach breaks and the lunch dates and the ‘oh look, the sun’s out we gotta run out’ breaks. Thank you for the light and laughter you brought with you everywhere. Thank you for continually reminding me to find the joy in hard times and sitting with me in difficult moments until I could. Thank you for being goofy enough to stomp on seaweed or play on the swings with me. Thank you for keeping me entertained with silly jokes in Zoom meetings gone on too long. Thank you for being a cheerleader when I needed it, and for being so willing to share your positivity in the many pep talks you gave me. And most of all, thank you for the epic dance parties. I know you’re dancing wherever you are.

One example of Alexa’s endless determination – continuing to insist on taking selfies to document her friendships even in the age of social distancing.

Clara

I first met Alexa in Barcelona when I arrived at the apartment the GEMM lab was sharing for the conference. My first memory is that she greeted me like an old friend and made me feel instantaneously welcome. There was no awkward initial phase, we met and were friends. I adored every time we got a chance to catch up and chat. This past spring I had regular “zoom GIS dates” with Alexa to help her with GIS, but I have to admit these were 50% catch up time, and I’ve never been happier to be unproductive. She was never bothered by GIS crashing for the tenth time, something that would have most people banging their head on a desk, instead she would just say “ah well, ok so back to [whatever we were talking about]”. We bonded over field work and travel stories (she had the best travel stories). Whenever we spoke she was always supportive and kind, she truly believed in you and made sure you knew it. 

Alexa, your welcoming, enthusiastic, and encouraging spirit has been an inspiration that I will carry with me always. Thank you for everything, your warm, vibrant, and brilliant presence is deeply missed.

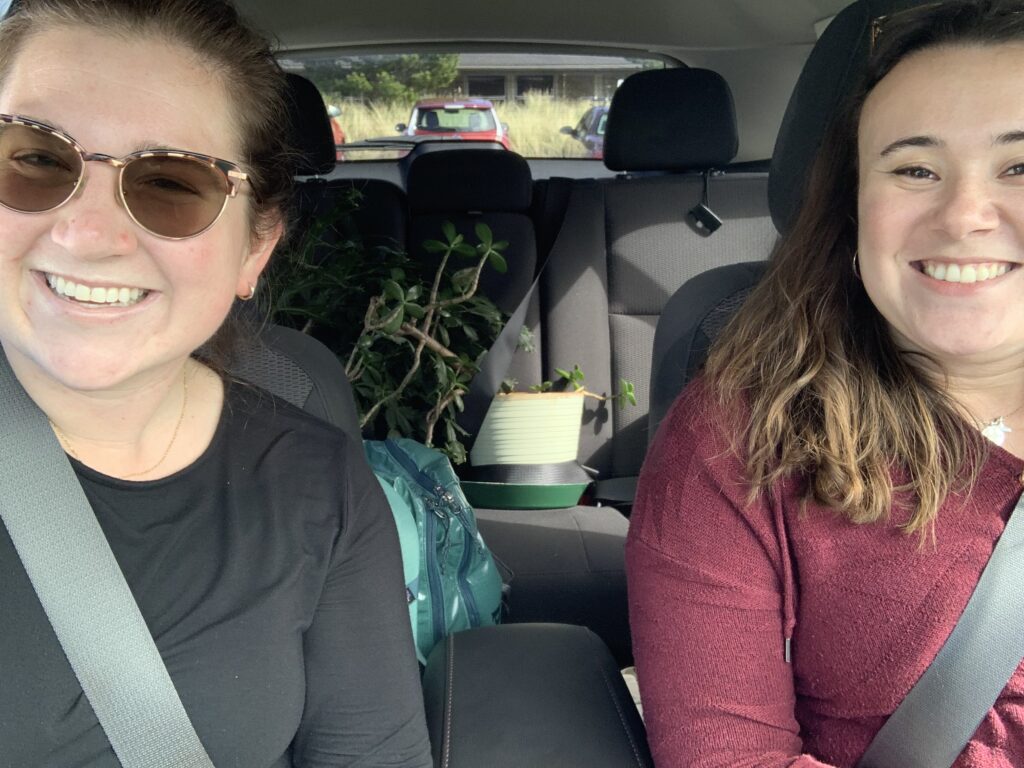
Alexa offered to take care of some of the library plants when it was preparing to close in March. We had to buckle the plants into the backseat of my car to transport them back to Corvallis, we both found this highly amusing and naturally, Alexa wanted to document it, I am so glad she did.

Florence

Alexa was one of those rare people who is genuinely, unapologetically excited about the universe and everything in it.  Like others have mentioned, if you weren’t her friend, it was only because you hadn’t met her yet. When you met her, she would quickly dig past traditional I-have-just-met-you small talk until she found a common passion or something to connect about. Our self evident enthusiasm for marine mammals and baking provided ample opportunities for geeking out together, but the ‘oh-wow-small-world’ moment that still makes me laugh is when we realised that her great uncle is the priest who celebrated my wedding!  

I will remember the dedication she had to maintaining the bonds of our GEMM Lab family, regularly driving across the coastal mountains for potlucks and boardgame nights (a 2 hr round trip most folks were reluctant to make!). I will remember her laughter whether she won or lost those games, and the way she insisted we make time to set aside our work and just exist as friends. I will remember her delight when I asked her to participate in a group weaving project, and the joy in her smile at learning a new skill. Alexa is inextricably woven into the tapestry of so many lives. The fabric of the community she helped build will hold her memory, and keep us warm with the blessing of her laughter.

–Like a Sailboat–

I am standing at the edge of the shore

A ship sails in the morning breeze

And heads for the open ocean

She is beauty, She is life.

I watch her ’til she disappears over the horizon.

Someone near me says << She is Gone >>

Gone where? Gone from my sight, that’s all.

Her mast is still as tall,

Her hull still holds the strength to carry

Her cargo of humanity

Her diminishment and loss from sight is in me, not in her.

And in the moment when someone near me say:

<< She is Gone >>

There are others who, seeing a sail on the horizon,

coming towards them,

exclaim with joy: << There She Is >>

This is death.

There are no dead,

Only people on both shores.

-Author unknown

To view a video montage put together by the GEMM lab click here.

Thank you for everything Alexa, we love and miss you, may your memory be a blessing.

Learning from teaching

Clara Bird, PhD Student, OSU Department of Fisheries and Wildlife, Geospatial Ecology of Marine Megafauna Lab

Based on my undergrad experience I assumed that most teaching in grad school would be as a teaching assistant, and this would consist of teaching labs, grading, leading office hours, etc. However, now that I’m in graduate school, I realize that there are many different forms of teaching as a graduate student. This summer I worked as an instructor for an e-campus course, which mainly involved grading and mentoring students as they developed their own projects. Yet, this past week I was a guest teacher for Physiology and Behavior of Marine Megafauna, which was a bit more involved.

I taught a whale photogrammetry lab that I originally developed as a workshop with a friend and former lab mate, KC Bierlich, at the Duke University Marine Robotics and Remote Sensing (MaRRS) lab when I worked there. Similar to Leila’s work, we were using photogrammetry to measure whales and assess their body condition. Measuring a whale is a deceivingly simple task that gets complicated when taking into account all the sources of error that might affect measurement accuracy. It is important to understand the different sources of error so that we are sure that our results are due to actual differences between whales instead of differences in errors.

Error can come from distortion due to the camera lens, inaccurate altitude measurements from the altimeter, the whale being arched, or from the measurement process. When we draw a line on the image to make a measurement (Image 1), measurement process errors come from the line being drawn incorrectly. This potential human error can effect results, especially if the measurer is inexperienced or rushing. The quality of the image also has an effect here. If there is glare, wake, blow or refraction covering or distorting the measurer’s view of the full body of the whale then the measurer has to estimate where to begin and end the line. This estimation is subjective and, therefore, a source of error. We used the workshop as an opportunity to study these measurement process errors because we could provide a dataset including images of varying qualities and collect data from different measurers.

Image 1. Screenshot of measuring the widths along a minke whale in MorphoMetriX. Source: https://github.com/wingtorres/morphometrix/blob/master/images/Picture4.png

This workshop started as a one-day lecture and lab that we designed for the summer drone course at the Duke Marine Lab. The idea was to simultaneously teach the students about photogrammetry and the methods we use, while also using all the students’ measurements to study the effect of human error and image quality on measurement accuracy. Given this one-day format, we ambitiously decided to teach and measure in the morning, compile and analyze the students’ measurements over lunch, and then present the results of our error analysis in the afternoon. To accomplish this, we prepared as much as we could and set up all the code for the analysis ahead of time. This preparation meant several days of non-stop working, discussing, and testing, all to anticipate any issues that might come up on the day of the class.  We used the measuring software MorphoMetriX (Torres & Bierlich, 2020) that was developed by KC and a fellow Duke Marine Lab grad student Walter Torres. MorphoMetriX was brand new at the time, and this newness of the software meant that we didn’t yet know all the issues that might come up and we did not have time to troubleshoot. We knew this meant that helping the students install the software might be a bit tricky and sure enough, all I remember from the beginning of that first lab is running around the room helping multiple people troubleshoot at the same time, using use all the programming knowledge I had to discover new solutions on the fly.

While troubleshooting on the fly can be stressful and overwhelming, I’ve come to appreciate it as good practice. Not only did we learn how to develop and teach a workshop, we also used what we had learned from all the troubleshooting to improve the software. I also used the code we developed for the analysis as the starting blocks for a software package I then wrote, CollatriX (Bird & Bierlich, 2020), as a follow up software to MorphoMetriX. Aside from the initial troubleshooting stress, the workshop was a success, and we were excited to have a dataset to study measurement process errors. Given that we already had all the materials for the workshop prepared, we decided to run a few more workshops to collect more data.

That brings me to my time at here at OSU. I left the Duke MaRRS lab to start graduate school shortly after we taught the workshop. Interested in running the workshop here, I reached out to a few different people. I first ran the workshop here as an event organized by the undergraduate club Ocean11 (Image 2). It was fun running the workshop a second time, as I used what I learned from the first round; I felt more confident, and I knew what the common issues would likely be and how to solve them. Sure enough, while there were still some troubleshooting issues, the process was smoother and I enjoyed teaching, getting to know OSU undergraduate students, and collecting more data for the project.

Image 2. Ocean11 students measuring during the workshop (Feb 7, 2020).
Image credit: Clara Bird

The next opportunity to run the lab came through Renee Albertson’s physiology and behavior of marine megafauna class, but during the COVID era this class had other challenges. While it’s easier to teach in person, this workshop was well suited to be converted to a remote activity because it only requires a computer, the data can be easily sent to the students, and screen sharing is an effective way to demonstrate how to measure. So, this photogrammetry module was a good fit for the marine megafauna class this term that has been fully remote due to COVID-19.  My first challenge was converting the workshop into a lab assignment with learning outcomes and analysis questions. The process also involved writing R code for the students to use and writing step-by-step instructions in a way that was clear and easy to understand. While stressful, I appreciated the process of developing the lab and these accompanying materials because, as you’ve probably heard from a teacher, a good test of your understanding of a concept is being able to teach it. I was also challenged to think of the best way to communicate and explain these concepts. I tried to think of a few different explanations, so that if a student did not understand it one way, I could offer an alternative that might work better. Similar to the preparation for the first workshop, I also prepared for troubleshooting the students’ issues with the software. However, unlike my previous experiences, this time I had to troubleshoot remotely.

After teaching this photogrammetry lab last week my respect for teachers who are teaching remotely has only increased. Helping students without being able to sit next to them and walk them through things on their computer is not easy. Not only that, in addition to the few virtual office hours I hosted, I was primarily troubleshooting over email, using screen shots from the students to try and figure out what was going on. It felt like the ultimate test of my programming knowledge and experience, having to draw from memories of past errors and solutions, and thinking of alternative solutions if the first one didn’t work. It was also an exercise in communication because programming can be daunting to many students; so, I worked to be encouraging and clearly communicate the instructions. All in all, I ended this week feeling exhausted but accomplished, proud of the students, and grateful for the reminder of how much you learn when you teach.

References

Bird, C. N., & Bierlich, K. (2020). CollatriX: A GUI to collate MorphoMetriX outputs. Journal of Open Source Software, 5(51), 2328. https://doi.org/10.21105/joss.02328

Torres, W., & Bierlich, K. (2020). MorphoMetriX: a photogrammetric measurement GUI for morphometric analysis of megafauna. Journal of Open Source Software, 5(45), 1825. https://doi.org/10.21105/joss.01825

Pretty science

By Solène Derville, Postdoc, OSU Department of Fisheries and Wildlife, Geospatial Ecology of Marine Megafauna Lab

Ever since I was a teenager, I have been drawn to both arts and sciences. When I decided to go down the path of marine biology and research, I never thought I would one day be led to exploit my artistic skills as well as my scientific interests.

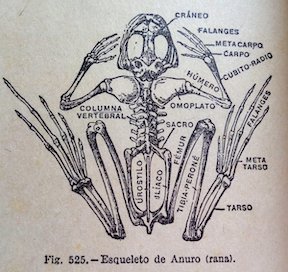
Processing data, coding, analyzing, modeling… these tasks form the core of my everyday work and are what generates my excitement and passion for research. But once a new result has come up, or a new hypothesis has been formed, how boring would it be to keep it for myself? Science is all about communication, exchanges with our peers, with stakeholders, and with the general public. Graphical representations have always been supported in research throughout the history of sciences, and particularly the life sciences (Figure 1).

I have come to realize how much I enjoy this aspect of my work, and also how much I wish I was better prepared for it! In this blogpost I will talk about visual communication in science, and tackle the question of how to make our plots, diagrams, powerpoints, figures, maps, etc. convey information that goes beyond any spoken language? I have compiled a few tips from the design and infographics fields that I think could be reinvested in our scientific communication material.

Figure 1. Illustration from anonymous biology book (credit: Katie Garrett)

Plan, order, design

This suggestion may appear like a rather simplistic piece of advice, but any form of communication should start with a plan. What is the name of my project, the goal, and the audience? A scientific conference poster will not be created with the same design as a flyer aimed at the general public, nor will the same tools be used. Libre office powerpoint, canva, inkscape, scribus, R, plotly, GIMP… these are the open-source software I use on a regular basis but there so many more possibilities!

For whatever the type of visual you want to create, there are two major rules that need to be considered. First, embrace the empty space! You may think that you are wasting space that could be filled by all sorts of extremely valuable pieces of information… but this empty space has a purpose all by itself. The empty space brings forward the central elements of your design and will help focus the attention of the viewer toward them (top panel of Figure 2). Second, keep it neat and aligned. Whether you choose to anchor elements to each other or to an invisible grid, pay attention to details so that all images and text in the design from a harmonious whole (bottom panel in Figure 2).

Figure 2. Empty spaces and alignment principles of design – examples presented by Kingcom (http://kingkom.net/12-criteres-hierarchie-visuelle/)

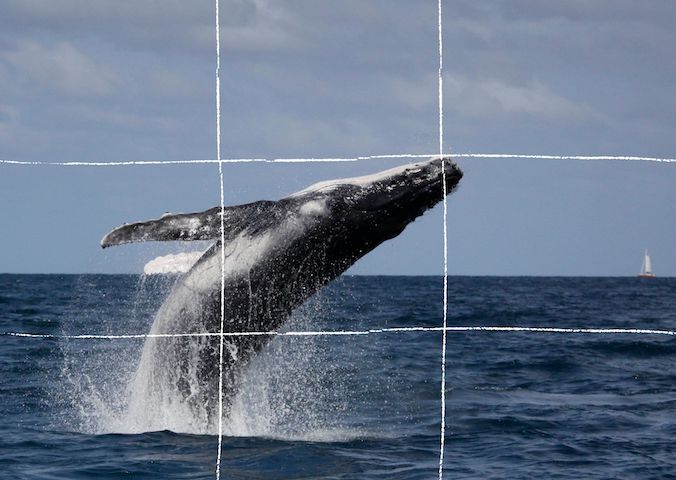
Alignment is also an essential aspect to consider when editing images. More than any text, images will provide the first impression to the viewer and may subjectively communicate ideas in an instant. To make them most effective, images may follow the ‘rule of thirds’. Imagine breaking the image down into thirds, hence creating four directive lines over it (Figure 3). Placing the points of interest of the image at the intersections or along the lines will provide balance and attract the viewer’s attention. In marine mammal science where we often use pictures of animals with the ocean as a background, aligning the horizon along one of these horizontal lines may be a good technique (which I have not followed in Figure 3 though!).

Figure 3. Rule of thirds example applied to a photo of a humpback whale calf (South Lagoon New Caledonia, credit: Opération Cétacés – Solène Derville). Notice how the tip of the calf’s jaw is at the intersection of two lines.

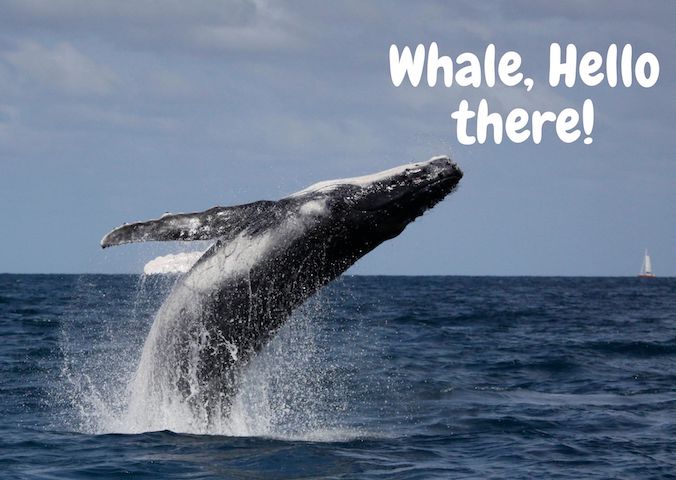
When adding text to images, it is important to not overwhelm illustrations with text by trying to use extensive written material (which happens much too often). I try to keep the text to the strict minimum and let the visuals speak for themselves. When including text over or next to an image, I place the text in the empty spaces, where the eye is drawn to (Figure 4). When using dark or contrasted images, I add a semi-transparent layer in between the text and the image to make my text pop out.

Figure 4. Text embedding example applied to a photo of a humpback whale calf (South Lagoon New Caledonia, credit: Opération Cétacés – Solène Derville). Notice how I placed the text in the empty space so that the nose of the calf would point to it.

Fonts

Tired of using Arial, Times and Calibri but don’t know which other font to pick? One good piece of advice I found online was to choose a font that complements the purpose of the design. To do so, it is necessary to choose the message before picking the font. There are three categories of fonts (show in Image 1):

– Serif (classic style designed for books as the little feet at the extremities of the letters guide the eye along the lines of text)

– Sans serif (designed to look clean on digital screen)

– Display (more personality, but to be used in small doses!)

Image 1. Examples of each font category

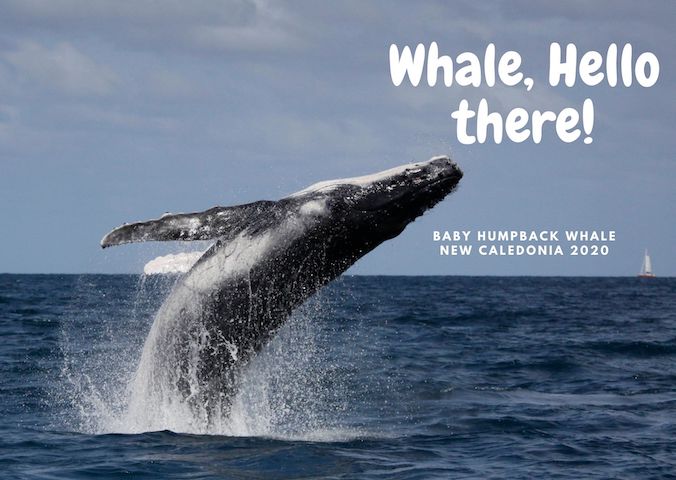
I have also learned that pairing fonts together is often about using opposites (Figure 5). Contrasting fonts are complementary. For instance, it is visually appealing to combine a very bold font with a very light font, or a round font with something tall. And if you need more font choices than the ones provided by your usual software, here is a web repository to freely download thousands of different fonts: https://www.dafont.com

Figure 5. Paired fonts example applied to a photo of a humpback whale calf (South Lagoon New Caledonia, credit: Opération Cétacés – Solène Derville). Notice how I combined a rounded  font with  a smaller  sans serif font.

Colors

Colors have inherent meaning that depends on individual cultures. Whether we want it or not, any plot, photo, or diagram that we present to an audience will carry a subliminal message depending on its color palette. So better make it fit with the message!

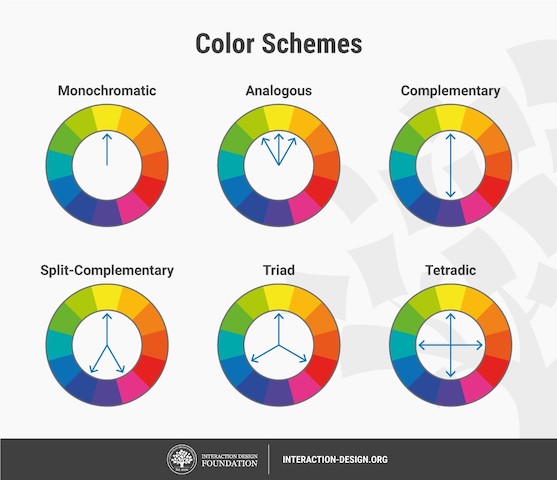
Let us go passed the boring blue shades we have used for all of our marine science presentations so far, and instead open ourselves up to an infinite choice of colors! Color nuances are defined by three things: hue (the color itself), saturation (intensity, whether the color looks more subtle or more vibrant), and value (how dark or light a color is, ranging from white to black). The color wheel helps us visualize the relationships between hues and pick the best associations (Figure 6).

Figure 6. The color wheel helps us visualize the relationships between hues and pick the best associations. Any of the principles above should work, from the simple monochromatic schemes to the more complex triad or tetradic schemes.

First, pick the main color, the hero color for your design. Choose a cool color (blues and greens) if you want to provide a calming impression or a warm color (reds and yellows) for something more energizing. This basic principle of color theory made me think back on the black/blue dark shaded presentations that I might have attended in the past and had trouble staying awake!

Now, create your color palette, which are the three to four colors that will compose your design, ideally combining some vibrant and some more neutral colors for contrast. For instance, in a publication, a color palette may be used consistently in all plots or figures to represent a set of variables, study areas, or species . Now how do you pick the right complementary colors? The color wheel provides you with a few basic principles that should help you choose a palette (Figure 6). From monochromatic to tetradic schemes, the choice is up to you:

– monochromatic colors: varying values or saturation of a given color picked in the wheel

– analogous colors: colors sitting next to each other in the wheel

– complementary color: colors sitting opposite to each other

If you are an R user, there are a myriad of color palettes available to produce your visuals. One of the most comprehensive list I have found was compiled by Emil Hvitfeldt in github (https://github.com/EmilHvitfeldt/r-color-palettes). For discrete color palettes, I enjoy using the Canva palettes, which are available both in the Canva designs and in R using the ‘canva’ library in combination with the ‘ggplot2’ library (https://www.canva.com/learn/100-color-combinations/).

In practice, this means I can produce R plots or maps with color codes that match those I use in my canva presentations or posters. And finally, thumbs up to Dawn and Clara for creating our very own GEMM lab color palette based on whale photos collected in the field (Figure 7: https://github.com/dawnbarlow/musculusColors)!

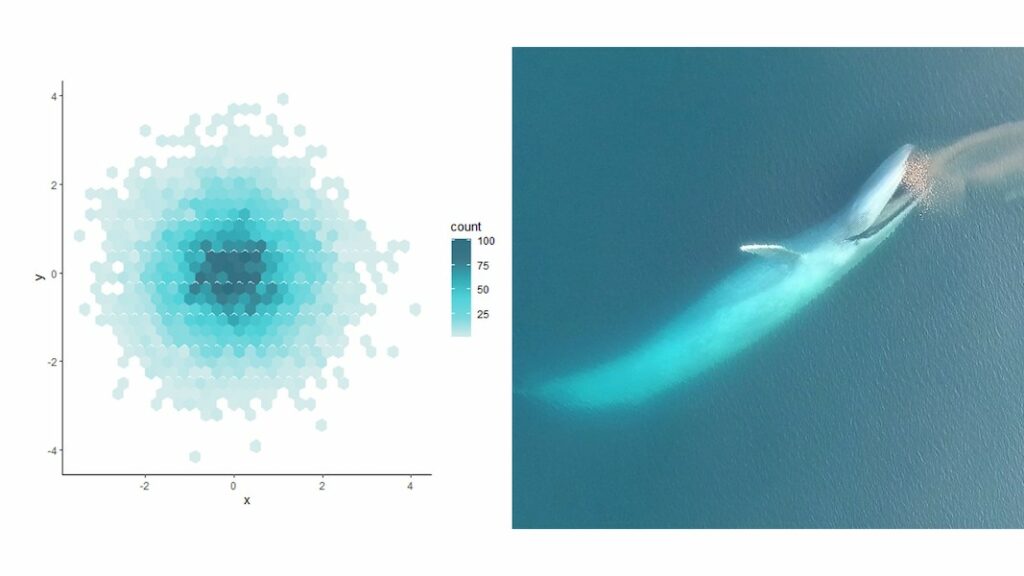
Figure 7: Example of a R plot colored with the musculusColors package using the blue whale “Bmlunge” palette (credit: Dawn Barlow & Clara Bird)

I hope these few tips help you make your science as look as pretty as it is in your mind!

Sources:

A lot of the material in this blog post was inspired by the free tutorials provided by Canva: https://designschool.canva.com/courses/graphic-design-basics/?lesson=design-to-communicate

About the rule of thirds: https://digital-photography-school.com/rule-of-thirds/

About alignment: https://blog.thepapermillstore.com/design-principles-alignment/

Connecting Research Questions

Clara Bird, Masters Student, OSU Department of Fisheries and Wildlife, Geospatial Ecology of Marine Megafauna Lab

The field season can be quite a hectic time of year. Between long days out on the water, trouble-shooting technology issues, organizing/processing the data as it comes in, and keeping up with our other projects/responsibilities, it can be quite overwhelming and exhausting.

But despite all of that, it’s an incredible and exciting time of year. Outside of the field season, we spend most of our time staring at our computers analyzing the data that we spend a relatively short amount of time collecting. When going through that process it can be easy to lose sight of why we do what we do, and to feel disconnected from the species we are studying. Oftentimes the analysis problems we encounter involve more hours of digging through coding discussion boards than learning about the animals themselves. So, as busy as it is, I find that the field season can be pretty inspiring. I have recently been looking through our most recent drone footage of gray whales and feeling renewed excitement for my thesis.

At the moment, my thesis has four central questions: (1) Are there associations between habitat type and gray whale foraging tactic? (2) Is there evidence of individualization? (3) What is the relationship between behavior and body condition? (4) Do we see evidence of learning in the behavior of mom and calf pairs? As I’ve been organizing my thoughts, what’s become quite clear is how interconnected these questions are. So, I thought I’d take this blog to describe the potential relationships.

Let’s start with the first question: are there associations between habitat types and gray whale foraging tactics? This question is central because it relates foraging behavior to habitat, which is ultimately associated with prey. This relationship is the foundation of all other questions involving foraging tactics because food is necessary for the whales to have the energy and nutrients they need to survive. It’s reasonable to think that the whales are flexible and use different foraging tactics to eat different prey that live in different habitats. But, if different prey types have different nutritional value (this is something that Lisa is studying right now; check out the COZI project to learn more), then not all whales may be getting the same nutrients.

The next question relates to the first question but is not necessarily dependent on it. It’s the question of individualization, a topic Lisa also explored in a past blog. Within our Oregon field sites we have documented a variety of gray whale foraging tactics (Torres et al. 2018; Video 1) but we do not know if all gray whales use all the tactics or if different individuals only use certain tactics. While I think it’s unlikely that one whale only uses one tactic all the time, I think we could see an individual use one tactic more often than the others. I reason that there could be two reasons for this pattern. First, it could be a response to resource availability; certain tactics are more efficient than others, this could be because the tactic involves capturing the more nutritious prey or because the behavior is less energetically demanding. Second, foraging tactics are socially learned as calves from their mothers, and hence individuals use those learned tactics more frequently. This pattern of maternally inherited foraging tactics has been documented in other marine mammals (Mann and Sargeant 2009; Estes et al. 2003). These questions between foraging tactic, habitat and individualization also tie into the remaining two questions.

My third question is about the relationship between behavior and body condition. As I’ve discussed in a previous blog, I am interested in assessing the relative energetic costs and benefits of the different foraging tactics. Is one foraging tactic more cost-effective than another (less energy out per energy in)? Ever since our lab’s cetacean behavioral ecology class, I’ve been thinking about how my work relates to niche partitioning theory (Pianka 1974).This theory states that when there is low prey availability, niche partitioning will increase. Niche partitioning can occur across several different dimensions: for instance, prey type, foraging location, and time of day when active. If gray whales partition across the prey type dimension, then different whales would feed on different kinds of prey. If whales partition resources across the foraging location dimension, individuals would feed in different areas. Lastly, if whales partition resources across the time axis, individuals would feed at different times of day. Using different foraging tactics to feed on different prey would be an example of partitioning across the prey type dimension. If there is a more preferable prey type, then maybe in years of high prey availability, we would see most of the gray whales using the same tactics to feed on the same prey type. However, in years of low prey availability we might expect to see a greater variety of foraging tactics being used. The question then becomes, does any whale end up using the less beneficial foraging tactic? If so, which whales use the less beneficial tactic? Do the same individuals always switch to the less beneficial tactic? Is there a common characteristic among the individuals that switched, like sex, age, size, or reproductive status? Lemos et al. (2020) hypothesized that the decline in body condition observed from 2016 to 2017 might be a carryover effect from low prey availability in 2016. Could it be that the whales that use the less beneficial tactic exhibit poor body condition the following year?

My fourth, and final, question asks if foraging tactics are passed down from moms to their calves. We have some footage of a mom foraging with her calf nearby, and occasionally it looks like the calf could be copying its mother. Reviewing this footage spiked my interest in seeing if there are similarities between the behavior tactics used by moms and those used by their calves after they have been weaned. While this question clearly relates to the question of individualization, it is also related to body condition: what if the foraging tactics used by the mom is influenced by her body condition at the time?

I hope to answer some of these fascinating questions using the data we have collected during our long field days over the past 6 years. In all likelihood, the story that comes together during my thesis research will be different from what I envision now and will likely lead to more questions. That being said, I’m excited to see how the story unfolds and I look forward to sharing the evolving ideas and plot lines with all of you.

References

Estes, J A, M L Riedman, M M Staedler, M T Tinker, and B E Lyon. 2003. “Individual Variation in Prey Selection by Sea Otters: Patterns, Causes and Implications.” Source: Journal of Animal Ecology. Vol. 72.

Mann, Janet, and Brooke Sargeant. 2009. “ Like Mother, like Calf: The Ontogeny of Foraging Traditions in Wild Indian Ocean Bottlenose Dolphins ( Tursiops Sp.) .” In The Biology of Traditions, 236–66. Cambridge University Press. https://doi.org/10.1017/cbo9780511584022.010.

Pianka, Eric R. 1974. “Niche Overlap and Diffuse Competition” 71 (5): 2141–45.

Soledade Lemos, Leila, Jonathan D Burnett, Todd E Chandler, James L Sumich, and Leigh G. Torres. 2020. “Intra‐ and Inter‐annual Variation in Gray Whale Body Condition on a Foraging Ground.” Ecosphere 11 (4). https://doi.org/10.1002/ecs2.3094.

Torres, Leigh G., Sharon L. Nieukirk, Leila Lemos, and Todd E. Chandler. 2018. “Drone up! Quantifying Whale Behavior from a New Perspective Improves Observational Capacity.” Frontiers in Marine Science 5 (SEP). https://doi.org/10.3389/fmars.2018.00319.

Milling around in definitions

Clara Bird, Masters Student, OSU Department of Fisheries and Wildlife, Geospatial Ecology of Marine Megafauna Lab

A big part of graduate school involves extensive reading to learn about the previous research conducted in the field you are joining and the embedded foundational theories. A firm understanding of this background literature is needed in order to establish where your research fits. Science is a constructive process; to advance our disciplines we must recognize and build upon previous work. Hence, I’ve been reading up on the central topic of my thesis: behavioral ecology. It is equally important to study the methods used in these studies as to understand the findings. As discussed in a previous blog, ethograms are a central component of the methodology for studying behavior. Ethograms are lists of defined behaviors that help us properly and consistently collect data in a standardized approach. It is especially important in a project that spans years to know that the data collected at the beginning was collected in the same way as the data collected at the end of the project.

While ethograms and standardized methods are commonly used within a study, I’ve noticed from reading through studies on cetaceans, a lack of standardization across studies. Not all behaviors that are named the same way have matching definitions, and not all behaviors with similar definitions have matching names. Of all the behaviors, “milling” may be the least standardized.

While milling is not in our ethogram (Leigh believes this term is a “cheat” for when behavior is actually “unknown”), we occasionally use “milling” in the field to describe when the gray whales are swimming around in an area, not foraging, but not in any other primary behavior state (travel, social, or rest). Sometimes we use when we think the whale may be searching, but we aren’t 100% sure yet. A recent conversation during a lab meeting on the confusing nature of the term “milling” inspired me to dig into the literature for this blog. I searched through the papers I’ve saved for my literature review and found 18 papers that used the term milling. It was fascinating to read how variably the term has been defined and used.

When milling was defined in these papers, it was most commonly described as numerous directional changes in movement within a restricted area 1–8. Milling often co-occurred with other behavior states. Five of these eight studies described milling as co-occurring with foraging behavior 3–6,8. In one case, milling was associated with foraging and slow movement 8. While another study described milling as passive, slow, nondirectional movement 9.

Eight studies used the term milling without defining the behavior 10–17. Of these, five described milling as being associated with other behavior states. Three studies described milling as co-occurring with foraging 10,14,16, one said that it co-occurred with social behavior 13, and another described milling as being associated with resting/slow movement 12.

In addition to this variety of definitions and behavior associations, there were also inconsistencies with the placement of “milling” within ethograms. In nine studies, milling was listed as a primary state 1,2,4,7–9,15,17,18. But, in two studies that mentioned milling and used an ethogram, milling was not included in the ethogram 6,14.

Diving into the associations between milling and foraging reveal how varied the use of milling has been within the cetacean literature. For example, two studies simply described milling as occurring near foraging in time 10,16. While another two studies explained that milling was applied in situations where there was evidence of feeding without feeding being directly observed 8,14. Bobkov et al. (2019) described milling as occurring between feeding cycles along with breathing. Lastly, two studies describe milling as a behavior within the foraging primary state 3,5, while another study described feeding as a behavior within milling 4.

It’s all rather confusing, huh? Across these studies, milling has been defined, mentioned without being defined, included in ethograms as a primary state, included in ethograms as a sub-behavior, and excluded from ethograms. Milling has also been associated with multiple primary behavior states (foraging, resting, and socializing). It has been described as both passive 9 and slow 12, and strong 16 and active 5.

It appears that milling is often used to describe behaviors that the observer cannot distinctly classify or describe its function. I have also struggled to define these times when a whale is in between behavior states; I often end up calling it “just being a whale”, which includes time spent breathing at the surface, or just swimming around.

As I’ve said above, Leigh thinks that this term is a “cheat” for when a behavior is actually “unknown”. I think we have trouble equating “milling” with “unknown” because it seems like “unknown” should refer to a behavior where we can’t quite tell what the whale is doing. However, during milling, we can see that the whale is swimming at the surface. But here’s the thing, while we can see what the whale is doing, the function of the behavior is still unknown. Instead of using an indistinct term, we should use a term that better describes the behavior.  If it’s swimming at the surface, name the behavior “swimming at the surface”. If we can’t tell what the whale is doing because we can’t quite see what it’s doing, then name the behavior “unknown-partially visible”. Instead of using vague terminology, we should use clear names for behaviors and embrace using the term “unknown”.

I am most certainly not criticizing these studies as they all provided valuable contributions and interesting results. The studies that asked questions about behavioral ecology defined milling. The term was mentioned without being defined in studies focused on other topics. So, defining behaviors mentioned was less important.

With this exploration into the use of “milling” in studies, I am not implying that all behavioral ecologists need to agree on the use of the same behavior terms. However, I have learned clear definitions are critical. This lesson is also important outside of behavioral ecology. Different labs, and different people, use different terms for the same things. As I dig into my thesis, I am keeping a list of terminology I use and how I define those terms, because as I learn more, my terminology evolves and changes. For example, at the beginning of my thesis I used “sub-behavior” to refer to behaviors within the primary state categories. But, now after chatting with Leigh and learning more, I’ve decided to use the term “tactic” instead as these are often processes or events that contribute to the broader behavior state. My running list of terminology helps me remember what I meant when I used a certain word, so that when I read my notes from three months ago, I can know what I meant.  Digging into the literature for this blog reminded me of the importance of clearly defining all terminology and never assuming that everyone uses the same term in the same way.

Check out these videos to see some of the behaviors we observe:

References

1.        Mallonee, J. S. Behaviour of gray whales (Eschrichtius robustus) summering off the northern California coast, from Patrick’s Point to Crescent City. Can. J. Zool. 69, 681–690 (1991).

2.        Clarke, J. T., Moore, S. E. & Ljungblad, D. K. Observations on gray whale (Eschrichtius robustus) utilization patterns in the northeastern Chukchi Sea. Can. J. Zool 67, (1988).

3.        Ingram, S. N., Walshe, L., Johnston, D. & Rogan, E. Habitat partitioning and the influence of benthic topography and oceanography on the distribution of fin and minke whales in the Bay of Fundy, Canada. J. Mar. Biol. Assoc. United Kingdom 87, 149–156 (2007).

4.        Lomac-MacNair, K. & Smultea, M. A. Blue Whale (Balaenoptera musculus) Behavior and Group Dynamics as Observed from an Aircraft off Southern California. Anim. Behav. Cogn. 3, 1–21 (2016).

5.        Lusseau, D., Bain, D. E., Williams, R. & Smith, J. C. Vessel traffic disrupts the foraging behavior of southern resident killer whales Orcinus orca. Endanger. Species Res. 6, 211–221 (2009).

6.        Bobkov, A. V., Vladimirov, V. A. & Vertyankin, V. V. Some features of the bottom activity of gray whales (Eschrichtius robustus) off the northeastern coast of Sakhalin Island. 1, 46–58 (2019).

7.        Howe, M. et al. Beluga, Delphinapterus leucas, ethogram: A tool for cook inlet beluga conservation? Mar. Fish. Rev. 77, 32–40 (2015).

8.        Clarke, J. T., Christman, C. L., Brower, A. A. & Ferguson, M. C. Distribution and Relative Abundance of Marine Mammals in the northeastern Chukchi and western Beaufort Seas, 2012. Annu. Report, OCS Study BOEM 117, 96349–98115 (2013).

9.        Barendse, J. & Best, P. B. Shore-based observations of seasonality, movements, and group behavior of southern right whales in a nonnursery area on the South African west coast. Mar. Mammal Sci. 30, 1358–1382 (2014).

10.      Le Boeuf, B. J., M., H. P.-C., R., J. U. & U., B. R. M. and F. O. High gray whale mortality and low recruitment in 1999: Potential causes and implications. (Eschrichtius robustus). J. Cetacean Res. Manag. 2, 85–99 (2000).

11.      Calambokidis, J. et al. Abundance, range and movements of a feeding aggregation of gray whales (Eschrictius robustus) from California to southeastern Alaska in 1998. J. Cetacean Res. Manag. 4, 267–276 (2002).

12.      Harvey, J. T. & Mate, B. R. Dive Characteristics and Movements of Radio-Tagged Gray Whales in San Ignacio Lagoon, Baja California Sur, Mexico. in The Gray Whale: Eschrichtius Robustus (eds. Jones, M. Lou, Folkens, P. A., Leatherwood, S. & Swartz, S. L.) 561–575 (Academic Press, 1984).

13.      Lagerquist, B. A. et al. Feeding home ranges of pacific coast feeding group gray whales. J. Wildl. Manage. 83, 925–937 (2019).

14.      Barrett-Lennard, L. G., Matkin, C. O., Durban, J. W., Saulitis, E. L. & Ellifrit, D. Predation on gray whales and prolonged feeding on submerged carcasses by transient killer whales at Unimak Island, Alaska. Mar. Ecol. Prog. Ser. 421, 229–241 (2011).

15.      Luksenburg, J. A. Prevalence of External Injuries in Small Cetaceans in Aruban Waters, Southern Caribbean. PLoS One 9, e88988 (2014).

16.      Findlay, K. P. et al. Humpback whale “super-groups” – A novel low-latitude feeding behaviour of Southern Hemisphere humpback whales (Megaptera novaeangliae) in the Benguela Upwelling System. PLoS One 12, e0172002 (2017).

17.      Villegas-Amtmann, S., Schwarz, L. K., Gailey, G., Sychenko, O. & Costa, D. P. East or west: The energetic cost of being a gray whale and the consequence of losing energy to disturbance. Endanger. Species Res. 34, 167–183 (2017).

18.      Brower, A. A., Ferguson, M. C., Schonberg, S. V., Jewett, S. C. & Clarke, J. T. Gray whale distribution relative to benthic invertebrate biomass and abundance: Northeastern Chukchi Sea 2009–2012. Deep. Res. Part II Top. Stud. Oceanogr. 144, 156–174 (2017).

How we plan to follow whales

Clara Bird, Masters Student, OSU Department of Fisheries and Wildlife, Geospatial Ecology of Marine Megafauna Lab

The GEMM Lab gray whale team is in the midst of preparing for our fifth field season studying the Pacific Coast Foraging Group (PCFG): whales that forage off the coast of Newport, OR, USA each summer. On any given good weather day from June to October, our team is out on the water in a small zodiac looking for gray whales (Figure 1). When we find a gray whale, we try to collect photo ID data, fecal samples, drone data, and behavioral data. We use the drone data to study both the whale’s body condition and their behavior. In a previous blog, I described ethograms and how I would like to use the behavior data from drone videos to classify behaviors, with the ultimate goal of understanding how gray whale behavior varies across space, time, and by individual. However, this explanation of studying whale behavior is actually a bit incomplete. Before we start fieldwork, we first need to decide how to collect that data.

Figure 1. Image of GEMM lab team collecting gray whale UAS data. Image taken under NOAA/NMFS permit #16111

As observers, we are far from omnipresent and there is no way to know what the animals are doing all of the time. In any environment, scientists have to decide when and where to observe their animals and what behaviors they are interested in recording. In many studies, behavior is recorded live by an observer. In those studies, other limitations need to be taken into account, such as human error and observer fatigue. Collecting behavioral data is particularly challenging in the marine environment. Cetaceans spend most of their lives out of sight from humans, their time at the surface is brief, and when they appear together in large groups it can be very difficult to keep track of who is doing what when. Imagine being in a boat trying to keep track of what three different whales are doing without a pre-determined method – the task could quickly become overwhelming and biased. This is why we need a methodology for collecting and classifying behavior. We cannot study behavior without acknowledging these limitations and the potential biases that come with the methods we choose. Different data collection methods are better suited to address different questions.

The use of drones gives us the ability to record cetacean behavior non-invasively, from a perspective that allows greater observation (Figure 2, Torres et al. 2018), and for later review, which is a significant improvement. However, as we prepare to collect more behavior data, we need to study the methods and understand the benefits and disadvantages of each approach so that we capture the information we need without bias. Altmann (1974) provides a thorough overview of behavioral sampling methods.

Figure 2. Diagram illustrating “whale surface time” relative to “whale visible time” data as collected from an unmanned aerial systems (UAS) aircraft flying over a gray whale as it moves sequentially (from right to left) from “headstand” foraging to surfacing. Figure from Torres et al. (2018).

Ad libitum behavioral sampling has no structure and occurs when we find a group of whales and just write down everything they are doing. This method is a good first step, however it comes with bias.  Without structure, we cannot be sure that there was an equal probability of detecting each kind of behavior; this problem is called detectability bias. This type of bias is an issue if we are trying to answer questions about how often a behavior occurs, or what percent of time is spent in each behavior state. This is a bias to be especially concerned about when it comes to cetaceans because there are many examples of behaviors with different levels of detectability. An extreme example would be the detectability of breaching versus a behavior that takes place under the surface. A breaching whale is easier to spot and more exciting, which could lead to results suggesting that whales breach more often than they do relative to underwater behaviors. While it’s impossible to eliminate detectability bias, other sampling methods employ decision rules to try and reduce its effect. Many decision rules revolve around time, such as setting a minimum or maximum observation time interval. Other time rules involve recording the behavior state at set intervals of time (e.g., every 5 minutes). Setting observation boundaries helps standardize the methods and the data being collected.

In a structured sampling plan, the first big decision that needs to be addressed is the need to know the duration of behaviors. Point events do not include duration data but can be used to study the frequencies of behaviors. For example, if my research question was “Do whales perform “headstands” in a specific habitat type?”, then I would need point events of headstanding behavior. But, if I wanted to ask, “Do whales spend more time spent headstanding in a specific habitat type than in other habitat types?”, I would need headstanding to be a state event. State events are events with associated duration information and can be used for activity budgets. Activity budgets show how much time an animal spends in each behavior state. Some sampling methods focus on collecting only point events. However, to get the most complete understanding of behavior I think it’s important to collect both. Focal animal follows are another method of collecting more detailed data and is commonly used in cetacean studies.

The explanation of a focal follow method is in the name.  We focus on one individual, follow it, and record all of its behaviors. When employing this method, decisions are made about how an individual is chosen and how long it is followed. In some cases, the behavior of this animal is used as a proxy for the behavior of an entire group. I essentially use the focal follow method in my research. While I review drone footage to record behavioral data instead of recording behaviors live in the field, I focus on one individual a time as I go through the videos. To do this I use a software called BORIS (Friard and Gamba 2016) to mark the time of each behavior per individual (Figure 3). If there are three individuals in a video, I’ll review the footage three times to record behaviors once per individual, focusing on each in turn.

Figure 3. Screenshot of BORIS layout.

While the drone footage brings the advantages of time to review and a better view of the whale, we are constrained by the duration of a flight. Focal follows would ideally last longer than the ~15 minutes of battery life per drone flight. Our previously collected footage gives us snapshots of behavior, and this makes it challenging to compare and analyze durations of behaviors. Therefore, I am excited that we are going to try conducting drone focal follows this summer by swapping out drones when power runs low to achieve longer periods of video coverage of whale behavior. I’ll be able to use these data to move from snapshots to analyzing longer clips and better understanding the behavioral ecology of gray whales. As exciting as this opportunity is, it also presents the challenge of method development. So, I now need to develop decision rules and data collection methods to answer the questions that I have been eagerly asking.

References

Altmann, Jeanne. 1974. “Observational Study of Behavior: Sampling Methods.” Behaviour 49 (3–4): 227–66. https://doi.org/10.1163/156853974X00534.

Friard, Olivier, and Marco Gamba. 2016. “BORIS: A Free, Versatile Open-Source Event-Logging Software for Video/Audio Coding and Live Observations.” Methods in Ecology and Evolution 7 (11): 1325–30. https://doi.org/10.1111/2041-210X.12584.

Torres, Leigh G., Sharon L. Nieukirk, Leila Lemos, and Todd E. Chandler. 2018. “Drone up! Quantifying Whale Behavior from a New Perspective Improves Observational Capacity.” Frontiers in Marine Science 5 (SEP). https://doi.org/10.3389/fmars.2018.00319.