Learning by teaching

By: Kate Colson, MSc Student, University of British Columbia, Institute for the Oceans and Fisheries, Marine Mammal Research Unit

One of the most frequent questions graduate students get asked (besides when you are going to graduate) is what their plans are after university. For me, the answer has always adamantly been continuing to do research, most likely as a government researcher because I don’t want teaching commitments to take away from my ability to conduct research.

However, one of the most fulfilling parts of my degree at University of British Columbia has actually been teaching four terms of a 100-level undergraduate science course focused on developing first-year students’ critical thinking, data interpretation, and science communication skills. My role in the course has been facilitating active learning activities that exercise these skills and reviewing material the students go over in their pre-class work. Through this course, I have experienced the teaching styles of six different professors and practiced my own teaching. As with any skill, there is always room for improvement, so when I had a chance to read a book titled How Learning Works: Seven Research-Based Principles for Smart Teaching (Ambrose et al. 2010), I took it as an opportunity to further refine my teaching and explore why some practices are more effective than others.

In the book, Ambrose et al. present principles of learning, the research surrounding these principles and examples for incorporating them into a university level course. Some of the principles gave me ideas for strategies to incorporate into my teaching to benefit my students. These described how prior knowledge impacts student learning and how to use goal-oriented practice and give feedback relative to target criteria that the students can apply to the next practice task. For example, I learned to be more conscious about how I explain and clarify course material to make connections with what the students have learned previously, so they can draw on that prior knowledge. Other principles presented by Ambrose et al. were more complex and offered a chance for greater reflection.

Beyond presenting strategies for improving teaching, the book also presented research that supported what I had learned firsthand through teaching. These principles related to the factors that motivate students to learn and why the course climate matters for learning. I have seen how student motivation is impacted by the classroom climate and culture put forth by the teaching team. Perhaps the most frustrating experiences I have had teaching were when one member of the teaching team does not see the importance of fostering a supportive course environment.

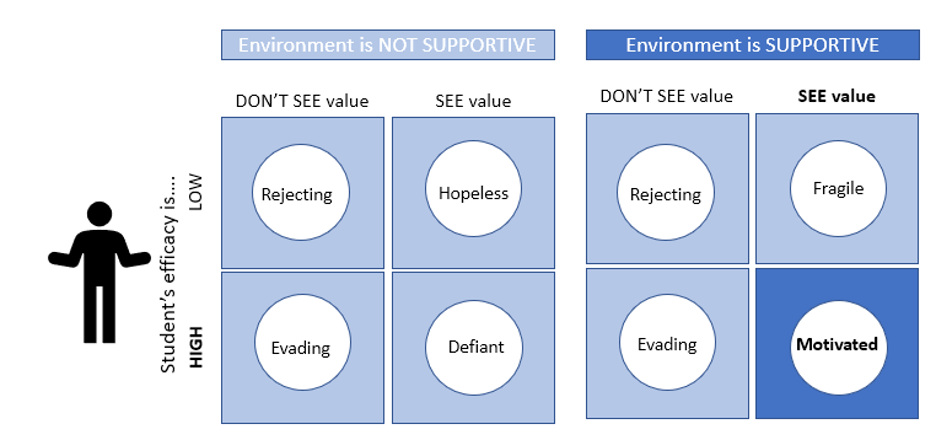
For this reason, my favorite assignments have been the Thrive Contract and the Group Contract. Each term, the Thrive Contract is the first major class activity, and the Group Contract is the first group assignment. These assignments serve as a means for everyone to co-create guidelines and expectations and establish a positive classroom culture for the rest of the term. After an exceptionally poor classroom experience my first time teaching, I have highlighted the importance of the Thrive Contract in all subsequent terms. Now, I realize the significance I lent this assignment is supported by the research on the importance for a supportive environment to maximize student motivation and encourage classroom engagement (Figure 1).

Another powerful lesson I have learned through teaching is the importance of clarifying the purpose of an activity to the students. Highlighting a task’s objective is also supported by research to ensure that students ascribe value to the assigned work, increasing their motivation (Figure 1).  In my teaching, I have noticed a trend of lower student participation and poorer performance on assignments when a professor does not emphasize the importance of the task. Reviewing the research that shows the value of a supportive course climate has further strengthened my belief in the importance of ensuring that students understand why their teaching team assigns each activity.

Figure 1. How environment, student efficacy, and value interact to impact motivation. The above figure shows that motivation is optimized when students see the value in a goal, believe they have the skills to achieve the goal, and are undertaking the goal in a supportive class environment (the bright blue box in the bottom right corner). If this situation were to occur in an unsupportive class environment, defiant behaviour (e.g. “I’ll prove you wrong” attitude) is likely to occur in response to the lack of support, as the student sees the value in the goal and believes in their ability to achieve the goal. Rejecting behaviour (e.g., disengagement) occurs when the student does not associate value to a task and does not believe in their ability to complete the goals regardless of the environment.  Evading behaviour (e.g., lack of attention or minimal effort) results when students are confident in their ability to complete a task, but do not see the goal as meaningful in both supportive and unsupportive environment. When a student sees the importance of the goal but are not confident in their ability to complete it, they become hopeless (e.g., have no expectation of success and act helpless) when in an unsupportive environment and fragile (e.g., feign understanding, deny difficulty, or make excuses for poor performance) in a supportive environment.  Diagram adapted from Ambrose et al. (2010) Figure 3.2 incorporating the works of Hansen (1989) & Ford (1992).

Potentially my favorite part about the structure of Ambrose’s book was that it offered me a chance to reflect not only on teaching, but also on my own learning and cognitive growth since I started my master’s degree. Graduate students are often in a unique position in which we are both students and teachers depending on the context of our surroundings. The ability to zoom out and realize how far I have come in not only teaching others, but also in teaching myself, has been humbling. My reflection on my own learning and growth has been driven by learning about how organizing knowledge affects learning, how mastery is developed and how students become self-directed learners.

One of the main differences between novices and experts in how they organize their knowledge is the depth of that knowledge and the connections made between different pieces of information. Research has shown that experts hold more connections between concepts, which allows for faster and easier retrieval of information that translates into ease in applying skills to different tasks (Bradshaw & Anderson, 1982; Reder & Anderson, 1980; Smith, Adams, & Schorr, 1978). Currently in my degree, I am experiencing this ease when it comes to coding my analysis and connecting my research to the broader implications for the field. By making these deeper connections across various contexts, I am building a more complex knowledge structure, thus progressing towards holding a more expert organization of knowledge.

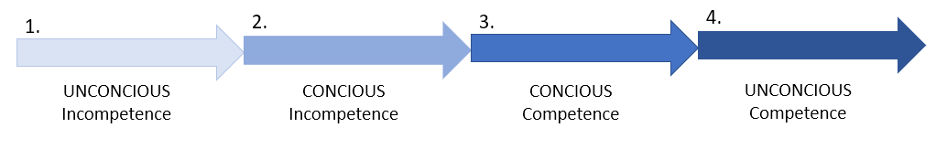
In the stages of mastery concept proposed by Sprague and Stewart (2000), learners progress from unconscious incompetence where the student doesn’t know what they don’t know, to conscious incompetence where they have become aware of what they need to know (Figure 2). This was where I was when I started my master’s — I knew what objectives I wanted to achieve with my research, but I needed to learn the skills necessary for me to be able to collect the data and analyze it to answer my research questions. The next stage of mastery is conscious competence, in which the ability of the learner to function in their domain has greatly increased, but practicing the necessary skills still requires deliberate thinking and conscious actions (Figure 2). This is the level I feel I have progressed to — I am much more comfortable performing the necessary tasks related to my research and talking about how my work fills existing knowledge gaps in the field. However, it still helps to talk out my proposed plans with true masters in the field. The final stage of mastery, unconscious competence, is where the learner has reached a point where they can practice the skills of their field automatically and instinctively such that they are no longer aware of how they enact their knowledge (Figure 2).

Figure 2. Stages of mastery showing how the learner consciousness waxes and then wanes as competence is developed. Unconscious states refer to those where the learner is not aware of what they are doing or what they know, whereas conscious states have awareness of thoughts and actions. Competence refers to the ability of the learner to perform tasks specific to the field they are trying to master. Diagram adapted from Ambrose et al. (2010) Figure 4.2 incorporating the works of Sprague & Stewart (2000).

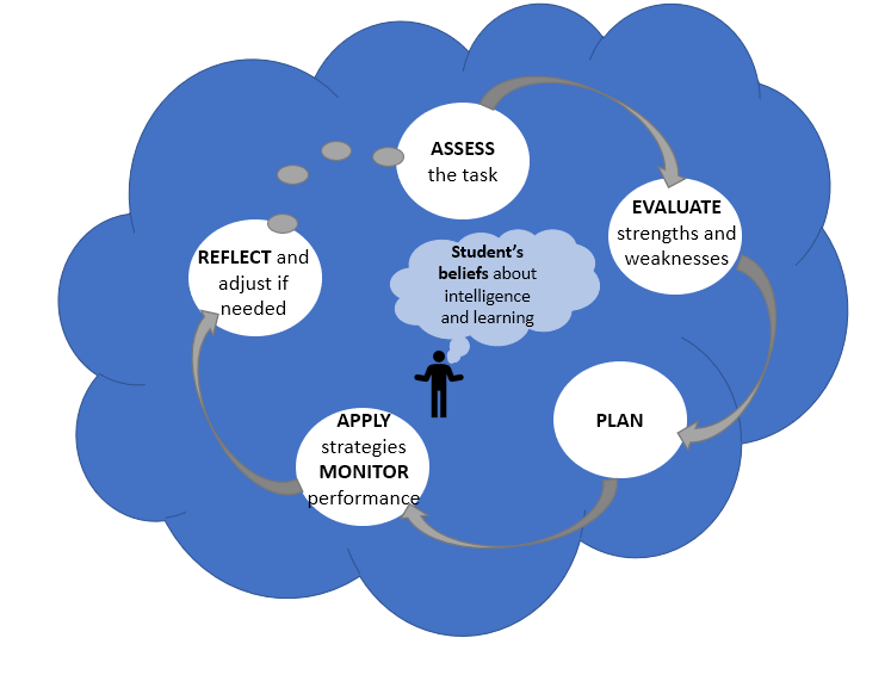
In line with my progression to higher levels of mastery has come the development of metacognitive skills that have helped me become a better self-directed learner. Metacognition is the process of learning how to learn, requiring the learner to monitor and control their learning through various processes (Figure 3). The most exciting part of my metacognitive growth I have noticed is the greater independence I have in my learning. I am much better at assessing what is needed to complete specific tasks and planning my particular approach to successfully achieve that goal (e.g., the construction of a Hidden Markov model from my last blog). By becoming more aware of my own strengths and weaknesses as a learner, I am better able to prepare and give myself the support needed for completing certain tasks (e.g., reaching out to experts to help with my model construction as I knew this was an area of weakness for me). By becoming more aware of how I am monitoring and controlling my learning, I know I am setting myself up for success as a lifelong learner.

Figure 3. Metacognition requires learner to monitor and control their learning through various processes. These processes involve the learner assessing the necessary skills needed for a task, evaluating their strengths and weaknesses with regards to the assigned task, and planning a way to approach the task. Once a plan has been made, the learner then must apply the strategies involved from the plan and monitor how those strategies are working to accomplish the assigned task. The learner must then be able to decide if the planned approach and applied strategies are effectively accomplishing the assigned task and adjust as needed with a re-assessment of the task that begins the processing cycle over again. Underlying each of these metacognitive processes are the learner’s belief in their own abilities and their perceptions of their intelligence. For example, students who believe their intelligence cannot be improved and do not have a strong sense of efficacy will be less likely to expend effort in metacognitive processes as they believe the extra effort will not influence the results. This contrasts with students who believe their intelligence will increase with skills development and have a strong belief in their abilities, as these learners will see the value in putting in the effort of trying multiple plans and adjusting strategies.  Diagram adapted from Ambrose et al. (2010) Figure 7.1 incorporating the cycle of adaptive learning proposed by Zimmerman (2001).
Loading

References:

Ambrose, S. A., Bridges, M. W., DiPietro, M., Lovett, M. C., & Norman, M. K. (2010). How learning works: Seven research-based principles for smart teaching (1st ed.). San Francisco, CA: Jossey-Bass. 

Bradshaw, G. L., & Anderson, J. R. (1982). Elaborative encoding as an explanation of levels of processing. Journal of Verbal Learning and Verbal behaviours, 21,165-174.

Ford, M. E. (1992). Motivating humans: Goals, emotions and personal agency beliefs. Newbury Park, CA: Sage Publications, Inc.

Hansen, D. (1989). Lesson evading and dissembling: Ego strategies in the classroom. American Journal of Education, 97, 184-208.

Reder, L. M., & Anderson, J. R. (1980). A partial resolution of the paradox of interference: The role of integrating knowledge.  Cognitive Psychology, 12,  447-472.

Smith, E. E., Adams, N., & Schorr, D. (1978). Fact retrieval and the paradox of interference. Cognitive Psychology, 10, 438-464.

Sprague, J., & Stewart, D. (2000). The speaker’s handbook. Fort Worth, TX: Harcourt College Publishers.

Zimmerman, B. J. (2001). Theories of self-regulated learning and academic achievement: An overview and analysis. In B. J. Zimmerman & D. H. Schunk (Eds.), Self-regulated learning and academic achievement (2nd ed., pp. 1-38). Hillsdale, NJ: Erlbaum.

Learning from teaching

Clara Bird, PhD Student, OSU Department of Fisheries and Wildlife, Geospatial Ecology of Marine Megafauna Lab

Based on my undergrad experience I assumed that most teaching in grad school would be as a teaching assistant, and this would consist of teaching labs, grading, leading office hours, etc. However, now that I’m in graduate school, I realize that there are many different forms of teaching as a graduate student. This summer I worked as an instructor for an e-campus course, which mainly involved grading and mentoring students as they developed their own projects. Yet, this past week I was a guest teacher for Physiology and Behavior of Marine Megafauna, which was a bit more involved.

I taught a whale photogrammetry lab that I originally developed as a workshop with a friend and former lab mate, KC Bierlich, at the Duke University Marine Robotics and Remote Sensing (MaRRS) lab when I worked there. Similar to Leila’s work, we were using photogrammetry to measure whales and assess their body condition. Measuring a whale is a deceivingly simple task that gets complicated when taking into account all the sources of error that might affect measurement accuracy. It is important to understand the different sources of error so that we are sure that our results are due to actual differences between whales instead of differences in errors.

Error can come from distortion due to the camera lens, inaccurate altitude measurements from the altimeter, the whale being arched, or from the measurement process. When we draw a line on the image to make a measurement (Image 1), measurement process errors come from the line being drawn incorrectly. This potential human error can effect results, especially if the measurer is inexperienced or rushing. The quality of the image also has an effect here. If there is glare, wake, blow or refraction covering or distorting the measurer’s view of the full body of the whale then the measurer has to estimate where to begin and end the line. This estimation is subjective and, therefore, a source of error. We used the workshop as an opportunity to study these measurement process errors because we could provide a dataset including images of varying qualities and collect data from different measurers.

Image 1. Screenshot of measuring the widths along a minke whale in MorphoMetriX. Source: https://github.com/wingtorres/morphometrix/blob/master/images/Picture4.png

This workshop started as a one-day lecture and lab that we designed for the summer drone course at the Duke Marine Lab. The idea was to simultaneously teach the students about photogrammetry and the methods we use, while also using all the students’ measurements to study the effect of human error and image quality on measurement accuracy. Given this one-day format, we ambitiously decided to teach and measure in the morning, compile and analyze the students’ measurements over lunch, and then present the results of our error analysis in the afternoon. To accomplish this, we prepared as much as we could and set up all the code for the analysis ahead of time. This preparation meant several days of non-stop working, discussing, and testing, all to anticipate any issues that might come up on the day of the class.  We used the measuring software MorphoMetriX (Torres & Bierlich, 2020) that was developed by KC and a fellow Duke Marine Lab grad student Walter Torres. MorphoMetriX was brand new at the time, and this newness of the software meant that we didn’t yet know all the issues that might come up and we did not have time to troubleshoot. We knew this meant that helping the students install the software might be a bit tricky and sure enough, all I remember from the beginning of that first lab is running around the room helping multiple people troubleshoot at the same time, using use all the programming knowledge I had to discover new solutions on the fly.

While troubleshooting on the fly can be stressful and overwhelming, I’ve come to appreciate it as good practice. Not only did we learn how to develop and teach a workshop, we also used what we had learned from all the troubleshooting to improve the software. I also used the code we developed for the analysis as the starting blocks for a software package I then wrote, CollatriX (Bird & Bierlich, 2020), as a follow up software to MorphoMetriX. Aside from the initial troubleshooting stress, the workshop was a success, and we were excited to have a dataset to study measurement process errors. Given that we already had all the materials for the workshop prepared, we decided to run a few more workshops to collect more data.

That brings me to my time at here at OSU. I left the Duke MaRRS lab to start graduate school shortly after we taught the workshop. Interested in running the workshop here, I reached out to a few different people. I first ran the workshop here as an event organized by the undergraduate club Ocean11 (Image 2). It was fun running the workshop a second time, as I used what I learned from the first round; I felt more confident, and I knew what the common issues would likely be and how to solve them. Sure enough, while there were still some troubleshooting issues, the process was smoother and I enjoyed teaching, getting to know OSU undergraduate students, and collecting more data for the project.

Image 2. Ocean11 students measuring during the workshop (Feb 7, 2020).
Image credit: Clara Bird

The next opportunity to run the lab came through Renee Albertson’s physiology and behavior of marine megafauna class, but during the COVID era this class had other challenges. While it’s easier to teach in person, this workshop was well suited to be converted to a remote activity because it only requires a computer, the data can be easily sent to the students, and screen sharing is an effective way to demonstrate how to measure. So, this photogrammetry module was a good fit for the marine megafauna class this term that has been fully remote due to COVID-19.  My first challenge was converting the workshop into a lab assignment with learning outcomes and analysis questions. The process also involved writing R code for the students to use and writing step-by-step instructions in a way that was clear and easy to understand. While stressful, I appreciated the process of developing the lab and these accompanying materials because, as you’ve probably heard from a teacher, a good test of your understanding of a concept is being able to teach it. I was also challenged to think of the best way to communicate and explain these concepts. I tried to think of a few different explanations, so that if a student did not understand it one way, I could offer an alternative that might work better. Similar to the preparation for the first workshop, I also prepared for troubleshooting the students’ issues with the software. However, unlike my previous experiences, this time I had to troubleshoot remotely.

After teaching this photogrammetry lab last week my respect for teachers who are teaching remotely has only increased. Helping students without being able to sit next to them and walk them through things on their computer is not easy. Not only that, in addition to the few virtual office hours I hosted, I was primarily troubleshooting over email, using screen shots from the students to try and figure out what was going on. It felt like the ultimate test of my programming knowledge and experience, having to draw from memories of past errors and solutions, and thinking of alternative solutions if the first one didn’t work. It was also an exercise in communication because programming can be daunting to many students; so, I worked to be encouraging and clearly communicate the instructions. All in all, I ended this week feeling exhausted but accomplished, proud of the students, and grateful for the reminder of how much you learn when you teach.

References

Bird, C. N., & Bierlich, K. (2020). CollatriX: A GUI to collate MorphoMetriX outputs. Journal of Open Source Software, 5(51), 2328. https://doi.org/10.21105/joss.02328

Torres, W., & Bierlich, K. (2020). MorphoMetriX: a photogrammetric measurement GUI for morphometric analysis of megafauna. Journal of Open Source Software, 5(45), 1825. https://doi.org/10.21105/joss.01825

Why Feeling Stupid is Great: How stupidity fuels scientific progress and discovery

By Alexa Kownacki, Ph.D. Student, OSU Department of Fisheries and Wildlife, Geospatial Ecology of Marine Megafauna Lab

It all started with a paper. On Halloween, I sat at my desk, searching for papers that could answer my questions about bottlenose dolphin metabolism and realized I had forgotten to check my email earlier. In my inbox, there was a new message with an attachment from Dr. Leigh Torres to the GEMM Lab members, saying this was a “must-read” article. The suggested paper was Martin A. Schwartz’s 2008 essay, “The importance of stupidity in scientific research”, published in the Journal of Cell Science, highlighted universal themes across science. In a single, powerful page, Schwartz captured my feelings—and those of many scientists: the feeling of being stupid.

For the next few minutes, I stood at the printer and absorbed the article, while commenting out loud, “YES!”, “So true!”, and “This person can see into my soul”. Meanwhile, colleagues entered my office to see me, dressed in my Halloween costume—as “Amazon’s Alexa”, talking aloud to myself. Coincidently, I was feeling pretty stupid at that moment after just returning from a weekly meeting, where everyone asked me questions that I clearly did not have the answers to (all because of my costume). This paper seemed too relevant; the timing was uncanny. In the past few weeks, I have been writing my PhD research proposal —a requirement for our department— and my goodness, have I felt stupid. The proposal outlines my dissertation objectives, puts my work into context, and provides background research on common bottlenose dolphin health. There is so much to know that I don’t know!

Alexa dressed as “Amazon Alexa” on Halloween at her office in San Diego, CA.

When I read Schwartz’s 2008 paper, there were a few takeaway messages that stood out:

  1. People take different paths. One path is not necessarily right nor wrong. Simply, different. I compared that to how I split my time between OSU and San Diego, CA. Spending half of the year away from my lab and my department is incredibly challenging; I constantly feel behind and I miss the support that physically being with other students provides. However, I recognize the opportunities I have in San Diego where I work directly with collaborators who teach and challenge me in new ways that bring new skills and perspective.

    Image result for different ways
    (Image source: St. Albert’s Place)
  2. Feeling stupid is not bad. It can be a good feeling—or at least we should treat it as being a positive thing. It shows we have more to learn. It means that we have not reached our maximum potential for learning (who ever does?). While writing my proposal I realized just how little I know about ecotoxicology, chemistry, and statistics. I re-read papers that are critical to understanding my own research, like “Nontargeted biomonitoring of halogenated organic compounds in two ecotypes of bottlenose dolphins (Tursiops truncatus) from the Southern California bight” (2014) by Shaul et al. and “Bottlenose dolphins as indicators of persistent organic pollutants in the western north Atlantic ocean and northern gulf of Mexico” (2011) by Kucklick et al. These articles took me down what I thought were wormholes that ended up being important rivers of information. Because I recognized my knowledge gap, I can now articulate the purpose and methods of analysis for specific compounds that I will conduct using blubber samples of common bottlenose dolphins

    Image result
    Image source: memegenerator.net
  3. Drawing upon experts—albeit intimidating—is beneficial for scientific consulting as well as for our mental health; no one person knows everything. That statement can bring us together because when people work together, everyone benefits. I am also reminded that we are our own harshest critics; sometimes our colleagues are the best champions of our own successes. It is also why historical articles are foundational. In the hunt for the newest technology and the latest and greatest in research, it is important to acknowledge the basis for discoveries. My data begins in 1981, when the first of many researchers began surveying the California coastline for common bottlenose dolphins. Geographic information systems (GIS) were different back then. The data requires conversions and investigative work. I had to learn how the data were collected and how to interpret that information. Therefore, it should be no surprise that I cite literature from the 1970s, such as “Results of attempts to tag Atlantic Bottlenose dolphins, (Tursiops truncatus)” by Irvine and Wells. Although published in 1972, the questions the authors tried to answer are very similar to what I am looking at now: how are site fidelity and home ranges impacted by natural and anthropogenic processes. While Irvine and Wells used large bolt tags to identify individuals, my project utilizes much less invasive techniques (photo-identification and blubber biopsies) to track animals, their health, and their exposures to contaminants.

    Image result for that is why you fail yoda
    (Image source: imgflip.com)
  4. Struggling is part of the solution. Science is about discovery and without the feeling of stupidity, discovery would not be possible. Feeling stupid is the first step in the discovery process: the spark that fuels wanting to explore the unknown. Feeling stupid can lead to the feeling of accomplishment when we find answers to those very questions that made us feel stupid. Part of being a student and a scientist is identifying those weaknesses and not letting them stop me. Pausing, reflecting, course correcting, and researching are all productive in the end, but stopping is not. Coursework is the easy part of a PhD. The hard part is constantly diving deeper into the great unknown that is research. The great unknown is simultaneously alluring and frightening. Still, it must be faced head on. Schwartz describes “productive stupidity [as] being ignorant by choice.” I picture this as essentially blindly walking into the future with confidence. Although a bit of an oxymoron, it resonates the importance of perseverance and conviction in the midst of uncertainty.

    Image result for funny t rex
    (Image source: Redbubble)

Now I think back to my childhood when stupid was one of the forbidden “s-words” and I question whether society had it all wrong. Maybe we should teach children to acknowledge ignorance and pursue the unknown. Stupid is a feeling, not a character flaw. Stupidity is important in science and in life. Fascination and emotional desires to discover new things are healthy. Next time you feel stupid, try running with it, because more often than not, you will learn something.

Image may contain: 1 person, sitting, table, child and outdoor
Alexa teaching about marine mammals to students ages 2-6 and learning from educators about new ways to engage young students. San Diego, CA in 2016. (Photo source: Lori Lowder)