With the changing of the season, gray whales are starting their southbound migration that will end in the lagoons off the Baja California Mexico. The migration of the gray whale is the longest migration of any mammal—the round trip totals ~10,000 miles (Pike, 1962)!
Like these gray whales, I am also undertaking my own “migration” as I leave Newport to start my post-Master’s journey. However, my migration will be a little shorter than the gray whale’s journey—only ~3,000 miles—as I head back to the east coast. As I talked about in my previous blog, I have finished my thesis studying the energetics of gray whale foraging behaviors and I attended my commencement ceremony at the University of British Columbia last Wednesday. As my time with the GEMM Lab comes to a close, I want to take some time to reflect on my time in Newport.
Me in my graduation regalia (right) and my co-supervisor Andrew Trites holding the university mace (left) after my commencement ceremony at the University of British Columbia rose garden.
Many depictions of scientists show them working in isolation but in my time with the GEMM Lab I got to fully experience the collaborative nature of science. My thesis was a part of the GEMM Lab’s Gray whale Response to Ambient Noise Informed by Technology and Ecology (GRANITE) project and I worked closely with the GRANITE team to help achieve the project’s research goals. The GRANITE team has annual meetings where team members give updates on their contributions to the project and flush out ideas in a series of very busy days. I found these collaborative meetings very helpful to ensure that I was keeping the big picture of the gray whale study system in mind while working with the energetics data I explored for my thesis. The collaborative nature of the GRANITE project provided the opportunity to learn from people that have a different skill set from my own and expose me to many different types of analysis.
GRANITE team members hard at work thinking about gray whales and their physiological response to noise.
This summer I also was able to participate in outreach with the partnership of the Oregon State University Marine Mammal Institute and the Eugene Exploding Whales (the alternate identity of the Eugene Emeralds) minor league baseball team to promote the Oregon Gray Whale License plates. It was exciting to talk to baseball fans about marine mammals and be able to demonstrate that the Gray Whale License plate sales are truly making a difference for the gray whales off the Oregon coast. In fact, the minimally invasive suction cup tags used in to collect the data I analyzed in my thesis were funded by the OSU Gray Whale License plate fund!
Photo of the GEMM Lab promoting Oregon Gray Whale License plates at the Eugene Exploding Whales baseball game. If you haven’t already, be sure to “Put a whale on your tail!” to help support marine mammal research off the Oregon Coast.
Outside of the amazing science opportunities, I have thoroughly enjoyed the privilege of exploring Newport and the Oregon coast. I was lucky enough to find lots of agates and enjoyed consistently spotting gray whale blows on my many beach walks. I experienced so many breathtaking views from hikes (God’s thumb was my personal favorite). I got to attend an Oregon State Beavers football game where we crushed Stanford! And most of all, I am so thankful for all the friends I’ve made in my time here. These warm memories, and the knowledge that I can always come back, will help make it a little easier to start my migration away from Newport.
Me and my friends outside of Reser Stadium for the Oregon State Beavers football game vs Stanford this season. Go Beavs!!!
Me and my friends celebrating after my defense.
Did you enjoy this blog? Want to learn more about marine life, research, and conservation? Subscribe to our blog and get a weekly message when we post a new blog. Just add your name and email into the subscribe box below
References
Pike, G. C. (1962). Migration and feeding of the gray whale (Eschrichtius gibbosus). Journal of the Fisheries Research Board of Canada, 19(5), 815–838. https://doi.org/10.1139/f62-051
One of the most frequent questions graduate students get asked (besides when you are going to graduate) is what their plans are after university. For me, the answer has always adamantly been continuing to do research, most likely as a government researcher because I don’t want teaching commitments to take away from my ability to conduct research.
However, one of the most fulfilling parts of my degree at University of British Columbia has actually been teaching four terms of a 100-level undergraduate science course focused on developing first-year students’ critical thinking, data interpretation, and science communication skills. My role in the course has been facilitating active learning activities that exercise these skills and reviewing material the students go over in their pre-class work. Through this course, I have experienced the teaching styles of six different professors and practiced my own teaching. As with any skill, there is always room for improvement, so when I had a chance to read a book titled How Learning Works: Seven Research-Based Principles for Smart Teaching (Ambrose et al. 2010), I took it as an opportunity to further refine my teaching and explore why some practices are more effective than others.
In the book, Ambrose et al. present principles of learning, the research surrounding these principles and examples for incorporating them into a university level course. Some of the principles gave me ideas for strategies to incorporate into my teaching to benefit my students. These described how prior knowledge impacts student learning and how to use goal-oriented practice and give feedback relative to target criteria that the students can apply to the next practice task. For example, I learned to be more conscious about how I explain and clarify course material to make connections with what the students have learned previously, so they can draw on that prior knowledge. Other principles presented by Ambrose et al. were more complex and offered a chance for greater reflection.
Beyond presenting strategies for improving teaching, the book also presented research that supported what I had learned firsthand through teaching. These principles related to the factors that motivate students to learn and why the course climate matters for learning. I have seen how student motivation is impacted by the classroom climate and culture put forth by the teaching team. Perhaps the most frustrating experiences I have had teaching were when one member of the teaching team does not see the importance of fostering a supportive course environment.
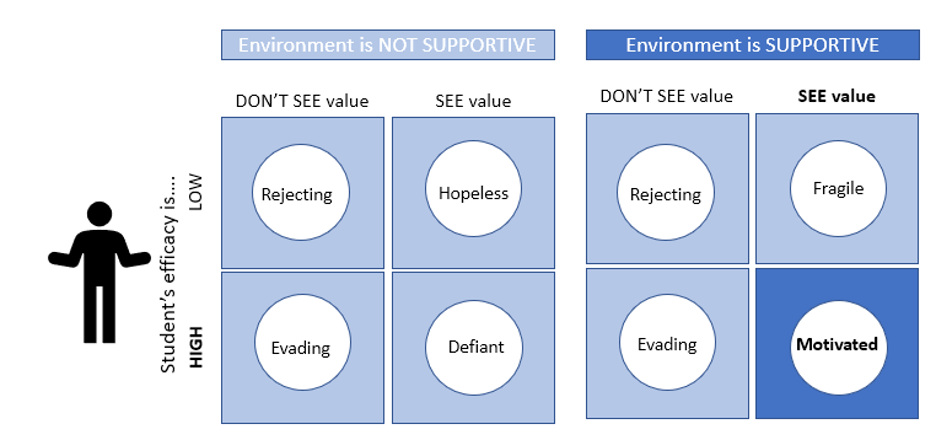
For this reason, my favorite assignments have been the Thrive Contract and the Group Contract. Each term, the Thrive Contract is the first major class activity, and the Group Contract is the first group assignment. These assignments serve as a means for everyone to co-create guidelines and expectations and establish a positive classroom culture for the rest of the term. After an exceptionally poor classroom experience my first time teaching, I have highlighted the importance of the Thrive Contract in all subsequent terms. Now, I realize the significance I lent this assignment is supported by the research on the importance for a supportive environment to maximize student motivation and encourage classroom engagement (Figure 1).
Another powerful lesson I have learned through teaching is the importance of clarifying the purpose of an activity to the students. Highlighting a task’s objective is also supported by research to ensure that students ascribe value to the assigned work, increasing their motivation (Figure 1). In my teaching, I have noticed a trend of lower student participation and poorer performance on assignments when a professor does not emphasize the importance of the task. Reviewing the research that shows the value of a supportive course climate has further strengthened my belief in the importance of ensuring that students understand why their teaching team assigns each activity.
Figure 1. How environment, student efficacy, and value interact to impact motivation. The above figure shows that motivation is optimized when students see the value in a goal, believe they have the skills to achieve the goal, and are undertaking the goal in a supportive class environment (the bright blue box in the bottom right corner). If this situation were to occur in an unsupportive class environment, defiant behaviour (e.g. “I’ll prove you wrong” attitude) is likely to occur in response to the lack of support, as the student sees the value in the goal and believes in their ability to achieve the goal. Rejecting behaviour (e.g., disengagement) occurs when the student does not associate value to a task and does not believe in their ability to complete the goals regardless of the environment. Evading behaviour (e.g., lack of attention or minimal effort) results when students are confident in their ability to complete a task, but do not see the goal as meaningful in both supportive and unsupportive environment. When a student sees the importance of the goal but are not confident in their ability to complete it, they become hopeless (e.g., have no expectation of success and act helpless) when in an unsupportive environment and fragile (e.g., feign understanding, deny difficulty, or make excuses for poor performance) in a supportive environment. Diagram adapted from Ambrose et al. (2010) Figure 3.2 incorporating the works of Hansen (1989) & Ford (1992).
Potentially my favorite part about the structure of Ambrose’s book was that it offered me a chance to reflect not only on teaching, but also on my own learning and cognitive growth since I started my master’s degree. Graduate students are often in a unique position in which we are both students and teachers depending on the context of our surroundings. The ability to zoom out and realize how far I have come in not only teaching others, but also in teaching myself, has been humbling. My reflection on my own learning and growth has been driven by learning about how organizing knowledge affects learning, how mastery is developed and how students become self-directed learners.
One of the main differences between novices and experts in how they organize their knowledge is the depth of that knowledge and the connections made between different pieces of information. Research has shown that experts hold more connections between concepts, which allows for faster and easier retrieval of information that translates into ease in applying skills to different tasks (Bradshaw & Anderson, 1982; Reder & Anderson, 1980; Smith, Adams, & Schorr, 1978). Currently in my degree, I am experiencing this ease when it comes to coding my analysis and connecting my research to the broader implications for the field. By making these deeper connections across various contexts, I am building a more complex knowledge structure, thus progressing towards holding a more expert organization of knowledge.
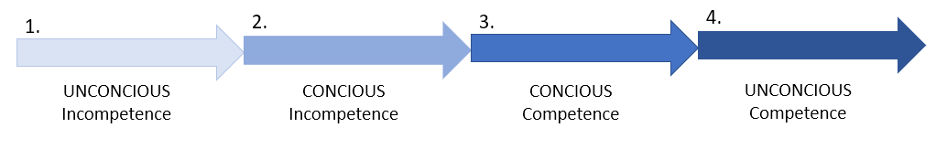
In the stages of mastery concept proposed by Sprague and Stewart (2000), learners progress from unconscious incompetence where the student doesn’t know what they don’t know, to conscious incompetence where they have become aware of what they need to know (Figure 2). This was where I was when I started my master’s — I knew what objectives I wanted to achieve with my research, but I needed to learn the skills necessary for me to be able to collect the data and analyze it to answer my research questions. The next stage of mastery is conscious competence, in which the ability of the learner to function in their domain has greatly increased, but practicing the necessary skills still requires deliberate thinking and conscious actions (Figure 2). This is the level I feel I have progressed to — I am much more comfortable performing the necessary tasks related to my research and talking about how my work fills existing knowledge gaps in the field. However, it still helps to talk out my proposed plans with true masters in the field. The final stage of mastery, unconscious competence, is where the learner has reached a point where they can practice the skills of their field automatically and instinctively such that they are no longer aware of how they enact their knowledge (Figure 2).
Figure 2. Stages of mastery showing how the learner consciousness waxes and then wanes as competence is developed. Unconscious states refer to those where the learner is not aware of what they are doing or what they know, whereas conscious states have awareness of thoughts and actions. Competence refers to the ability of the learner to perform tasks specific to the field they are trying to master. Diagram adapted from Ambrose et al. (2010) Figure 4.2 incorporating the works of Sprague & Stewart (2000).
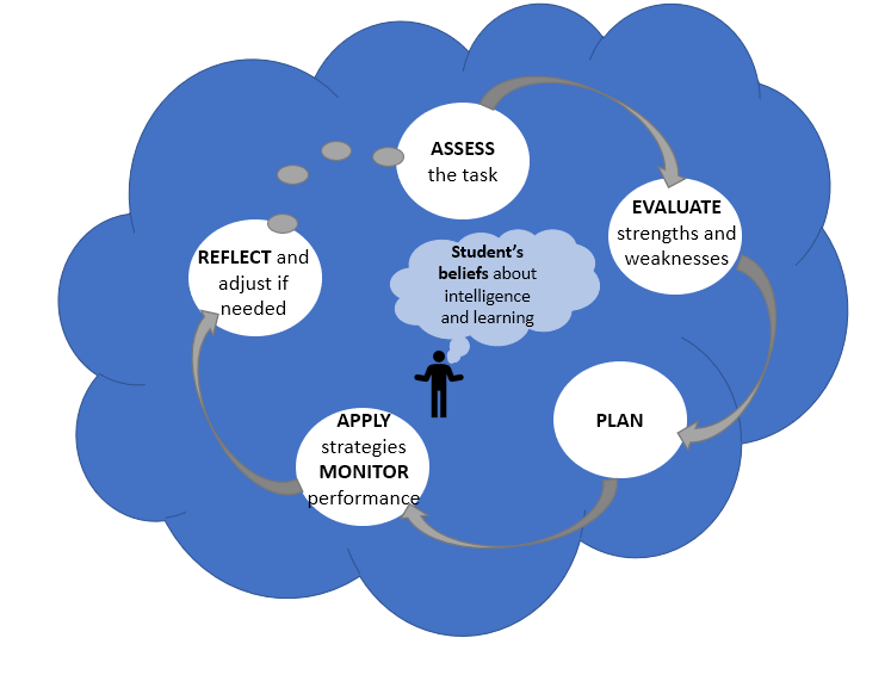
In line with my progression to higher levels of mastery has come the development of metacognitive skills that have helped me become a better self-directed learner. Metacognition is the process of learning how to learn, requiring the learner to monitor and control their learning through various processes (Figure 3). The most exciting part of my metacognitive growth I have noticed is the greater independence I have in my learning. I am much better at assessing what is needed to complete specific tasks and planning my particular approach to successfully achieve that goal (e.g., the construction of a Hidden Markov model from my last blog). By becoming more aware of my own strengths and weaknesses as a learner, I am better able to prepare and give myself the support needed for completing certain tasks (e.g., reaching out to experts to help with my model construction as I knew this was an area of weakness for me). By becoming more aware of how I am monitoring and controlling my learning, I know I am setting myself up for success as a lifelong learner.
Figure 3. Metacognition requires learner to monitor and control their learning through various processes. These processes involve the learner assessing the necessary skills needed for a task, evaluating their strengths and weaknesses with regards to the assigned task, and planning a way to approach the task. Once a plan has been made, the learner then must apply the strategies involved from the plan and monitor how those strategies are working to accomplish the assigned task. The learner must then be able to decide if the planned approach and applied strategies are effectively accomplishing the assigned task and adjust as needed with a re-assessment of the task that begins the processing cycle over again. Underlying each of these metacognitive processes are the learner’s belief in their own abilities and their perceptions of their intelligence. For example, students who believe their intelligence cannot be improved and do not have a strong sense of efficacy will be less likely to expend effort in metacognitive processes as they believe the extra effort will not influence the results. This contrasts with students who believe their intelligence will increase with skills development and have a strong belief in their abilities, as these learners will see the value in putting in the effort of trying multiple plans and adjusting strategies. Diagram adapted from Ambrose et al. (2010) Figure 7.1 incorporating the cycle of adaptive learning proposed by Zimmerman (2001).
References:
Ambrose, S. A., Bridges, M. W., DiPietro, M., Lovett, M. C., & Norman, M. K. (2010). How learning works: Seven research-based principles for smart teaching (1st ed.). San Francisco, CA: Jossey-Bass.
Bradshaw, G. L., & Anderson, J. R. (1982). Elaborative encoding as an explanation of levels of processing. Journal of Verbal Learning and Verbal behaviours, 21,165-174.
Ford, M. E. (1992). Motivating humans: Goals, emotions and personal agency beliefs. Newbury Park, CA: Sage Publications, Inc.
Hansen, D. (1989). Lesson evading and dissembling: Ego strategies in the classroom. American Journal of Education, 97, 184-208.
Reder, L. M., & Anderson, J. R. (1980). A partial resolution of the paradox of interference: The role of integrating knowledge. Cognitive Psychology, 12, 447-472.
Smith, E. E., Adams, N., & Schorr, D. (1978). Fact retrieval and the paradox of interference. Cognitive Psychology, 10, 438-464.
Sprague, J., & Stewart, D. (2000). The speaker’s handbook. Fort Worth, TX: Harcourt College Publishers.
Zimmerman, B. J. (2001). Theories of self-regulated learning and academic achievement: An overview and analysis. In B. J. Zimmerman & D. H. Schunk (Eds.), Self-regulated learning and academic achievement (2nd ed., pp. 1-38). Hillsdale, NJ: Erlbaum.
Models can be extremely useful tools to describe biological systems and answer ecological questions, but they are often tricky to construct. If I have learned anything in my statistics classes, it is the importance of resisting the urge to throw everything but the kitchen sink into a model. However, this is usually much easier said than done, and model construction takes a lot of practice. The principle of simplicity is currently at the forefront of my thesis work, as I try to embody the famous quote by Albert Einstein:
“Everything should be made as simple as possible, but no simpler.”
As you might remember from my earlier blog, the goal of my thesis is to use biologging data to define different foraging behaviors of Pacific Coast Feeding Group (PCFG) gray whales, and then calculate the energetic cost of those behaviors. I am defining PCFG foraging behaviors at two scales: (1) dives that represent different behavior states (e.g., travelling vs foraging), and (2) roll events, which are periods during dives where the whale is rolled onto their side, that represent different foraging tactics (e.g., headstanding vs side-swimming).
Initially, I was planning to use a clustering analysis to define these different foraging behaviors at both the dive and roll event scale, as this method has been used to successfully classify different foraging strategies for Galapagos sea lions (Schwarz et al., 2021). In short, this clustering analysis uses summary variables from events of interest to group events based on their similarity. These can be any metric that describes the event such as duration and depth, or body positioning variables like median pitch or roll. The output of the clustering analysis method results in groups of events that can each be used to define a different behavior.
However, while this method works for defining the foraging tactics of PCFG gray whales, my discussions with other scientists have suggested that there is a better method available for defining foraging behavior at the dive scale: Hidden Markov Models (HMMs). HMMs are similar to the clustering method described above in that they use summary variables at discrete time scales to define behavior states, but HMMs take into account the bias inherent to time series data – events that occur closer together in time are more likely to be more similar. This bias of time can confound clustering analyses, making HMMs a better tool for classifying a series of dives into different behavior states.
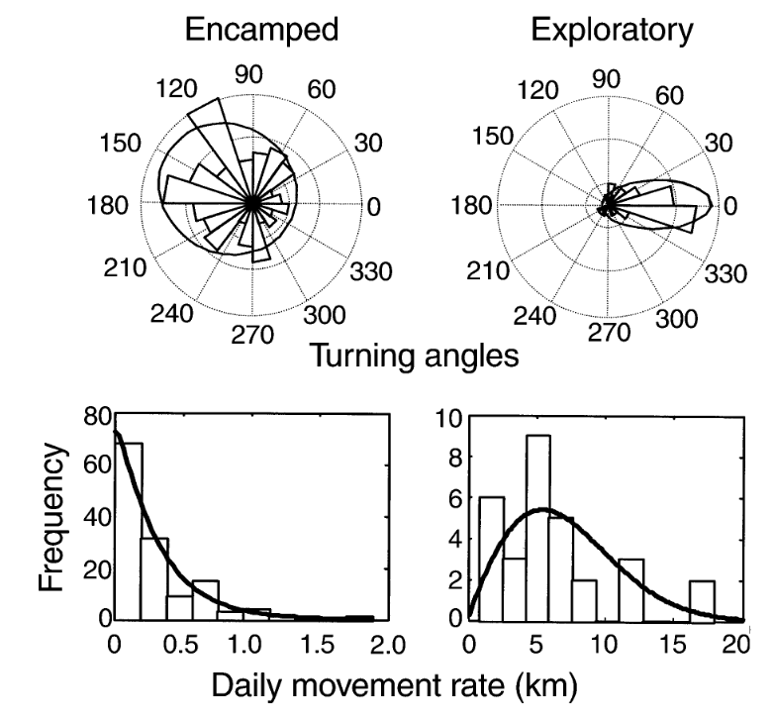
Like many analytical methods, the HMM framework was first proposed in a terrestrial system where it was used to classify the movement of translocated elk (Morales et al., 2004). The initial framework proposed using the step length, or the spatial distance between the animal’s locations at the start of subsequent time intervals, and the corresponding turning angle, to isolate “encamped” from “exploratory” behaviors in each elk’s movement path (Figure 1, from Morales et al., 2004). “Encamped” behaviors are those with short step lengths and high turning angles that show the individual is moving within a small area, and they can be associated with foraging behavior. On the other hand, “exploratory” behaviors are those with long step lengths and low turning angles that show the individual is moving in a relatively straight path and covering a lot of ground, which is likely associated with travelling behavior.
Figure 1. The difference between “encamped” and “exploratory” behavior states from a simple Hidden Markov Model (HMM) in a translocated elk equipped with a GPS collar (Fig. 1 in Morales et al., 2004). The top rose plots show the turning angles while the bottom histograms show the step lengths as a daily movement rate. The “encamped” state has short step lengths (low daily movement rate) and high turning angles while the “exploratory” state has long step lengths (high daily movement rate) and low turning angle. These behavior states from the HMM can then be interpollated to elk behavior, as the low daily movement and tight turns of the “encamped” behavior state likely indicates foraging while the high daily movement and direct path of the “exploratory” behavior state likely indicates traveling. Thus, it is important to keep the biological relevance of the study system in mind while constructing and interpreting the model.
In the two decades following this initial framework proposed by Morales et al. (2004), the use of HMMs in anlaysis has been greatly expanded. One example of this expansion has been the development of mutlivariate HMMs that include additional data streams to supplement the step length and turning angle classification of “encamped” vs “exploratory” states in order to define more behaviors in movement data. For instance, a multivariate HMM was used to determine the impact of acoustic disturbance on blue whales (DeRuiter et al., 2017). In addition to step length and turning angle, dive duration and maximum depth, the duration of time spent at the surface following the dive, the number of feeding lunges in the dive, and the variability of the compass direction the whale was facing during the dive were all used to classify behavior states of the whales. This not only allowed for more behavior states to be identified (three instead of two as determined in the elk model), but also the differences in behavior states between individual animals included in the study, and the differences in the occurrence of behavior states due to changes in environmental noise.
The mutlivariate HMM used by DeRuiter et al. (2017) is a model I would ideally like to emulate with the biologging data from the PCFG gray whales. However, incorporating more variables invites more questions during the model construction process. For example, how many variables should be incorporated in the HMM? How should these variables be modeled? How many behavior states can be identified when including additional variables? These questions illustrate how easy it is to unnecessarily overcomplicate models and violate the principle of simiplicity toted by Albert Einstein, or to be overwhelmed by the complexity of these analytical tools.
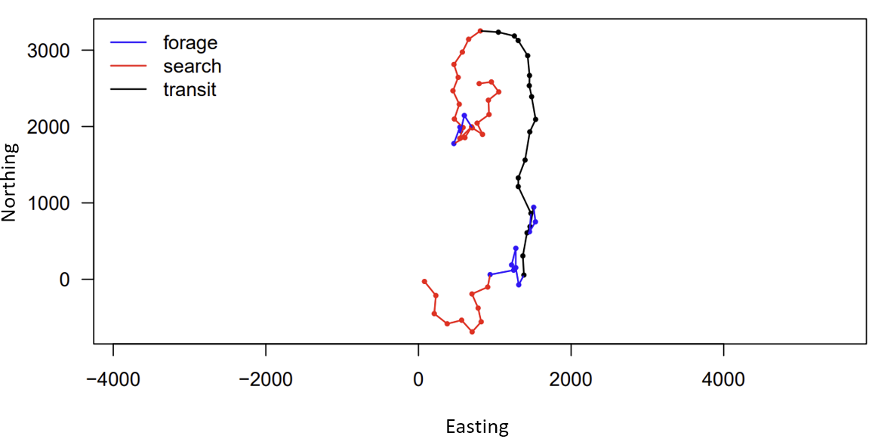
Figure 2. Example of expected output of Hidden Markov Model (HMM) for the PCFG gray whale biologging data (GEMM Lab; National Marine Fisheries Service (NMFS) permit no. 21678). The figure shows the movement track the whale swam during the deployment of the biologger, with each point representing the start of a dive. The axes show “Easting” and “Northing” rather than map coordinates because this is the relative path the whale took rather than GPS coordinates of the whale’s location. Each color represents a different behavior state—blue has short step lengths and high turning angles (likely foraging), red has intermediate step lengths and turning angles (likely searching), and black has long step lengths and low turning angles (likely transiting). These results will be refined as I construct the multivariate HMM that will be used in my thesis.
Luckily, I can draw on the support of Gray whale Response to Ambient Noise Informed by Technology and Ecology (GRANITE) project collaborators Dr. Leslie New and Dr. Enrico Pirotta to guide my HMM model construction and assist in interpreting the outputs (Figure 2). With their help, I have been learning the importance of always asking if the change I am making to my model is biologically relevent to the PCFG gray whales, and if it will help give me more insight into the whales’ behavior. Even though using complex tools, such as Hidden Markov Models, has a steep learning curve, I know that this approach is not only placing this data analysis at the cutting edge of the field, but helping me practice fundamental skills, like model construction, that will pay off down the line in my career.
Sources
DeRuiter, S. L., Langrock, R., Skirbutas, T., Goldbogen, J. A., Calambokidis, J., Friedlaender, A. S., & Southall, B. L. (2017). A multivariate mixed Hidden Markov Model for blue whale behaviour and responses to sound exposure. Annals of Applied Statistics, 11(1), 362–392. https://doi.org/10.1214/16-AOAS1008
Morales, J. M., Haydon, D. T., Frair, J., Holsinger, K. E., & Fryxell, J. M. (2004). Extracting more out of relocation data: Building movement models as mixtures of random walks. Ecology, 85(9), 2436–2445. https://doi.org/10.1890/03-0269
Schwarz, J. F. L., Mews, S., DeRango, E. J., Langrock, R., Piedrahita, P., Páez-Rosas, D., & Krüger, O. (2021). Individuality counts: A new comprehensive approach to foraging strategies of a tropical marine predator. Oecologia, 195(2), 313–325. https://doi.org/10.1007/s00442-021-04850-w