Coding stories, tips, and tricks

Clara Bird1 and Karen Lohman2

1Masters Student in Wildlife Science, Geospatial Ecology of Marine Megafauna Lab

2Masters Student in Wildlife Science, Cetacean Conservation and Genomics Laboratory

In a departure from my typical science-focused blog, this week I thought I would share more about myself. This week I was inspired by International’s Woman’s Day and, with some reflection on the last eight months as a graduate student, I decided to look back on the role that coding has played in my life. We hear about how much coding can be empowering but I thought it might be cool to talk about my personal experience of feeling empowered by coding. I’ve also invited a fellow grad student in the Marine Mammal Institute, Karen Lohman, to co-author this post. We’re going to briefly talk about our experience with coding and then finish with advice for getting started with coding and coding for data analysis.

Our Stories

Clara

I’ve only been coding for a little over two and a half years. In summer 2017 I did an NSF REU (Research Experience for Undergraduates) at Bigelow Laboratory for Ocean Sciences and for my project I taught myself python (with the support of a post-doc) for a data analysis project. During those 10 weeks, I coded all day, every workday. From that experience, I not only acquired the hard skill of programming, but I gained a good amount of confidence in myself, and here’s why: For the first three years of my undergraduate career coding was a daunting skill that I knew I would eventually need but did not know where to start. So, I essentially ended up learning by jumping off the deep end. I found the immersion experience to be the most effective learning method for me. With coding, you find out if you got something right (or wrong) almost instantaneously. I’ve found that this is a double-edged sword. It means that you can easily have days where everything goes wrong. But, the feeling when it finally works is what I think of when I hear the term empowerment. I’m not quite sure how to put it into words, but it’s a combination of independence, confidence, and success. 

Aside from learning the fundamentals, I finished that summer with confidence in my ability to teach myself not just new coding skills, but other skills as well. I think that feeling confident in my ability to learn something new has been the most helpful aspect to allow me to hit the ground running in grad school and also keeping the ‘imposter syndrome’ at bay (most of the time).

Clara’s Favorite Command: pd.groupby (python) – Say you have a column of measurements and a second column with the field site of each location. If you wanted the mean of the measurement per each location, you could use groupby to get this. It would look like this: dataframe.groupby(‘Location’)[‘Measurement’].mean().reset_index()

Karen

I’m quite new to coding, but once I started learning I was completely enchanted! I was first introduced to coding while working as a field assistant for a PhD student (a true R wizard who has since developed deep learning computer vision packages for automated camera trap image analysis) in the cloud forest of the Ecuadorian Andes. This remote jungle was where I first saw how useful coding can be for data management and analysis. It was a strange juxtaposition between being fully immersed in nature for remote field work and learning to think along the lines of coding syntax. It wasn’t the typical introduction to R most people have, but it was an effective hook. We were able to produce preliminary figures and analysis as we collected data, which made a tough field season more rewarding. Coding gave us instant results and motivation.

I committed to fully learning how to code during my first year of graduate school. I first learned linux/command line and python, and then I started working in R that following summer. My graduate research uses population genetics/genomics to better understand the migratory connections of humpback whales. This research means I spend a great deal of time working to develop bioinformatics and big data skills, an essential skill for this area of research and a goal for my career. For me, coding is a skill that only returns what you put in; you can learn to code quite quickly, if you devote the time. After a year of intense learning and struggle, I am writing better code every day.

In grad school research progress can be nebulous, but for me coding has become a concrete way to measure success. If my code ran, I have a win for the week. If not, then I have a clear place to start working the next day. These “tiny wins” are adding up, and coding has become a huge confidence boost.

Karen’s Favorite Command: grep (linux) – Searches for a string pattern and prints all lines containing a match to the screen. Grep has a variety of flags making this a versatile command I use every time I’m working in linux.

Advice

Getting Started

  • Be kind to yourself, think of it as a foreign language. It takes a long time and a lot of practice.
  • Once you know the fundamental concepts in any language, learning another will be easier (we promise!).
  • Ask for help! The chances that you have run into a unique error are quite small, someone out there has already solved your problem, whether it’s a lab mate or another researcher you find on Google!

Coding Tips

1. Set yourself up for success by formatting your datasheets properly

  • Instead of making your spreadsheet easy to read, try and think about how you want to use the data in the analysis.
  • Avoid formatting (merged cells, wrap text) and spaces in headers
  • Try to think ahead when formatting your spreadsheet
    • Maybe chat with someone who has experience and get their advice!

2. Start with a plan, start on paper

This low-tech solution saves countless hours of code confusion. It can be especially helpful when manipulating large data frames or in multistep analysis. Drawing out the structure of your data and checking it frequently in your code (with ‘head’ in R/linux) after manipulation can keep you on track. It is easy to code yourself into circles when you don’t have a clear understanding of what you’re trying to do in each step. Or worse, you could end up with code that runs, but doesn’t conduct the analysis you intended, or needed to do.

3. Good organization and habits will get you far

There is an excellent blog by Nice R Code on project organization and file structure. I highly recommend reading and implementing their self-contained scripting suggestions. The further you get into your data analysis the more object, directory, and function names you have to remember. Develop a naming scheme that makes sense for your project (i.e. flexible, number based, etc.) and stick with it. Temporary object names in functions or code blocks can be a good way to clarify what is the code-in-progress or the code result.

Figure 1. An example of project based workflow directory organization from Nice R Code (https://nicercode.github.io/blog/2013-04-05-projects/ )

4. Annotate. Then annotate some more.

Make comments in your code so you can remember what each section or line is for. This makes debugging much easier! Annotation is also a good way to stay on track as you code, because you’ll be describing the goal of every line (remember tip 1?). If you’re following a tutorial (or STACKoverflow answer), copy the web address into your annotation so you can find it later. At the end of a coding session, make a quick note of your thought process so it’s easier to pick up when you come back. It’s also a good habit to add some ‘metadata’ details to the top of your script describing what the script is intended for, what the input files are, the expected outputs, and any other pertinent details for that script. Your future self will thank you!

Figure 2. Example code with comments explaining the purpose of each line.

5. Get with git/github already

Github is a great way to manage version control. Remember how life-changing the advent of dropbox was? This is like that, but for code! It’s also become a great open-source repository for newly developed code and packages. In addition to backing up and storing your code, GitHub has become a ‘coding CV’ that other researchers look to when hiring.

Wondering how to get started with GitHub? Check out this guide: https://guides.github.com/activities/hello-world/

Looking for a good text/code editor? Check out atom (https://atom.io/), you can push your edits straight to git from here.

6. You don’t have to learn everything, but you should probably learn the R Tidyverse ASAP

Tidyverse is a collection of data manipulation packages that make data wrangling a breeze. It also includes ggplot, an incredibly versatile data visualization package. For python users hesitant to start working in R, Tidyverse is a great place to start. The syntax will feel more familiar to python, and it has wonderful documentation online. It’s also similar to the awk/sed tools from linux, as dplyr removes any need to write loops. Loops in any language are awful, learn how to do them, and then how to avoid them.

7. Functions!

Break your code out into blocks that can be run as functions! This allows easier repetition of data analysis, in a more readable format. If you need to call your functions across multiple scripts, put them all into one ‘function.R’ script and source them in your working scripts. This approach ensures that all the scripts can access the same function, without copy and pasting it into multiple scripts. Then if you edit the function, it is changed in one place and passed to all dependent scripts.

8. Don’t take error messages personally

  • Repeat after me: Everyone googles for every other line of code, everyone forgets the command some (….er every) time.
  • Debugging is a lifestyle, not a task item.
  • One way to make it less painful is to keep a list of fixes that you find yourself needing multiple times. And ask for help when you’re stuck!

9. Troubleshooting

  • Know that you’re supposed to google but not sure what?
    • start by copying and pasting the error message
  • When I started it was hard to know how to phrase what I wanted, these might be some common terms
    • A dataframe is the coding equivalent of a spreadsheet/table
    • Do you want to combine two dataframes side by side? That’s a merge
    • Do you want to stack one dataframe on top of another? That’s concatenating
    • Do you want to get the average (or some other statistic) of values in a column that are all from one group or category? Check out group by or aggregate
    • A loop is when you loop through every value in a column or list and do something with it (use it in an equation, use it in an if/else statement, etc).

Favorite Coding Resource (other than github….)

  • Learnxinyminutes.com
    • This is great ‘one stop googling’ for coding in almost any language! I frequently switch between coding languages, and as a result almost always have this open to check syntax.
  • https://swirlstats.com/
    • This is a really good resource for getting an introduction to R

Parting Thoughts

We hope that our stories and advice have been helpful! Like many skills, you tend to only see people once they have made it over the learning curve. But as you’ve read Karen and I both started recently and felt intimidated at the beginning. So, be patient, be kind to yourself, believe in yourself, and good luck!

The complex relationship between behavior and body condition

Clara Bird, Masters Student, OSU Department of Fisheries and Wildlife, Geospatial Ecology of Marine Megafauna Lab

Imagine that you are a wild foraging animal: In order to forage enough food to survive and be healthy you need to be healthy enough to move around to find and eat your food. Do you see the paradox? You need to be in good condition to forage, and you need to forage to be in good condition. This complex relationship between body condition and behavior is a central aspect of my thesis.

One of the great benefits of having drone data is that we can simultaneously collect data on the body condition of the whale and on its behavior. The GEMM lab has been measuring and monitoring the body condition of gray whales for several years (check out Leila’s blog on photogrammetry for a refresher on her research). However, there is not much research linking the body condition of whales to their behavior. Hence, I have expanded my background research beyond the marine world to looked for papers that tried to understand this connection between the two factors in non-cetaceans. The literature shows that there are examples of both, so let’s go through some case studies.

Ransom et al. (2010) studied the effect of a specific type of contraception on the behavior of a population of feral horses using a mixed model. Aside from looking at the effect of the treatment (a type of contraception), they also considered the effect of body condition. There was no difference in body condition between the treatment and control groups, however, they found that body condition was a strong predictor of feeding, resting, maintenance, and social behaviors. Females with better body condition spent less time foraging than females with poorer body condition. While it was not the main question of the study, these results provide a great example of taking into account the relationship between body condition and behavior when researching any disturbance effect.

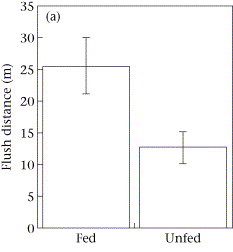
While Ransom et al. (2010) did not find that body condition affected response to treatment, Beale and Monaghan (2004) found that body condition affected the response of seabirds to human disturbance. They altered the body condition of birds at different sites by providing extra food for several days leading up to a standardized disturbance. Then the authors recorded a set of response variables to a disturbance event, such as flush distance (the distance from the disturbance when the birds leave their location). Interestingly, they found that birds with better body condition responded earlier to the disturbance (i.e., when the disturbance was farther away) than birds with poorer body condition (Figure 1). The authors suggest that this was because individuals with better body condition could afford to respond sooner to a disturbance, while individuals with poorer body condition could not afford to stop foraging and move away, and therefore did not show a behavioral response. I emphasize behavioral response because it would have been interesting to monitor the vital rates of the birds during the experiment; maybe the birds’ heart rates increased even though they did not move away. This finding is important when evaluating disturbance effects and management approaches because it demonstrates the importance of considering body condition when evaluating impacts: animals that are in the worst condition, and therefore the individuals that are most vulnerable, may appear to be undisturbed when in reality they tolerate the disturbance because they cannot afford the energy or time to move away.

Figure 1.  Figure showing flush distance of birds that were fed (good body condition) and unfed (poor body condition).

These two studies are examples of body condition affecting behavior. However, a study on the effect of habitat deterioration on lizards showed that behavior can also affect body condition. To study this effect, Amo et al. (2007) compared the behavior and body condition of lizards in ski slopes to those in natural areas. They found that habitat deterioration led to an increased perceived risk of predation, which led to an increase in movement speed when crossing these deteriorated, “risky”, areas. In turn, this elevated movement cost led to a decrease in body condition (Figure 2). Hence, the lizard’s behavior affected their body condition.


Figure 2. Figure showing the difference in body condition of lizards in natural and deteriorated habitats.

Together, these case studies provide an interesting overview of the potential answers to the question: does body condition affect behavior or does behavior affect body condition? The answer is that the relationship can go both ways. Ransom et al. (2004) showed that regardless of the treatment, behavior of female horses differed between body conditions, indicating that regardless of a disturbance, body condition affects behavior. Beale and Monaghan (2004) demonstrated that seabird reactions to disturbance differed between body conditions, indicating that disturbance studies should take body condition into account. And, Amo et al. (2007) showed that disturbance affects behavior, which consequently affects body condition.

Looking at the results from these three studies, I can envision finding similar results in my gray whale research. I hypothesize that gray whale behavior varies by body condition in everyday circumstances and when the whale is disturbed. Yet, I also hypothesize that being disturbed will affect gray whale behavior and subsequently their body condition. Therefore, what I anticipate based on these studies is a circular relationship between behavior and body condition of gray whales: if an increase in perceived risk affects behavior and then body condition, maybe those affected individuals with poor body condition will respond differently to the disturbance. It is yet to be determined if a sequence like this could ever be detected, but I think that it is important to investigate.

Reading through these studies, I am ready and eager to start digging into these hypotheses with our data. I am especially excited that I will be able to perform this investigation on an individual level because we have identified the whales in each drone video. I am confident that this work will lead to some interesting and important results connecting behavior and health, thus opening avenues for further investigations to improve conservation studies.

References

Beale, Colin M, and Pat Monaghan. 2004. “Behavioural Responses to Human Disturbance: A Matter of Choice?” Animal Behaviour 68 (5): 1065–69. https://doi.org/10.1016/j.anbehav.2004.07.002.

Ransom, Jason I, Brian S Cade, and N. Thompson Hobbs. 2010. “Influences of Immunocontraception on Time Budgets, Social Behavior, and Body Condition in Feral Horses.” Applied Animal Behaviour Science 124 (1–2): 51–60. https://doi.org/10.1016/j.applanim.2010.01.015.

Amo, Luisa, Pilar López, and José Martín. 2007. “Habitat Deterioration Affects Body Condition of Lizards: A Behavioral Approach with Iberolacerta Cyreni Lizards Inhabiting Ski Resorts.” Biological Conservation 135 (1): 77–85. https://doi.org/10.1016/j.biocon.2006.09.020.

What are the ecological impacts of gray whale benthic feeding?

Clara Bird, Masters Student, OSU Department of Fisheries and Wildlife, Geospatial Ecology of Marine Megafauna Lab

Happy new year from the GEMM lab! Starting graduate school comes with a lot of learning. From skills, to learning about how much there is to learn, to learning about the system I will be studying in depth for the next few years. This last category has been the most exciting to me because digging into the literature on a system or a species always leads to the unearthing of some fascinating and surprising facts. So, for this blog I will write about one of the aspects of gray whale foraging that intrigues me most: benthic feeding and its impacts.

How do gray whales feed?

Gray whales are a unique species. Unlike other baleen whales, such as humpback and blue whales, gray whales regularly feed off the bottom of the ocean (Nerini, 1984). They roll to one side and swim along the bottom, they then suction up (by depressing their tongue) the sediment and prey, then the sediment and water is filtered out of the baleen. In fact, we use sediment streams, shown in Figure 1, as an indicator of benthic feeding behavior when analyzing drone footage (Torres et al. 2018).

Figure 1. Screenshot of drone video showing sediment streaming from mouth of a whale after benthic feeding. Video taken under NOAA/NMFS permit #21678

Locations of benthic feeding can be identified without directly observing a gray whale actively feeding because of the excavated pits that result from benthic feeding (Nerini 1984). These pits can be detected using side-scan sonar that is commonly used to map the seafloor. Oliver and Slattery (1985) found that the pits typically are from 2-20 m2. In some of the imagery, consecutive neighboring pits are visible, likely created by one whale in series during a feeding event. Figure 2 shows different arrangements of pits.

Figure 2. Different arrangements of pits created by feeding whales (Nerini 1984).

Aside from how fascinating the behavior is, benthic feeding is also interesting because it has a large impact on the environment. Coming from a background of studying baleen whales that primarily feed on krill, I had not really considered the potential impacts of whale foraging other than removing prey from the environment. However, when gray whales feed, they excavate large areas of the benthic substrate that disturb and impact the habitat.

The impacts of benthic feeding

Weitkamp et al. (1992) conducted a study on gray whale benthic foraging on ghost shrimp in Puget Sound, WA, USA. This study, conducted over two years, focused on measuring the impact of benthic foraging by its effect on prey abundance. They found that the standing stock of ghost shrimp within a recently excavated pit was two to five times less than that outside the pit, and that 3100 to 5700 grams of shrimp can be removed per pit. From aerial surveys they estimated that within one season feeding gray whales created between 2700 and 3200 pits. Using these values, they calculated that 55 to 79% of the standing stock of ghost shrimp was removed each season by foraging gray whales. Interestingly, they found that the shrimp biomass within an excavated pit recovered within about two months.

Oliver and Slattery (1985) also found a recovery period of about 2 months per pit in their study on the effect of gray whale benthic feeding on the prey community in the Bering Sea. They sampled prey within and outside feeding excavations, both actual whale pits and man-made, to test the response of the benthic community to the disturbance of a feeding event. They found that after the initial feeding disturbance, the excavated area was rapidly colonized by scavenging lysianassid amphipods, which are small (10 mm) crustaceans that typically eat dead organic material. These amphipods rushed in and attacked the organisms that were injured or dislodged by the whale feeding event, typically small crustaceans and polychaete worms. Within hours of the whale feeding event, these amphipods had dispersed and a different genre of scavenging lysianassid amphipods slowly invaded the excavated pit further and stayed much longer. After a few days or weeks these pits collected and trapped organic debris that attracted more colonists. Indeed, they found that the number of colonists remained elevated within the excavated areas for over two months.

Notably, these results on how the disturbance of gray whale benthic feeding changes sediment composition support the idea that this foraging behavior maintains the sand substrate and therefore helps to maintain balanced levels of benthic dwelling amphipods, their primary source of prey in this study area (Johnson and Nelson, 1984). Gray whales scour the sea floor when they feed and this process leads to the resuspension of lots of sediments and nutrients that would otherwise remain on the seafloor. Therefore, while this feeding may seem like a violent disturbance, it may in fact play a large role in benthic productivity (Johnson and Nelson, 1984; Oliver and Slattery, 1985).

These ecosystem impacts of gray whale benthic feeding I have described above demonstrate the various stages of invaders after a feeding disturbance, and the process of succession. Succession is the ecological process of how a community structure builds and grows. Primary succession is when the structure grows from truly nothing and secondary succession occurs after a disturbance, such as a fire. In secondary succession, there are typically pioneer species that first appear and then give way to other species and a more complex community eventually emerges. Succession is well documented in many terrestrial studies after disturbance events, and the processes of secondary succession is very important to community ecology and resilience.

Since gray whale benthic foraging does not impact an entire habitat all at once, the process is not perfectly comparable to secondary succession in terrestrial systems. Yet, when thinking about the smaller scale, another example of succession in the marine environment takes place at a whale fall. When a whale dies and sinks to the ocean floor, a small ecosystem emerges. Different organisms arrive at different stages to scavenge different parts of the carcass and a food web is created around it.

To me the impacts of gray whale benthic feeding are akin to both terrestrial disturbance events and whale falls. The excavation serves as a disturbance, and through secondary succession the habitat is refreshed via stages of different species colonization until the system eventually returns to the pre-disturbance levels. However, like a whale fall the feeding event leaves behind injured or displaced organisms that scavengers consume; in fact seabirds are known to take advantage of benthic invertebrates that are brought to the surface by a gray whale feeding event (Harrison, 1979). 

So much of our research is focused on questions about how the changing environment impacts our study species and not the other way around. This venture into the literature has provided me with an important reminder to think about flipping the question. I have enjoyed starting 2020 with a reminder of how cool gray whales are, and that while a disturbance can initially be thought of as negative, it may actually bring about important, and positive, change.

References

Nerini, Mary. 1984. “A Review of Gray Whale Feeding Ecology.” In The Gray Whale: Eschrichtius Robustus, 423–50. Elsevier Inc. https://doi.org/10.1016/B978-0-08-092372-7.50024-8.

Oliver, J. S., and P. N. Slattery. 1985. “Destruction and Opportunity on the Sea Floor: Effects of Gray Whale Feeding.” Ecology 66 (6): 1965–75. https://doi.org/10.2307/2937392.

Torres, Leigh G., Sharon L. Nieukirk, Leila Lemos, and Todd E. Chandler. 2018. “Drone up! Quantifying Whale Behavior from a New Perspective Improves Observational Capacity.” Frontiers in Marine Science 5 (SEP). https://doi.org/10.3389/fmars.2018.00319.

Weitkamp, Laurie A, Robert C Wissmar, Charles A Simenstad, Kurt L Fresh, and Jay G Odell. 1992. “Gray Whale Foraging on Ghost Shrimp (Callianassa Californiensis) in Littoral Sand Flats of Puget Sound, USA.” Canadian Journal of Zoology 70 (11): 2275–80. https://doi.org/10.1139/z92-304.

Johnson, Kirk R., and C. Hans Nelson. 1984. “Side-Scan Sonar Assessment of Gray Whale Feeding in the Bering Sea.” Science 225 (4667): 1150–52.

Harrison, Craig S. 1979. “The Association of Marine Birds and Feeding Gray Whales.” The Condor 81 (1): 93. https://doi.org/10.2307/1367866.

Classifying cetacean behavior

Clara Bird, Masters Student, OSU Department of Fisheries and Wildlife, Geospatial Ecology of Marine Megafauna Lab

The GEMM lab recently completed its fourth field season studying gray whales along the Oregon coast. The 2019 field season was an especially exciting one, we collected rare footage of several interesting gray whale behaviors including GoPro footage of a gray whale feeding on the seafloor, drone footage of a gray whale breaching, and drone footage of surface feeding (check out our recently released highlight video here). For my master’s thesis, I’ll use the drone footage to analyze gray whale behavior and how it varies across space, time, and individual. But before I ask how behavior is related to other variables, I need to understand how to best classify the behaviors.

How do we collect data on behavior?

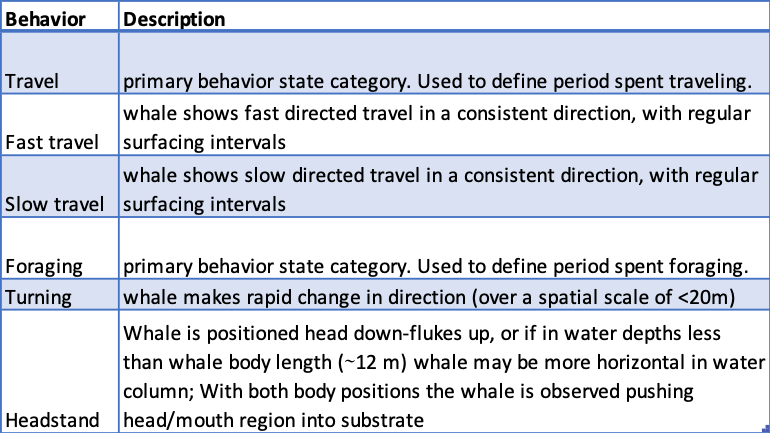
One of the most important tools in behavioral ecology is an ‘ethogram’. An ethogram is a list of defined behaviors that the researcher expects to see based on prior knowledge. It is important because it provides a standardized list of behaviors so the data can be properly analyzed. For example, without an ethogram, someone observing human behavior could say that their subject was walking on one occasion, but then say strolling on a different occasion when they actually meant walking. It is important to pre-determine how behaviors will be recorded so that data classification is consistent throughout the study. Table 1 provides a sample from the ethogram I use to analyze gray whale behavior. The specificity of the behaviors depends on how the data is collected.

Table 1. Sample from gray whale ethogram. Based on ethogram from Torres et al. (2018).

In marine mammal ecology, it is challenging to define specific behaviors because from the traditional viewpoint of a boat, we can only see what the individuals are doing at the surface. The most common method of collecting behavioral data is called a ‘focal follow’. In focal follows an individual, or group, is followed for a set period of time and its behavioral state is recorded at set intervals.  For example, a researcher might decide to follow an animal for an hour and record its behavioral state at each minute (Mann 1999). In some studies, they also recorded the location of the whale at each time point. When we use drones our methods are a little different; we collect behavioral data in the form of continuous 15-minute videos of the whale. While we collect data for a shorter amount of time than a typical focal follow, we can analyze the whole video and record what the whale was doing at each second with the added benefit of being able to review the video to ensure accuracy. Additionally, from the drone’s perspective, we can see what the whales are doing below the surface, which can dramatically improve our ability to identify and describe behaviors (Torres et al. 2018).

Categorizing Behaviors

In our ethogram, the behaviors are already categorized into primary states. Primary states are the broadest behavioral states, and in my study, they are foraging, traveling, socializing, and resting. We categorize the specific behaviors we observe in the drone videos into these categories because they are associated with the function of a behavior. While our categorization is based on prior knowledge and critical evaluation, this process can still be somewhat subjective.  Quantitative methods provide an objective interpretation of the behaviors that can confirm our broad categorization and provide insight into relationships between categories.  These methods include path characterization, cluster analysis, and sequence analysis.

Path characterization classifies behaviors using characteristics of their track line, this method is similar to the RST method that fellow GEMM lab graduate student Lisa Hildebrand described in a recent blog. Mayo and Marx (1990) analyzed the paths of surface foraging North Atlantic Right Whales and were able to classify the paths into primary states; they found that the path of a traveling whale was more linear and then paths of foraging or socializing whales that were more convoluted (Fig 1). I plan to analyze the drone GPS track line as a proxy for the whale’s track line to help distinguish between traveling and foraging in the cases where the 15-minute snapshot does not provide enough context.

Figure 1. Figure from Mayo and Marx (1990) showing different track lines symbolized by behavior category.

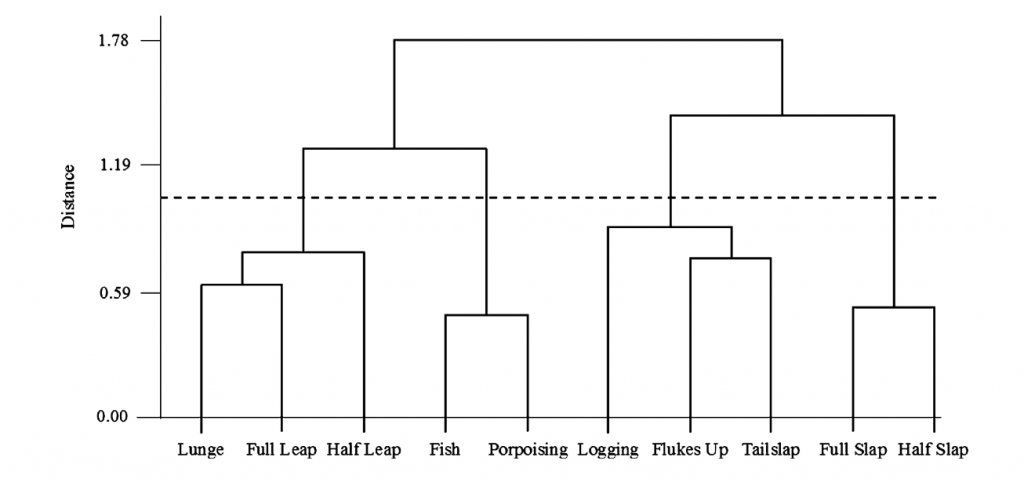
Cluster analysis looks for natural groupings in behavior. For example, Hastie et al. (2004) used cluster analysis to find that there were four natural groupings of bottlenose dolphin surface behaviors (Fig. 2). I am considering using this method to see if there are natural groupings of behaviors within the foraging primary state that might relate to different prey types or habitat. This process is analogous to breaking human foraging down into sub-categories like fishing or farming by looking for different foraging behaviors that typically occur together.

Figure 2. Figure from Hastie et al. (2004) showing the results of a hierarchical cluster analysis.

Lastly, sequence analysis also looks for groupings of behaviors but, unlike cluster analysis, it also uses the order in which behaviors occur. Slooten (1994) used this method to classify Hector’s dolphin surface behaviors and found that there were five classes of behaviors and certain behaviors connected the different categories (Fig. 3). This method is interesting because if there are certain behaviors that are consistently in the same order then that indicates that the order of events is important. What function does a specific sequence of behaviors provide that the behaviors out of that order do not?

Figure 3. Figure from Slooten (1994) showing the results of sequence analysis.

Think about harvesting fruits and vegetables from a garden: the order of how things are done matters and you might use different methods to harvest different kinds of produce. Without knowing what food was being harvested, these methods could detect that there were different harvesting methods for different fruits or veggies. By then studying when and where the different methods were used and by whom, we could gain insight into the different functions and patterns associated with the different behaviors. We might be able to detect that some methods were always used in certain habitat types or that different methods were consistently used at different times of the year.

Behavior classification methods such as these described provide a more refined and detailed analysis of categories that can then be used to identify patterns of gray whale behaviors. While our ultimate goal is to understand how gray whales will be affected by a changing environment, a comprehensive understanding of their current behavior serves as a baseline for that future study.

References

Burnett, J. D., Lemos, L., Barlow, D., Wing, M. G., Chandler, T., & Torres, L. G. (2019). Estimating morphometric attributes of baleen whales with photogrammetry from small UASs: A case study with blue and gray whales. Marine Mammal Science, 35(1), 108–139. https://doi.org/10.1111/mms.12527

Darling, J. D., Keogh, K. E., & Steeves, T. E. (1998). Gray whale (Eschrichtius robustus) habitat utilization and prey species off Vancouver Island, B.C. Marine Mammal Science, 14(4), 692–720. https://doi.org/10.1111/j.1748-7692.1998.tb00757.x

Hastie, G. D., Wilson, B., Wilson, L. J., Parsons, K. M., & Thompson, P. M. (2004). Functional mechanisms underlying cetacean distribution patterns: Hotspots for bottlenose dolphins are linked to foraging. Marine Biology, 144(2), 397–403. https://doi.org/10.1007/s00227-003-1195-4

Mann, J. (1999). Behavioral sampling methods for cetaceans: A review and critique. Marine Mammal Science, 15(1), 102–122. https://doi.org/10.1111/j.1748-7692.1999.tb00784.x

Slooten, E. (1994). Behavior of Hector’s Dolphin: Classifying Behavior by Sequence Analysis. Journal of Mammalogy, 75(4), 956–964. https://doi.org/10.2307/1382477

Torres, L. G., Nieukirk, S. L., Lemos, L., & Chandler, T. E. (2018). Drone up! Quantifying whale behavior from a new perspective improves observational capacity. Frontiers in Marine Science, 5(SEP). https://doi.org/10.3389/fmars.2018.00319

Mayo, C. A., & Marx, M. K. (1990). Surface foraging behaviour of the North Atlantic right whale, Eubalaena glacialis, and associated zooplankton characteristics. Canadian Journal of Zoology, 68(10), 2214–2220. https://doi.org/10.1139/z90-308

Demystifying the algorithm

By Clara Bird, Masters Student, OSU Department of Fisheries and Wildlife, Geospatial Ecology of Marine Megafauna Lab

Hi everyone! My name is Clara Bird and I am the newest graduate student in the GEMM lab. For my master’s thesis I will be using drone footage of gray whales to study their foraging ecology. I promise to talk about how cool gray whales in a following blog post, but for my first effort I am choosing to write about something that I have wanted to explain for a while: algorithms. As part of previous research projects, I developed a few semi-automated image analysis algorithms and I have always struggled with that jargon-filled phrase. I remember being intimidated by the term algorithm and thinking that I would never be able to develop one. So, for my first blog I thought that I would break down what goes into image analysis algorithms and demystify a term that is often thrown around but not well explained.

What is an algorithm?

The dictionary broadly defines an algorithm as “a step-by-step procedure for solving a problem or accomplishing some end” (Merriam-Webster). Imagine an algorithm as a flow chart (Fig. 1), where each step is some process that is applied to the input(s) to get the desired output. In image analysis the output is usually isolated sections of the image that represent a specific feature; for example, isolating and counting the number of penguins in an image. Algorithm development involves figuring out which processes to use in order to consistently get desired results. I have conducted image analysis previously and these processes typically involve figuring out how to find a certain cutoff value. But, before I go too far down that road, let’s break down an image and the characteristics that are important for image analysis.

Figure 1. An example of a basic algorithm flow chart. There are two inputs: variables A and B. The process is the calculation of the mean of the two variables.

What is an image?

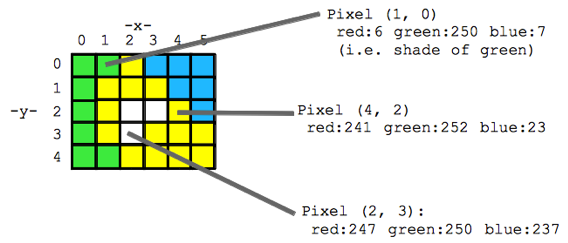
Think of an image as a spread sheet, where each cell is a pixel and each pixel is assigned a value (Fig. 2). Each value is associated with a color and when the sheet is zoomed out and viewed as a whole, the image comes together.  In color imagery, which is also referred to as RGB, each pixel is associated with the values of the three color bands (red, green, and blue) that make up that color. In a thermal image, each pixel’s value is a temperature value. Thinking about an image as a grid of values is helpful to understand the challenge of translating the larger patterns we see into something the computer can interpret. In image analysis this process can involve using the values of the pixels themselves or the relationships between the values of neighboring pixels.

Figure 2. A diagram illustrating how pixels make up an image. Each pixel is a grid cell associated with certain values. Image Source: https://web.stanford.edu/class/cs101/image-1-introduction.html

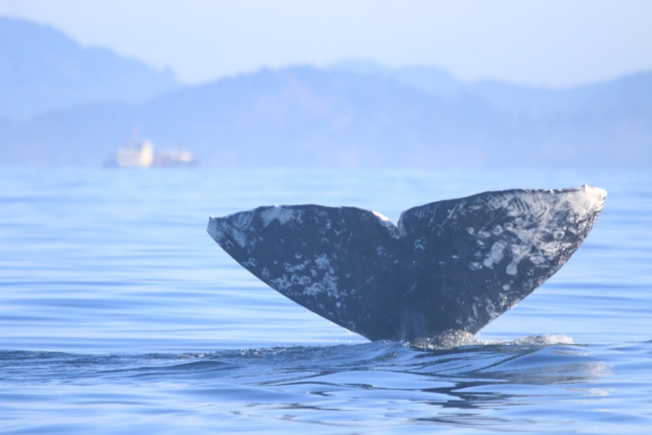
Our brains take in the whole picture at once and we are good at identifying the objects and patterns in an image. Take Figure 3 for example: an astute human eye and brain can isolate and identify all the different markings and scars on the fluke. Yet, this process would be very time consuming. The trick to building an algorithm to conduct this work is figuring out what processes or tools are needed to get a computer to recognize what is marking and what is not. This iterative process is the algorithm development.

Figure 3. Photo ID image of a gray whale fluke.

Development

An image analysis algorithm will typically involve some sort of thresholding. Thresholds are used to classify an image into groups of pixels that represent different characteristics. A threshold could be applied to the image in Figure 3 to separate the white color of the markings on the fluke from the darker colors in the rest of the image. However, this is an oversimplification, because while it would be pretty simple to examine the pixel values of this image and pick a threshold by hand, this threshold would not be applicable to other images. If a whale in another image is a lighter color or the image is brighter, the pixel values would be different enough from those in the previous image for the threshold to inaccurately classify the image. This problem is why a lot of image analysis algorithm development involves creating parameterized processes that can calculate the appropriate threshold for each image.

One successful method used to determine thresholds in images is to first calculate the frequency of color in each image, and then apply the appropriate threshold. Fletcher et al. (2009) developed a semiautomated algorithm to detect scars in seagrass beds from aerial imagery by applying an equation to a histogram of the values in each image to calculate the threshold. A histogram is a plot of the frequency of values binned into groups (Fig. 4). Essentially, it shows how many times each value appears in an image. This information can be used to define breaks between groups of values. If the image of the fluke were transformed to a gray scale, then the values of the marking pixels would be grouped around the value for white and the other pixels would group closer to black, similar to what is shown in Figure 4. An equation can be written that takes this frequency information and calculates where the break is between the groups. Since this method calculates an individualized threshold for each image, it’s a more reliable method for image analysis. Other characteristics could also be used to further filter the image, such as shape or area.

However, that approach is not the only way to make an algorithm applicable to different images; semi-automation can also be helpful. Semi-automation involves some kind of user input. After uploading the image for analysis, the user could also provide the threshold, or the user could crop the image so that only the important components were maintained. Keeping with the fluke example, the user could crop the image so that it was only of the fluke. This would help reduce the variety of colors in the image and make it easier to distinguish between dark whale and light marking.

Figure 4. Example histogram of pixel values. Source: Moallem et al. 2012

Why algorithms are important

Algorithms are helpful because they make our lives easier. While it would be possible for an analyst to identify and digitize each individual marking from a picture of a gray whale, it would be extremely time consuming and tedious. Image analysis algorithms significantly reduce the time it takes to process imagery. A semi-automated algorithm that I developed to count penguins from still drone imagery can count all the penguins on a one km2 island in about 30 minutes, while it took me 24 long hours to count them by hand (Bird et al. in prep). Furthermore, the process can be repeated with different imagery and analysts as part of a time series without bias because the algorithm eliminates human error introduced by different analysts.

Whether it’s a simple combination of a few processes or a complex series of equations, creating an algorithm requires breaking down a task to its most basic components. Development involves translating those components step by step into an automated process, which after many trials and errors, achieves the desired result. My first algorithm project took two years of revising, improving, and countless trials and errors.  So, whether creating an algorithm or working to understand one, don’t let the jargon nor the endless trials and errors stop you. Like most things in life, the key is to have patience and take it one step at a time.

References

Bird, C. N., Johnston, D.W., Dale, J. (in prep). Automated counting of Adelie penguins (Pygoscelis adeliae) on Avian and Torgersen Island off the Western Antarctic Peninsula using Thermal and Multispectral Imagery. Manuscript in preparation

Fletcher, R. S., Pulich, W. ‡, & Hardegree, B. (2009). A Semiautomated Approach for Monitoring Landscape Changes in Texas Seagrass Beds from Aerial Photography. https://doi.org/10.2112/07-0882.1

Moallem, Payman & Razmjooy, Navid. (2012). Optimal Threshold Computing in Automatic Image Thresholding using Adaptive Particle Swarm Optimization. Journal of Applied Research and Technology. 703.