By Charles Nye, graduate student, OSU Department of Fisheries, Wildlife, & Conservation Sciences, Cetacean Conservation and Genomics Laboratory
Let’s consider how much stuff organisms shed daily. If you walk down a hallway, you’ll leave a microscopic trail of skin cells, evaporated sweat, and even more material if you so happen to sneeze or cough (as we’ve all learned). The residency of these bits and pieces in a given environment is on the order of days, give or take (Collins et al. 2018). These days, we can extract, amplify, and sequence DNA from leftover organismal material in environments (environmental DNA; eDNA), stomach contents (dietary DNA, dDNA), and other sources (Sousa et al. 2019; Chavez et al. 2021).
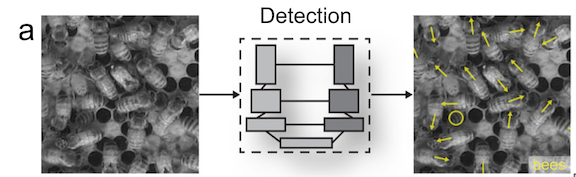
You might be familiar with genetic barcoding, where scientists are able to use documented and annotated pieces of a genome to identify a piece of DNA down to a species. Think of these as genetic fingerprints from a crime scene where all (described) species on Earth are prime suspects. With advancements in computing technology, we can barcode many species at the same time—a process known as metabarcoding. In short, you can now do an ecosystem-wide biodiversity survey without even needing to see your species of interest (Ficetola et al. 2008; Chavez et al. 2021).
(Before you ask: yes, people have tried sampling Loch Ness and came up with not a single strand of plesiosaur DNA (University of Otago, 2019).)
I received my crash course on metabarcoding when I was employed at the Monterey Bay Aquarium Research Institute (MBARI), right before grad school. There, I was employed to help refine eDNA survey field and laboratory methods (in addition to some cool robot stuff). Here at OSU, I use metabarcoding to research whale ecology, detection, and even a little bit of forensics work. Cetacean species (or evidence thereof) I’ve worked on include North Atlantic right whales (Eubalaena glacialis), killer whales (Orcinus spp.), and gray whales (Eschrichtius robustus).
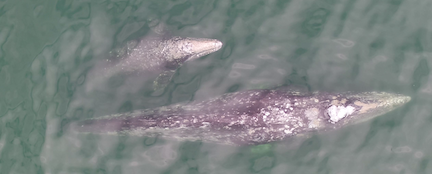
Long-time readers of the GEMM Lab Blog are probably quite knowledgeable about the summertime grays—the Pacific Coast Feeding Group (PCFG). All of us here at OSU’s Marine Mammal Institute (MMI) are keenly interested in understanding why these whales hang out in the Pacific Northwest during the summer months and what sets them apart from the rest of the Eastern North Pacific gray whale population. What interests me? Well, I want to double-check what they’re eating—genetically.
“What does my study species eat?” is a straightforward but underappreciated question. It’s also deceptively difficult to address. What if your species live somewhere remote or relatively inaccessible? You can imagine this is a common logistical issue for most research in marine sciences. How many observations do you need to make to account for seasonal or annual changes in prey availability? Do all individuals in your study population eat the same thing? I certainly like to mix and match my diet.
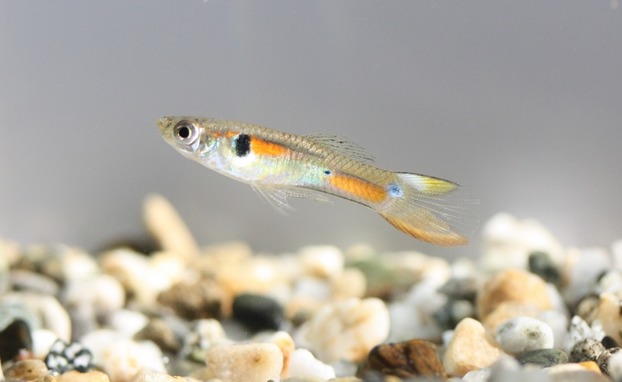
Gray whale foraging ecology has been studied comprehensively over the last several decades, including an in-depth stomach content evaluation by Mary Nerini in 1984 and GEMMer Lisa Hildebrand’s MSc research. PCFG whales seem to prefer shrimpy little creatures called mysids, along with Dungeness crab (Cancer magister) larvae, during their stay in the Pacific Northwest (PNW), most notably the mysid Neomysis rayii (Guerrero 1989; Hildebrand et al. 2021). Indeed, the average energetic values of common suspected prey species in PNW waters rival the caloric richness of Arctic amphipods (Hildebrand et al. 2021). However, despite our wealth of visual foraging observations, metabarcoding may add an additional layer of resolution. For example, the ocean sunfish (Mola mola) was believed to exclusively forage on gelatinous zooplankton, but a metabarcoding approach revealed a much higher diversity of prey items, including other bony fishes and arthropods (Sousa et al. 2016).
Given all this exposition, you may be wondering: “Charles—how do you intend on getting dDNA from gray whales? Are you going to cut them open?”

No. I’m going to extract DNA from their poop.
Well, actually, I’ve been doing that for the last two years. My lab (Cetacean Conservation and Genomics Laboratory, CCGL) and GEMM Lab have been collaborating to make lemonade out of, er…whale poop. An archive of gray whale fecal samples (with ongoing collections every field season) originally collected for hormone analyses presented itself with new life—the genomics kind. In addition to community-level data, we are also able to recover informative DNA from the gray whales, including sex ID from “depositing” individuals, though the recovery rate isn’t perfect.
Because the GEMM Lab/MMI can non-invasively collect multiple samples from the same individuals over time, dDNA metabarcoding is a great way to repeatedly evaluate the diets of the PCFG, just shy of being at the right place at the right time with a GoPro or drone to witness a feeding event. While we can get stomach contents and even usable dDNA from a naturally deceased whale, those data may not be ideal. How representative a stranded whale is of the population is dependent on the cause of death; an emaciated or critically injured individual, for example, is a strong outlier.

Here’s a snapshot of progress to date for this dDNA metabarcoding project. I pulled out twenty random samples from my much larger working dataset (n = 82) for illustrative purposes (and legibility). After some bioinformatic wizardry, we can use a presence/absence approach to get an empirical glimpse at what passes through a PCFG gray whale. While I am able to recover species-level information, using higher-level taxonomic rankings summarizes the dataset in a cleaner fashion (and also, not every identifiable sequence resolves to species).
The title of most commonly observed prey taxa belongs to our friends, the mysids (Mysidae). Surprisingly, crabs and amphipods are not as common in this dataset, instead losing to krill (Euphausiidae) and olive snails (Olividae). The latter has been found in association with gray whale foraging grounds but not documented in a prey study (Jenkinson 2001). We also get an appreciable amount of interference from non-prey taxa, most notably barnacles (Balanidae), with an honorable mention to hydrozoans (Clytiidae, Corynidae). While easy to dismiss as background environmental DNA, as gray whales do forage at the benthos, these taxa were physically present and identifiable in Nerini’s (1984) gray whale stomach content evaluation.
So—can we conclude that barnacles and hydrozoans are an important part of a gray whale’s diet, as much as mysids? From decades of previous observations, we might say…probably not. Gray whales are actively targeting patches of crabby, shrimpy zooplankton things, and even employ novel foraging strategies to do so (Newell & Cowles 2006; Torres et al. 2018). However, the sheer diversity of consumed species does present additional dimensionality to our understanding of gray whale ecology.
The whales are eating these ancillary organisms, whether they intend to or not, and this probably does influence population dynamics, recruitment, and succession in these nearshore benthic habitats. After all, the shallow pits that gray whales leave behind post-feeding provide a commensal trophic link with other predatory taxa, including seabirds and groundfish (Oliver & Slattery 1985). Perhaps the consumption of these collateral species affects gray whale energetics and reflects on their “performance”?
I hope to address all of this and more in some capacity with my published work and graduate chapters. I’m confident to declare that we can document diet composition of PCFG whales using dDNA metabarcoding, but what comes next is where one can get lost in the sea(weeds). How does the diet of individuals compare to one another? What about at differing time points? Age groups? How many calories are in a barnacle? No need to fret—this is where the fun begins!
References
Chavez F, Min M, Pitz K, Truelove N, Baker J, LaScala-Grunewald D, Blum M, Walz K,
Nye C, Djurhuus A, et al. 2021. Observing Life in the Sea Using Environmental
DNA Oceanog. 34(2):102–119. doi:10.5670/oceanog.2021.218.
Collins R, Wangensteen OS, O’Gorman EJ, Mariani S, Sims DW, Genner M. 2018. Persistence
of environmental DNA in marine systems. Comm Biol. 1(185).
https://doi.org/10.1038/s42003-018-0192-6
Ficetola GF, Miaud C, Pompanon F, Taberlet P. 2008. Species detection using
environmental DNA from water samples. Biol Lett. 4(4):423–425.
doi:10.1098/rsbl.2008.0118.
Hildebrand L, Bernard KS, Torres LG. 2021. Do Gray Whales Count Calories?
Comparing Energetic Values of Gray Whale Prey Across Two Different Feeding
Grounds in the Eastern North Pacific. Front Mar Sci. 8:683634.
doi:10.3389/fmars.2021.683634.
Jenkinson R. 2001. Gray whale (Eschrichtius robustus) prey availability and feeding ecology in
northern California, 1999-2000 [thesis]. California State Polytechnic University,
Humboldt. 81 p.
Newell CL, Cowles TJ. 2006. Unusual gray whale Eschrichtius robustus feeding in the summer
of 2005 off the central Oregon Coast. Geophys Res Lett. 33(22):L22S11.
doi:10.1029/2006GL027189.
Oliver JS, Slattery PN. 1985. Destruction and Opportunity on the Sea Floor: Effects of
Gray Whale Feeding. Ecology. 66(6):1965–1975. doi:10.2307/2937392.
Sousa LL, Silva SM, Xavier R. 2019. DNA metabarcoding in diet studies: Unveiling
ecological aspects in aquatic and terrestrial ecosystems. Environmental DNA.
1(3):199–214. doi:10.1002/edn3.27.
Sousa LL, Xavier R, Costa V, Humphries NE, Trueman C, Rosa R, Sims DW, Queiroz N.
2016. DNA barcoding identifies a cosmopolitan diet in the ocean sunfish. Sci
Rep. 6(1):28762. doi:10.1038/srep28762.
Torres LG, Nieukirk SL, Lemos L, Chandler TE. 2018. Drone Up! Quantifying Whale Behavior
From a New Perspective Improves Observational Capacity. Front Mar Sci. 5:319.
doi:10.3389/fmars.2018.00319.
University of Otago. 2019. First eDNA study of Loch Ness points to something fishy.
https://www.otago.ac.nz/news/news/otago717609.html. [accessed 2023 Apr 25]