Ecological research focuses on understanding how species and ecosystems interact and function, as well as understanding what drives changes in these interactions and functions over time. Thus, ecology is a critical component of conservation biology. Although uncertainty is present in any research, it is a pervasive characteristic of ecology and conservation biology, often due to our inability to control the complexity of natural systems. Uncertainty poses challenges to decision-making, policy development, and effective conservation strategies, and therefore needs to be understood and addressed when conducting ecological studies and conservation efforts.
There are several sources of uncertainty in ecological research and conservation biology. One of the primary sources arises from incomplete or limited data (epistemic uncertainty). Ecological systems are complex, and obtaining comprehensive data on all relevant variables and scales is often challenging or impossible. Data may be lacking or unavailable for certain species, habitats, or regions, which can hinder the ability to fully understand ecological dynamics and make accurate predictions. Additionally, ecological data may be uncertain or variable due to measurement errors (see blog post), sampling biases, or changes in data collection methods over time (Regan et al. 2002). Furthermore, another source of uncertainty arises from language (linguistic uncertainty). Linguistic uncertainty can result from lack of agreement in the terms and definitions used in the scientific vocabulary (see blog post), which can often result in ambiguous, vague, or context dependent interpretations (Regan et al 2002). These two source-types of uncertainty can create a complex set of challenges.
Uncertainty in ecological research and conservation biology has important implications for decision-making and policy development. When faced with uncertain information, decision-makers may adopt a cautious approach, leading to delayed or ineffective conservation actions. Alternatively, they may make decisions based on incomplete or biased data, which can lead to unintended consequences or wasted resources. Uncertainty can also affect the public’s perception of ecological issues, leading to skepticism, misinformation, or lack of support for conservation initiatives. In addition, uncertainty can also pose challenges in setting conservation priorities. With limited resources, conservation organizations and policymakers must prioritize efforts to protect species or habitats that are at the greatest risk. However, uncertainties in data or predictions can affect the accuracy of risk assessments, leading to potential misallocation of resources. Finally, uncertainty may also arise when assessing the success of conservation interventions, making it difficult to determine the effectiveness of the conservation actions.
Despite the challenges posed by uncertainty, there are ways to address and mitigate its impacts in ecological research and conservation biology. Here are some strategies that the GEMM Lab implements to navigate these nuances in ecological research:
Improving data quality and quantity: Robust data can provide a more accurate understanding of ecological dynamics and facilitate evidence-based decision-making. In this direction, the GEMM Lab develops comprehensive data collection and monitoring efforts that can help reduce uncertainty. The TOPAZ and GRANITE projects, which study gray whale ecology off the Oregon coast, are good examples in this direction due to continuous research efforts since 2015. With these projects we have developed and standardized data collection and analytical methods, improved data accuracy and precision, and are filling knowledge gaps through targeted research.
Emphasizing adaptive management: Adaptive management is an approach that involves learning from ongoing conservation actions and adjusting strategies based on new information (Allen et al. 2015). This approach recognizes that uncertainties are inherent in ecological systems and promotes flexibility in conservation planning. Monitoring and evaluating conservation interventions, and adjusting management strategies, accordingly, can help mitigate the impacts of uncertainty. With OBSIDIAN, OPAL, and HALO projects the GEMM Lab works towards a better understanding of cetaceans’ distribution and its interactions with the oceanographic conditions (e.g., ocean temperature). These research projects can help to forecast the occurrence of whale aggregations and inform management to reduce conflicts when overlapping with human activities. For instance, results from the OPAL project have been incorporated into Dungeness Crab fishing regulations to reduce entanglement risk to whales, and the GEMM Lab is now investigating the effectiveness of these regulations in the SLATE project.
With these projects, along with the many other research efforts conducted by the GEMM lab and the MMI, we are advancing research in marine ecology, through the development and application the best possible science to generate the needed ecological data for effective conservation and management of the marine environment.
Did you enjoy this blog? Want to learn more about marine life, research, and conservation? Subscribe to our blog and get a weekly message when we post a new blog. Just add your name and email into the subscribe box below.
Sources:
Regan, H. M., Colyvan, M., & Burgman, M. A. (2002). A taxonomy and treatment of uncertainty for ecology and conservation biology. Ecological applications, 12(2), 618-628.
Allen, C. R., & Garmestani, A. S. (2015). Adaptive management (pp. 1-10). Springer Netherlands.
As I sat down to write this blog, I realized that it is the first post I have written in 2023! This is largely because I have spent the last seven weeks preparing for (and partly taking) my PhD qualifying exams, an academic milestone that involves written and oral exams prepared by each committee member for the student. The point of the qualifying exams is for the student’s committee to determine the student’s understanding of their major field, particularly where and what the limits of that understanding are, and to assess the student’s capability for research. How do you prepare for these exams? Reading. Lots of reading and synthesis of the collective materials assigned by each committee member. My dissertation research covers a broad range of Pacific Coast Feeding Group (PCFG) gray whale ecology, such as space use, oceanography, foraging theory and behavioral responses to anthropogenic activities. Accordingly, my assigned reading lists were equally broad and diverse. For today’s blog, I am going to share some of the papers that have stuck with me and muse about how these topics relate to my study system, the Pacific Coast Feeding Group (PCFG) of gray whales.
Space use & home range
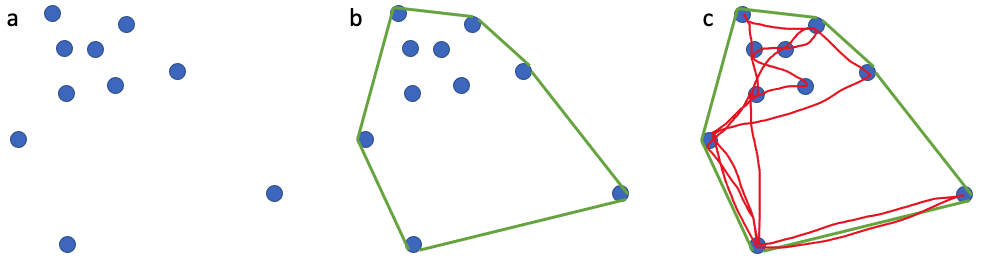
For decades, ecologists have been interested in defining an animal’s use of space through time, often referred to as an animal’s home range. The seminal definition of a home range comes from Burt (1943) who outlined it as “the area traversed by an individual in its normal activities of food gathering, mating, and caring for young.”. I like this definition of a home range because it is biologically grounded and based on an animal’s requirements. However, quantifying an animal’s home range based on this definition is harder than it may sound. In an ideal world, it could be achieved if we were able to collect location data that is continuous (i.e., one location per second), long-term (i.e., at least half the lifespan of an animal) and precise (i.e., correct to the nearest meter) together with behavior for an individual. However, a device that could collect such data, particularly for a baleen whale, does not currently exist. Instead, we must use discontinuous (i.e., one location per hour, day or month) and/or short-term (i.e., <1 year) data with variable precision to calculate animal home ranges. A very common and simple analytical method that is used to calculate an animal’s home range is the minimum convex polygon (MCP). MCP draws the smallest polygon around points with all interior angles less than 180º. While this method is appealing and widely used, it often overestimates the home range by including areas not used by an animal at all (Figure 1).
Figure 1. (a) 10 point locations where an individual was observed; (b) the home range as determined by the minimum convex polygon method; (c) the red path shows the movements the animal actually took. Note the large white area in (c) where the animal never went even though it is considered part of the animal’s home range.
This example is just one of many where home range estimators inaccurately describe an animal’s space use. However, this does not mean that we should not attempt to make our best approximations of an animal’s home range using the tools and data we have at our disposal. Powell & Mitchell perfectly summarized this sentiment in their 2012 paper: “Understanding animal’s home ranges will be a messy, irregular, complex process and the results will be difficult to map. We must embrace this messiness as it simply represents the real behaviors of animals in complex and variable environments.”. For my second dissertation chapter, I am investigating individual PCFG gray whale space use patterns by calculating activity centers and ranges. The activity center is simply the geographic center of all points of observation (Hayne, 1949) and the range is the distance from the activity center to the most distant point of observations in either poleward direction. While the actual activity center is probably relatively meaningless to a whale, we hope that by calculating these metrics we can identify different strategies of space use that individuals employ to meet their energetic requirements (Figure 2).
Figure 2. Sightings of nine different PCFG individuals across our GRANITE study area. Each circle represents a location where an individual was sighted and circles are color-coded by year. Plotting the raw data of sighting histories of these individuals hints at patterns in space use by different individuals, which I will explore further in my second dissertation chapter.
Non-stationary responses to oceanography
Collecting spatiotemporally overlapping predator-prey datasets at the appropriate scales is notoriously challenging in the marine environment. As a result, marine ecologists often try to find patterns between marine species and oceanographic and/or environmental covariates, as these can sometimes be easier to sample and thus make marine species predictions simpler. This approach has been applied successfully in hundreds, if not thousands, of studies (e.g., Barlow et al., 2020; Derville et al., 2022). Unfortunately, these relationships are not always proving to be stable over time, a phenomenon called non-stationarity. For example, Schmidt et al. (2014) showed that the reproductive successes of Brandt’s cormorants and Cassin’s auklets on southeast Farallon Island were positively correlated with each other from 1975 to 1995 and were associated with negative El Niño-Southern Oscillation. However, around the mid-1990s this relationship broke down and by 2002, the reproductive successes of the two species were significantly negatively correlated (Figure 3). Furthermore, the relationships between reproductive success and most physical oceanographic conditions became highly variable from year to year and were non-stationary. Thus, if the authors continued to use the relationships defined early on in the study (1975-1995) to predict seabird reproductive success relative to ocean conditions from 2002-2012, their predictions would have been completely wrong. After reading this study, I thought a lot about what the oceanographic conditions have been since the GEMM Lab started studying PCFG gray whales vs. the years prior. Leigh launched the GRANITE project in 2016, right at the tail end of the record marine heatwave in the Pacific, known as “the Blob”. While we do not have as long of a dataset as the Schmidt et al. (2014) study, I wonder whether we might find non-stationary responses between PCFG gray whales and environmental and/or oceanographic variables, given how the effects of the Blob lingered for a long time and we may have captured the central Oregon coast environment shifting from ‘weird to normal’. Non-stationarity is something I will at least keep in mind when I am working on my third dissertation chapter which will investigate the environmental and oceanographic drivers of PCFG gray whale space use strategies.
Figure 3. Figure and caption taken from Schmidt et al. (2014).
There are so many more studies and musings that I could write about. I keep being told by others who have been through this qualifying exam process that this is the smartest I am ever going to be, and I finally understand what they mean. After spending almost two months in my own little study world, my research, and where it fits within the complex web of ecological knowledge, has snapped into hyperfocus. I can see clearly where past research will guide me and where I am blazing a new trail of things never attempted before. While I still have the oral portion of my exams before me (in fact, it’s tomorrow!), I am already giddy with excitement to switch back to analyzing data and making progress on my dissertation research.
Did you enjoy this blog? Want to learn more about marine life, research, and conservation? Subscribe to our blog and get a weekly message when we post a new blog. Just add your name and email into the subscribe box below.
References
Barlow, D.R., Bernard, K.S., Escobar-Flores, P., Palacios, D.M., Torres, L.G. 2020. Links in the trophic chain: modeling functional relationships between in situ oceanography, krill, and blue whale distribution under different oceanographic regimes. Marine Ecology Progress Series 642: 207−225.
Burt, W.H. 1943. Territoriality and home range concepts as applied to mammals. Journal of Mammalogy 24(3): 346-352. https://doi.org/10.2307/1374834
Derville, S., Barlow, D.R., Hayslip, C., Torres, L.G. 2022. Seasonal, annual, and decadal distribution of three rorqual whale species relative to dynamic ocean conditions off Oregon, USA. Frontiers in Marine Science 9. https://doi.org/10.3389/fmars.2022.868566
Hayne, D.W. 1949. Calculation of size of home range. Journal of Mammalogy 30(1): 1-18.
Powell, R.A., Mitchell, M.S. 2012. What is a home range? Journal of Mammalogy 93(4): 948-958. https://doi.org/10.1644/11-MAMM-S-177.1
Schmidt, A.E., Botsford, L.W., Eadie, J.M., Bradley, R.W., Di Lorenzo E., Jahncke, J. 2014. Non-stationary seabird responses reveal shifting ENSO dynamics in the northeast Pacific. Marine Ecology Progress Series 499: 249-258. https://doi.org/10.3354/meps10629
Imogen Lucciano, Graduate student, OSU Department of Fisheries, Wildlife, & Conservation Sciences, Geospatial Ecology of Marine Megafauna Lab.
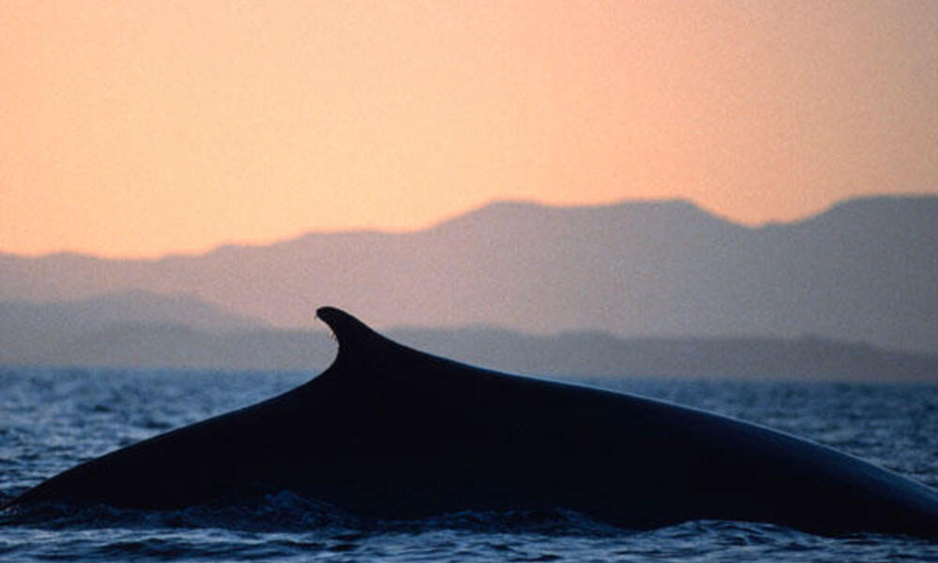
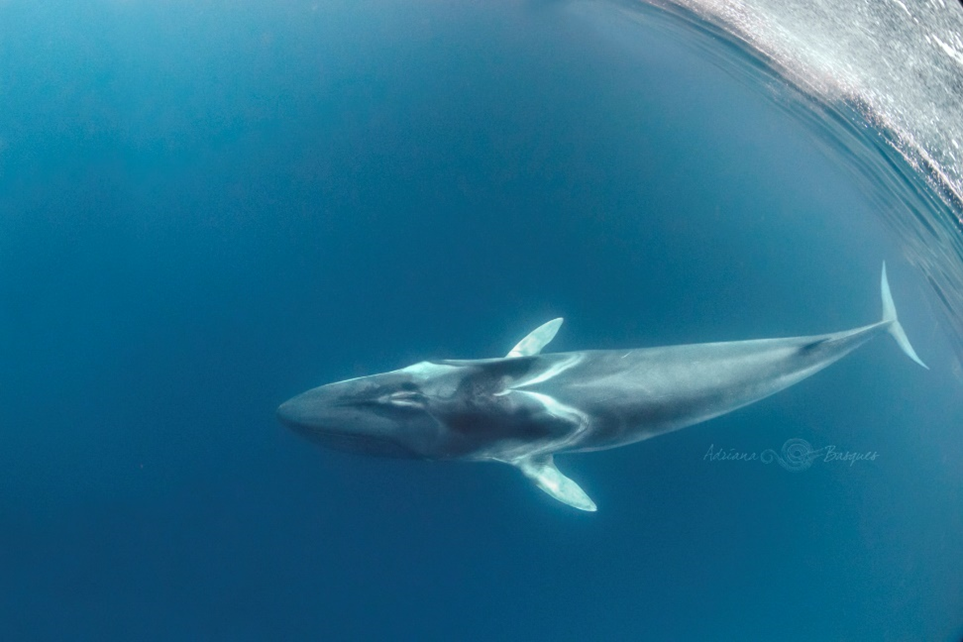
Fin whale dorsal fin. Photo credit: https://www.worldwildlife.org/photos/fin-whale–8
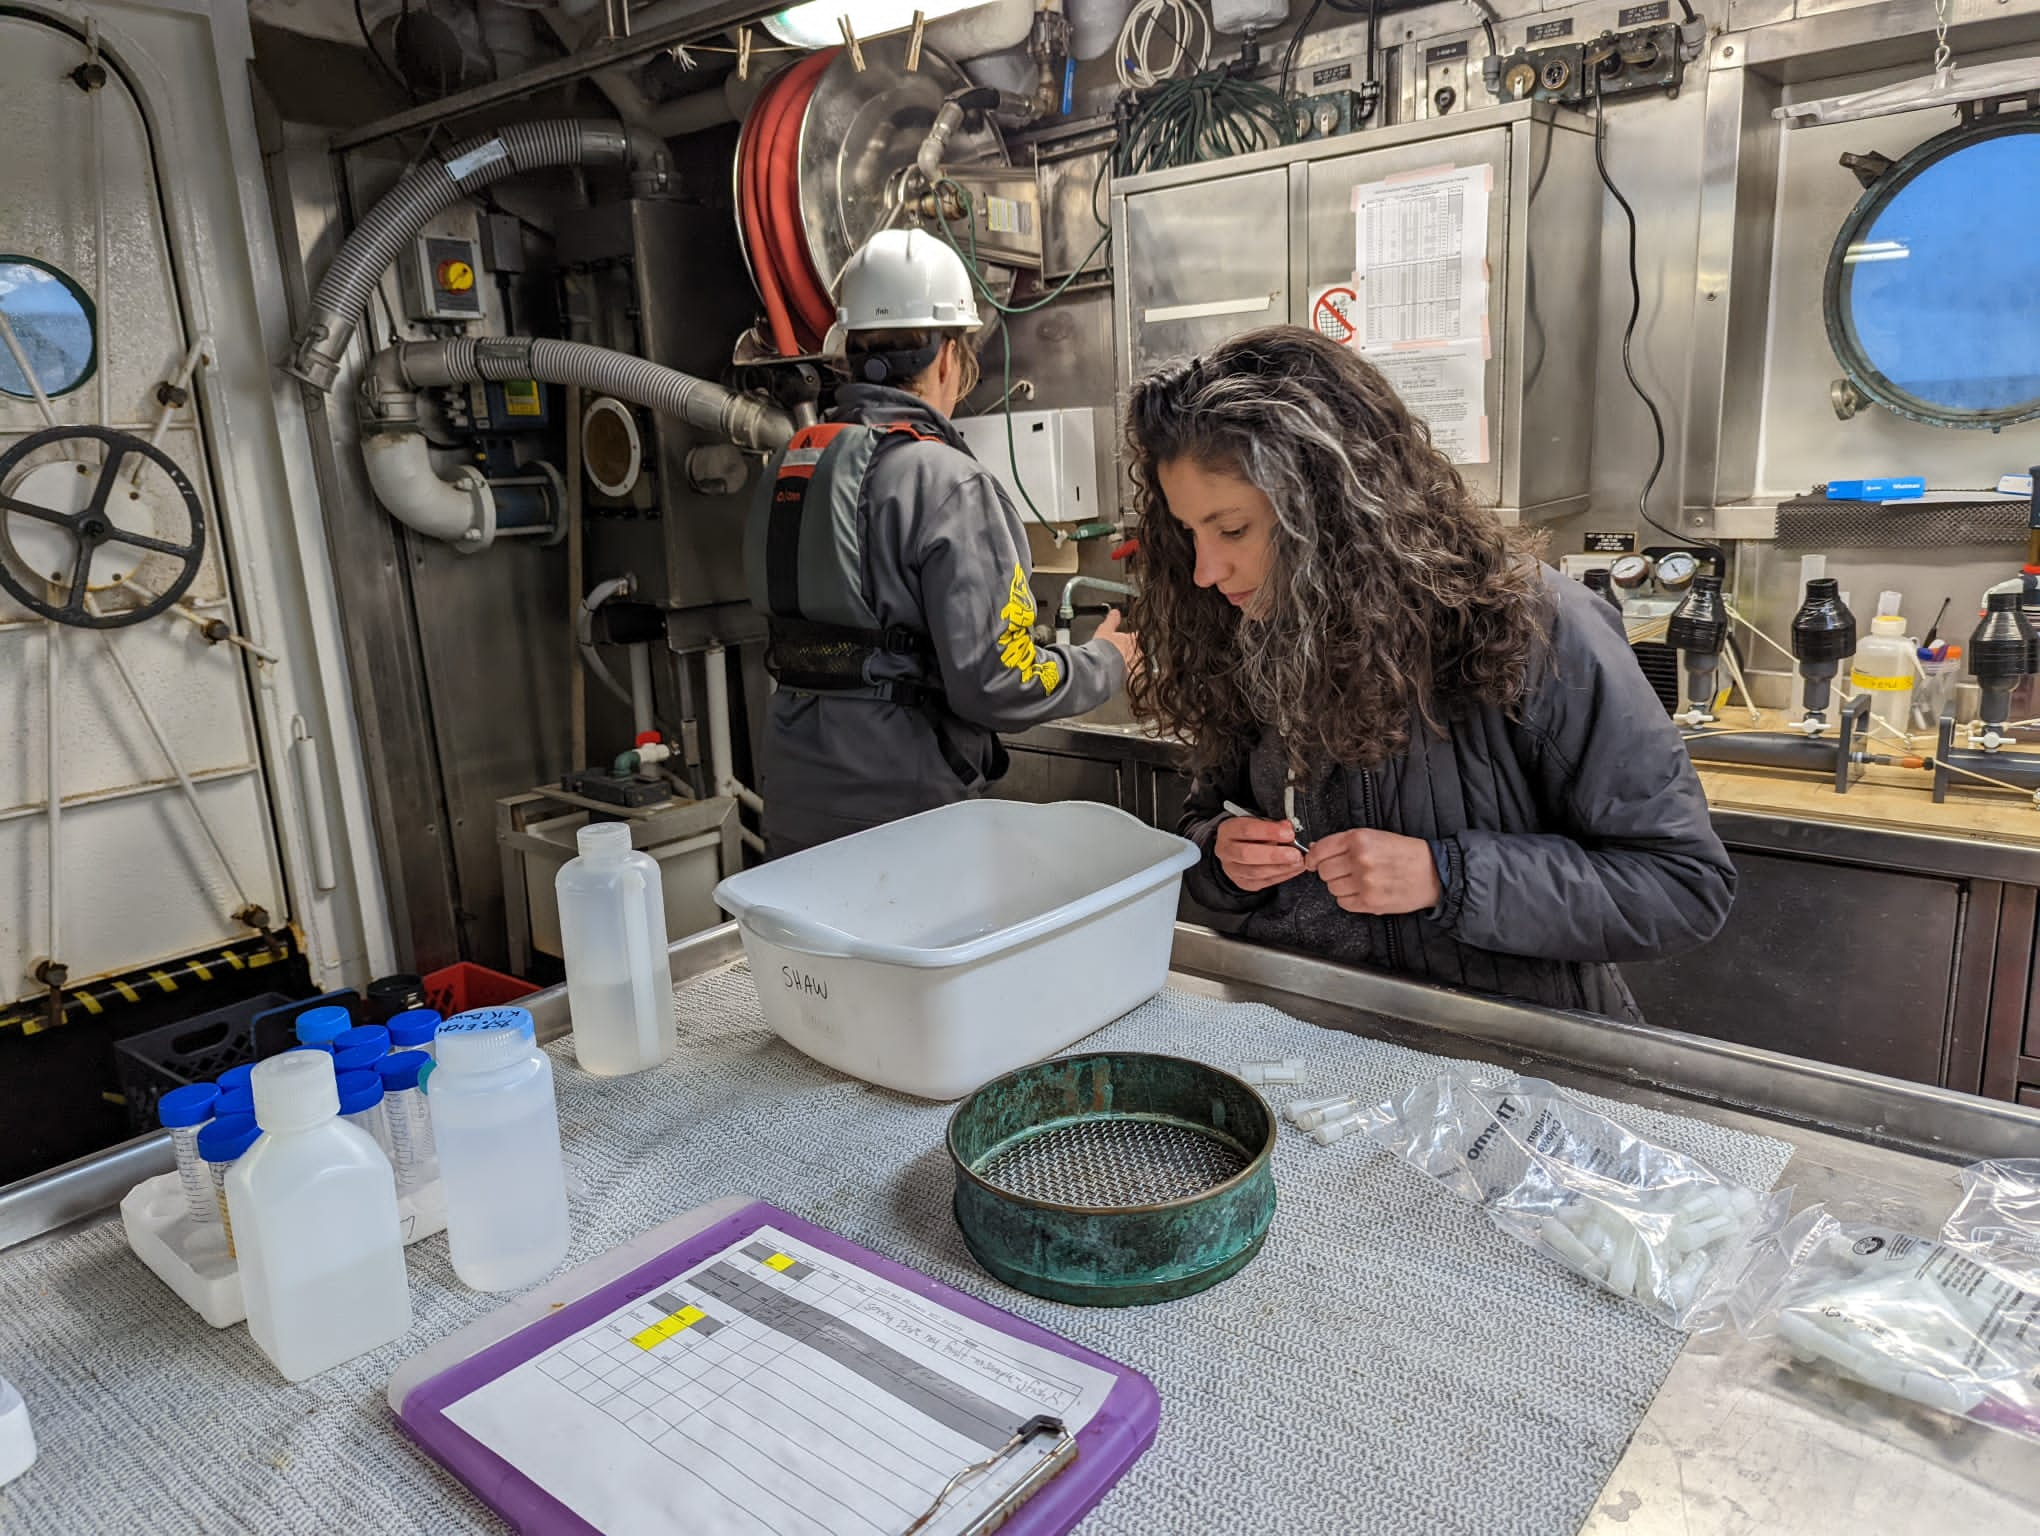
Work in the GEMM lab is booming in all different directions of whale research, and so taking turns writing for the GEMM lab blog gives all of its members an opportunity to highlight topics that are specific and current to us individually. I am two-thirds of the way done with my MSc thesis program, and I’ve recently begun speaking publicly about my work on the HALO project and fin whale acoustic detection off the Oregon coast. In this blog I’ll highlight a two-part question that I am often asked, “Can you see more than fin whales in the data, and how can you tell the species apart when you are looking at it?”. These questions provide great ponderance and are very significant to what I am trying to accomplish. The answer is that I absolutely can see other whales when I am looking through the acoustic data and in fact I have to be quite meticulous in my efforts to tease them apart at times. Let me explain:
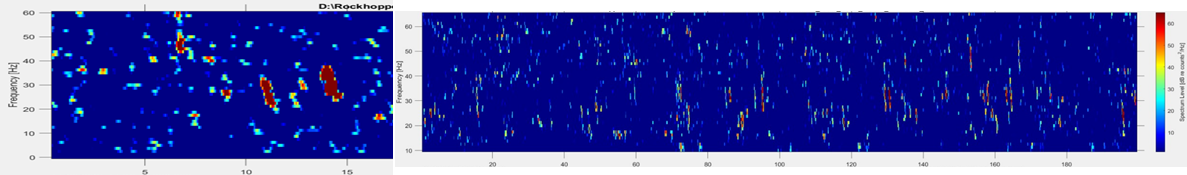
The acoustic data set I am working with tells an important story of the waters off the Oregon coast and will illuminate researchers (and the public) on the presence of all detectable vocal whales and dolphins in the area over the past year, from October 2021 to January of 2023. The advanced technological recording systems, called Rockhoppers, that HALO deploys off the coast of Newport, provide us with continuous sound files for the entire time that they are deployed. (I previously wrote a short blog on Rockhoppers, for those interested in more information.) Then, we analysts (graduate students) on the project work to establish the acoustic presence of our target species within those files.
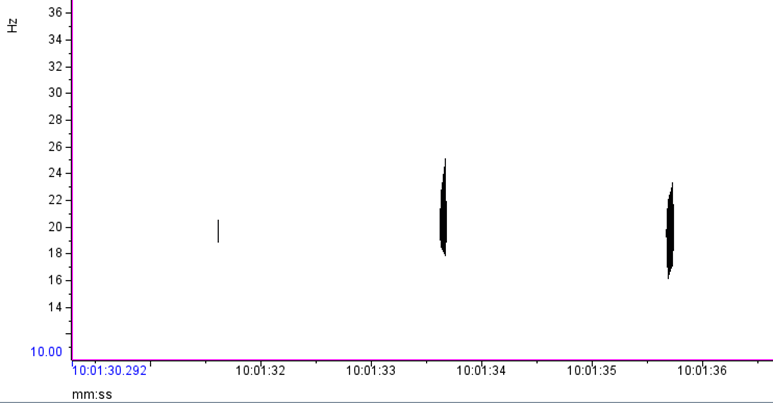
Based on what experts in the field of cetacean bioacoustics currently understand about fin whales, they produce sounds at a very low frequency for both socializing (presumably their 20 Hz pulse call) and for foraging (presumably their 40 Hz downsweep call) (Sirovic et al. 2013; Romagosa et al. 2021). During my efforts to determine the presence of fin whales, it is relatively easy to identify the 20 Hz pulse call, since this call has been well documented in the literature and is the only cetacean call described that occurs in its frequency range. I look for these calls in spectrogram representations of the acoustic data, which allow me to see the selected frequency range over our data collection period (time; Figure 1).
Figure 1. The two black vertical lines shown in this spectrogram are two 20 Hz fin whale pulse calls I identified in the HALO acoustic data using Raven Pro. Nearly all of the fin whale calls I’ve identified in the HALO data occur in pulses ranging from ~17 Hz to 27 Hz.
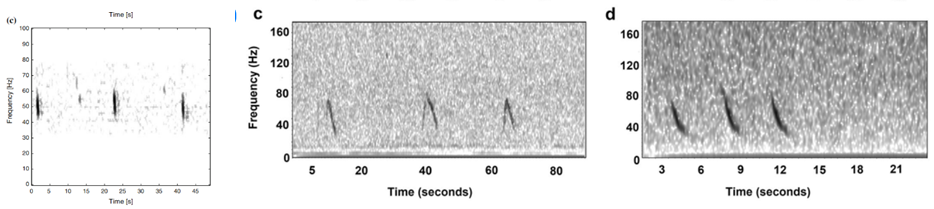
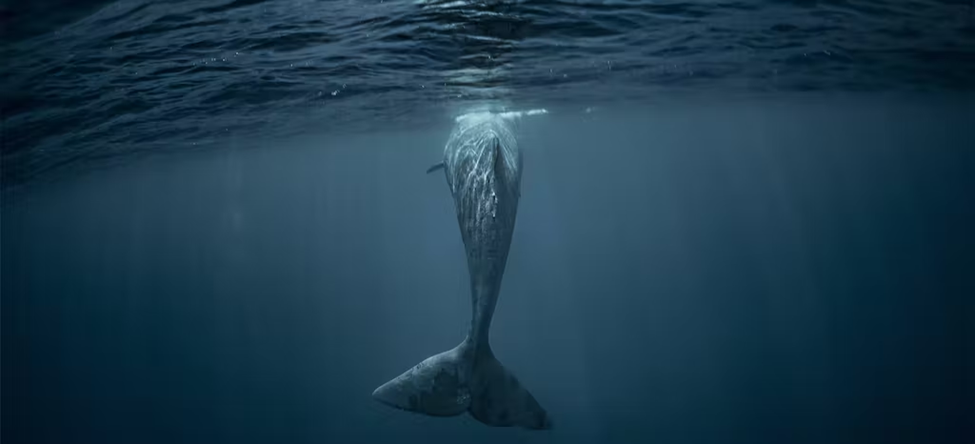
Where this process becomes complicated for me is when I look for the 40 Hz fin whale downsweep call, which is known to occur between ~ 75 Hz – 30 Hz (Wiggins & Hildebrand 2020; Romagosa et al. 2021). This call can vary slightly within this frequency range. Interpretation of this call reaches even higher ambiguity when there are blue whales and sei whales acoustically detected in the same time frame in the same area. The acoustic repertoire of both blue and sei whale calls fall in the same frequency range: blue whales producing what is known as “D calls” and sei whales are known to make low-frequency downsweep calls (Figure 2; Sirovic et al. 2013; Romagosa et al. 2020).
Figure 2. From left to right: Fin whale 40 Hz downsweep call (Sirovic et al. 2013); Blue whale D call, Sei whale downsweep call. (Romagosa et al. 2020)
At first glance, the vocalizations from these three whales can be easily confused, and so I am looking for finer details to help tease out the fin whale downsweeps. As shown in Figure 2, there is a difference in the behavior of these calls, with the sei whale call being a shorter call by a matter of 2-3 seconds. The sei whale downsweep calls have not been frequently described in the literature, however those few publications report these calls occurring over 1.4-1.6 seconds (Baumgartner et al. 2008; Espanol-Jimenez et al. 2019) and in each published spectrogram, I have observed this similar boomerang-type looking behavior in the call. Blue whale D calls, on the other hand, are calls produced as social calls while foraging (Szesciorka et al 2020) and known to occur over ~1.8 seconds (Oleson et al. 2007).
Fin whale 40 Hz calls have a duration of about one second and are not known to be produced in a regular sequence (Sirovic et al. 2013), thus I am teasing them out carefully from what can sometimes appear like a diversly grouped choir of low frequency whale song among the HALO data (Figures 3 & 4).
Figure 3. Left hand figure: Red vertical lines occurring from 39 Hz to 22 Hz in the spectrogram are Fin whale 40 Hz call I have identified in the HALO data. Figure 4. Right hand figure shows many vertical lines in the 80 Hz to 20 Hz range that could be interpreted at first glance as different whale species vocalizations, including fin, blue and sei whales.
Although there are some known seasonal patterns of each of these aforementioned whale calls (Sirovic et al. 2013; Szesciorka et al. 2020), many data gaps remain of the temporal patterns of the 40 Hz and 20 Hz calls (i.e., when the calls occur) off the Oregon coast. Therefore, I cannot assume that I will only see 40 Hz calls in any time period. I need to assess the behavior of the calls I detect and tease out the calls I know surely are fin whale 40 Hz downsweeps in each file of the entire acoustic dataset.
Afterthought: The HALO project is new and has only just collected its first year of acoustic data, however the project is intent to continue deploying and collecting Rockhoppers off the Oregon coast for years to come. As this acoustic data set continues to grow it will be used by other researchers, and I (among the first to process and analyze it) feel some pressure to get things done right. As I process these data I will work hard to make the best-informed call identifying fin whales in the 40 Hz range. This focus and feeling of responsibility reassure me that I am in the appropriate career field. I really care about how these data are processed, where the research will go from here, and how it influences human activities in this critical whale habitat.
Did you enjoy this blog? Want to learn more about marine life, research, and conservation? Subscribe to our blog and get a weekly message when we post a new blog. Just add your name and email into the subscribe box below.
References
Baumgartner, M., Van Parijs, S., Wenzel, F., et al. 2008. Low frequency vocalizations attributed to sei whales. Acoustical Society of America, 124 (2): 1339-1349. https://www.whoi.edu/cms/files/JAS001339_59390.pdf.
Espanol-Jimenez, S., Bahamonde, P., Chiang, G., Haussermann, V. 2019. Discovering sounds in
Oleson, E., Calambokidis, J., Burgess, W,. et al. 2007. Behavioral context of call production by eastern North Pacific blue whales. Marine Ecology Progress Series, 330 : 269-284. https://www.int-res.com/articles/meps_oa/m330p269.pdf.
Romagosa, M., Perez-Jorge, S., Cascao, I., et al. 2021. Food talk: 40-Hz fin whale calls are associate with prey biomass. Proceedings of the Royal Society B: Biological Sciences, 288 (1954): 20211156. https://pubmed.ncbi.nlm.nih.gov/34229495/.
Sirovic, A., Williams, L., Kerosky, S., Wiggins, S., Hildebrand, J. 2013. Temporal separation of two fin whale call types across the eastern North Pacific. Marine Biology, 160: 47-57.
Allison Dawn, GEMM Lab Master’s student, OSU Department of Fisheries, Wildlife and Conservation Sciences, Geospatial Ecology of Marine Megafauna Lab
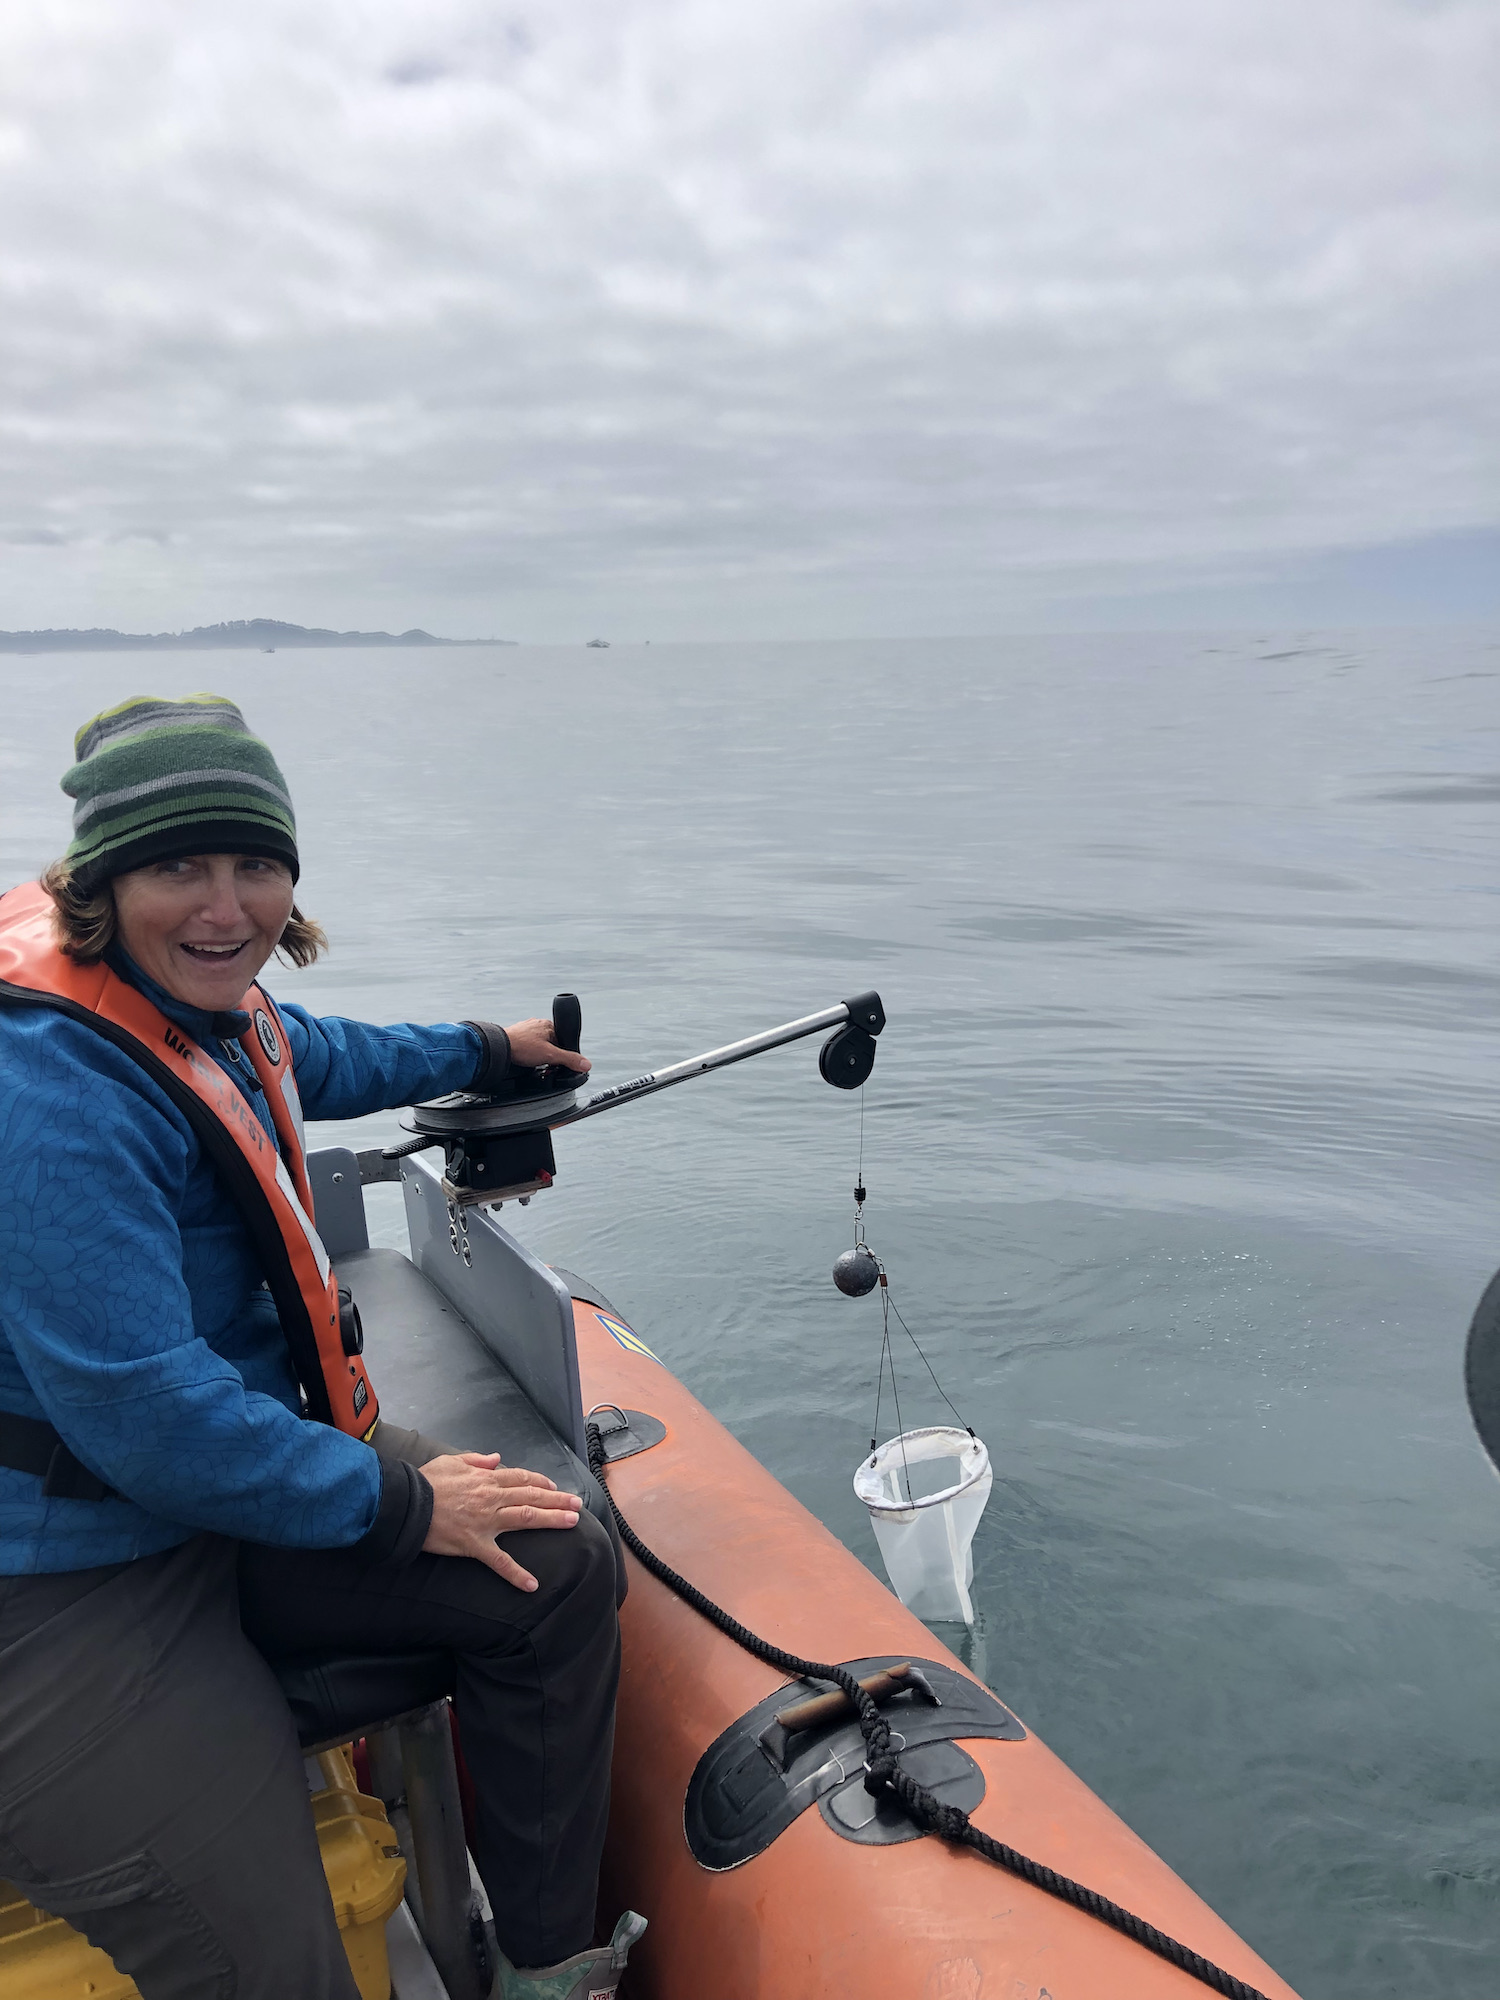
If you have followed the GEMM Lab blog for a while, you have read about the multitude of techniques we use to conduct research. A combination of platforms and technologies help us observe whales: rigid inflatable boats (RHIBs), kayaks, theodolites, cameras, binoculars, high-tech drones, and more. However, not only do we observe from the sky and sea surface, but we also know it is important to monitor whale behavior, habitat, and prey underwater. For this week’s blog, I’d like to highlight the GEMM Lab’s sub-surface efforts as part of the TOPAZ/JASPER project, and share more about the world of scientific diving.
Most terrestrial ecologists have the luxury of strolling through their study systems without having to give thought to their next breath, but marine scientists need creative, streamlined, and most importantly, life-preserving ways to directly observe the ocean environment. Like most inventions, today’s self-contained underwater breathing apparatus (SCUBA) equipment was developed from countless prototypes worldwide, dating as far back as the 1800s. This equipment was improved during World War II, specifically to support combat swimmers (called “frogmen” at the time). After the Franco-German Armistice of 1940, French engineer Émile Gagnan and Naval Lieutenant/Oceanographer Jacques Cousteau teamed up to invent the “Aqua-Lung” (Fig. 1), which allowed divers to autonomously stay underwater for much longer periods of time.
Figure 1: Vintage advertisement for the Aqua-Lung (left) and a diver testing out the equipment (right). Photos sourced from https://us.aqualung.com/en/ourstory.html
Now that the first commercially successful breathing apparatus was available, universities began to purchase these units to aid with scientific exploration. However, after a series of fatal diving accidents, the Scripps Institution of Oceanography felt it was urgent to develop the first scientific diving safety program in 1954, years before recreational diving courses were implemented. With specific tasks at hand, the additional level of distraction makes safety and situational awareness that much more important. Now, scientific dive programs, like the one at OSU, are widespread, and after proper safety precautions and training, researchers have been able to accomplish what was previously implausible: restore coral reefs, obtain genetic information from invasive species, monitor species under polar ice sheets, and so much more (Fig. 2).
Figure 2: Scientific divers at work. Norwegian polar ice diver Michal Tessman collects algae, zooplankton, and phytoplankton samples (left); Florida State doctoral student Nathan Spindel obtains genetic material from urchins (top right); Dr. Colleen Bove of UNC Chapel Hill monitors tropical coral growth (bottom right).
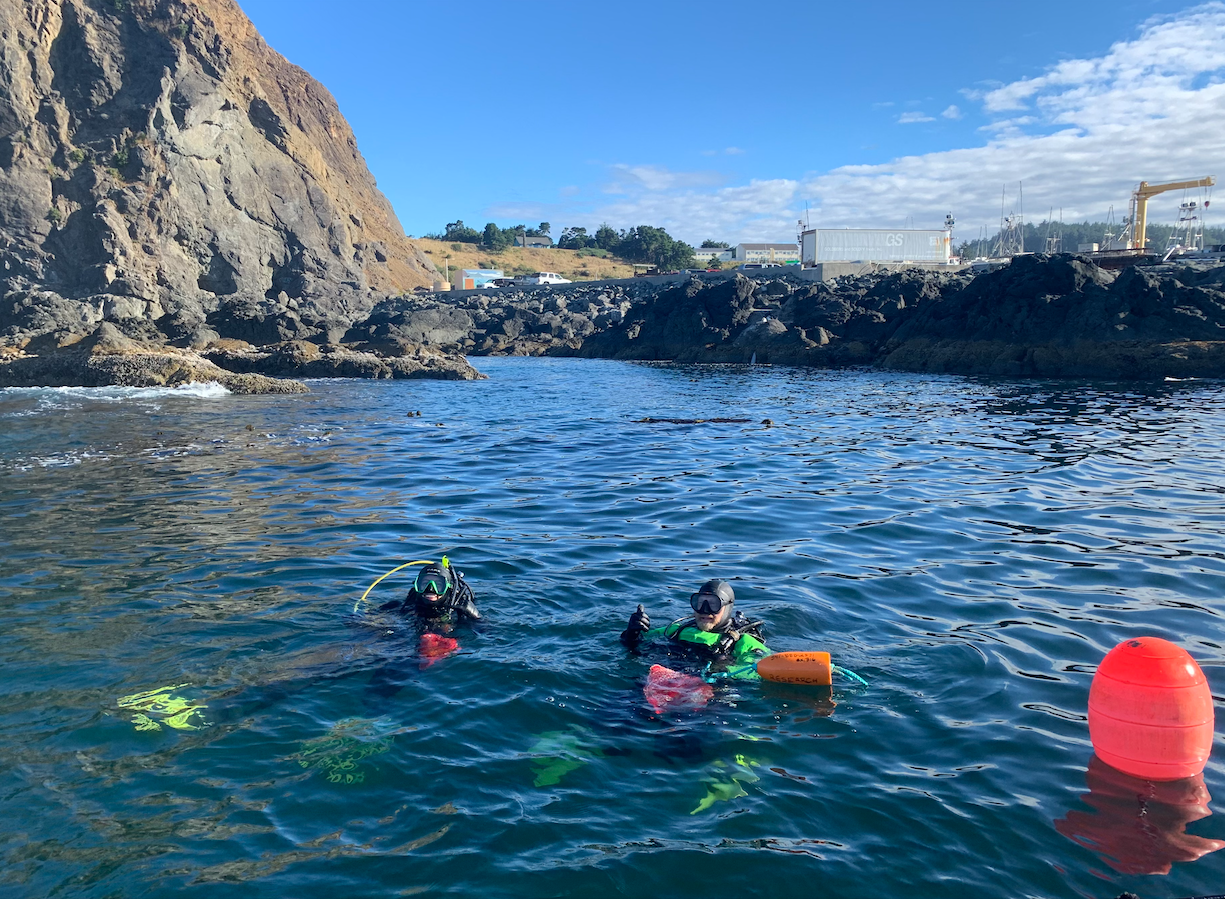
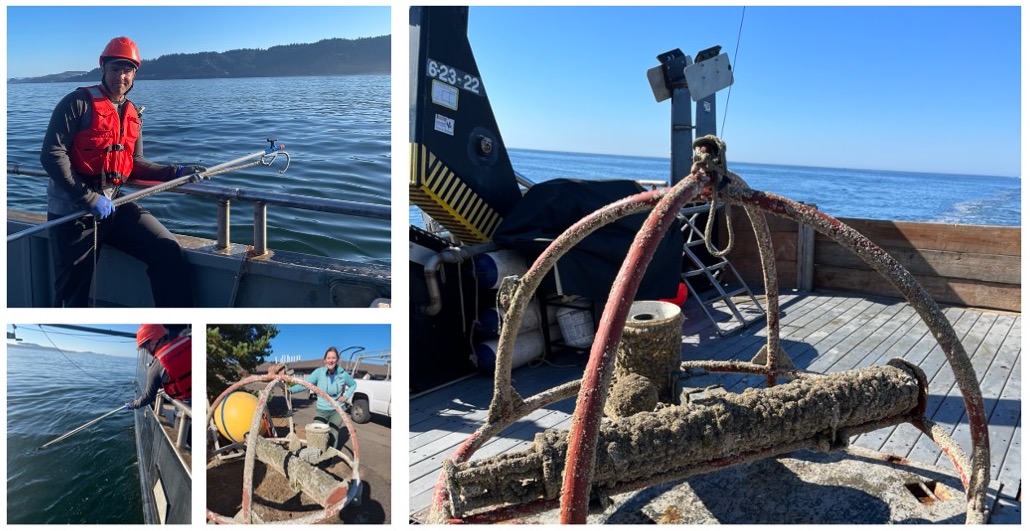
On the south coast of Oregon, the GEMM lab collaborates with Dr. Aaron Galloway, an accomplished scientific diver and one of the lead scientists with the Oregon Kelp Alliance (ORKA), an organization dedicated to kelp forest monitoring, urchin culling, and restoration efforts. He and his team, along with our long-term project partner Dave Lacey of South Coast Tours, help us deploy our in situ underwater cameras each summer (Figs 3 & 4). As you may know, the TOPAZ component of our project aims to link fine-scale gray whale foraging ecology to prey distribution patterns, using inexpensive field methods. The in situ underwater CamDO camera systems are an exciting, recent addition to our long-standing sampling approach.
Figure 3: CamDo lander with attached oceanographic sensors (left); two new OSU scientific divers and Marine Studies Initiative interns, Faith Townsend and Caroline Rice, preparing to dive (right).
We have two durable camera housings that anchor in Mill Rocks and Tichenor Cove. In each housing we insert a GoPro, an extra battery, and a microcontroller programmed to record footage at continuous intervals. With these cameras we capture hundreds of hours of underwater footage of fish, zooplankton, and we hope to one day record gray whale foraging.
Figure 4: Dr. Aaron Galloway and his graduate student Samantha Persad getting ready to complete the final dive of the season in ideal visibility conditions.
Each week during the field season, the divers and I meet early at the dock to board the tour boat Black Pearl for our routine CamDO maintenance excursions. My first role on the early morning journeys is to be a “dive tender” — I help the divers back on board, log their dive times and air pressure, and keep gear organized on the boat. Then, while the divers relax and enjoy a snack, my next role begins. The next few minutes is what we refer to as the “NASCAR pit-stop” of camera maintenance: I replace batteries, swap SD cards, program the camera, ensure that it is secure in the housing, and tuck it into the diver’s bag along with installation tools. All the while, I simultaneously listen for radio calls from our Port Orford interns, sometimes troubleshooting urgent questions while they collect zooplankton and water quality data from the kayak or observe for whales from the cliff.
This multitasking is challenging, but at least I am dry, warm, and have total dexterity of my hands. As I watch the divers descend, in all their neoprene glory, to secure the camera back to its stationary landing, I like to imagine what they are seeing and experiencing. If visibility is good, they will descend into a cerulean blue world filled with rockfish, jellies, mysid swarms, and algae covered reefs (Fig 5.). However, as exciting as sightseeing can be while diving, my own scientific diver training has allowed me to understand the focus, determination, and adaptability even the simplest of tasks require, especially in the chilly waters of the Pacific Northwest.
Figure 5: Under the surface: black rockfish enjoying a swim around the rocky reefs in Tichenor Cove, Port Orford.
I earned my AAUS Scientific Diver certification in 2018 through UNC Chapel Hill, and have since learned just how different cold water is from warm water diving. My first cold water dive was at the Orford Reef exhibit in the Oregon Coast Aquarium. Guided by Kevin Buch, OSU’s Diving and Boat Safety Officer, I gained a new respect for how important it is to train in the conditions you will be working in. For example, cold-water diving requires much more insulation, which in turn changes your buoyancy and dexterity. At first, I struggled to learn my new buoyancy baseline while simultaneously rolling out transect tape with thick neoprene gloves and keeping a curious sturgeon from stealing my mask. At times it felt like I was learning to dive all over again. This winter, I have increased my confidence by taking evening SCUBA proficiency courses to sharpen my skills and logging dives in local conditions.
Figure 6: Obtaining my open water certification on the French Reef in Florida Keys, 2018.
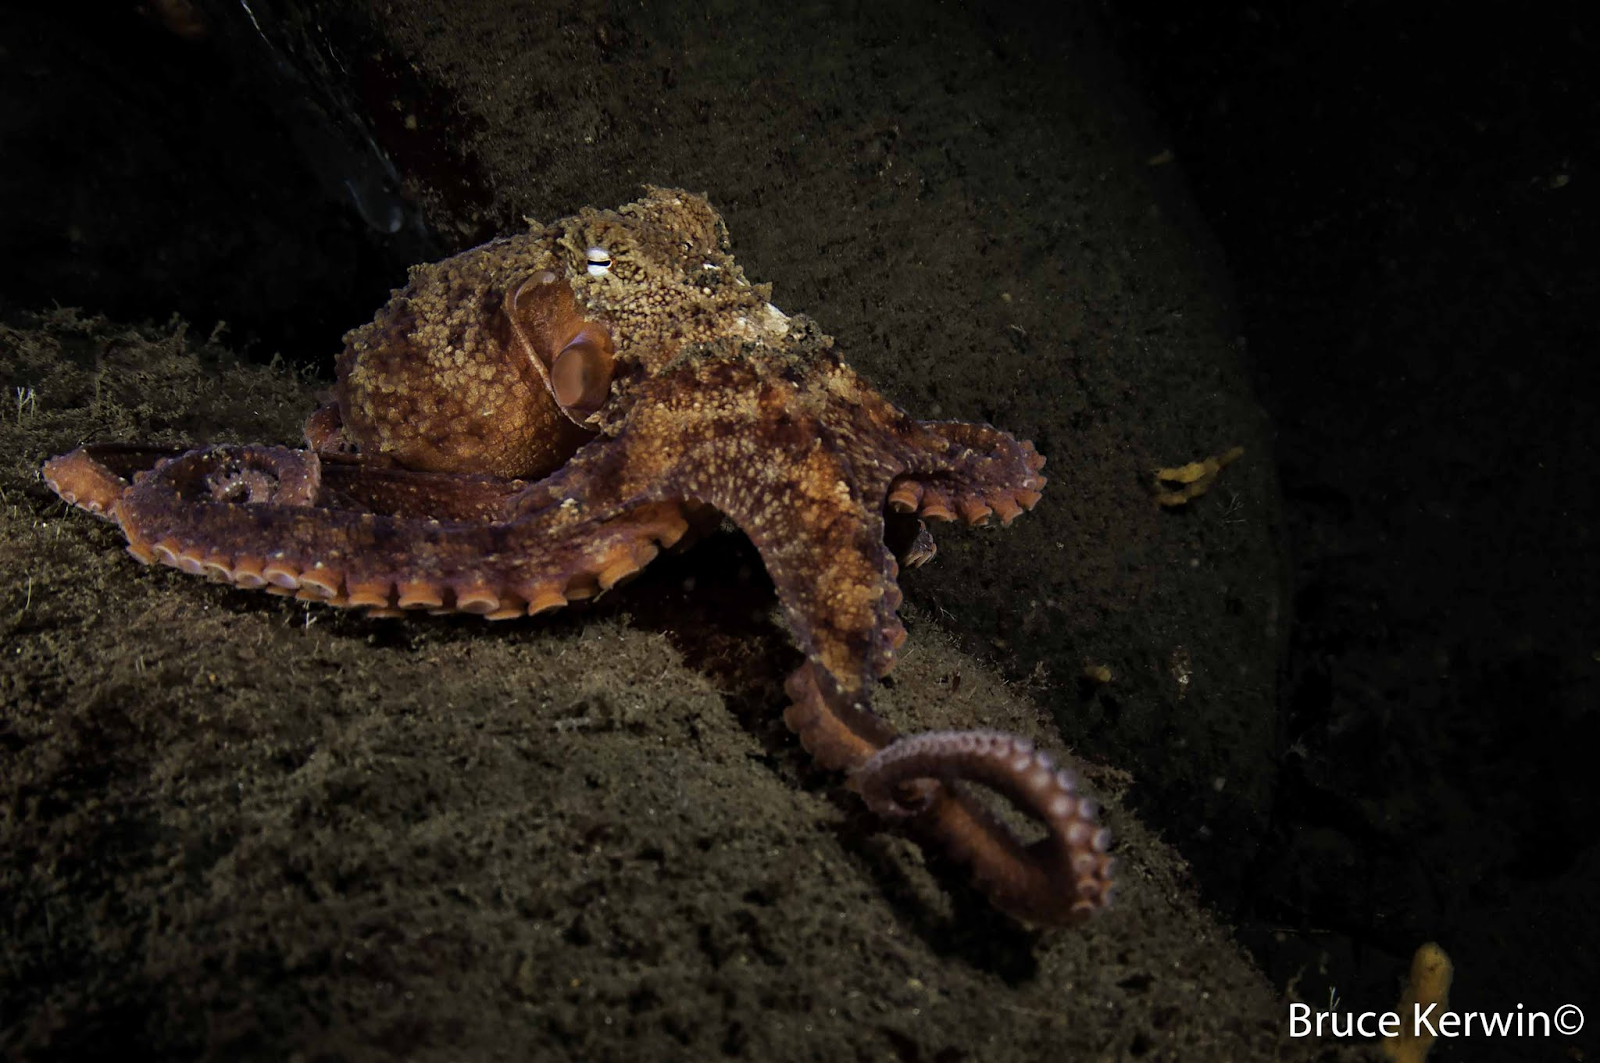
As part of our Advanced Diver weekend course in the beautiful Hood Canal, I had the opportunity to hone my skills in compass navigation, buoyancy, night and deep dives, and search & recovery methods, all in my new cold water gear. While my dive buddy and I were ecstatic to see some amazing flora and fauna (giant pacific octopus, sea pens, nudibranch, pipefish, and more!) we mainly bonded over the shared sense of achievement in safely completing our complex tasks in low-visibility, cold-water conditions.
Figure 7: Giant Pacific Octopus like this can be observed while diving in the Hood Canal, photo credit Bruce Kerwin.
As I complete these trainings, I think of all there is to to be discovered with data collected under the surface of our Port Orford study system: the health of kelp forests, the density and patchiness of mysid shrimp (the crucial prey source for gray whales), habitat complexity, and more. I am curious if there are certain puzzle pieces driving gray whale foraging decisions that may be revealed through expanding our subsurface monitoring efforts as part of the GEMM Lab’s already impressive dataset.
The skill sets required for scientific diving are also useful for outdoor leadership, and truly in all situations: maintaining a cool head under stressful conditions, planning for the unexpected, managing expectations, and communicating well (you can’t really talk with a regulator in your mouth!) — to name just a few. Regardless of exactly how I use my scientific dive training for future research, I am thankful for all this experience has taught me; and, I look forward to integrating these skills further as we head into our 9th year of the JASPER/TOPAZ project.
Did you enjoy this blog? Want to learn more about marine life, research, and conservation? Subscribe to our blog and get a weekly message when we post a new blog. Just add your name and email into the subscribe box below.
Another year has come and gone, and with the final days of 2022 upon us, it is my honor and pleasure to present to you, dear reader, this summary of achievements by the GEMM Lab this year. It has been another big year for us, so snuggle up with your favorite holiday drink and enjoy our recap of 2022!
Leigh working hard during GRANITE field work
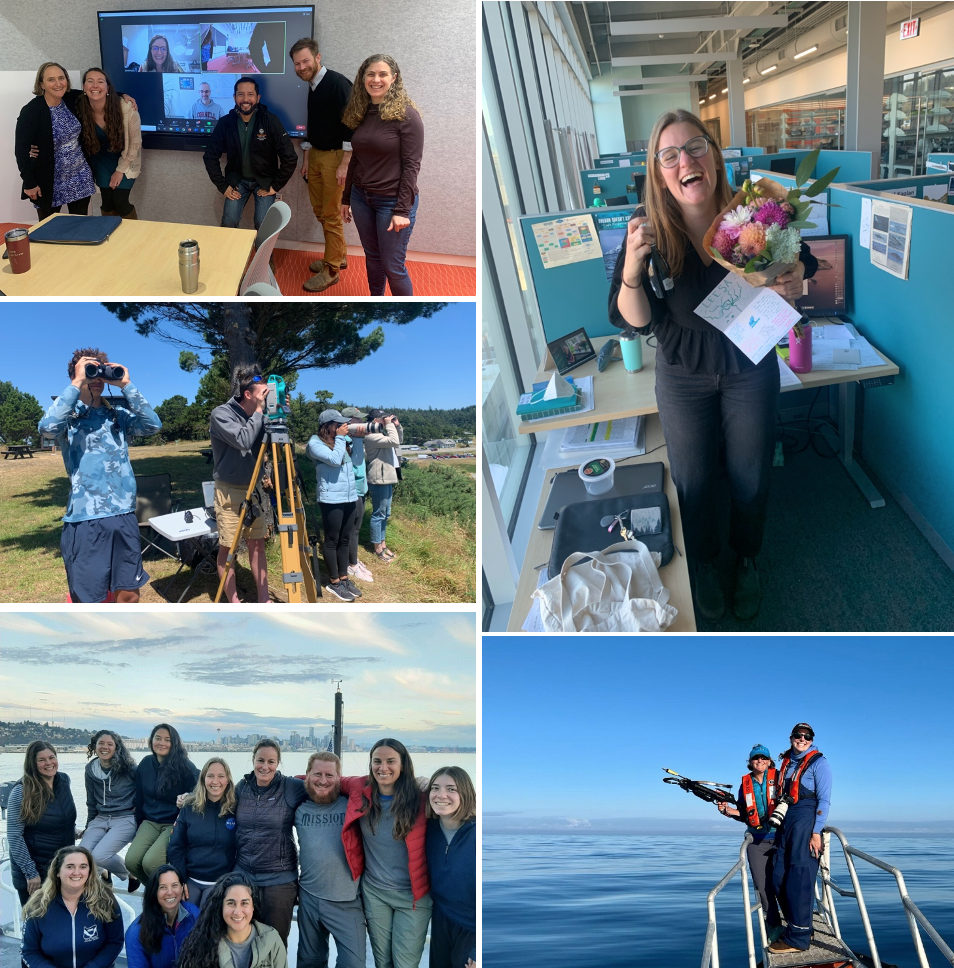
2022 was a huge year of milestones for each lab member. The biggest happened just a few weeks ago when, on December 1st, our primary investigator (PI) and the captain at the GEMM Lab helm, Leigh Torres, started her sabbatical!!! Leigh, who received tenure and became an Associate Professor in 2020, was eligible for a sabbatical this year and took the opportunity to take a very well-deserved three months in New Zealand with her family. Leigh established the GEMM Lab in 2014, and it has since grown into a 13-person strong team that aims to advance marine science and conservation through innovative and engaged research across 11 active projects. I know I speak for all my lab mates when I say that we are incredibly grateful and thankful for Leigh, who always prioritizes us, even when she is busy with other things. Leigh, enjoy New Zealand and your time off! Your crew will man the GEMM Lab ship while you are away, under the leadership of the four postdocs, your first mates. Speaking of which…
Dawn Barlow defended her PhD dissertation “Ecology and Distribution of Blue Whales in New Zealand Across Spatial and Temporal Scales” in April and became the latest Dr. of the GEMM Lab! Dawn’s achievements were recognized by OSU’s College of Agricultural Sciences as she was awarded the prestigious Savery Outstanding Doctoral Student Award in the spring. Finishing her PhD also marked the culmination of a decade of blue whale research in New Zealand, which began with Leigh’s hypothesis of a resident blue whale population in the region. Thankfully, we have not had to say goodbye to Dawn as she is now a GEMM Lab postdoctoral scholar (more below). The milestones kept coming after Dawn’s defense as PhD student Clara Bird became PhD candidate Clara Bird in April after passing her qualifying exams. Four of us – MS students Allison Dawn and Imogen (also called Miranda) Lucciano, and PhD students Rachel Kaplan and myself – successfully defended our research proposals to our committees and had fruitful discussions about how to best accomplish our ambitious proposed research. Morgan O’Rourke-Liggett rejoined the GEMM Lab after being the undergraduate intern in the 2017 TOPAZ/JASPER (Theodolites Overlooking Predators and Prey / Journey for Aspiring Students Pursuing Ecological Research) field season, and they completed their graduate certificate in Geographic Information Systems in the Fall. For their capstone project, Morgan is now working on accounting for GRANITE (Gray whale Response to Ambient Noise Informed by Technology and Ecology) survey effort in order for us to then understand whether and how distribution patterns of gray whales have changed. Finally, Imogen completed her Graduate Certificate of Wildlife Management and moved into an M.Sc. program. Hip-hip-hurrah for all of these degree milestones!
Clockwise: New Dr. Dawn Barlow with her committee after successfully defending her PhD dissertation; Lisa (me) celebrating after a successful PhD research review; Dawn and Leigh during a successful OPAL field day; the R/V Bell M. Shimada science team on the September cruise (Rachel is second from left in the back row); the 2022 TOPAZ/JASPER field team hard at work
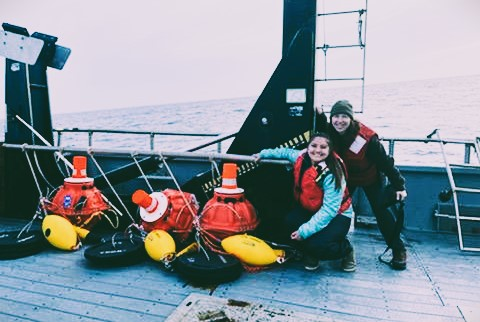
This year, it felt like someone in the GEMM Lab was always either preparing for fieldwork, in the field, or completing the post-fieldwork tasks of gear maintenance and data download. This reality is not surprising given that we have five active projects that involve fieldwork, which keep us busy on the ocean. Another two successful gray whale field seasons are on the books! Our project GRANITE wrapped its 7th consecutive year of field work in Newport on October 15th, while the integrated projects TOPAZ/JASPER completed an 8th consecutive field season in Port Orford at the end of August. The GRANITE field team grew with the addition of Master’s student Kate Colson, who is co-advised by Leigh and Dr. Andrew Trites at University of British Columbia. Down south in Port Orford, Allison successfully led her first solo field season after taking over the project from me last year. But the nearshore is not the only place that captured the GEMM Lab’s attention. HALO (Holistic Assessment of Living marine resources off Oregon) completed three survey cruises in January, June, and July, which included the successful recovery and replacement of three hydrophones, providing Imogen and Cornell PhD student Marissa Garcia with their long-awaited acoustic data. Imogen oversees cruise coordination for this GEMM Lab effort, and several lab members have gone to sea for HALO, including Imogen, Rachel, Dawn and Leigh. We also continued our participation in the Northern California Current (NCC) cruises, where we collect marine mammal and krill data for the OPAL (Overlap Predictions About Large whales) project. Dawn, Rachel and Clara all headed out together on NOAA’s R/V Bell M. Shimada in May, while Rachel was the sole GEMM Lab representative on the September cruise. Offshore biopsy efforts and U.S. Coast Guard helicopter flights also contributed data to OPAL through the year. Finally, Leigh and Dawn also participated in the MMI-wide MOSAIC (Marine Offshore Species Assessment to Inform Clean energy) cruises in August and October. Despite spending so many hours on the water, we were productive onshore too…
Gray whale suction cup taggingHALO hydrophones back!GRANITE field teamDawn during OPAL field workRachel, Dawn & Clara on the NCC cruise
Our faraway postdoc Solène, who has been working remotely from New Caledonia, has made steady progress on the OPAL project. Her biggest achievement this year was finishing the first, NOAA section 6-funded component, and helping to acquire funding for the second phase of the project, which Rachel started work on for her PhD. We were lucky to have Solène visit the lab in January, where she met the new and reunited with the old faces of the GEMM Lab. While her time in Oregon was only 6 weeks or so, we managed to rope her into her first and second gray whale paper (stay tuned for that sometime in 2023). And to top off our quest of making Solène an Oregonian, we are so thrilled to announce that she and her husband Micah have finally acquired their visas to move here in just a few weeks, landing in January 2023!!
Solène & Micah after receiving their visa to come to the USA in January 2023
We have been, and continue to be, busy processing and analyzing all of the rich datasets that we collect during our intense field efforts. While I do not have time to mention all of the work that occurs in the lab and on our computers, I want to highlight some of them. Our postdoctoral scholar Alejandro A. Fernández Ajó is currently back at his graduate institute, Northern Arizona University, conducting lab work to analyze the 63 fecal samples collected from 26 individual gray whales during our 2022 GRANITE field season. Rachel and her amazing team of krill interns have been doing lots of bomb calorimetry all year to better understand the caloric value of different krill species and cohorts. Imogen spent a month at Cornell University in Ithaca, New York, to hone her skills for baleen whale recognition in acoustics data and to become well acquainted with OSU affiliates Dr. Holger Klinck, PhD student Marissa Garcia, and other researchers at the K. Lisa Yang Center of Conservation Bioacoustics.
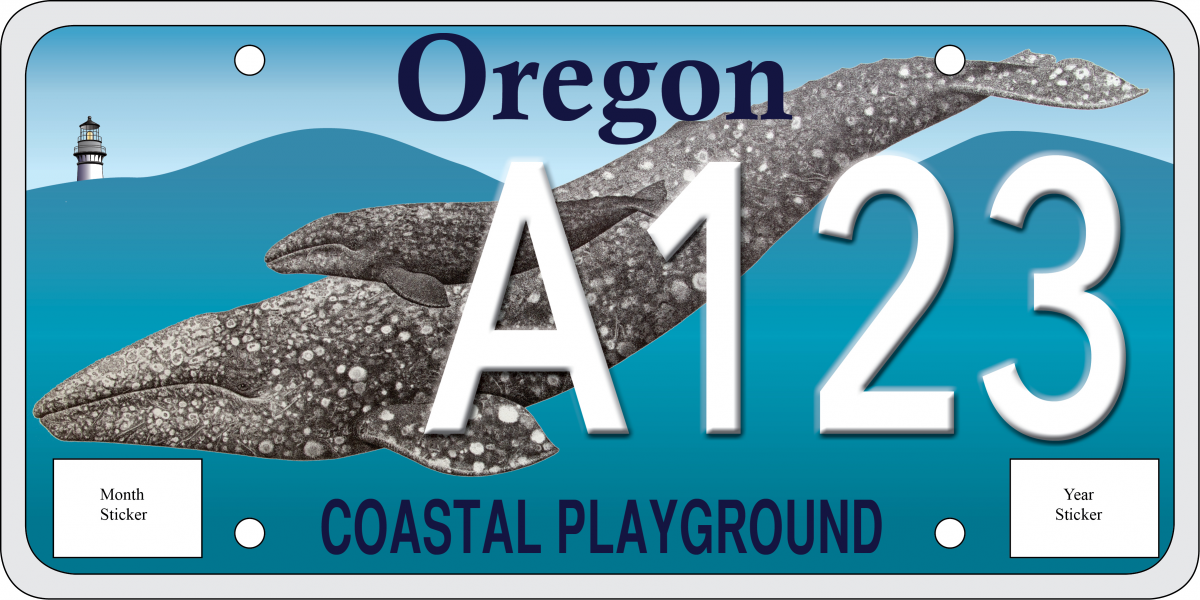
Even with all these projects underway, it seems that we cannot go a full year in the GEMM Lab without launching new endeavors. 2022 saw the creation of two more projects. For her postdoctoral research, Dawn is leading the newly-launched EMERALD (Examining Marine mammal Ecology through Region-wide Assessment of Long-term Data), which investigates spatiotemporal distribution patterns in harbor porpoise and gray whales in the nearshore NCC waters. Secondly, postdoctoral scholar KC Bierlich and Leigh have received funding to kickstart MMI’s Center of Drone Excellence (CODEX), which will launch in 2023. CODEX will focus on developing open-source tools and software to help analyze drone imagery, with the aim of offering online tutorials and hosting workshops. Both EMERALD and CODEX are funded by sales and renewals of the special Oregon gray whale license plate, which benefits MMI. We gratefully thank all the gray whale license plate holders, who made this research possible, and encourage any Oregonians that don’t have a whale on their tail yet, to do so in 2023!
Describing a year in the life of the GEMM Lab would not be complete without mentioning our outreach and education efforts as well. Allison, Clara, and I put on our teaching hats and gave guest lectures and labs for Dr. Renee Albertson and Dr. Kate Stafford’s marine mammal classes here at OSU as well as host an Introduction to R/RStudio workshop for undergraduates in our roles as coordinators for the Fisheries & Wildlife Mentorship Program. Alejandro gave a virtual talk to graduate students at the University of Pretoria South Africa about conservation physiology, highlighting his research with southern right whales. KC was invited to talk about using drones and computer science to study whales at Newport High School’s Computer Science Course and Oregon Sea Grant’s Whale Ecology Homeschool Program. He also gave the keynote presentation at the 25th Annual Salmon Bowl, part of the National Oceanic Sciences Bowl, which was hosted by OSU in February. Clara and myself were both invited speakers for Cape Perpetua’s monthly speaker series, where we presented our PhD research. Furthermore, GEMM Lab members also presented our work at numerous scientific conferences including the Society of Marine Mammal conference, Ocean Sciences, PICES annual meeting, and TWS Oregon Chapter, to name a few. The dissemination of our work to the scientific community and the public is a central focus of our lab, and we also prioritize providing hands-on opportunities and experiences to students eager to participate in ecological research. We mentored a total of 12 students in 2022, from high school to graduate level, who were involved in all aspects of our research including kayaking in Port Orford to collect prey samples, meticulously measuring drone images of whales, and spending hours hunched over microscopes identifying tiny crustaceans.
Clockwise: 2022 TOPAZ/JASPER team (Charlie, Luke, Allison, Nicola, Zoe); REU student Braden Virgil discussing his poster; krill interns Abby and Henley; REU student Celest with mentors Clara and Leigh
We have once again been prolific writers, contributing 19 total peer-reviewed publications to 15 different scientific journals. If you are in the mood for some holiday reading, you will find the full list of publications at the end of this post. All authors in bold are (or were) GEMM Lab members when the work occurred.
And YOU, our awesome, supportive readers, have once again been busy, with a whopping 25,368 views of our blog this year!!! Thank you for joining us on our 2022 journey! We hope you have enjoyed the tales that we have told and the knowledge we have (hopefully) conveyed. On one final note, if you are still looking for that perfect holiday gift for the whale-lover in your life, and if you want to support our research, consider adopting a whale from our IndividuWhale website. As a small incentive, if you adopt a whale before the end of the year, you will be entered into our Oregon South Coast Whale Watch Experience giveaway! We will reveal the giveaway winner in January 2023. We wish you all restful, happy, and most importantly, healthy holidays, and hope you will join us again in 2023!
The GEMM Lab with their white elephant gifts during our annual holiday party
Did you enjoy this blog? Want to learn more about marine life, research, and conservation? Subscribe to our blog and get a weekly message when we post a new blog. Just add your name and email into the subscribe box below.
Publications
Barlow, D.R., Klinck, H., Ponirakis, D., Holt Colberg, M., Torres, L.G. (In Press). Temporal occurrence of three blue whale populations in New Zealand waters from passive acoustic monitoring. Journal of Mammalogy.
Barlow, D.R., Estrada Jorge, M., Klinck, H., Torres, L.G. (2022). Shaken, not stirred: blue whales show no acoustic response to earthquake events. Royal Society Open Science. 9:220242.
Bierlich, K.C., Hewitt, J., Schick R.S., Pallin, L., Dale, J., Friedlaender, A.S., Christiansen, F., Sprogis K.R., Dawn, A.H., Bird, C.N., Larsen, G., Nichols, R., Shero, M., Goldbogen, J.A., Read, A., Johnston, D.W. (2022). Seasonal gain in body condition of foraging humpback whales along the Western Antarctic Peninsula. Frontiers in Marine Science. 9, 1–16. https://www.frontiersin.org/articles/10.3389/fmars.2022.1036860/full
Cade, D.E., Kahane-Rapport, S.R., Gough, W.T., Bierlich, K.C., Linksy, J.M.J., Johnston, D.W., Goldbogen, J.A., Friedlaender, A.S. (in press). Ultra-high feeding rates of Antarctic minke whales imply a lower limit for body size in engulfment filtration feeders. Nature Ecology and Evolution.
D’Agostino, V.C., Fernández Ajó, A., Degrati, M. et al. Potential endocrine correlation with exposure to domoic acid in Southern Right Whale (Eubalaena australis) at the Península Valdés breeding ground. Oecologia 198, 21–34 (2022). https://doi.org/10.1007/s00442-021-05078-4
Derville, S., Barlow, D.R., Hayslip, C., Torres, L.G. (2022). Seasonal, annual, and decadal shifts of three baleen whale species relative to dynamic ocean conditions off Oregon, USA. Frontiers in Marine Science 9:868566.
Goetz, K.T., Stephenson, F., Hoskins, A., Bindoff, A.D., Orben, R.A., Sagar, P.M., Torres, L.G., et al. (2022). Data quality influences the predicted distribution and habitat of four southern-hemisphere Albatross species. Frontiers in Marine Science 9:782923. https://doi:10.3389/fmars.2022.782923
Gough, W.T., Cade, D.E., Czapanskiy, M.F., Potvin, J., Fish, F.E, Kahane-Rapport, S.R., Savoca, M.S., Bierlich, K.C., Johnston, D.W., Friedlaender, A.S., Szabo, A., Bejder, L., Goldbogen, J.A., (2022). Fast and Furious: Energetic tradeoffs and scaling of high-speed foraging in rorqual whales. Integrative Organismal Biology, 4(1) obac038, https://doi.org/10.1093/iob/obac038
Green, C-P., Ratcliffe, N., Mattern, T., …, Torres, L.G., Hindell, M.A. (2022). The role of allochrony in influencing interspecific differences in foraging distribution during the non-breeding season between two congeneric crested penguin species. PLoS ONE https://doi.org/10.1371/journal.pone.0262901
Hildebrand, L., Sullivan, F.A., Orben, R.A., Derville, S., Torres, L.G. (2022). Trade-offs in prey quantity and quality in gray whale foraging. Marine Ecology Progress Series 695:189-201. https://doi.org/10.3354/meps14115
Hunt, K.E., Buck, C.L., Ferguson, S.H., Fernández Ajó, A., Heide-Jørgensen, M.P., Matthews, C.J.D. (2002). Male Bowhead Whale Reproductive Histories Inferred from Baleen Testosterone and Stable Isotopes, Integrative Organismal Biology, 4: obac014, https://doi.org/10.1093/iob/obac014
Lemos, L.S., Haxel, J.H., Olsen, A., Burnett, J.D., Smith, A., Chandler, T.E., Nieukirk, S.L., Larson, S.E., Hunt, K.E., Torres, L.G. (2022). Effects of vessel traffic and ocean noise on gray whale stress hormones. Scientific Reports 12:18580.
Mouton, T.L., Stephenson, F., Torres, L.G., Rayment, W., Brough, T., McLean, M., Tonkin, J.D., Albouy, C., Leprieur, F. (2022). Spatial mismatch in diversity facets reveals contrasting protection for New Zealand’s cetacean biodiversity. Biological Conservation 267:109484. https://doi.org/10.1016/j.biocon.2022.109484
Nazario, E.C., Cade, D.E., Bierlich, K.C., Czapanskiy, M.F., Goldbogen, J.A., Kahane-Rapport, S.R., van der Hoop, J.M., San Luis, M.T., Friedlaender, A.S. (2022). Baleen whale inhalation variability revealed using animal-borne video tags. PeerJ 10:e13724 https://doi.org/10.7717/peerj.13724
Pallin, L., Bierlich, K.C., Durban, J. Fearnbach, H., Savenko, O., C.S. Baker, E. Bell, Double, M.C., de la Mare, W., Goldbogen, J., Johnston, D., Kellar, N., Nichols, R., Nowacek, D., Read, A.J., Steel, D., Friedlaender, A. (2022) Demography of an ice-obligate mysticete in a region of rapid environmental change. Royal Society of Open Science. 9(11). https://doi.org/10.1098/rsos.220724
Reisinger, R.R., Brooks, C.M., Raymond, B., …, Torres, L.G., et al. (2022). Predator-derived bioregions in the Southern Ocean: Characteristics, drivers and representation in marine protected areas. Biological Conservation 272:109630. https://doi.org/10.1016/j.biocon.2022.109630
Rivers, J.W., Guerrero J.B., Brodeur, R.D., …, Torres. L.G., Barth, J.A. (2022). Critical research needs for forage fish within inner shelf marine ecosystems. Fisheries 47(5):213-221. https://doi.org/10.1002/fsh.10725
Dr. KC Bierlich, Postdoctoral Scholar, OSU Department of Fisheries, Wildlife, & Conservation Sciences, Geospatial Ecology of Marine Megafauna (GEMM) Lab
Traveling across oceans takes a lot of energy. Most baleen whales use stored energy acquired on their summer foraging grounds to support the costs of migration to and reproduction on their winter breeding grounds. Since little, if any, feeding takes place during the migration and winter season, it is essential that baleen whales obtain enough food to increase their fat reserves to support reproduction. As such, baleen whales are voracious feeders, and they typically depart the foraging grounds much fatter than when they had arrived.
So, how fat do baleen whales typically get by the end of the foraging season, and how does this differ across reproductive classes, such as a juvenile female vs. a pregnant female? Understanding these questions is key for identifying what a typical “healthy” whale looks like, information which can then help scientists and managers monitor potential impacts from environmental and anthropogenic stressors. In this blog, I will discuss a recent publication in Frontiers in Marine Science (https://doi.org/10.3389/fmars.2022.1036860) that is from my PhD dissertation with the Duke University Marine Robotics and Remote Sensing (MaRRS) Lab, and also includes GEMM lab members Allison Dawn and Clara Bird. In this study, we analyzed how humpback whales (Megaptera novaeangliae) along the Western Antarctic Peninsula (WAP) increase their fat reserves throughout the austral summer foraging season (Bierlich et al., 2022). This work also helps provide insight to the GEMM Lab’s GRANITE project (Gray whale Response to Ambient Noise Informed by Technology and Ecology), where we are interested in how Pacific Coast Feeding Group (PCFG) gray whales increase their energy reserves in response to environmental variability and increasing human activities.
Eastern South Pacific humpback whales, identified as Stock G by the International Whaling Commission, travel over 16,000 km between summer foraging grounds along the WAP and winter breeding grounds between Ecuador and Costa Rica (Fig. 1). Like most baleen whales, Stock G humpback whales were heavily exploited by 20th century commercial whaling. Recent evidence suggests that this population is recovering, with an estimated increase in population size of ~7,000 individuals in 2000 to ~19,107 in 2020 (Johannessen et al., 2022).
However, there are long-term concerns for this population. The WAP is one of the fastest warming regions on the planet, and regional populations of krill, an important food source for humpback whales, have declined steeply over the past half-century. Additionally, the WAP has seen a rapid expansion of human activities, such as tourism and krill fishing. Specifically, the WAP has experienced an increase in tourism from a total of 6,700 visitors from 59 voyages in 1990 to 73,000 visitors from 408 voyages in 2020, which may be causing increased stress levels amongst Stock G (Pallin et al., 2022). Furthermore, the krill fishery has increased harvest activities in key foraging areas for humpback whales (Reisinger et al., 2022). Understanding how humpback whales increase their energy reserves over the course of the foraging season can help researchers establish a baseline to monitor future impacts from climate change and human activities. This work also provides an opportunity for comparisons to other baleen whale populations that are also exposed to multiple stressors, such as the PCFG gray whales off the Newport Coast who are constantly exposed to vessel traffic and at risk of entanglement from fishing gear.
Figure 1. The migration route of the Stock G humpback whale population. Figure adapted from Whales of the Antarctic Peninsula Report, WWF 2018.
To understand how humpback whales increase their energy reserves throughout the foraging season, we collected drone imagery of whales along the WAP between November and June, 2017-2019 (Fig. 2). We used these images to measure the length and width of the whale to estimate body condition, which represents an animal’s relative energy reserve and can reflect foraging success (see previous blog). We collected drone imagery from a combination of research stations (Palmer Station), research vessels (Laurence M. Gould), and tour ships (One Ocean Expeditions). We used several different drones types and accounted for measurement uncertainty associated with the camera, focal length lens, altitude, and altimeter (barometer/LiDAR) from each drone (see previous blog and Bierlich et al., 2021a, 2021b). We also took biopsy samples to identify the sex of each individual and to determine if females were pregnant or not.
Figure 2. Two humpbacks gracefully swimming in the chilly water along the Western Antarctic Peninsula. Photo taken by KC Bierlich & the Duke University Marine Robotics and Remote Sensing (MaRRS) Lab.
Our final dataset included body condition measurements for 228 total individuals. We found that body condition increased linearly between November and June for each reproductive class, which included calves, juvenile females, juvenile whales of unknown sex, lactating females, mature whales of unknown sex, and non-pregnant females (Fig. 3). This was an interesting finding because a recent publication analyzing tagged whales from the same population found that humpback whales have high foraging rates in early season that then significantly decrease by February and March (Nichols et al., 2022). So, despite these reduced foraging rates throughout the season, humpback whales continue to gain substantial mass into the late season. This continued increase in body condition implies a change in krill abundance and/or quality into the late season, which may compensate for the lower feeding rates. For example, krill density and biomass increases by over an order of magnitude across the season (Reiss et al., 2017) and their lipid content increases by ~4x (Hagen et al., 1996). Thus, humpback whales likely compensate for their lower feeding rates by feeding on denser and higher quality krill, ultimately increasing their efficiency in energy deposition.
Figure 3. Body condition, here measured as Body Area Index (BAI), increases linearly for each reproductive class across the austral summer foraging season (Nov – June) for humpback whales along the Western Antarctic Peninsula. The shading represents the uncertainty around the estimated relationship. The colors represent the month of data collection.
We found that body condition increase varied amongst reproductive classes. For example, lactating females had the poorest measures of body condition across the season, reflecting the high energetic demands of nursing their calves (Fig. 3). Conversely, non-pregnant females had the highest body condition at the start of the season compared to all the other classes, likely reflecting the energy saved and recovered by skipping breeding that year. Calves, juvenile whales, and mature whales all reached similar levels of body condition by the end of the season, though mature whales will likely invest most of their energy stores toward reproduction, whereas calves and juveniles likely invest toward growth. We also found a positive relationship between the total length of lactating females and their calves, suggesting that bigger moms have bigger calves (Fig. 4). A similar trend has also been observed in other baleen whale species including southern and North Atlantic right whales (Christiansen et al., 2018; Stewart et al., 2022).
Figure 4. Big mothers have big calves. Total length (TL) measurement between mother-calf pairs. The bars around each point represents the uncertainty (95% highest posterior density intervals). The colors represent the month of data collection. The blue line represents the best fit from a Deming regression, which incorporate measurement uncertainty in both the independent (mother’s TL) and dependent variable (calf’s TL).
The results from the humpback study provide insight for my current work exploring how PCFG gray whales increase their energy reserves in relation to environmental variability and increasing human activities. Over the past seven years, the GEMM Lab has been collecting drone images of PCFG gray whales off the coast of Oregon to measure their body condition (see this GRANITE Project blog). Many of the individuals we encounter are seen across years and throughout the foraging season, providing an opportunity to evaluate how an individual’s body condition is influenced by environmental variation, stress levels, maturity, and reproduction. For example, we had nine total body condition measurements of a female PCFG whale named “Sole”, who had a curvilinear increase in body condition throughout the summer foraging season – a rapid increase in early season that slowed as the season progressed (Fig. 5). This raises many questions for us: is this how most PCFG whales typically increase their body condition during the summer? Is this increase different for pregnant or lactating females? How is this increase impacted by environmental variability or anthropogenic stressors? Repeated measurements of individuals, in addition to Sole, in different reproductive classes across different years will help us determine what body condition is considered a healthy range for gray whales. This is particularly important for monitoring any potential health consequences from anthropogenic stressors, such as vessel noise and traffic (see recent blog by GEMM Lab alum Leila Lemos). We are currently analyzing body condition measurements between 2016 – 2022, so stay tuned for upcoming results!
Figure 6. Body condition, here measured as Body Area Index (BAI), increases curvilinearly for “Sole”, a mature female Pacific Coat Feeding Group gray whale, imaged nine times along the Oregon coast in 2021. The colors represent the month of data collection.
References
Bierlich, K. C., Hewitt, J., Bird, C. N., Schick, R. S., Friedlaender, A., Torres, L. G., et al. (2021a). Comparing Uncertainty Associated With 1-, 2-, and 3D Aerial Photogrammetry-Based Body Condition Measurements of Baleen Whales. Front. Mar. Sci. 8, 1–16. doi:10.3389/fmars.2021.749943.
Bierlich, K. C., Hewitt, J., Schick, R. S., Pallin, L., Dale, J., Friedlaender, A. S., et al. (2022). Seasonal gain in body condition of foraging humpback whales along the Western Antarctic Peninsula. Front. Mar. Sci. 9, 1–16. doi:10.3389/fmars.2022.1036860.
Bierlich, K., Schick, R., Hewitt, J., Dale, J., Goldbogen, J., Friedlaender, A., et al. (2021b). Bayesian approach for predicting photogrammetric uncertainty in morphometric measurements derived from drones. Mar. Ecol. Prog. Ser. 673, 193–210. doi:10.3354/meps13814.
Christiansen, F., Vivier, F., Charlton, C., Ward, R., Amerson, A., Burnell, S., et al. (2018). Maternal body size and condition determine calf growth rates in southern right whales. Mar. Ecol. Prog. Ser. 592, 267–281.
Hagen, W., Van Vleet, E. S., and Kattner, G. (1996). Seasonal lipid storage as overwintering strategy of Antarctic krill. Mar. Ecol. Prog. Ser. 134, 85–89. doi:10.3354/meps134085.
Johannessen, J. E. D., Biuw, M., Lindstrøm, U., Ollus, V. M. S., Martín López, L. M., Gkikopoulou, K. C., et al. (2022). Intra-season variations in distribution and abundance of humpback whales in the West Antarctic Peninsula using cruise vessels as opportunistic platforms. Ecol. Evol. 12, 1–13. doi:10.1002/ece3.8571.
Nichols, R., Cade, D. E., Kahane-Rapport, S., Goldbogen, J., Simpert, A., Nowacek, D., et al. (2022). Intra-seasonal variation in feeding rates and diel foraging behavior in a seasonally fasting mammal, the humpback whale. Open Sci. 9, 211674.
Pallin, L. J., Botero-Acosta, N., Steel, D., Baker, C. S., Casey, C., Costa, D. P., et al. (2022). Variation in blubber cortisol levels in a recovering humpback whale population inhabiting a rapidly changing environment. Sci. Rep. 12, 1–13. doi:10.1038/s41598-022-24704-6.
Reisinger, R., Trathan, P. N., Johnson, C. M., Joyce, T. W., Durban, J. W., Pitman, R. L., et al. (2022). Spatiotemporal overlap of baleen whales and krill fisheries in the Antarctic Peninsula region. Front. Mar. Sci. doi:doi: 10.3389/fmars.2022.914726.
Reiss, C. S., Cossio, A., Santora, J. A., Dietrich, K. S., Murray, A., Greg Mitchell, B., et al. (2017). Overwinter habitat selection by Antarctic krill under varying sea-ice conditions: Implications for top predators and fishery management. Mar. Ecol. Prog. Ser. 568, 1–16. doi:10.3354/meps12099.
Stewart, J. D., Durban, J. W., Europe, H., Fearnbach, H., Hamilton, P. K., Knowlton, A. R., et al. (2022). Larger females have more calves : influence of maternal body length on fecundity in North Atlantic right whales. Mar. Ecol. Prog. Ser. 689, 179–189. doi:10.3354/meps14040.
Allison Dawn, GEMM Lab Master’s student, OSU Department of Fisheries, Wildlife and Conservation Sciences, Geospatial Ecology of Marine Megafauna Lab
In last week’s blog, GEMM Lab postdoc Dawn Barlow discussed the uncertain future of upwelling response to climate change and how findings from the Shanks et al., 2009 “Paradigm lost? . . .” study implies that nearshore systems are likely decoupled from offshore upwelling processes. In a follow up to that paper, Shanks and co-authors found that the heterogeneity of coastline morphology (i.e., rocky or sandy) across several Oregon nearshore study sites explained zooplankton retention differences. Indeed, not only are there differences between offshore and nearshore upwelling dynamics, but there are also site-specific factors to consider when it comes to understanding changes in zooplankton retention along the Oregon coast (Shanks et. al, 2010).
I spend a lot of time thinking about what drives the variability in abundance and distribution of zooplankton prey of gray whales at our Port Orford study site over our long-term study period (2015-2022). For this blog, I want to briefly touch on a few interconnected dynamics in this nearshore PCFG gray whale foraging site that may affect their prey availability. Specifically, the interplay between shoreline topography, temperature, and habitat complexity.
Interplay between shoreline morphology and thermal fronts
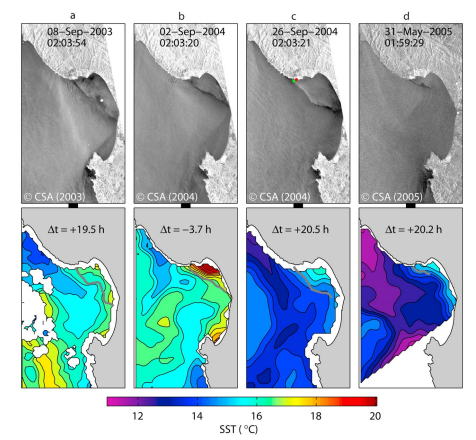
Several years before the “Paradigm lost? . . .” paper, Shanks led a study that investigated how holoplankton (a group of plankton in which mysids and amphipods belong) retention varies across three sites near Cape Arago and one site in Port Orford (Shanks et a., 2003). Here the authors noted that the Port Orford Bight causes an “upwelling shadow”, which is a region of water protected from upwelling-favorable winds. This shadow results in a small-scale warm water feature in the lee of the Port Orford Bight, which may serve as an important retention and recirculation zone for primary productivity (Graham et al., 1997). Discovering this “upwelling shadow” was not the intention of this paper, so the depth and breadth of the warm water plume within our study area has yet to be mapped (see Figure 1 for another West Coast example). However, “upwelling shadows” can act as convergence zones associated with greater zooplankton biomass (Morgan & Fisher, 2010; Ryan et al., 2010, Woodson et al., 2007) and thus may be an important feature to consider in our spatial analyses of drivers of prey availability to gray whales in our Port Orford study region.
Figure 1. Example of an “upwelling shadow” in Monterey Bay. Remotely sensed oceanographic convergent zones (top panel) and sea surface temperature (SST; lower panel) changes over time: a) Sept 8th 2003, b) Sept 2nd 2004, c) Sept 26th 2004, and d) May 31st 2005. Each time period demonstrates that the lee side of Point Año Nuevo is consistently warmer than the surrounding area. Figure source: Ryan et al., 2020.
Habitat complexity: rugosity and kelp
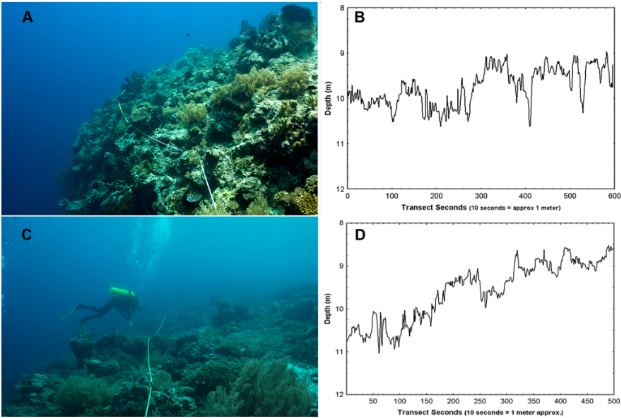
Not only could the unique shoreline in Port Orford contribute to zooplankton aggregations, but the subtidal marine environment is characterized by a range of unique habitat types: rocky reef, kelp beds, and sandy bottom habitat. Structural habitat complexity has been well documented in coral reef systems to be strongly linked with zooplankton prey availability and biodiversity of planktonic grazers (Richardson et al., 2017; Darling et al., 2017; Kuffner et al., 2007; Gladstone, 2007). Structural complexity can be measured in various ways, but quantifying rugosity (or surface “roughness”) is a widely accepted approach. However, only a few studies have demonstrated predator response to rugose habitats in Oregon nearshore rocky reefs (Rasmuson et al., 2021), and there is a dearth of knowledge linking rugosity to marine mammal predation (Cimino et al., 2020).
Rugosity serves several purposes in the marine environment. A rugose habitat creates micro-habitats for predator evasion, provides greater surface area for kelp recruitment (Cruz et al., 2014; Toohey et al., 2007), and generates turbulence that circulates vital micronutrients for filter-feeding zooplankton and ultimately drives foraging effort at fine scales (Ottersen et al., 2010).
Figure 2. Example images of habitat rugosity as measured by SCUBA transects. A) High-relief coral habitat with B) quantified depth (m) over transect seconds (10 seconds = 1 meter) and C) Low-relief coral habitat with D) quantified depth (m) over transect seconds (10 seconds = 1 meter). Figure source: Dustan et al., 2013.
Rugosity-generated turbidity might also help explain the zooplankton abundance variation we see across our sampling stations in Port Orford. In Lisa’s recent work showing evidence for a trophic cascade, a decline in bull kelp is overall strongly linked to a decline in zooplankton and gray whale foraging in Port Orford. However, there are sampling stations that, despite a significant loss in kelp, still had an abundance of mysids and hosted gray whale feeding activity in 2021 and 2022. Could this mean that those rocky reef stations, which are more rugose than the sandy bottom habitats, produced enough turbulence to support zooplankton prey? This hypothesis is consistent with several studies that found kelp abundance becomes less relevant with increasing habitat complexity (Trebilco et al., 2016; Anderson, 1994; Choat & Ayling et al., 1987; Larson, 1984).
There certainly may be other physical or oceanographic factors that create turbidity at these stations. However, as my REU mentee Zoe Sax has been investigating, we think that turbidity could be a metric of primary productivity, which supports zooplankton growth.
Figure 3 is a map of the average secchi disk values, which provide us with a measure of turbidity (the deeper we see the disk the less turbidity) in 2021 at our 12 sampling stations and their relation to kelp cover.
Last year was a low kelp year, but Mill Rocks still had a few bull kelp canopies. In Mill Rocks where there was rocky reef with kelp, we see secchi values were low (meaning turbidity was high). This is in contrast to the areas in the sandy bottom regions (no kelp, low rugosity: specifically MR16, TC4, TC6, and TC10) with the lightest values, meaning low turbidity.
Then, in Tichenor Cove specifically, we see that station TC1 has very little kelp but high turbidity; interestingly this site was a favored foraging spot for gray whales in 2021 and happens to be the closest station to the “upwelling shadow” I described earlier. I hope to conduct rugosity measurements in the near future so we can investigate these linkages further.
Figure 3. Map of two study sites, Tichenor Cove and Mill Rocks, with twelve sampling stations in Port Orford, OR and their average secchi disk values (meters) in 2021. Kelp abundance shown in light green polygons.
Conclusion
This focus on topography, temperature, and habitat complexity to understand zooplankton variation does not discount that upwelling is an important factor for Oregon nearshore ecology. Menge & Menge 2013 found that upwelling accounted for ~50% of ecological variance in rocky intertidal regions. However, these findings occurred across large spatial areas of about 100 km, while our TOPAZ sampling in Port Orford is on a much finer scale. Variation in ecological patterns at different, hierarchical scales are well-documented (Levin, 1992; Ottersen et al., 2010). Uncovering the “mosaic of processes”, as Shanks et al., 2003 describes, that drives nearshore zooplankton dynamics is equally challenging as it is fascinating, and I look forward to sharing more results from my Master’s work soon.
Did you enjoy this blog? Want to learn more about marine life, research and conservation? Subscribe to our blog and get weekly updates and more! Just add your name into the subscribe box below!
References
Anderson, T. W. (1994). Role of macroalgal structure in the distribution and abundance of a temperate reef fish. Marine ecology progress series. Oldendorf, 113(3), 279-290.
Choat, J. H., & Ayling, A. M. (1987). The relationship between habitat structure and fish faunas on New Zealand reefs. Journal of experimental marine biology and ecology, 110(3), 257-284.
Darling, E. S., Graham, N. A., Januchowski-Hartley, F. A., Nash, K. L., Pratchett, M. S., & Wilson, S. K. (2017). Relationships between structural complexity, coral traits, and reef fish assemblages. Coral Reefs, 36(2), 561-575.
Dustan, P., Doherty, O., & Pardede, S. (2013). Digital reef rugosity estimates coral reef habitat complexity. PloS one, 8(2), e57386.
Gladstone, W. (2007). Selection of a spawning aggregation site by Chromis hypsilepis (Pisces: Pomacentridae): habitat structure, transport potential, and food availability. Marine Ecology Progress Series, 351, 235-247.
Graham, W. M., & Largier, J. L. (1997). Upwelling shadows as nearshore retention sites: the example of northern Monterey Bay. Continental Shelf Research, 17(5), 509-532.
Kuffner, I. B., Brock, J. C., Grober-Dunsmore, R., Bonito, V. E., Hickey, T. D., & Wright, C. W. (2007). Relationships between reef fish communities and remotely sensed rugosity measurements in Biscayne National Park, Florida, USA. Environmental biology of fishes, 78(1), 71-82.
LARSON, R. J., & DeMARTINI, E. E. (1984). SAN ONOFRE, CALIFORNIA. Fishery Bulletin, 82(1-2), 37.
Levin, S. A. (1992). The problem of pattern and scale in ecology. Ecology, 73(6), 1943-1967.
Londoño Cruz et al. (2014) Londoño Cruz E, Mesa-Agudelo LAL, Arias-Galvez F, Herrera-Paz DL, Prado A, Cuellar LM, Cantera J. Distribution of macroinvertebrates on intertidal rocky shores in Gorgona Island, Colombia (Tropical Eastern Pacific) Revista de Biología Tropical. 2014;62(1):189–198. doi: 10.15517/rbt.v62i0.16275
Menge, B. A., & Menge, D. N. (2013). Dynamics of coastal meta-ecosystems: the intermittent upwelling hypothesis and a test in rocky intertidal regions. Ecological Monographs, 83(3), 283-310.
Morgan, S. G., & Fisher, J. L. (2010). Larval behavior regulates nearshore retention and offshore migration in an upwelling shadow and along the open coast. Marine Ecology Progress Series, 404, 109-126.
Ottersen, G., Kim, S., Huse, G., Polovina, J. J., & Stenseth, N. C. (2010). Major pathways by which climate may force marine fish populations. Journal of Marine Systems, 79(3-4), 343-360.
Rasmuson, L. K., Blume, M. T., & Rankin, P. S. (2021). Habitat use and activity patterns of female deacon rockfish (Sebastes diaconus) at seasonal scales and in response to episodic hypoxia. Environmental Biology of Fishes, 104(5), 535-553.
Richardson, L. E., Graham, N. A., Pratchett, M. S., & Hoey, A. S. (2017). Structural complexity mediates functional structure of reef fish assemblages among coral habitats. Environmental Biology of Fishes, 100(3), 193-207.
Ryan, J. P., Fischer, A. M., Kudela, R. M., McManus, M. A., Myers, J. S., Paduan, J. D., … & Zhang, Y. (2010). Recurrent frontal slicks of a coastal ocean upwelling shadow. Journal of Geophysical Research: Oceans, 115(C12).
Shanks, A. L., McCulloch, A., & Miller, J. (2003). Topographically generated fronts, very nearshore oceanography and the distribution of larval invertebrates and holoplankters. Journal of Plankton Research, 25(10), 1251-1277.
Shanks, A. L., & Shearman, R. K. (2009). Paradigm lost? Cross-shelf distributions of intertidal invertebrate larvae are unaffected by upwelling or downwelling. Marine Ecology Progress Series, 385, 189-204.
Shanks, A. L., Morgan, S. G., MacMahan, J., & Reniers, A. J. (2010). Surf zone physical and morphological regime as determinants of temporal and spatial variation in larval recruitment. Journal of Experimental Marine Biology and Ecology, 392(1-2), 140-150.
Toohey, B. D., Kendrick, G. A., & Harvey, E. S. (2007). Disturbance and reef topography maintain high local diversity in Ecklonia radiata kelp forests. Oikos, 116(10), 1618-1630.
Trebilco, R., Dulvy, N. K., Stewart, H., & Salomon, A. K. (2015). The role of habitat complexity in shaping the size structure of a temperate reef fish community. Marine Ecology Progress Series, 532, 197-211.
Woodson, C. B., Eerkes-Medrano, D. I., Flores-Morales, A., Foley, M. M., Henkel, S. K., Hessing-Lewis, M., … & Washburn, L. (2007). Local diurnal upwelling driven by sea breezes in northern Monterey Bay. Continental Shelf Research, 27(18), 2289-2302.
Morgan O’Rourke-Liggett, Graduate Student, OSU Department of Fisheries, Wildlife, and Conservation Sciences, Geospatial Ecology of Marine Megafauna Lab
October is LGBTQIA2S+ (Lesbian, Gay, Bisexual, Transgender, Intersex, Asexual, Aromatic, Agender, Two-Spirit, plus) History Month in the United States. As a marine biologist and member of the LGBTQIA2S+ community, I publicly came out in 2016. Since then, I have been navigating coming out in the workplace. As a graduate student, I’m using this time to practice being an “out” marine biologist.
OutInSTEM, a student organization at Oregon State University (OSU), supports LGBTQIA2S+ students in science, technology, engineering, and mathematics (STEM). It provides mentorship and connection with faculty and other students in the LGBTQIA2S+ community. Another goal is to increase visibility in the profession and foster confidence in students as they continue their professional careers. Other initiatives like OutInSTEM exist in many forms across agencies and countries.
Within the National Oceanographic and Atmospheric Administration (NOAA), the National Marine Sanctuary System created the initiative #PrideInTheOcean to celebrate both Ocean Month and LGBTQIA2S+ Pride Month, which both occur in June in the United States. This program partners with Pride Outside, a group connecting the LGBTQIA2S+ community through outdoor activities.
Some notable LGBTQIA2S+ scientists in marine studies are members and alumni of the Marine Mammal Institute at OSU. One is Dominique Kone (He/Him) who is now a marine ecologist and science officer at the California Ocean Science Trust. He is a graduate of OSU’s Marine Mammal Institute and the GEMM laboratory. Dominique wrote about his story here on Ocean Wise. Another is Dr. Daniel Palacios (He/Him), Endowed Associate Professor in Whale Habitats and lead of the Whale Habitat, Ecology, and Telemetry laboratory (WHET Lab) at OSU’s Marine Mammal Institute. Read Daniel’s story here on 500 Queer Scientists.
Visibility and representation are critical for multiple reasons. One is creating an atmosphere where LGBTQIA2S+ members feel validated in their experiences, allowing them to express their opinions, and recognize their contributions. Without the stress of facing potential harassment in the workplace, we can be our genuine selves leading to a healthier work environment, increased engagement, and better results.
Not everyone can be “out” in all aspects of their life. Some may be out publicly, but not at work; only out to select friends, etc. If it’s not safe (financially, physically, etc.), some people are never able to come out. Personal safety usually drives this decision. Some don’t want to expose aspects of their personal life in the workplace. Others hide it until after they have been hired or passed the probation period. Some never share due to fear of reprisal, such as being passed over for a promotion.
Despite the presence of state and federal anti-discrimination policies, micro and macro-aggressions occur in the workplace, such as transgender people having to fight for appropriate housing assignments. As a fisheries biological technician in Alaska, I was moved around several times as they had never dealt with a non-binary, transmasculine professional in their dorm rooms. I was forced to move three times and was frequently misgendered and deadnamed (deadnaming is calling a transgender person by an incorrect name, often their birth name and no longer use upon transitioning). It was a difficult situation and negatively affected my personal and work experience. I felt demoralized, disheartened, and depressed. I lost my respect for the agency and my long-standing dream of working in Alaska.
To avoid repeating my experience in Alaska, perhaps we can think critically about our labs and workspaces. The following is a non-exhaustive list of things to consider when including and thinking about LGBTQIA2S+ co-workers:
How are transgender and other gender-diverse co-workers treated?
Does your place of work have gender-inclusive restrooms on every floor of the building?
Are dorms or berths separated by binary gender?
Do the men’s restrooms have menstruation products and baby changing station(s)?
Does your field gear include sizing options for people who have non-conforming bodies?
If your lab does events including significant others, is the environment welcoming of same-gender spouses? How do you treat singles?
Are your field locations in places that could be dangerous for LGBTQIA2S+ and other marginalized identities threatened by extremists?
Do you have intake forms with gender or sex on them? Is it necessary?
Do you use gendered language when non-gendered language can be used? (Examples from Grammarly)
We work in an incredible profession with smart, kind, and fun co-workers. Let’s take action to ensure it is also safe and inclusive for all members.
If you wish to read other LGBTQIA2S+ scientists’ stories you can find them at https://500queerscientists.com/, https://ocean.org/blog/international-lgbtqia-stem-day-role-models-in-ocean-science/, and follow #PrideInSTEM , #LGBTQSTEMDay , and #PrideInTheOcean on social media. The first four articles in the reference section for this blog contain other peer-reviewed studies and testimonials about the importance of LGBTQIA2S+ representation in the workplace and fields ranging from geosciences to sports media.
Did you enjoy this blog? Want to learn more about marine life, research, and conservation? Subscribe to our blog and get a weekly message when we post a new blog. Just add your name and email to the subscribe box below!
References
Fisher, Kathleen Quardokus, et al. “Developing scientists as champions of diversity to transform the geosciences.” Journal of Geoscience Education 67.4 (2019): 459-471.
Johns, Nikara. “Pride Month: Nike’s Jarvis Sam on the Importance of Queer & Black Representation in the Workplace.” 18 June 2021. Footwear News.
Kilicaslan, Jan and Melissa Petrakis. “Heteronormative models of health-care delivery: investigating staff knowledge and confidence to meet the needs of LGBTIQ+ people.” Social Work in Health Care 58.6 (2019): 612-632.
Magrath, Rory. “”Progress…Slowly, but Surely”: The Sports Media Workplace, Gay Sports Journalists, and LGBT Media Representation in Sport.” Journalism Studies 21.2 (2020): 2545-270.
Palacios, Daniel. Daniel Palacios. 2022. https://500queerscientists.com/daniel-palacios/
Robinson, Chloe. International LGBTQIA2S+ STEM Day: Role Models in Ocean Science. 18 November 2021. Webpage. https://ocean.org/blog/international-lgbtqia-stem-day-role-models-in-ocean-science/
Imogen Lucciano, Graduate student, OSU Department of Fisheries, Wildlife, & Conservation Sciences, Geospatial Ecology of Marine Megafauna Lab.
Fin whales. Photo credit: https://www.futurismo.pt/blog/wildlife/is-the-fin-whale-endangered/.
One year ago, I packed up my 11-year-old daughter, Mavis (for the purposes of this blog, I’ll refer to her as “my sidekick”), our two dogs, and all our books and we moved to Oregon. I was thrilled to arrive and begin my graduate studies in cetacean ecology and bioacoutics with the GEMM lab and the Marine Mammal Institute. It has not been an easy set of tasks to achieve high standards in graduate school while maintaining a constant presence as a single mother, but I am honestly having the time of my life. I am involved in an amazing graduate program and I get to do it with my sidekick cheering me on and making my life feel very whole. This is why I am excited to write this blog reporting on the progression of my thesis and the incredible animals that I have the pleasure of studying: the fin whale.
Fin whales (Balaenoptera physalus) are the second largest cetacean on the planet and are present in nearly all temperate and polar oceanic regions of the world (1). For my master’s thesis, I will focus solely on the fin whales within a detectable range of our team’s research area off the Oregon coast. In the Northern Hemisphere, fin whales are known to grow up to 23 meters in length and weigh up to 40-50 metric tons (2). They have a slender profile and can be further identified by their hook-shaped dorsal fin in addition to a V-shape on their back referred to as a “chevron” (Fig. 1). Fin whales are a baleen whale in the rorqual family, which have adapted lunge feeding as their primary foraging method (3). This species of whales is also classified as endangered (1), making them a key focal species for research in our modern times of shifting conditions in ocean environments.
Although I am working to correlate the acoustic detections of fin whales across space and time with environmental drivers (like temperature and chlorophyll concentration), as an aspiring cetacean bioacoustician, one of my other burning related questions is: How can fin whale vocalizations be utilized to differentiate populations across the oceans? Perhaps my analysis of fin whales off the Oregon coast can contribute to the pool of researchers studying this species worldwide to help understand drivers of fin whale vocalization variability.
Fin whales can travel great distances, yet their unique vocal renditions of repetitive pulse calls at either a 20 Hz or 40 Hz frequency have geographic patterns (4). These renditions are stereotyped by inter-pulse interval (IPI), which is the rate at which the pulses are detected (5). What’s even more interesting is that unlike many other large baleen whale species, there is little evidence of seasonal behavior and vocalization patterns (5) (Figs. 2 & 3). This suggests that fin whales might not make repetitive annual migrations to accommodate foraging and reproduction. Are these animals prey driven with exemplary senses for finding prey over incredibly large distances in the ocean? Are fin whales consistently present off the Oregon coast? What are their names? Bob, Lucinda, Frederick? There is much to ponder here.
Figure 2. Fin whale 20 Hz calls patterns off the coast of Hawaii, showing a unique A and B call rendition with an IPI of ~ “`25 seconds (6). Figure 3. Fin whale 20 Hz calls identified in the Northeastern Pacific with varying observable patterns and IPI between the years 2003 – 2013 (7).
I was less than a month into this work when my sidekick ended up spending an entire week with us in the lab because the counselors at her summer camp all caught COVID-19. My sidekick is a dedicated book worm and had no problem keeping herself busy while we all worked, however, she is young and vivacious and so she would often share her music and jokes with the group. I recall (with an uncontrollable smirk on my face) one of her songs called the “Oof” song (Video 1), that is literally a repetitive beat with the onomatopoeia, “oof” being played over and over again. When it started playing I looked up from my computer to see a row of researchers sitting next to Mavis all bobbing their heads to the repetitive tone of “oof”, a tone that hilariously reminded us of a sped-up version of the repetitive pulse of fin whale song. From that point on, “oof” has involuntarily become a part of our language among this group of acousticians.
Video 1. The “oof song”, that was played by Mavis in the lab this past summer. The tones resemble a sped-up version of fin whale song.
The summer blazed by, Fall is here, and my sidekick and I are back in Oregon. I am in the process of organizing our collected HALO data to accommodate analysis of baleen whales, including fin whales. At this point I am already able to see fin whale calls in our data (Fig. 4). Subsequently, I will spend the next few months analyzing these data to determine the patterns of fin whale calls over time at our three observation sites (on the shelf, the shelf edge, and off the shelf). Within this analysis I will also look to define the vocal repertoire of fin whales over our six-month study period, which will allow me to report on the frequency where they are primarily detected and the IPI with which the pulses occur.
Figure 4. Spectrograms of fin whale calls in the October 2021 – June 2022 HALO acoustic dataset.
Moving forward, the HALO team will continuously retrieve and replace the three hydrophones to collect our acoustic data, returning a rich long-term dataset of the study area. I am eager to learn whether the fin whale IPI will remain the same in this location or show changes according to shifts in upwelling or seasonally, assuming they remain in the Northern California Current and do not migrate away. I will continue to assess the acoustic patterns of fin whales over the next year to describe their distribution patterns. All the while with the “oof” song stuck in my head and with my vivacious book worm head banging in the background.
Did you enjoy this blog? Want to learn more about marine life, research, and conservation? Subscribe to our blog and get a weekly message when we post a new blog. Just add your name and email into the subscribe box below.
(2) Aguilar, A. & Garcia-Vernet, R. 2018. Encyclopedia of Marine Mammals, Third Edition: Fin Whale, Balaenoptera physalus, Pg 369-371. Academic Press, ISBN 978-0-12-804327-1.
(5) Morano, J. et al. 2012. Seasonal and geographical patterns of fin whale song in the western North Atlantic Ocean. The Journal of the Acoustical Society of America, 132 (1207): 1207-1212. https://doi.org/10.1121/1.4730890.
(6) Helble, T. et al. 2020. Fin whale song patterns shift over time in the central North Pacific. Frontiers of Marine Science, 2 (Marine Megafauna). https://doi.org/10.3389/fmars.2020.587110.
(7) Weirathmueller, M. et al. 2017. Spatial and temporal trends in fin whale vocalizations recorded in the NE Pacific Ocean between 2003-2013. Plos ONE, 12 (10): e0186127. https://doi.org/10.1371/journal.pone.0186127.
It’s hard to believe that it’s already been four and half months since we started the field season (check out Lisa’s blog for a recap of where we began), but as of this weekend the GRANITE project’s 8th field season has officially ended! As the gray whales wrap up their foraging season and start heading south for the winter, it’s time for us to put our gear into storage, settle into a new academic year, and start processing the data we spent so much time collecting.
The field season can be quite an intense time (40 days equaling over 255 hours on the water!), so we often don’t take a moment to reflect until the end. But this season has been nothing short of remarkable. As you may remember from past blogs, the past couple years (2020-21) have been a bit concerning, with lower whale numbers than previously observed. Since many of us started working on the project during this time, most of us were expecting another similar season. But we were wrong in the best way. From the very first day, we saw more whales than in previous years and we identified whales from our catalog that we hadn’t seen in several years.
Image 1: Collage of photos from our field season.
We identified friends – old and new!
This season we had 224 sightings of 63 individual whales. Of those 63, 51 were whales from our catalog (meaning we have seen them in a previous season). Of these 51 known whales, we only saw 20 of them last year! This observation brings up interesting questions such as, where did most of these whales forage last year? Why did they return to this area this year? And, the classic end of season question, what’s going to happen next year?
We also identified 12 whales that were not in our catalog, making them new to the GEMM lab. Two of our new whales are extra exciting because they are not just new to us but new to the population; we saw two calves this year! We were fortunate enough to observe two mom-calf pairs in July. One pair was of a “new” mom in our catalog and her calf. We nicknamed this calf “Roly-poly” because when we found this mom-calf pair, we recorded some incredible drone footage of “roly-poly” continuously performing body rolls while their mom was feeding nearby (video 1).
Video 1: “Roly-poly” body rolling while their mom headstands. NOAA/NMFS permit #21678.
The other pair includes a known GEMM lab whale, Luna, and her calf (currently nicknamed “Lunita”). We recently found “Lunita” feeding on their own in early October (Image 2), meaning that they are now independent from its mom (for more on mom-calf behavior check out Celest’s recent blog). We’ll definitely be on the lookout for Roly-Poly and Lunita next year!
Image 2: (left) drone image of Luna and Lunita together in July and (right) drone image of Lunita on their own in October. NOAA/NMFS permit #21678.
We flew, we scooped, we collected heaps of data!
From our previous blogs you probably know that in addition to photo-ID images, our other two most important forms of data collection are drone flights (for body condition and behavior data) and fecal samples (for hormone analysis). And this season was a success for both!
We conducted 124 flights over 49 individual whales. The star of these flights was a local favorite Scarlett who we flew over 18 different times. These repeat samples are crucial data for us because we use them to gain insight into how an individual’s body condition changes throughout the season. We also recorded loads of behavior data, collecting footage of different foraging tactics like headstanding, side-swimming, and surfacing feeding on porcelain crab larvae (video 2)!
Video 2: Two whales surface feeding on porcelain crab larvae. NOAA/NMFS permit #21678.
We also collected 61 fecal samples from 26 individual whales (Image 3). The stars of that dataset were Soléand Peak who tied with 7 samples each. These hard-earned samples provide invaluable insight into the physiology and stress levels of these individuals and are a crucial dataset for the project.
Image 3: Photos of fecal sample collection. Left – a very heavy sample, center: Lisa and Enrico after collecting the first fecal sample of the season, right: Clara and Lisa celebrating a good fecal sample collection.
On top of all that amazing data collection we also collected acoustic data with our hydrophones, prey data from net tows, and biologging data from our tagging efforts. Our hydrophones were in the water all summer recording the sounds that the whales are exposed to, and they were successfully recovered just a few weeks ago (Image 4)! We also conducted 69 net tows to sample the prey near where the whales were feeding and identify which prey the whales might be eating (Image 5). Lastly, we had two very successful tagging weeks during which we deployed (and recovered!) a total of 9 tags, which collected over 30 hours of data (Image 6; check out Kate’s blog for more on that).
Image 4 – Photos from hydrophone recovery.
Image 5: Photos from zooplankton sampling.
Image 6: Collage of photos from our two tagging efforts this season.
Final thoughts
All in all, it’s been an incredible season. We’ve seen the return of old friends, collected lots of awesome data, and had some record-breaking days (28 whales in one day!). As we look toward the analysis phase of the year, we’re excited to dig into our eight-year dataset and work to understand what might explain the increase in whales this year.
To end on a personal note, looking through photos to put in this blog was the loveliest trip down memory lane (even though it only ended a few days ago) – I am so honored and proud to be a part of this team. The work we do is hard; we spend long hours on a small boat together and it can be a bit grueling at times. But, when I think back on this season, my first thoughts are not of the times I felt exhausted or grumpy, but of all the joy we felt together. From the incredible whale encounters to the revitalizing snacks to the off-key sing alongs, there is no other team I would rather do this work with, and I so look forward to seeing what next season brings. Stay tuned for more updates from team GRANITE!
Did you enjoy this blog? Want to learn more about marine life, research, and conservation? Subscribe to our blog and get a weekly alert when we make a new post! Just add your name into the subscribe box below!