Learning from teaching

Clara Bird, PhD Student, OSU Department of Fisheries and Wildlife, Geospatial Ecology of Marine Megafauna Lab

Based on my undergrad experience I assumed that most teaching in grad school would be as a teaching assistant, and this would consist of teaching labs, grading, leading office hours, etc. However, now that I’m in graduate school, I realize that there are many different forms of teaching as a graduate student. This summer I worked as an instructor for an e-campus course, which mainly involved grading and mentoring students as they developed their own projects. Yet, this past week I was a guest teacher for Physiology and Behavior of Marine Megafauna, which was a bit more involved.

I taught a whale photogrammetry lab that I originally developed as a workshop with a friend and former lab mate, KC Bierlich, at the Duke University Marine Robotics and Remote Sensing (MaRRS) lab when I worked there. Similar to Leila’s work, we were using photogrammetry to measure whales and assess their body condition. Measuring a whale is a deceivingly simple task that gets complicated when taking into account all the sources of error that might affect measurement accuracy. It is important to understand the different sources of error so that we are sure that our results are due to actual differences between whales instead of differences in errors.

Error can come from distortion due to the camera lens, inaccurate altitude measurements from the altimeter, the whale being arched, or from the measurement process. When we draw a line on the image to make a measurement (Image 1), measurement process errors come from the line being drawn incorrectly. This potential human error can effect results, especially if the measurer is inexperienced or rushing. The quality of the image also has an effect here. If there is glare, wake, blow or refraction covering or distorting the measurer’s view of the full body of the whale then the measurer has to estimate where to begin and end the line. This estimation is subjective and, therefore, a source of error. We used the workshop as an opportunity to study these measurement process errors because we could provide a dataset including images of varying qualities and collect data from different measurers.

Image 1. Screenshot of measuring the widths along a minke whale in MorphoMetriX. Source: https://github.com/wingtorres/morphometrix/blob/master/images/Picture4.png

This workshop started as a one-day lecture and lab that we designed for the summer drone course at the Duke Marine Lab. The idea was to simultaneously teach the students about photogrammetry and the methods we use, while also using all the students’ measurements to study the effect of human error and image quality on measurement accuracy. Given this one-day format, we ambitiously decided to teach and measure in the morning, compile and analyze the students’ measurements over lunch, and then present the results of our error analysis in the afternoon. To accomplish this, we prepared as much as we could and set up all the code for the analysis ahead of time. This preparation meant several days of non-stop working, discussing, and testing, all to anticipate any issues that might come up on the day of the class.  We used the measuring software MorphoMetriX (Torres & Bierlich, 2020) that was developed by KC and a fellow Duke Marine Lab grad student Walter Torres. MorphoMetriX was brand new at the time, and this newness of the software meant that we didn’t yet know all the issues that might come up and we did not have time to troubleshoot. We knew this meant that helping the students install the software might be a bit tricky and sure enough, all I remember from the beginning of that first lab is running around the room helping multiple people troubleshoot at the same time, using use all the programming knowledge I had to discover new solutions on the fly.

While troubleshooting on the fly can be stressful and overwhelming, I’ve come to appreciate it as good practice. Not only did we learn how to develop and teach a workshop, we also used what we had learned from all the troubleshooting to improve the software. I also used the code we developed for the analysis as the starting blocks for a software package I then wrote, CollatriX (Bird & Bierlich, 2020), as a follow up software to MorphoMetriX. Aside from the initial troubleshooting stress, the workshop was a success, and we were excited to have a dataset to study measurement process errors. Given that we already had all the materials for the workshop prepared, we decided to run a few more workshops to collect more data.

That brings me to my time at here at OSU. I left the Duke MaRRS lab to start graduate school shortly after we taught the workshop. Interested in running the workshop here, I reached out to a few different people. I first ran the workshop here as an event organized by the undergraduate club Ocean11 (Image 2). It was fun running the workshop a second time, as I used what I learned from the first round; I felt more confident, and I knew what the common issues would likely be and how to solve them. Sure enough, while there were still some troubleshooting issues, the process was smoother and I enjoyed teaching, getting to know OSU undergraduate students, and collecting more data for the project.

Image 2. Ocean11 students measuring during the workshop (Feb 7, 2020).
Image credit: Clara Bird

The next opportunity to run the lab came through Renee Albertson’s physiology and behavior of marine megafauna class, but during the COVID era this class had other challenges. While it’s easier to teach in person, this workshop was well suited to be converted to a remote activity because it only requires a computer, the data can be easily sent to the students, and screen sharing is an effective way to demonstrate how to measure. So, this photogrammetry module was a good fit for the marine megafauna class this term that has been fully remote due to COVID-19.  My first challenge was converting the workshop into a lab assignment with learning outcomes and analysis questions. The process also involved writing R code for the students to use and writing step-by-step instructions in a way that was clear and easy to understand. While stressful, I appreciated the process of developing the lab and these accompanying materials because, as you’ve probably heard from a teacher, a good test of your understanding of a concept is being able to teach it. I was also challenged to think of the best way to communicate and explain these concepts. I tried to think of a few different explanations, so that if a student did not understand it one way, I could offer an alternative that might work better. Similar to the preparation for the first workshop, I also prepared for troubleshooting the students’ issues with the software. However, unlike my previous experiences, this time I had to troubleshoot remotely.

After teaching this photogrammetry lab last week my respect for teachers who are teaching remotely has only increased. Helping students without being able to sit next to them and walk them through things on their computer is not easy. Not only that, in addition to the few virtual office hours I hosted, I was primarily troubleshooting over email, using screen shots from the students to try and figure out what was going on. It felt like the ultimate test of my programming knowledge and experience, having to draw from memories of past errors and solutions, and thinking of alternative solutions if the first one didn’t work. It was also an exercise in communication because programming can be daunting to many students; so, I worked to be encouraging and clearly communicate the instructions. All in all, I ended this week feeling exhausted but accomplished, proud of the students, and grateful for the reminder of how much you learn when you teach.

References

Bird, C. N., & Bierlich, K. (2020). CollatriX: A GUI to collate MorphoMetriX outputs. Journal of Open Source Software, 5(51), 2328. https://doi.org/10.21105/joss.02328

Torres, W., & Bierlich, K. (2020). MorphoMetriX: a photogrammetric measurement GUI for morphometric analysis of megafauna. Journal of Open Source Software, 5(45), 1825. https://doi.org/10.21105/joss.01825

Stories from a whale’s life: how whale photo-identification is an essential part of the whale physiology toolkit

By Alejandro Fernandez Ajo, PhD student at the Department of Biology, Northern Arizona University, Visiting scientist in the GEMM Lab working on the gray whale physiology and ecology project  

Two years ago, in August 2018, I came to Newport and visited the Hatfield Marine Science Center for the first time with an NSF/RCN-founded laboratory exchange with the GEMM Lab and met Dr. Leigh Torres. My goals during this exchange where to learn about non-invasive fieldwork techniques for studying free-range whales while interacting, exchanging ideas, and networking with the GEMM Lab members; also, to discuss some projects and thoughts for future collaborations with Dr. Torres. During those two weeks in Newport, I had the opportunity to help with field work on the project “Evaluation of gray whale ecology and physiology in response to variable ambient ocean noise conditions”, which aims to evaluate the hormonal variability and health of the gray whales that forage along the Oregon coast in the context of multiple stressors. I would return during the summers of 2019 and 2020 as a visiting scientist and research assistant to work on this project. This year the experience has been a bit different in terms of interactions with the HMSC community due to COVID-19; however, we were able to successfully start the field season in time and now we are wrapping up our second month of surveys with many new and interesting data gathered, and many new, unforgettable memories to be treasured. Working with these animals is incredibly fascinating because there are so many things we don´t know about them, and the questions can become both overwhelming and exciting.

An essential part of this project, and arguably any research project done with cetaceans, is the identification of individuals. Hence, considerable effort is expended each year attempting to photograph every gray whale possible within our study region and to identify each whale we encounter. The GEMM Lab maintains a catalog of the gray whales that visit the Oregon coast, a sub-population known as the Pacific Coast Feeding Group (PCFG). This catalog currently consists of 173 individuals. which we frequently compare with a larger catalog of gray whales that includes 2060 individuals observed since 1977 (Cascadia Research Collective). These methods allow us to know who is who among the whales we encounter each day at sea.

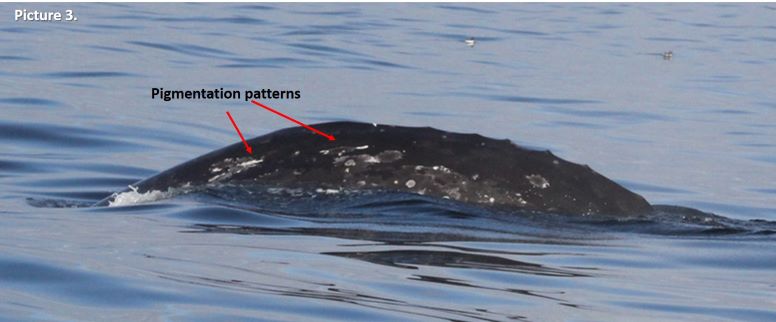
The different species of cetaceans can be individually identified by markings on their bodies, very much like fingerprints in humans. Some features on these animals are unique and conserved through life. For example, Southern and Northern right whales are identified by the callosity patters in their heads (Picture 1), while humpback whales are mostly identified individually by the shape and the patterns of black and white pigmentation on the underside of their fluke (Picture 2). Gray whales have very mottled skin coloration, so we use a combination of markings and features to identify individuals: pigmentation patterns, scars, shape and pigmentation of their fluke, and sometimes the shape of their knuckles, which are a series of “humps” that gray whales have instead of a dorsal fin on their back. It might sound very difficult to do, and it can be a tedious task, however as you train your eye it becomes easier, and features that at first seemed undistinguishable become recognizable and unique (Picture 3). As a reward, it is such a joy to find a match and recognize old friends when they arrive from their long journeys in the vast ocean each year to the Oregon coast.

The callosity pattern of a southern right whale. Photo by Alejandro Fernández Ajó – Instituto de Conservación de Ballenas.
Three different humpback whales with notably different pigmentation patterns on their flukes. Photographs captured under NOAA/NMFS permit #21678.
The gray whale “Knife” we have observed frequently this summer off the Oregon coast. Can you see how the right pigmentation pattern identified looks like a knife? Photograph captured under NOAA/NMFS permit #21678.

As a result of our photo-identification efforts and the high site-fidelity of the whales we study, the large majority of the gray whales we observe here in Oregon are known individually. For many whales, we also have detailed sightings records that can span years and decades, that document calving history, lactation, appearance of scars indicative of injury or entanglement, minimum age, sex, habitat-use patterns, behaviors, etc. Holding such detailed information of individual whales provides incredible contributions to our understanding of the basic patterns in life history of whales, such as reproduction rates, calving intervals, age of first reproduction, etc. Moreover, when these life history events are linked with physiological sample collection large steps can be made in the development and validation of physiological methods. Many endocrine assays currently in use for whales are based on non-traditional sample types including feces, respiratory vapor, and baleen, which have been validated using the catalogs of well-known individuals to verify that measured hormones reflect patterns expected for various physiological states. For example, we can compare endocrine data of confirmed pregnant females, known mature males, and known-injured whales to learn how whale physiological responses are different during different life history events (e.g., Burgess et al. 2017, 2018, Corkeron et al. 2017, Hunt et al. 2006, 2016, 2018, Lysiak et al. 2018, Rolland et al. 2005).

Here in Oregon we are learning from the lives of the gray whales we study, and here I want to share with you two of their stories, one happy and one not-so-happy.

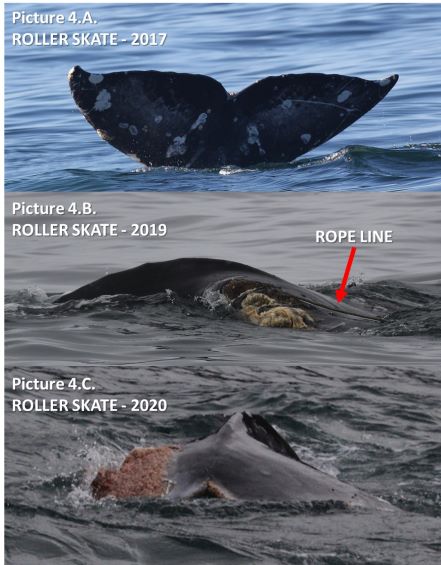
Let´s start with the not-so-happy story so we can end with some brighter news. On June 24 this year, we encountered a whale near Cape Foulweather, which is a very tricky area to work as there are many rocks and shallow water that make the sea conditions very choppy even with low swell. We started documenting the sighting as usual, taking pictures of the left side, the right side and ideally also the fluke of the whale. As we approached this whale, we started noting that something was wrong with its fluke. With the challenging sea conditions, it was not easy to approach the whale and the whale was not exposing its fluke when diving. When we put our drone up to collect photogrammetry and behavior data we gained a much better perspective. This whale has a bad injury on it fluke (Picture 4.C). On the boat we started making conjectures about the cause of this terrible injury that had basically amputate most of its left fluke lobe. Once back on shore, we sorted out the photos and compared the field images captured during the day with the photo-ID catalog and we made a match. This whale is known in our catalog as “ROLLER SKATE”, is a female, and was first sighted in 2015, so she is at least 5 years old today.

The story unfolded when we reviewed Roller Skate’s sighting history. Interestingly we observed this same whale in the same location last September 2019. Unfortunately, it was a very brief encounter but enough for photo documentation of the whale and an interesting observation. Here I quote the field notes that Dr. Torres wrote from this sighting: “September 6th, 2019. Sighting 9: Scattered whales feeding and/or traveling across area to north of Cape Foulweather. One whale had recently chopped fluke; tried to re-find to get better photos but could not (looking at photos now, this whale is clearly entangled in line!). Ceiling too low for UAS [drone flight].” (Picture 4.B).

Progressive photos of Roller Skate’s fluke. In 2017, her fluke was healthy (A). In 2019, we observed her fluke with a line entanglement and “chewed up” (B). In 2020, we have observed the resulting wound and healing process (C). Photographs captured under NOAA/NMFS permit #21678.

Roller skate’s story is an example of how essential is to keep an ID catalog. After a close-up examination of the 2019 picture, we can clearly see a rope entanglement (Picture 4.B). Photos from previous years show how beautiful and healthy her fluke was before this event (Picture 4.A). This event is heart breaking to witness, but this whale could be considered lucky because she was able to shed the gear and survive this entanglement, at least in the short term. Additionally, we can learn from Roller Skate’s misfortune to help us understand what the consequences of such an injury (stressor) may be on the physiology of a whale. We have been eager to collect a fecal sample from Roller Skate to analyze how her hormone levels compare to non-injured whales. Fortunately, we got lucky a couple weeks ago and collected this sample, so now we need to get in the lab and analyze the samples. But more questions remain: Will this injury impact her ability to reproduce? If so, for how long? And at a larger scale, what are the population consequences of such events? If we can understand the magnitude of lethal and sublethal human caused impacts on individual whales and their populations from events such as entanglements, we can develop better methods to mitigate and limit such hazards for whales in their environments.

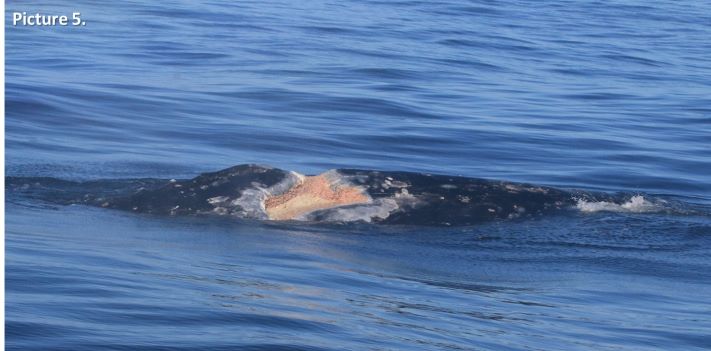
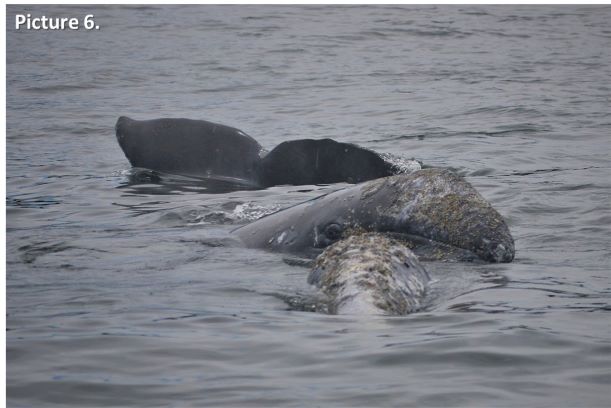
As I promised, there is also some good news to share. A very well-known PCFG whale, almost a celebrity I dear to say, is “Scarback”, or as we like to call her “Scarlett”. Scarlett is a female known since 1996, making her at least 24 years old, and she also has a very bad injury of unknown origin. Scarlett has a terrible scar on her back that is theorized to have been caused by an explosive harpoon, or maybe a bad ship-strike (Picture 5), but we really do not know. However, we do know she survived this injury and this year she brought a new calf into the population (Picture 6). This is the second calf we have documented from Scarlett, with her previous calf sighted during the 2016 field season and we call it “Brown”. Scarlett is an example of how resilient these amazing giants can be; however, it is likely that while she was recovering from this injury, she was unable to reproduce. How many calves from Scarlett did the PCFG population “lose” due to such a tragedy? We can´t know, but we are learning, and her story will also help us understand whale physiology as we will analyze her fecal hormones and body condition during pregnancy, lactation, and resting phases.

The scar on Scarlett’s back. This significant wound has an unknown origin. Photograph captured under NOAA/NMFS permit #21678.

Scarlett is a survivor. We need to recognize that we are sharing the ocean with different forms of life. We need to acknowledge their existence and understand how our use of the oceans is affecting them, and, more importantly, work toward improving their conditions. I hope that with our research we highlight and communicate how amazing are these animals, and how important are they for marine ecosystems. And ultimately, I hope our work helps minimize the impacts that affect other forms of ocean life that coexist with us, both above and below the surface.

The well-known gray whale “Scarlett” surfaces under her calf while it checks out the GEMM Lab field team. Photo by Alejandro Fernandez Ajo taken under NOAA/NMFS permit #21678.

References:

Burgess, E., Hunt, K. E., Kraus, S. D. and Rolland, R. M. (2016). Get the most out of blow hormones: validation of sampling materials, field storage and extraction techniques for whale respiratory vapor samples. Conservation Physiology, 4, cow024.

Burgess, E. A., Hunt, K. E., Kraus, S. D. and Rolland, R. M. (2018). Quantifying hormones in exhaled breath for physiological assessment of large whales at sea. Scientific Reports, 8, 10031.

Corkeron, P. J., Rolland, R. M., Hunt, K. E. and Kraus, S. D. (2017). A right whale PooTree: Fecal hormones and classification trees identify reproductive states in North Atlantic right whales (Eubalaena glacialis). Conservation Physiology, 5, cox006. DOI: 10.1093/conphys/cox006.

Hunt, K., Lysiak, N., Moore, M. and Rolland, R. (2017). Multi-year longitudinal profiles of cortisol and corticosterone recovered from baleen of North Atlantic right whales (Eubalaena glacialis). General and Comparative Endocrinology, 254, 50-59. DOI: 10.1016/j.ygcen.2017.09.009.

Hunt, K., Lysiak, N. S. J., Matthews, C. J. D., et al. (2018). Multi-year patterns in testosterone, cortisol and corticosterone in baleen from adult males of three whale species. Conservation Physiology, 6, coy049. DOI: 10.1093/conphys/coy049.

Hunt, K. E., Rolland, R. M., Kraus, S. D. and Wasser, S. K. (2006). Analysis of fecal glucocorticoids in the North Atlantic Right Whale (Eubalaena glacialis). General and Comparative Endocrinology, 148, 260-272.

Lysiak, N., Trumble, S., Knowlton, A. and Moore, M. (2018). Characterizing the duration and severity of fishing gear entanglement on a North Atlantic right whale (Eubalaena glacialis) using stable isotopes, steroid and thyroid hormones in baleen. Frontiers in Marine Science. DOI: 10.3389/fmars.2018.00168.

Rolland, R. M., Hunt, K. E., Kraus, S. D. and Wasser, S. K. (2005). Assessing reproductive status of right whales (Eubalaena glacialis) using fecal hormone metabolites. General and Comparative Endocrinology, 142, 308-317.

Dual cameras provide bigger picture

By Hunter Warick, Research Technician, Geospatial Ecology of Marine Megafauna Lab, Marine Mammal Institute

When monitoring the health of a capital breeding species, such as whales that store energy to support reproduction costs, it is important to understand what processes and factors drive the status of their body condition. Information gained will allow for better insight into their cost of reproduction and overall life history strategies.

For the past four years the GEMM Lab has utilized the perspective that Unoccupied Aerial Systems (UAS; or ‘drones’) provide for observations of marine mammals. This aerial perspective has documented gray whale behavior such as jaw snapping, drooling mud, and headstands, all of which shows or suggest foraging (Torres et al. 2018). However, UAS is limited to a bird’s eye view, allowing us to see WHAT whales are doing, but limited information about the reasons WHY. To overcome this hurdle, Leigh Torres and team have equipped their marine mammal research utility belts with the use of GoPro cameras. They developed a technique known as the “GoPro drop” where a GoPro camera mounted to a weighted pole is lowered off the side of the research vessel in waters < 20 m deep via a line to record video data. This technique allows the team to obtain fine-scale habitat and prey variation information, like what the whale experiences. Along with the context provided by the UAS, this dual camera perspective allows for deeper insight into gray whale foraging strategies and efficiency. Torres’s GoPro data analysis protocol examines kelp density, kelp health, benthic substrate, rock fish density, and mysid density. These characteristics are graded along a scale (Figure 1), allowing for relative comparisons of habitat and prey availability between where whales spend time and forage. These GoPro drops will also help create a fine-scale benthic habitat map of the Newport field area. So, why are these data on gray whale habitat and prey important to understand?

Figure 1. The top row shows varying degrees of mysid density (low to high, left to right). Middle row illustrates different types of substrate you might encounter (reef, sandy, boulders; left to right). Bottom row shows the different levels of kelp health (poor, medium, good).

The foraging grounds are the first step in the life history domino chain reaction for many rorqual whales; if this step doesn’t go off cleanly then everything else fails to fall into place. Gray whales partake on a 15,000-20,000 km (round trip) migration, which is the longest of any known mammal (Swartz 1986). During this migration, whales spend around three months fasting in their breeding grounds (Highsmith & Coyle 1992), living only off the energy stores that they accumulated in their feeding grounds (Næss et al. 1998). These extreme conditions of existence for gray whales drive the need to be a successful forager and is why it is so crucial for them to forage in high prey density areas (Newell, C. 2009).

Mysids are a critical part of the gray whale diet in Oregon waters (Newell, C. 2009; Sullivan, F. 2017) and mysids have strong predator-prey relationships with both top-down and bottom-up control (Dunham & Duffus 2001; Newell & Cowles 2006). This unique tie illustrates the great dependency that gray whales have on mysids, further showing the benefit to looking at the density of mysids where gray whales are seen foraging. The quality of mysids may also be as important as quantity; with higher water temperatures resulting in lower lipid content in mysids (Mauchline 1980), suggesting density might not be the only factor for determining efficient whale foraging. The overall goal of gray whales on their foraging grounds is to get as fat as possible in order to reproduce as often as possible. But, this isn’t always as easy as it sounds. Gray whales typically have a two-year breeding interval but can be anywhere from 1-4 years (Blokhin 1984). The longer time it takes to build up adequate energy stores to support reproduction costs, the longer it will take to breed successfully. Building back up these energy stores can prove to be difficult, especially for lactating females (Figure 2).

Being able to track the health and behavior of gray whales on an individual level, including comparisons between variation in body condition, foraging behavior, and fine scale information on benthic communities gained through the use of GoPros, can provide a better understanding of the driving factors and impacts on their health and population trends (Figure 3).


Figure 3. A compilation of video clips captured by the GEMM Lab during their research on gray whale ecology and physiology off Newport, Oregon using Unoccupied Aerial Systems (UAS, or “drones”) and GoPro cameras. UAS are used to observe gray whale behavior and conduct photogrammetry assessment of body condition. GoPro camera drops assess the benthic habitat and prey density across the study region, with a couple chance encounters of whales. Research is conducted under NOAA/NMFS permit # 21678.

Applying novel methods in conservation physiology to understand cases of large whale mortalities

By Alejandro Fernánez Ajó, PhD student at NAU and GEMM Lab research technician

Although commercial whaling is currently banned and several whale populations show evidence of recovery, today´s whales are exposed to a variety of other human stressors (e.g., entanglement in fishing gear, vessel strikes, shipping noise, climate change, etc.; reviewed in Hunt et al., 2017a). The recovery and conservation of large whale populations is particularly important to the oceanic environment due to their key ecological role and unique biological traits, including their large body size, long lifespan and sizable home ranges (Magera et al., 2013; Atkinson et al., 2015; Thomas and Reeves, 2015). Thus, scientists must develop novel tools to overcome the challenges of studying whale physiology in order to distinguish the relative importance of the different impacts and guide conservation actions accordingly (Ayres et al., 2012; Hunt et al., 2013).

To this end, baleen hormone analysis represents a powerful tool for retrospective assessment of patterns in whale physiology (Hunt et al., 2014, 2016, 2017a, 2017b, 2018; Lysiak et. al., 2018; Fernández Ajó et al., 2018; Rolland et al., 2019). Moreover, hormonal panels, which include multiple hormones, are helping to better clarify and distinguish between the physiological effects of different sources of anthropogenic and environmental stressors (Ayres et al., 2012; Wasser et al., 2017; Lysiak et al., 2018; Romero et al., 2015).

What is Baleen? Baleen is a stratified epithelial tissue consisting of long, fringed plates that grow downward from the upper jaw, which collectively form the whale´s filter-feeding apparatus (Figure 1). This tissue accumulates hormones as it grows. Hormones are deposited in a linear fashion with time so that a single plate of baleen allows retrospective assessment and evaluation of a whales’ physiological condition, and in calves baleen provides a record of the entire lifespan including part of their gestation. Baleen samples are also readily accessible and routinely collected during necropsy along with other samples and relevant information.

Figure 1: Top: A baleen plate from a southern right whale calf (Source: Fernández Ajó et al. 2018). Bottom: A southern right whale with mouth open exposing its baleen (photo credit: Stephen Johnson).

Why are the Southern Right Whales calves (SRW) dying in Patagonia?

I am a Fulbright Ph.D. student in the Buck Laboratory  at Northern Arizona University since Fall 2017, a researcher with the Whale Conservation Institute of Argentina (Instituto de Conservación de Ballenas) and Field Technician for the GEMM Lab over the summer. I focus my research on the application and development of novel methods in conservation physiology to improve our understanding of how physiological parameters are affected by human pressures that impact large whales and marine mammals. I am especially interested in understanding the underlaying causes of large whale mortalities with the aim of preventing their occurrence when possible. In particular, for my Ph.D. dissertation, I am studying a die-off case of Southern Right Whale (SRW) calves, Eubalaena australis, off Peninsula Valdés (PV) in Patagonia-Argentina (Figure 2).

Prior to 2000, annual calf mortality at PV was considered normal and tracked the population growth rate (Rowntree et al., 2013). However, between 2007 and 2013, 558 whales died, including 513 newborn calves (Sironi et al., 2018). Average total whale deaths per year increased tenfold, from 8.2 in 1993-2002 to 80 in 2007-2013. These mortality levels have never before been observed for the species or any other population of whales (Thomas et al., 2013, Sironi et al., 2018).


Figure 2: Study area, the red dots along the shoreline indicate the location where the whales were found stranded at Península Valdés in 2018 (Source: The Right Whale Program Research Report 2018, Sironi and Rowntree, 2018)

Among several hypotheses proposed to explain these elevated calf mortalities, harassment by Kelp Gulls, Larus dominicanus, on young calves stands out as a plausible cause and is a unique problem only seen at the PV calving ground. Kelp gull parasitism on SRWs near PV was first observed in the 1970’s (Thomas, 1988). Gulls primarily harass mother-calf pairs, and this parasitic behavior includes pecking on the backs of the whales and creating open wounds to feed on their skin and blubber. The current intensity of gull harassment has been identified as a significant environmental stressor to whales and potential contributor to calf deaths (Marón et al., 2015b; Fernández Ajó et al., 2018).

Figure 3: The significant preference for calves as a target of gull attacks highlights the impact of this parasitic behavior on this age class. The situation continues to be worrisome and serious for the health and well-being of newborn calves at Península Valdés. Left: A Kelp Gull landing on whale´s back to feed on her skin and blubber (Photo credit: Lisandro Crespo). Right: A calf with multiple lesions on its back produced by repeated gull attacks (Photo credit: ICB).

Quantifying gull inflicted wounds

Photographs of gull wounds on whales taken during necropsies and were quantified and assigned to one of seven objectively defined size categories (Fig. 4): extra-small (XS), small (S), medium (M), large (L), extra-large (XL), double XL (XXL) and triple XL (XXXL). The size and number of lesions on each whale were compared to baleen hormones to determine the effect of the of the attacks on the whales health.

Figure 4. Kelp gull lesion scoring. Source: Maron et al. 2015).

How baleen hormones are applied

Impact factors such as injuries, predation avoidance, storms, and starvation promote an increase in the secretion of the glucocorticoids (GCs) cortisol and corticosterone (stress hormones), which then induce a variety of physiological and behavioral responses that help animals cope with the stressor. Prolonged exposure to chronic stress, however, may exceed the animal’s ability to cope with such stimuli and, therefore, adversely affects its body condition, its health, and even its survival. Triiodothyronine (T3), is the most biologically active form of the thyroid hormones and helps regulate metabolism. Sustained food deprivation causes a decrease in T3 concentrations, slowing metabolism to conserve energy stores. Combining GCs and T3 hormone measures allowed us to investigate and distinguish the relative impacts of nutritional and other sources of stressors.

Combining these novel methods produced unique results about whale physiology. With my research, we are finding that the GCs concentrations measured in calves´ baleen positively correlate with the intensity of gull wounding (Figure 4, 1 and 2), while calf’s baleen thyroid hormone concentrations are relative stable across time and do not correlate with intensity of gull wounding (Figure 4 – 3). Taken together these findings indicate that SRW calves exposed to Kelp gull parasitism and harassment experience high levels of physiological stress that compromise their health and survival. Ultimately these results will inform government officials and managers to direct conservation actions aimed to reduce the negative interaction between Kelp gulls and Southern Right Whales in Patagonia.

Figure 4: Physiological stress correlates with number of gull lesions (1 and 2). According to the best-fit linear model, immunoreactive baleen corticosterone (B) and cortisol (F) concentrations increased with wound severity (i.e. number of gull lesions). However, nutritional status indexed by baleen immunoreactive triiodothyronine (T3) concentrations does not correlate with the number of gull lesions (3). (Fernández Ajó et al. 2019, manuscript under revision)

Baleen hormones as a conservation tool

Baleen hormones represent a powerful tool for retrospective assessments of longitudinal trends in whale physiology by helping discriminate the underlying mechanisms by which different stressors may affect a whale’s health and physiology. Moreover, while most sample types used for studying whale physiology provide single time-point measures of current circulating hormone levels (e.g., skin or respiratory vapor), or information from previous few hours or days (e.g., urine and feces), baleen tissue provides a unique opportunity for longitudinal analyses of hormone patterns. These retrospective analyses can be conducted for both stranded or archived specimens, and can be conducted jointly with other biological markers (e.g., stable isotopes and biotoxins) to describe migration patterns and exposure to pollutants. Further research efforts on baleen hormones should focus on completing biological validations to better understand the hormone measurements in baleen and its correlation with measurements from alternative sample matrices (i.e., feces, skin, blubber, and respiratory vapors).

References:

Atkinson, S., Crocker, D., Houser, D., Mashburn, K., 2015. Stress physiology in marine mammals: how well do they fit the terrestrial model? J. Comp. Physiol. B. 185, 463–486. https://doi.org/10.1007/s00360-015-0901-0.

Ayres, K.L., Booth, R.K., Hempelmann, J.A., Koski, K.L., Emmons, C.K., Baird, R.W., Balcomb-Bartok, K., Hanson, M.B., Ford, M.J., Wasser, S.K., 2012. Distinguishing the impacts of inadequate prey and vessel traffic on an endangered killer whale (Orcinus orca) population. PLoS ONE. 7, e36842. https://doi.org/10.1371/journal.pone.0036842.

Fernández Ajó, A.A., Hunt, K., Uhart, M., Rowntree, V., Sironi, M., Marón, C.F., Di Martino, M., Buck, L., 2018. Lifetime glucocorticoid profiles in baleen of right whale calves: potential relationships to chronic stress of repeated wounding by Kelp Gull. Conserv. Physiol. 6, coy045. https://doi.org/10.1093/conphys/coy045.

Hunt, K., Lysiak, N., Moore, M., Rolland, R.M., 2017a. Multi-year longitudinal profiles of cortisol and corticosterone recovered from baleen of North Atlantic right whales (Eubalaena glacialis). Gen. Comp. Endocrinol. 254: 50–59. https://doi.org/10.1016/j.ygcen.2017.09.009.

Hunt, K.E., Hunt, K.E., Lysiak, N.S., Matthews, C.J.D., Lowe, C., Fernández-Ajo, A., Dillon, D., Willing, C., Heide-Jørgensen, M.P., Ferguson, S.H., Moore, M.J., Buck, C.L., 2018. Multi-year patterns in testosterone, cortisol and corticosterone in baleen from adult males of three whale species. Conserv. Physiol. 6, coy049. https://doi.org/10.1093/conphys/coy049.

Hunt, K.E., Hunt, K.E., Lysiak, N.S., Moore, M.J., Rolland R.M., 2016. Longitudinal progesterone profiles in baleen from female North Atlantic right whales (Eubalaena glacialis) match known calving history. Conserv. Physiol. 4, cow014. https://doi.org/10.1093/conphys/cow014.

Hunt, K.E., Lysiak, N.S., Moore, M.J., Seton, R.E., Torres, L., Buck, C.L., 2017b. Multiple steroid and thyroid hormones detected in baleen from eight whale species. Conserv. Physiol. 5, cox061. https://doi.org/10.1093/conphys/cox061.

Hunt, K.E., Moore, M.J., Rolland, R.M., Kellar, N.M., Hall, A.J., Kershaw, J., Raverty, S.A., Davis, C.E., Yeates, L.C., Fauquier, D.A., Rowles, T.K., Kraus, S.D., 2013. Overcoming the challenges of studying conservation physiology in large whales: a review of available methods. Conserv. Physiol. 1: cot006. https://doi.org/10.1093/conphys/cot006.

Hunt, K.E., Stimmelmayr, R., George, C., Hanns, C., Suydam, R., Brower, H., Rolland, R.M., 2014. Baleen hormones: a novel tool for retrospective assessment of stress and reproduction in bowhead whales (Balaena mysticetus). Conserv. Physiol. 2, cou030. doi: https://doi.org/10.1093/conphys/cou030.

Lysiak, N., Trumble, S., Knowlton, A., Moore, M., 2018. Characterizing the duration and severity of fishing gear entanglement on a North Atlantic right whale (Eubalaena glacialis) using stable isotopes, steroid and thyroid hormones in baleen. Front. Mar. Sci. 5: 168. https://doi.org/10.3389/fmars.2018.00168.

Magera, A.M., Flemming, J.E.M., Kaschner, K., Christensen, L.B., Lotze, H.K., 2013. Recovery trends in marine mammal populations. PLoS ONE. 8, e77908. https://doi.org/10.1371/journal.pone.0077908.

Marón, C.F., Beltramino, L., Di Martino, M., Chirife, A., Seger, J., Uhart, M., Sironi, M., Rowntree, V.J., 2015b Increased wounding of southern right whale (Eubalaena australis) calves by Kelp Gulls (Larus dominicanus) at Península Valdés, Argentina., PLoS ONE. 10, p. e0139291. https://doi.org/10.1371/journal.pone.0139291.

Marón, C.F., Rowntree, V.J., Sironi, M., Uhart, M., Payne, R.S., Adler, F.R., Seger, J., 2015a. Estimating population consequences of increased calf mortality in the southern right whales off Argentina. SC/66a/BRG/1 presented to the IWC Scientific Committee, San Diego, USA. Available at: https://iwc.int/home

Rolland, R.M., Graham, K.M., Stimmelmayr, R., Suydam, R. S., George, J.C., 2019. Chronic stress from fishing gear entanglement is recorded in baleen from a bowhead whale (Balaena mysticetus). Mar. Mam. Sci. https://doi.org/10.1111/mms.12596.

Romero, L.M., Platts, S.H., Schoech, S.J., Wada, H., Crespi, E., Martin, L.B., Buck, C.L., 2015. Understanding Stress in the Healthy Animal – Potential Paths for Progress. Stress. 18(5), 491-497.

Rowntree, V.J., Uhart, M.M., Sironi, M., Chirife, A., Di Martino, M., La Sala, L., Musmeci, L., Mohamed, N., Andrejuk, J., McAloose, D., Sala, J., Carribero, A., Rally, H., Franco, M., Adler, F., Brownell, R. Jr, Seger, J., Rowles, T., 2013. Unexplained recurring high mortality of southern right whale Eubalaena australis calves at Península Valdés, Argentina. Mar. Ecol. Prog. Ser. 493:275–289. https://doi.org/10.3354/meps10506.

Sironi, M. Rowntree, V., Di Martino, M., Alzugaray, L.,Rago, V., Marón, C.F., Uhart M., 2018. Southern right whale mortalities at Península Valdes, Argentina: updated information for 2016-2017. SC/67B/CMP/06 presented to the IWC Scientific Committee, Slovenia. Available at: https://iwc.int/home.

Sironi, M. Rowntree, V., Snowdon, C., Valenzuela, L., Marón C., 2009. Kelp Gulls (Larus dominicanus) feeding on southern right whales (Eubalaena australis) at Península Valdes, Argentina: updated estimates and conservation implications. SC/61/BRG19. presented to the IWC Scientific Committee, Portugal. Available at: https://iwc.int/home.

Thomas, P., Reeves, R., 2015. Status of the world’s baleen whales. Mar. Mam. Sci. 32:682–734. https://doi.org/10.1111/mms.12281.

Thomas, P., Uhart, M., McAloose, D., Sironi, M., Rowntree, V.J., Brownell, Jr. R., Gulland, F.M.D., Moore, M., Marón, C., Wilson, C., 2013. Workshop on the southern right whale die-off at Península Valdés, Argentina. SC/60/BRG15 presented to the IWC Scientific Committee, South Korea. Available at: https://iwc.int/home

Thomas, P.O. 1988. Kelp Gulls, Larus dominicanus, are parasites on flesh of the right whale, Eubalaena australis. Ethology. 79:89-103. https://doi.org/10.1111/j.1439-0310.1988.tb00703.x.

Wasser, S.K., Lundin, J.I., Ayres, K., Seely, E., Giles, D., Balcomb, K., Hempelmann, J., Parsons, K., Booth, R., 2017. Population growth is limited by nutritional impacts on pregnancy success in endangered Southern Resident killer whales (Orcinus orca). PLoS ONE. 12, e0179824. https://doi.org/10.1371/journal.pone.0179824.

Marine Mammal Observing: Standardization is key

By: Alexa Kownacki, Ph.D. Student, OSU Department of Fisheries and Wildlife, Geospatial Ecology of Marine Megafauna Lab

For the past two years, I’ve had the opportunity to be the marine mammal observer aboard the NOAA ship Bell M. Shimada for 10 days in May. Both trips covered transects in the Northern California Current Ecosystem during the same time of year, but things looked very different from my chair on the fly bridge. This trip, in particular, highlighted the importance of standardization, seeing as it was the second replicate of the same area. Other scientists and crew members repeatedly asked me the same questions that made me realize just how important it is to have standards in scientific practices and communicating them.

Northern right whale dolphin porpoising out of the water beside the ship while in transit. May 2019. Image source: Alexa Kownacki

The questions:

  1. What do you actually do here and why are you doing it?
  2. Is this year the same as last year in terms of weather, sightings, and transect locations?
  3. Did you expect to see greater or fewer sightings (number and diversity)?
  4. What is this Beaufort Sea State scale that you keep referring to?

All of these are important scientific questions that influence our hypothesis-testing research, survey methods, expected results, and potential conclusions. Although the entire science party aboard the ship conducted marine science, we all had our own specialties and sometimes only knew the basics, if that, about what the other person was doing. It became a perfect opportunity to share our science and standards across similar, but different fields.

Now, to answer those questions:

  1. a) What do you actually do here and b) why are you doing it?

a) As the only marine mammal observer, I stand watch during favorable weather conditions while the ship is in transit, scanning from 0 to 90 degrees off the starboard side (from the front of the ship to a right angle towards the right side when facing forwards). Meanwhile, an application on an iPad called SeaScribe, records the ship’s exact location every 15 seconds, even when no animal is sighted. This process allows for the collection of absence data, that is, data when no animals are present. The SeaScribe program records the survey lines, along with manual inputs that I add, including weather and observer information. When I spot a marine mammal, I immediately mark an exact location on a hand held GPS, use my binoculars to identify the species, and add information to the sighting on the SeaScribe program, such as species, distance to the sighted animal(s), the degree (angle) to the sighting, number of animals in a group, behavior, and direction if traveling.

b) Marine mammal observing serves many different purposes. In this case, observing collects information about what species are where at what time. By piggy-backing on these large-scale, offshore oceanographic NOAA surveys, we have the unique opportunity to survey along standardized transect lines during different times of the year. From replicate survey data, we can start to form an idea of which species use which areas and what oceanographic conditions may impact species distributions. Currently there is not much consistent marine mammal data collected over these offshore areas between Northern California and Washington State, so our work is aiming to fill this knowledge gap.

Alexa observing on the R/V Shimada in May 2019, all bundled up. Image Source: Alexa Kownacki

  1. What is this Beaufort Sea State scale that you keep referring to?

Great question! It took me a while to realize that this standard measuring tool to estimate wind speeds and sea conditions, is not commonly recognized even among other sea-goers. The Beaufort Sea State, or BSS, uses an empirical scale that ranges from 0-12 with 0 being no wind and calm seas, to 12 being hurricane-force winds with 45+ ft seas. It is frequently referenced by scientists in oceanography, marine science, and climate science as a universally-understood metric. The BSS was created in 1805 by Francis Beaufort, a hydrographer in the Royal Navy, to standardize weather conditions across the fleet of vessels. By the mid-1850s, the BSS was standardized to non-naval use for sailing vessels, and in 1916, expanded to include information specific to the seas and not the sails1. We in the marine mammal observation field constantly collect BSS information while on survey to measure the quality of survey conditions that may impact our observations. BSS data allows us to measure the extent of our survey range, both in the distance that we are likely to sight animals and also the likelihood of sighting anything. Therefore, the BSS scale gives us an important indication of how much absence data we have collected, in addition to presence data.

A description of the Beaufort Sea State Scale. Image source: National Weather Service.


  1. Is this year the same as last year in terms of weather, sightings, and transect locations?

The short answer is no. Observed differences in marine mammal sightings in terms of both species diversity and number of animals between years can be normal. There are many potential explanatory variables, from differences in currents, upwelling strength, El Nino index levels, water temperatures, or, what was obvious in this case: sighting conditions. The weather in May 2019 varied greatly from that in May 2018. Last year, I observed for nearly every day because the Beaufort Sea State (BSS) was frequently less than a four. However, this year, more often than not, the BSS greater than or equal to five. A BSS of 5 equates to approximately 17-21 knots of breeze with 6-foot waves and the water appears to have many “white horses” or pronounced white caps with sea spray. Additionally, mechanical issue with winches delayed and altered our transect locations. Therefore, although multiple transects from May 2018 were also surveyed during May 2019, there were a few lines that do not have data for both cruises.

May 2018 with a BSS 1

May 2019 with a BSS 6


  1. Did you expect to see greater or fewer sightings (number and diversity)?

Knowing that I had less favorable sighting conditions and less amount of effort observing this year, it is not surprising that I observed fewer marine mammals in total count and in species diversity. Even less surprising is that on the day with the best weather, where the BSS was less than a five, I recorded the most sightings with the highest species count. May 2018 felt a bit like a tropical vacation because we had surprisingly sunny days with mild winds, and during May 2019 we had some rough seas with gale force winds. Additionally, as an observer, I need to remove as much bias as possible. So, yes, I had hoped to see beaked whales or orca like I did in May 2018, but I was still pleasantly surprised when I spotted fin whales feeding in May 2019.

Marine Mammal Species Number of Sightings
May 2018 May 2019
Humpback whale 31 6
Northern right whale dolphin 1 2
Pacific white-sided dolphin 3 6
UNID beaked whale 1 0
Cuvier’s beaked whale 1 0
Gray whale 4 1
Minke whale 1 1
Fin whale 4 1
Blue whale 1 0
Transient killer whale 1 0
Dall’s porpoise 2 0
Northern fur seal 1 0
California sea lion 0 1

Pacific white-sided dolphin. Image source: Alexa Kownacki

Standardization is a common theme. Observing between years on standard transects, at set speeds, in different conditions using standardized tools is critical to collecting high quality data that is comparable across different periods. Scientists constantly think about quality control. We look for trends and patterns, similarities and differences, but none of those could be understood without having standard metrics.

The entire science party aboard the R/V Shimada in May 2019, including a marine mammal scientist, phytoplankton scientists, zooplankton scientists, and fisheries scientists, and oceanographers. Image Source: Alexa Kownacki

Literature Cited:

1Oliver, John E. (2005). Encyclopedia of world climatology. Springer.


Ocean Jail

a captive marine mammal in an unknown location
Source: Snopes, 2018.


By Leila Lemos

PhD candidate, Fisheries and Wildlife Department, OSU


This past November, headlines were made when a drone captured images of over 100 dolphins confined in Srednyaya Bay, Russia, for commercial reasons.

Figure 01: Location of the “whale jail” in Srednyaya Bay, near Nakhodka, Russia.
Source: Big Think, 2018.


This “whale jail” was installed in Srednyaya Bay to receive “prisoners” last July. The Russian newspaper Novaya Gazeta originally reported the story on 30 October 2018 and stated that 11 killer whales and 90 beluga whales [both actually dolphin species] were being held in captivity. These prisoners represent a record catch for the four companies believed to be responsiblefor the captures: LLC Oceanarium DV, LLC Afalina, LLC Bely Kit and LLC Sochi Dolphinarium.

These 101 black-market dolphins are jammed into tiny offshore pensmade ofnetting and are believed to be illegally up for sale to one of China’s 60 marine parks and aquariums, as told by the British journal The Telegraph. With this entertainment business booming in China and a dozen more venues reportedly under construction, there is a demand for these intelligent, social, wild animals.

Figure 02: Twitter post by the Russian government-controlled news outlet RT showing the tiny pens where the cetaceans are being held in captivity in Srednyaya Bay, Russia.
Source: Snopes, 2018.


The full drone footage can be seen here:

https://www.youtube.com/watch?v=SlyD6ox9iSo


The prosecutor investigating the case is assessing all documents in order to find out if the animals were captured for scientific or educational purposes, or if they were actually detained with an illegal purpose. Greenpeace Russia and other activists are also closely following the case.

The Novaya Gazetta has also reported that the four companies (LLC Oceanarium DV, LLC Afalina, LLC Bely Kit and LLC Sochi Dolphinarium) that own these containers previously exported 13 killer whales to China between 2013 and 2016. These companies were supposedly granted permission to capture ten killer whales in the wild for educational purposes. However, seven of those killer whales were exported to China. Russian authorities are now investigating this case as a possible fraud.

It is important to remember that in 1982, the International Whaling Commission (IWC) adopted a moratorium on commercial whaling, prohibiting participant countries of this international agreement to capture wild whales, except for a specific set of scientific, educational, and cultural purposes. Currently, the quota for capturing whales varies with purpose, country and species, in accordance with the method adopted by the IWC to avoid negative impact on cetacean populations. However, commercial whaling quota is currently zero (IWC 2019a) and there are now 101 individuals being held in captivity in Srednyaya Bay.

Unfortunately, not all countries participate and engage in this agreement. The map below shows the IWC member countries and when they joined the IWC. Surprisingly, both Russia and China are both IWC members despite their purported activities capturing, holding and selling cetaceans for profit.

Figure 03: IWC member countries and when they joined the IWC.
Source: IWC, 2019b.


Also, members can withdraw from the IWC. This past December there was another shocking news regarding Japan’s decision to withdraw from the IWC to recommence commercial whaling for the first time in 30 years (Japan Times 2018). This news has led to concerns that this whale market will further diminish the already declining dolphin populations in the region but may also improve whale populations in the Southern Oceans where Japan has whaled illegally previously (Nature 2019).


References:

Big Think 2018. Available at: https://bigthink.com/politics-current-affairs/endangered-whales-black-market-russia?rebelltitem=1#rebelltitem1

IWC 2019a. Available at:https://iwc.int/index.php?cID=html_76#permit

IWC 2019b. Available at:https://iwc.int/members

Japan Times 2018. Available at: https://www.japantimes.co.jp/news/2018/12/20/national/japan-withdraw-international-whaling-commission-bid-resume-commercial-whaling-sources/#.XDT3di3MyfU

Nature 2019. Nature 565, 133 (2019). Available at: https://www.nature.com/articles/d41586-019-00076-2 

Snopes 2018. Available at: https://www.snopes.com/fact-check/whales-in-jails/

The Recipe for a “Perfect” Marine Mammal and Seabird Cruise

By Alexa Kownacki, Ph.D. Student, OSU Department of Fisheries and Wildlife, Geospatial Ecology of Marine Megafauna Lab

Science—and fieldwork in particular—is known for its failures. There are websites, blogs, and Twitter pages dedicated to them. This is why, when things go according to plan, I rejoice. When they go even better than expected, I practically tear up from amazement. There is no perfect recipe for a great marine mammal and seabird research cruise, but I would suggest that one would look like this:

 A Great Marine Mammal and Seabird Research Cruise Recipe:

  • A heavy pour of fantastic weather
    • Light on the wind and seas
    • Light on the glare
  • Equal parts amazing crew and good communication
  • A splash of positivity
  • A dash of luck
  • A pinch of delicious food
  • Heaps of marine mammal and seabird sightings
  • Heat to approximately 55-80 degrees F and transit for 10 days along transects at 10-12 knots

The end of another beautiful day at sea on the R/V Shimada. Image source: Alexa K.

The Northern California Current Ecosystem (NCCE) is a highly productive area that is home to a wide variety of cetacean species. Many cetaceans are indicator species of ecosystem health as they consume large quantities of prey from different levels in trophic webs and inhabit diverse areas—from deep-diving beaked whales to gray whales traveling thousands of miles along the eastern north Pacific Ocean. Because cetacean surveys are a predominant survey method in large bodies of water, they can be extremely costly. One alternative to dedicated cetacean surveys is using other research vessels as research platforms and effort becomes transect-based and opportunistic—with less flexibility to deviate from predetermined transects. This decreases expenses, creates collaborative research opportunities, and reduces interference in animal behavior as they are never pursued. Observing animals from large, motorized, research vessels (>100ft) at a steady, significant speed (>10kts/hour), provides a baseline for future, joint research efforts. The NCCE is regularly surveyed by government agencies and institutions on transects that have been repeated nearly every season for decades. This historical data provides critical context for environmental and oceanographic dynamics that impact large ecosystems with commercial and recreational implications.

My research cruise took place aboard the 208.5-foot R/V Bell M. Shimada in the first two weeks of May. The cruise was designated for monitoring the NCCE with the additional position of a marine mammal observer. The established guidelines did not allow for deviation from the predetermined transects. Therefore, mammals were surveyed along preset transects. The ship left port in San Francisco, CA and traveled as far north as Cape Meares, OR. The transects ranged from one nautical mile from shore and two hundred miles offshore. Observations occurred during “on effort” which was defined as when the ship was in transit and moving at a speed above 8 knots per hour dependent upon sea state and visibility. All observations took place on the flybridge during conducive weather conditions and in the bridge (one deck below the flybridge) when excessive precipitation was present. The starboard forward quarter: zero to ninety degrees was surveyed—based on the ship’s direction (with the bow at zero degrees). Both naked eye and 7×50 binoculars were used with at least 30 percent of time binoculars in use. To decrease observer fatigue, which could result in fewer detected sightings, the observer (me) rotated on a 40 minutes “on effort”, 20 minutes “off effort” cycle during long transits (>90 minutes).

Alexa on-effort using binoculars to estimate the distance and bearing of a marine mammal sighted off the starboard bow. Image source: Alexa K.

Data was collected using modifications to the SEEbird Wincruz computer program on a ruggedized laptop and a GPS unit was attached. At the beginning of each day and upon changes in conditions, the ship’s heading, weather conditions, visibility, cloud cover, swell height, swell direction, and Beaufort sea state (BSS) were recorded. Once the BSS or visibility was worse than a “5” (1 is “perfect” and 5 is “very poor”) observations ceased until there was improvement in weather. When a marine mammal was sighted the latitude and longitude were recorded with the exact time stamp. Then, I noted how the animal was sighted—either with binoculars or naked eye—and what action was originally noticed—blow, splash, bird, etc. The bearing and distance were noted using binoculars. The animal was given three generalized behavior categories: traveling, feeding, or milling. A sighting was defined as any marine mammal or group of animals. Therefore, a single sighting would have the species and the best, high, and low estimates for group size.

By my definitions, I had the research cruise of my dreams. There were moments when I imagined people joining this trip as a vacation. I *almost* felt guilty. Then, I remember that after watching water for almost 14 hours (thanks to the amazing weather conditions), I worked on data and reports and class work until midnight. That’s the part that no one talks about: the data. Fieldwork is about collecting data. It’s both what I live for and what makes me nervous. The amount of time, effort, and money that is poured into fieldwork is enormous. The acquisition of the data is not as simple as it seems. When I briefly described my position on this research cruise to friends, they interpret it to be something akin to whale-watching. To some extent, this is true. But largely, it’s grueling hours that leave you fatigued. The differences between fieldwork and what I’ll refer to as “everything else” AKA data analysis, proposal writing, manuscript writing, literature reviewing, lab work, and classwork, are the unbroken smile, the vaguely tanned skin, the hours of laughter, the sea spray, and the magical moments that reassure me that I’ve chosen the correct career path.

Alexa photographing a gray whale at sunset near Newport, OR. Image source: Alexa K.

This cruise was the second leg of the Northern California Current Ecosystem (NCCE) survey, I was the sole Marine Mammal and Seabird Observer—a coveted position. Every morning, I would wake up at 0530hrs, grab some breakfast, and climb to the highest deck: the fly-bridge. Akin to being on the top of the world, the fly-bridge has the best views for the widest span. From 0600hrs to 2000hrs I sat, stood, or danced in a one-meter by one-meter corner of the fly-bridge and surveyed. This visual is why people think I’m whale watching. In reality, I am constantly busy. Nonetheless, I had weather and seas that scientists dream about—and for 10 days! To contrast my luck, you can read Florence’s blog about her cruise. On these same transects, in February, Florence experienced 20-foot seas with heavy rain with very few marine mammal sightings—and of those, the only cetaceans she observed were gray whales close to shore. That starkly contrasts my 10 cetacean species with upwards of 45 sightings and my 20-minute hammock power naps on the fly-bridge under the warm sun.

Pacific white-sided dolphins traveling nearby. Image source: Alexa K.

Marine mammal sightings from this cruise included 10 cetacean species: Pacific white-sided dolphin, Dall’s porpoise, unidentified beaked whale, Cuvier’s beaked whale, gray whale, Minke whale, fin whale, Northern right whale dolphin, blue whale, humpback whale, and transient killer whale and one pinniped species: northern fur seal. What better way to illustrate these sightings than with a map? We are a geospatial lab after all.

Cetacean Sightings on the NCCE Cruise in May 2018. Image source: Alexa K.

This map is the result of data collection. However, it does not capture everything that was observed: sea state, weather, ocean conditions, bathymetry, nutrient levels, etc. There are many variables that can be added to maps–like this one (thanks to my GIS classes I can start adding layers!)–that can provide a better understanding of the ecosystem, predator-prey dynamics, animal behavior, and population health.

The catch from a bottom trawl at a station with some fish and a lot of pyrosomes (pink tube-like creatures). Image source: Alexa K.

Being a Ph.D. student can be physically and mentally demanding. So, when I was offered the opportunity to hone my data collection skills, I leapt for it. I’m happiest in the field: the wind in my face, the sunshine on my back, surrounded by cetaceans, and filled with the knowledge that I’m following my passion—and that this data is contributing to the greater scientific community.

Humpback whale photographed traveling southbound. Image source: Alexa K.

Managing Oceans: the inner-workings of marine policy

By Alexa Kownacki, Ph.D. Student, OSU Department of Fisheries and Wildlife, Geospatial Ecology of Marine Megafauna Lab

When we hear “marine policy” we broadly lump it together with environmental policy. However, marine ecosystems differ greatly from their terrestrial counterparts. We wouldn’t manage a forest like an ocean, nor would we manage an ocean like a forest. Why not? The answer to this question is complex and involves everything from ecology to politics.

Oceans do not have borders; they are fluid and dynamic. Interestingly, by defining marine ecosystems we are applying some kind of borders. But water (and all its natural and unnatural content) flows between these ‘ecosystems’. Marine ecosystems are home to a variety of anthropogenic activities such as transportation and recreation, in addition to an abundance of species that represent the three major domains of biology: Archaea, Bacteria, and Eukarya. Humans are the only creatures who “recognize” the borders that policymakers and policy actors have instilled. A migrating gray whale does not have a passport stamped as it travels from its breeding grounds in Mexican waters to its feeding grounds in the Gulf of Alaska. In contrast, a large cargo ship—or even a small sailing vessel—that crosses those boundaries is subjected to a series of immigration checkpoints. Combining these human and the non-human facets makes marine policy complex and variable.

The eastern Pacific gray whale migration route includes waters off of Mexico, Canada, and the United States. Source: https://www.learner.org/jnorth/tm/gwhale/annual/map.html

Environmental policy of any kind can be challenging. Marine environmental policy adds many more convoluted layers in terms of unknowns; marine ecosystems are understudied relative to terrestrial ecosystems and therefore have less research conducted on how to best manage them. Additionally, there are more hands in the cookie jar, so to speak; more governments and more stakeholders with more opinions (Leslie and McLeod 2007). So, with fewer examples of successful ecosystem-based management in coastal and marine environments and more institutions with varied goals, marine ecosystems become challenging to manage and monitor.

A visual representation of what can happen when there are many groups with different goals: no one can easily get what they want. Image Source: The Brew Monks

With this in mind, it is understandable that there is no official manual on policy development.  There is, however, a broadly standardized process of how to develop, implement, and evaluate environmental policies: 1) recognize a problem 2) propose a solution 3) choose a solution 4) put the solution into effect and 4) monitor the results (Zacharias pp. 16-21). For a policy to be deemed successful, specific criteria must be met, which means that a common policy is necessary for implementation and enforcement. Within the United States, there are a multiple governing bodies that protect the ocean, including the National Oceanic and Atmospheric Administration (NOAA), Environmental Protection Agency (EPA), Fish and Wildlife Service (USFWS), and the Department of Defense (DoD)—all of which have different mission statements, budgets, and proposals. To create effective environmental policies, collaboration between various groups is imperative. Nevertheless, bringing these groups together, even those within the same nation, requires time, money, and flexibility.

This is not to say that environmental policy for terrestrial systems, but there are fewer moving parts to manage. For example, a forest in the United States would likely not be an international jurisdiction case because the borders are permanent lines and national management does not overlap. However, at a state level, jurisdiction may overlap with potentially conflicting agendas. A critical difference in management strategies is preservation versus conservation. Preservation focuses on protecting nature from use and discourages altering the environment. Conservation, centers on wise-use practices that allow for proper human use of environments such as resource use for economic groups. One environmental group may believe in preservation, while one government agency may believe in conservation, creating friction amongst how the land should be used: timber harvest, public use, private purchasing, etc.

Linear representation of preservation versus conservation versus exploitation. Image Source: Raoof Mostafazadeh

Furthermore, a terrestrial forest has distinct edges with measurable and observable qualities; it possesses intrinsic and extrinsic values that are broadly recognized because humans have been utilizing them for centuries. Intrinsic values are things that people can monetize, such as commercial fisheries or timber harvests whereas extrinsic values are things that are challenging to put an actual price on in terms of biological diversity, such as the enjoyment of nature or the role of species in pest management; extrinsic values generally have a high level of human subjectivity because the context of that “resource” in question varies upon circumstances (White 2013). Humans are more likely to align positively with conservation policies if there are extrinsic benefits to them; therefore, anthropocentric values associated with the resources are protected (Rode et al. 2015). Hence, when creating marine policy, monetary values are often placed on the resources, but marine environments are less well-studied due to lack of accessibility and funding, making any valuation very challenging.

The differences between direct (intrinsic) versus indirect (extrinsic) values to biodiversity that factor into environmental policy. Image Source: Conservationscienceblog.wordpress.com

Assigning a cost or benefit to environmental services is subjective (Dearborn and Kark 2010). What is the benefit to a child seeing an endangered killer whale for the first time? One could argue priceless. In order for conservation measures to be implemented, values—intrinsic and extrinsic—are assigned to the goods and services that the marine environment provides—such as seafood and how the ocean functions as a carbon sink. Based off of the four main criteria used to evaluate policy, the true issue becomes assessing the merit and worth. There is an often-overlooked flaw with policy models: it assumes rational behavior (Zacharias 126). Policy involves relationships and opinions, not only the scientific facts that inform them; this is true in terrestrial and marine environments. People have their own agendas that influence, not only the policies themselves, but the speed at which they are proposed and implemented.

Tourists aboard a whale-watching vessel off of the San Juan Islands, enjoying orca in the wild. Image Source: Seattle Orca Whale Watching

One example of how marine policy evolves is through groups, such as the International Whaling Commission, that gather to discuss such policies while representing many different stakeholders. Some cultures value the whale for food, others for its contributions to the surrounding ecosystems—such as supporting healthy seafood populations. Valuing one over the other goes beyond a monetary value and delves deeper into the cultures, politics, economics, and ethics. Subjectivity is the name of the game in environmental policy, and, in marine environmental policy, there are many factors unaccounted for, that decision-making is incredibly challenging.

Efficacy in terms of the public policy for marine systems presents a challenge because policy happens slowly, as does research. There is no equation that fits all problems because the variables are different and dynamic; they change based on the situation and can be unpredictable. When comparing institutional versus impact effectiveness, they both are hard to measure without concrete goals (Leslie and McLeod 2007). Marine ecosystems are open environments which add an additional hurdle: setting measurable and achievable goals. Terrestrial environments contain resources that more people utilize, more frequently, and therefore have more set goals. Without a problem and potential solution there is no policy. Terrestrial systems have problems that humans recognize. Marine systems have problems that are not as visible to people on a daily basis. Therefore, terrestrial systems have more solutions presented to mitigate problems and more policies enacted.

As marine scientists, we don’t always immediately consider how marine policy impacts our research. In the case of my project, marine policy is something I constantly have to consider. Common bottlenose dolphins are protected under the Marine Mammal Protection Act (MMPA) and inhabit coastal of both the United States and Mexico, including within some Marine Protected Areas (MPA). In addition, some funding for the project comes from NOAA and the DoD. Even on the surface-level it is clear that policy is something we must consider as marine scientists—whether we want to or not. We may do our best to inform policymakers with results and education based on our research, but marine policy requires value-based judgements based on politics, economics, and human objectivity—all of which are challenging to harmonize into a succinct problem with a clear solution.

Two common bottlenose dolphins (coastal ecotype) traveling along the Santa Barbara, CA shoreline. Image Source: Alexa Kownacki

References:

Dearborn, D. C. and Kark, S. 2010. Motivations for Conserving Urban Biodiversity. Conservation Biology, 24: 432-440. doi:10.1111/j.1523-1739.2009.01328.x

Leslie, H. M. and McLeod, K. L. (2007), Confronting the challenges of implementing marine ecosystem‐based management. Frontiers in Ecology and the Environment, 5: 540-548. doi:10.1890/060093

Munguia, P., and A. F. Ojanguren. 2015. Bridging the gap in marine and terrestrial studies. Ecosphere 6(2):25. http://dx.doi.org/10.1890/ES14-00231.1

Rode, J., Gomez-Baggethun, E., Krause, M., 2015. Motivation crowding by economic payments in conservation policy: a review of the empirical evidence. Ecol. Econ. 117, 270–282 (in this issue).

White, P. S. (2013), Derivation of the Extrinsic Values of Biological Diversity from Its Intrinsic Value and of Both from the First Principles of Evolution. Conservation Biology, 27: 1279-1285. doi:10.1111/cobi.12125

Zacharias, M. 2014. Marine Policy. London: Routledge.