Hearing Gray: Diving into the Sonic World of the Gray Whale

By Natalie Nickells, visiting PhD Student, British Antarctic Survey

For the last three months, I’ve been lucky enough to be welcomed into the GEMM lab as a visiting PhD student to work on the acoustic data from hydrophones in CATS tags deployed on gray whales. This work has been a huge change for me! I’ve gone from studying Antarctic baleen whale foraging, the topic of my PhD, from a distance at my desk in Cambridge England, to studying PCFG gray whales in Newport- and finally being in the same country, state, and even county to the whales I am studying! Unlike my Antarctic research, where whale blows in the distance become tiny points in a sea of data, listening to the CATS tag data has allowed me to really connect with these animals on an emotional level, as I’ve spent days, weeks and months listening to the world as they hear it.

Humans are fundamentally visual creatures- we take in information through sight first, with hearing probably our second, or for some even third, sense in line. However, for marine mammals, the same cannot be said: their world is auditory first. This fact is an important realisation to get our heads around, highlighted beautifully by the phrase “the ears are the window to the soul of the whale” (Sonic Sea (2017)) or Tim Donaghy’s emotive statement that “a deaf whale is a dead whale”. High levels of ocean noise therefore have a huge impact on baleen whales. Imagine trying to do your groceries or find a friend while blindfolded or in a thick fog– you might struggle to access food or communicate with others, and your stress would certainly be high. To succeed, you would likely need to change your behaviour.

Behavioural changes in response to ocean noise are observed in baleen whales: for example, humpback whales change their foraging behaviour when ship noise increases (Blair et al., 2016), and gray whales have been shown to call more frequently and possibly more loudly in conditions of high ocean noise (Dahlheim & Castellote, 2016). However, even in the absence of notable behaviour change due to ocean noise,  North Atlantic  right whales  may still be experiencing a stress response. When shipping traffic in the Bay of Fundy significantly decreased in the aftermath of 9/11, North Atlantic  right whales in the area had decreased chronic stress levels (Rolland et al., 2012).

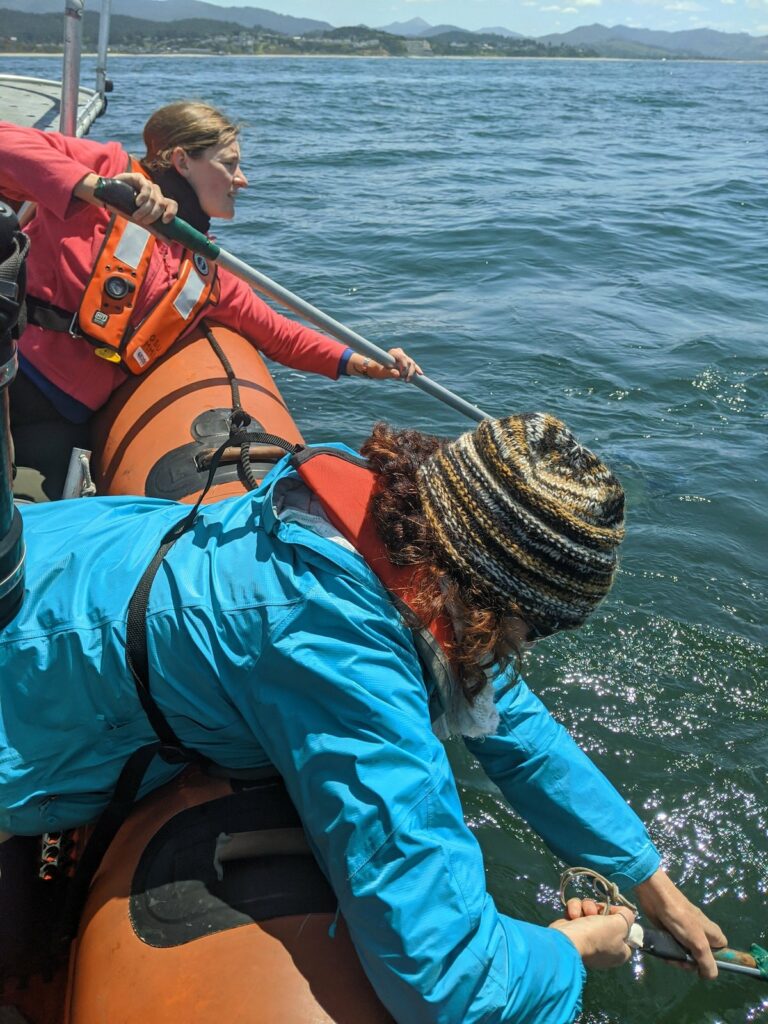
Previous work by the GEMM lab observed this stress response to ocean noise in gray whales. They found a correlation between high levels of glucocorticoid (a stress indicator) in male gray whale faeces with high vessel noise and vessel counts in the area. Vessel noise was measured using two static hydrophones off the Oregon coast, and it was assumed all animals in the area experienced the same noise (Lemos et al., 2022; Pirotta et al., 2023). However, a static hydrophone is an imperfect measure of the sound levels a mobile animal experiences, particularly as we might expect animals to change behaviour when disturbed (Sullivan & Torres, 2018).  This previous work became the starting point for the question I have addressed during my time in the GEMM Lab: can we measure and characterise the sound levels  an individual whale was exposed to? Enter CATS tags. These are suction-cup tags fitted with a host of sensors, which have been used by the GEMM lab since 2021 (see Image 1). So far, they have mostly been used for their accelerometry data (Colson et al. (in press), see also Kate’s blog post). However, the GEMM lab had the foresight to put hydrophones on these tags, and as a result I was welcomed into the lab by a bumper-crop of hydrophone data just waiting to be analysed!
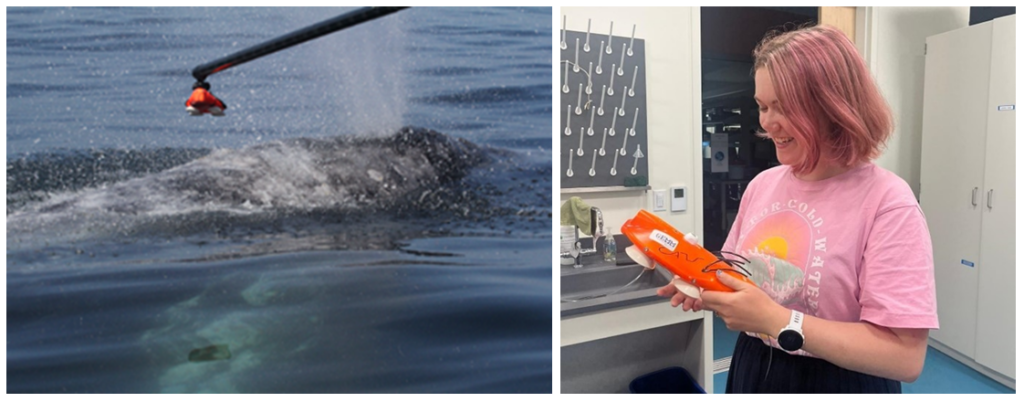
Image 1: A gray whale (“Slush”) being tagged with a CATS tag and Natalie (right) with the same tag.

This tag data is particularly valuable, not only for its ability to follow the acoustic world of an individual whale, but also due to the whole suite of data that comes with the acoustics: essentially, the acoustic data comes with behavioural data. Or at least, it comes with data from which we can infer behaviour (Colson et al, in press)! Incorporating behaviour into passive acoustics work hugely strengthens its ecological usefulness (Oestreich et al., 2024). We can hear what an individual whale is hearing, and we can also infer what they were doing before, during, and after they heard or made that sound. Having behavioural data also means that we can ground-truth the sounds we hear. When hearing an interesting sound, I can go back to the video data and accelerometer data to check what the whale sees, what its body-position is doing (e.g., is it headstand foraging?) and the speed and direction of its travel. Context is key!

The importance of context was highlighted in my very first week here in the GEMM lab. I became very interested in a sound I could hear frequently when the whale would surface- a distorted bark-like noise, but the whale was surely too far offshore for any barking dog to be heard? And almost every time the whale surfaced? After a few days pondering, I shared my mystery with Leigh, who laughingly revealed that one of the whale-watching boats in this area has a ‘whale-alerting’ dog on board! Sometimes if it sounds like a dog… it’s a dog! Besides my slightly anticlimactic discovery of dogs barking, committing time to listening to the tags and hearing what the whales hear, has been a magical experience. My favourite hydrophone sound, that still gets me excited when I hear it, is the gray whale ‘bongo call’- or as it’s more formally known in the literature, M1 vocalisation (Guazzo et al., 2019). I’ll let you decide which name is more appropriate! I first heard this call when investigating a time on “Scarlett’s” tag when we knew her 14 year-old daughter “Pacman” had been close: about 15 minutes before “Pacman” appears on the video, Scarlett makes this call (you can play the clip below to listen).  In “Lunita’s” tag, we even hear this call three times in a row!

Image 2: A ‘bongo call’ made by “Scarlett” when her daughter “Pacman” was nearby.

Relatively little research has been done on gray whale calls compared to other more studied species like humpbacks. Most of this research has taken place on gray whale migratory routes (Guazzo et al., 2019, 2017; Burnham et al. 2018)  or in captivity (Fish et. al, 1974 ) so these tag recordings could be a valuable addition to a small sample from the foraging grounds (Clayton et al., 2023; Haver et al., 2023)- as well as being very personally exciting to hear!

We’ve also been able to use the tag hydrophone data to look at close calls with ships. As I was going through the data on “Scarlett’s” tag, I noticed a spike in vessel noise. Looking at the video from the same timestamp, I could see a small vessel passing directly over her as she surfaced. At the time this vessel passed over her, the tag was only 0.8 m under the surface of the water!

Image 3: A close encounter between a small vessel and “Scarlett”, shown both on the video from the CATS tag (top) and the spectrogram (bottom). The close call is outlined in a yellow box, when a greater intensity of noise occurred as illustrated by the brighter colour intensity compared to the white box (quieter vessel noise). Brighter colours denote a louder volume. The red boxes show surfacing noise- this can essentially be ignored when interpreting the echogram for our purposes.

Sometimes vessels may be more distant, but possibly equally harmful: we have seen vessel noise from larger and presumably more distant vessels dominate the soundscape in some of the tag data. Remembering that to a whale, the sonic world is as important as the visual world is to us, this elevated background noise from ships could have major consequences. So, the first step is to try to quantify the gray whales’ exposure to this vessel noise. I’ve been running some systematic sampling on the tag data to try to quantify background noise levels, and how this changes depending on the time of day: do individual whales experience the same daily spikes in ocean noise that were detected on the static hydrophones, at around 6am and noon due to vessel traffic (Haver et al., 2023)? If not, are they taking evasive action to avoid these spikes? These are just some of the questions that these CATS tags can help us answer, although ideally we need longer acoustic data recordings to capture day and night data, as well as potentially improving the hydrophones on the CATS tags themselves to minimise the impacts of tag interference and random noise.

When explaining to the public what it is to be a PhD student, I often refer to myself as a ‘scientist in training’, or to young children, a ‘baby scientist’. As I look toward my departure from the GEMM lab, I hope to have developed into at least a scientific toddler, having gained the ability to walk through reams of acoustic data with (relative) independence. More than that, I’m excited to take home a refreshed sense of curiosity about what drives marine mammals to behave as they do, an openness to collaboration and new approaches, and a large dose of ‘American emotion’! Let’s hope my British colleagues can handle it!

My heartfelt thanks to all those who welcomed me so warmly at the GEMM lab and Oregon State University, particularly my mentors Leigh Torres and Samara Haver.

Did you enjoy this blog? Want to learn more about marine life, research, and conservation? Subscribe to our blog and get a weekly alert when we make a new post! Just add your name into the subscribe box below!

Loading

Bibliography

Sonic Sea (2017) Directed by Michelle Dougherty [Film] Distributed by the Natural Resources Defense Council.

Blair, H.B., Merchant, N.D., Friedlaender, A.S., Wiley, D.N. & Parks, S.E. (2016) Evidence for ship noise impacts on humpback whale foraging behaviour. Biology Letters. 12 (8), 20160005. doi:10.1098/rsbl.2016.0005.

Burnham, R., Duffus, D. & Mouy, X. (2018) Gray Whale (Eschrictius robustus) Call Types Recorded During Migration off the West Coast of Vancouver Island. Frontiers in Marine Science. 5, 329. doi:10.3389/fmars.2018.00329.

Colson, K., E. Pirotta L. New, D Cade, J Calambokidis, K. Bierlich, C Bird, A Fernandez Ajó, L. Hildebrand, A. Trites, L. Torres. (in press). Using accelerometry tags to quantify gray whale foraging behavior. Marine Mammal Science.

Clayton, H., Cade, D.E., Burnham, R., Calambokidis, J. & Goldbogen, J. (2023) Acoustic behavior of gray whales tagged with biologging devices on foraging grounds. Frontiers in Marine Science. 10, 1111666. doi:10.3389/fmars.2023.1111666.

Dahlheim, M. & Castellote, M. (2016) Changes in the acoustic behavior of gray whales Eschrichtius robustus in response to noise. Endangered Species Research. 31, 227–242. doi:10.3354/esr00759.

Fish, J.F., Sumich, J.L. & Lingle, G.L. (n.d.) Sounds Produced by the Gray Whale, Eschrichtius robustus.

Guazzo, R., Schulman-Janiger, A., Smith, M., Barlow, J., D’Spain, G., Rimington, D. & Hildebrand, J. (2019) Gray whale migration patterns through the Southern California Bight from multi-year visual and acoustic monitoring. Marine Ecology Progress Series. 625, 181–203. doi:10.3354/meps12989.

Guazzo, R.A., Helble, T.A., D’Spain, G.L., Weller, D.W., Wiggins, S.M. & Hildebrand, J.A. (2017) Migratory behavior of eastern North Pacific gray whales tracked using a hydrophone array S. Li (ed.). PLOS ONE. 12 (10), e0185585. doi:10.1371/journal.pone.0185585.

Haver, S.M., Haxel, J., Dziak, R.P., Roche, L., Matsumoto, H., Hvidsten, C. & Torres, L.G. (2023) The variable influence of anthropogenic noise on summer season coastal underwater soundscapes near a port and marine reserve. Marine Pollution Bulletin. 194, 115406. doi:10.1016/j.marpolbul.2023.115406.

Lemos, L.S., Haxel, J.H., Olsen, A., Burnett, J.D., Smith, A., Chandler, T.E., Nieukirk, S.L., Larson, S.E., Hunt, K.E. & Torres, L.G. (2022) Effects of vessel traffic and ocean noise on gray whale stress hormones. Scientific Reports. 12 (1), 18580. doi:10.1038/s41598-022-14510-5.

Oestreich, W.K., Oliver, R.Y., Chapman, M.S., Go, M.C. & McKenna, M.F. (2024) Listening to animal behavior to understand changing ecosystems. Trends in Ecology & Evolution. S0169534724001459. doi:10.1016/j.tree.2024.06.007.

Pirotta, E., Fernandez Ajó, A., Bierlich, K.C., Bird, C.N., Buck, C.L., Haver, S.M., Haxel, J.H., Hildebrand, L., Hunt, K.E., Lemos, L.S., New, L. & Torres, L.G. (2023) Assessing variation in faecal glucocorticoid concentrations in gray whales exposed to anthropogenic stressors S. Cooke (ed.). Conservation Physiology. 11 (1), coad082. doi:10.1093/conphys/coad082.

Rolland, R.M., Parks, S.E., Hunt, K.E., Castellote, M., Corkeron, P.J., Nowacek, D.P., Wasser, S.K. & Kraus, S.D. (2012) Evidence that ship noise increases stress in right whales. Proceedings of the Royal Society B: Biological Sciences. 279 (1737), 2363–2368. doi:10.1098/rspb.2011.2429.

Sullivan, F.A. & Torres, L.G. (2018) Assessment of vessel disturbance to gray whales to inform sustainable ecotourism. The Journal of Wildlife Management. 82 (5), 896–905. doi:10.1002/jwmg.21462.
Rock-solid GRANITE: Scaling the disturbance response of individual whales up to population level impacts

By Lisa Hildebrand, PhD student, OSU Department of Fisheries & Wildlife, Geospatial Ecology of Marine Megafauna Lab

Since early May, much of the GEMM Lab has been consumed by the GRANITE project, which stands for Gray whale Response to Ambient Noise Informed by Technology and Ecology. Two weeks ago, PhD student Clara Bird discussed our field work preparations, and since May 20th we have conducted five successful days of field work (and one unsuccessful day due to fog). If you are now expecting a blog about the data we have collected so far and whales we encountered, I am sorry to disappoint you. Rather, I want to take a big step back and provide the context of the GRANITE project as a whole, explain why this project and data collection is so important, and discuss what it is that we hope to achieve with our ever-growing, multidisciplinary dataset and team.

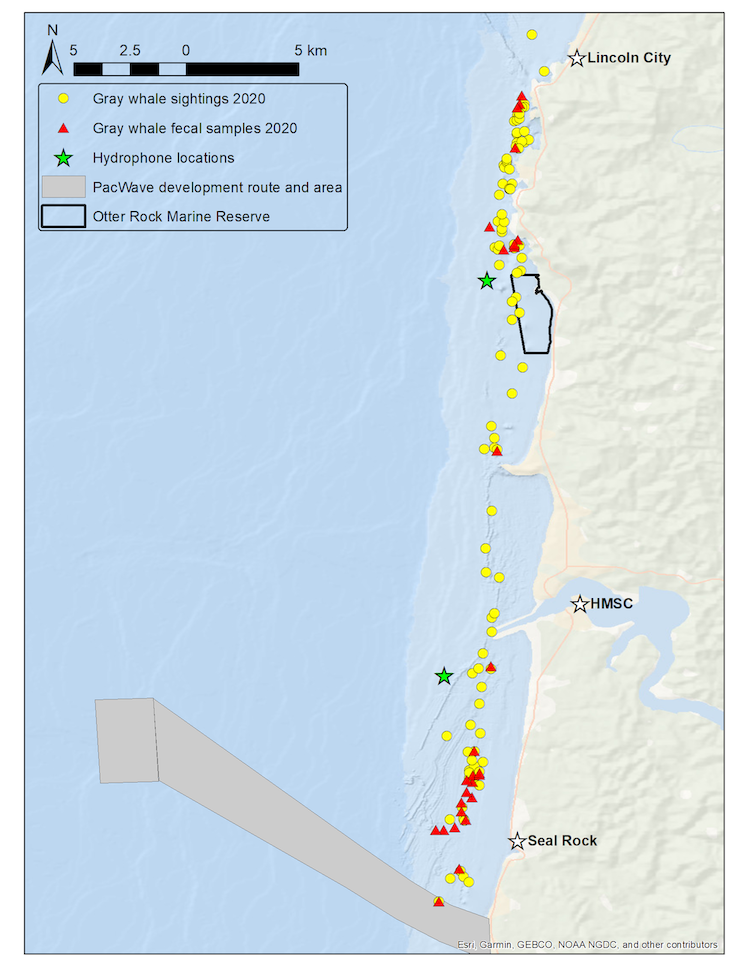
We use the Pacific Coast Feeding Group (PCFG) of gray whales that forage off the Oregon coast as our study system to better understand the ecological and physiological response of baleen whales to multiple stressors. Our field methodology includes replicate physiological and ecological sampling of this accessible baleen whale population with synoptic measurement of multiple types of stressors. We collect fecal samples for hormone analysis, conduct drone overflights of whales to collect body condition and behavioral data, record the ambient soundscape through deployment of two hydrophones, and conduct whale photo-identification to link all data streams to each individual whale of known sex, estimated age, and reproductive status. We resample these data from multiple individuals within and between summer foraging seasons, while exposed to different potential stressors occurring at different intensities and temporal periods and durations. The hydrophones are strategically placed with one in a heavily boat-trafficked (and therefore noisy) area close to the Port of Newport, while the second is located in a relatively calm (and therefore quieter) spot near the Otter Rock Marine Reserve (Fig. 1). These hydrophones provide us with information about both natural (e.g. killer whales, wind, waves) and anthropogenic (e.g. boat traffic, seismic survey, marine construction associated with PacWave wave energy facility development) noise that may affect gray whales. During sightings with whales, we also drop GoPro cameras and sample for prey to better understand the habitats where whales forage and what they might be consuming.

Figure 1. Map of GRANITE study area from Seal Rock to Lincoln City with gray whale sightings (yellow circles) and and fecal samples collected (red triangles) from the 2020 field season. Green stars represent the two hydrophone locations. Source: L. Torres.

GEMM Lab PI Dr. Leigh Torres initiated this research project in 2015 and established partnerships with acoustician Dr. Joe Haxel and (then) PhD student Dr. Leila Lemos. Since then, the team working on this project has grown considerably to provide expertise in the various disciplines that the project integrates. Leigh is currently joined at the GRANITE helm by 4 co-PIs: Dr. Haxel, endocrinologist Dr. Kathleen Hunt, biological statistician Dr. Leslie New, and physiologist Dr. Loren Buck. Drs. Alejandro Fernandez Ajo, KC Bierlich and Enrico Pirotta are postdoctoral scholars who are working on the endocrinology, photogrammetry, and biostatistical modelling components, respectively. Finally, Clara and myself are partially funded through this project for our PhD research, with Clara focusing on the links between behavior, body condition, individualization, and habitat, while I am tackling questions about the recruitment and site fidelity of the PCFG (more about these topics below). 

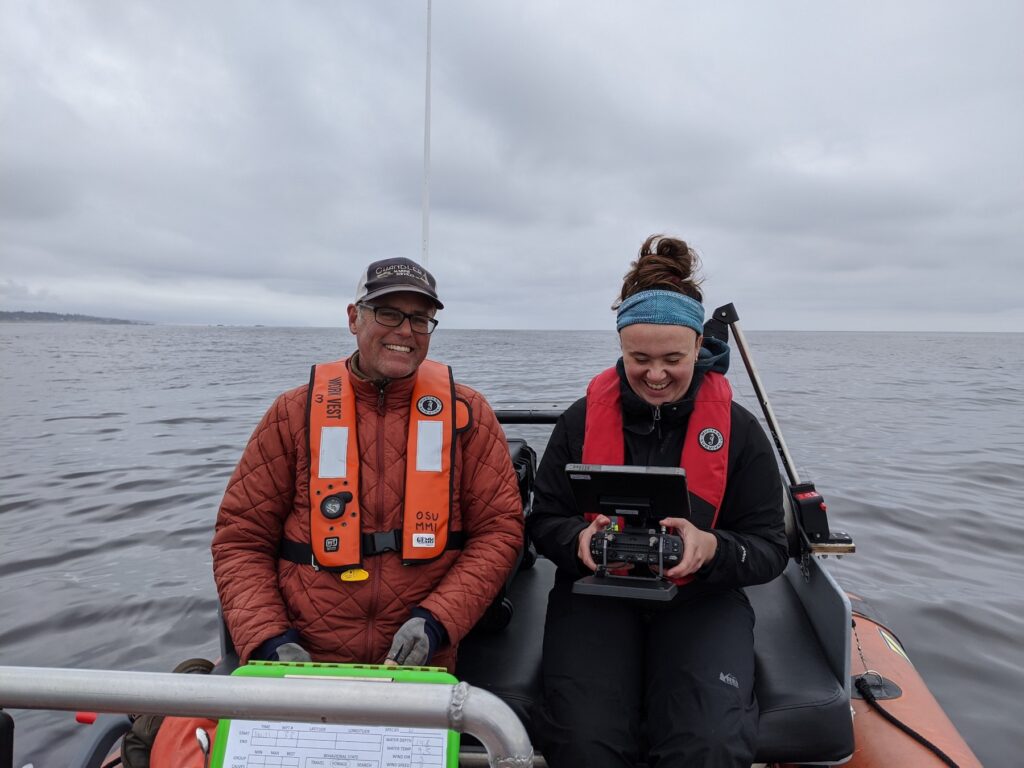
Faculty Research Assistant Todd Chandler supervises PhD student Clara Bird during her maiden drone flight over a whale. Source: L. Torres.

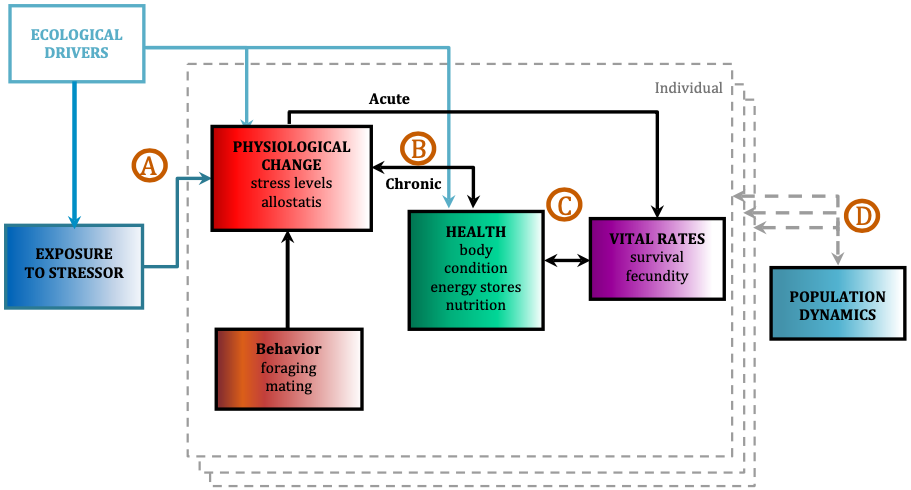
The ultimate goal of this project is to use the PCFG as a case study to quantify baleen whale physiological response to different stressors and model the subsequent impacts on the population by implementing our long-term, replicate dataset into a framework called Population consequences of disturbance (PCoD; Fig. 2). PCoD is built upon the underlying concept that changes in behavior and/or physiology caused by disturbance (i.e. noise) affect the fitness of individuals by impacting their health and vital rates, such as survival, reproductive success, and growth rate (Pirotta et al. 2018). These impacts at the individual level may (or may not) affect the population as a whole, depending on what proportion of individuals in the population are affected by the disturbance and the intensity of the disturbance effect on each individual. The PCoD framework requires quantification of four stages: a) the physiological and/or behavioral changes that occur as a result of exposure to a stressor (i.e. noise), b) the acute effects of these physiological and/or behavioral responses on individual vital rates, and their chronic effects via individual health, c) the way in which changes in health may affect the vital rates of individuals, and d) how changes in individual vital rates may affect population dynamics (Fig. 2; Pirotta et al. 2018). While four stages may not sound like a lot, the amount and longevity of data needed to quantify each stage is immense. 

Figure 2. Conceptual framework of the population consequences of disturbance (PCoD). Letters (A-D) represent the four stages that require quantification in order for PCoD to be implemented. Each colored box represents external (ecological drivers, stressors) and internal (physiology, health, vital rates, behavior) factors that can change over time that are measured for each individual whale (dashed grey boundary line). The effects are then integrated across all individuals in the population to project their effects on the population’s dynamics. Figure and caption adapted from Pirotta et al. 2018.

The ability to detect a change in behavior or physiology often requires an understanding of what is “normal” for an individual, which we commonly refer to as a baseline. The best way to establish a baseline is to collect comprehensive data over a long time period. With our data collection efforts since 2015 of fecal samples, drone flights and photo identification, we have established useful baselines of behavioral and physiological data for PCFG gray whales. These baselines are particularly impressive since it is typically difficult to collect repeated measurements of hormones and body condition from the same individual baleen whale across multiple years. These repeated measurements are important because, like all mammals, hormones and body condition vary across life history phases (i.e., with pregnancy, injury, or age class) and across time (i.e., good or bad foraging conditions). To achieve these repeated measurements, GRANITE exploits the high degree of intra- and inter-annual site fidelity of the PCFG, their accessibility for study due to their affinity for nearshore habitat use, and the long-term sighting history of many whales that provides sex and approximate age information. Our work to-date has already established a few important baselines. We now know that the body condition of PCFG gray whales increases throughout a foraging season and can fluctuate considerably between years (Soledade Lemos et al. 2020). Furthermore, there are significant differences in body condition by reproductive state, with calves and pregnant females displaying higher body conditions (Soledade Lemos et al. 2020). Our dataset has also allowed us to validate and quantify fecal steroid and thyroid hormone metabolite concentrations, providing us with putative thresholds to identify a stressed vs. not stressed whale based on its hormone levels (Lemos et al. 2020).

PhD student Lisa Hildebrand and GRANITE co-PI Dr. Kathleen Hunt collecting a fecal sample. Source: L. Torres.

We continue to collect data to improve our understanding of baseline PCFG physiology and behavior, and to detect changes in their behavior and physiology due to disturbance events. All these data will be incorporated into a PCoD framework to scale from individual to population level understanding of impacts. However, more data is not the only thing we need to quantify each of the PCoD stages. The implementation of the PCoD framework also depends on understanding several aspects of the PCFG’s population dynamics. Specifically, we need to know whether recruitment to the PCFG population occurs internally (calves born from “PCFG mothers” return to the PCFG) or externally (immigrants from the larger Eastern North Pacific gray whale population joining the PCFG as adults). The degree of internal or external recruitment to the PCFG population should be included in the PCoD model as a parameter, as it will influence how much individual level disturbance effects impact the overall health and viability of the population. Furthermore, knowing residency times and home ranges of whales within the PCFG is essential to understand exposure durations to disturbance events. 

To assess both recruitment and residency patterns of the PCFG, I am undertaking a large photo-identification effort, which includes compiling sightings and photo data across many years, regions, and collaborators. Through this effort we aim to identify calves and their return rate to the population, the rate of new adult recruits to the population, and the spatial residency of individuals in our study system. Although photo-id is a basic, commonplace method in marine mammal science, its role is critical to tracking individuals over time to understand population dynamics (in a non-invasive manner, no less). A large portion of my PhD research will focus on the tedious yet rewarding task of photo-id data management and matching in order to address these pressing knowledge gaps on PCFG population dynamics needed to implement the PCoD model that is an ultimate goal of GRANITE. I am just beginning this journey and have already pinpointed many analytical and logistical hurdles that I need to overcome. I do not anticipate an easy path to addressing these questions, but I am extremely eager to dig into the data, reveal the patterns, and integrate the findings into our rock-solid GRANITE project.  

Funding for the GRANITE project comes from the Office of Naval Research, the Department of Energy, Oregon Sea Grant, the NOAA/NMFS Ocean Acoustics Program, and the OSU Marine Mammal Institute.

References

Lemos, L.S., Olsen, A., Smith, A., Chandler, T.E., Larson, S., Hunt, K., and L.G. Torres. 2020. Assessment of fecal steroid and thyroid hormone metabolites in eastern North Pacific gray whales. Conservation Physiology 8:coaa110.

Pirotta, E., Booth, C.G., Costa, D.P., Fleishman, E., Kraus, S.D., Lusseau, D., Moretti, D., New, L.F., Schick, R.S., Schwarz, L.K., Simmons, S.E., Thomas, L., Tyack, P.L., Weise, M.J., Wells, R.S., and J. Harwood. 2018. Understanding the population consequences of disturbance. Ecology and Evolution 8(19):9934-9946.

Soledade Lemos, L., Burnett, J.D., Chandler, T.E., Sumich, J.L., and L.G. Torres. 2020. Intra- and inter-annual variation in gray whale body condition on a foraging ground. Ecosphere 11(4):e03094.

Humans Hide and Wildlife Thrive: Human-mediated ecosystem changes during a pandemic

By: Alexa Kownacki, Ph.D. Student, OSU Department of Fisheries and Wildlife, Geospatial Ecology of Marine Megafauna Lab

We live in an interesting time. Many of us academic scientists sit in the confines of our homes, reading scientific papers, analyzing years-worth of data, working through a years-worth of house projects, or simply watching Netflix. While we are confined to a much smaller area, wildlife is not.  

During this challenging situation we have unique opportunities to study what happens when people are not outside for recreation. All of us who feel trapped inside our homes are not only saving human lives, we are changing ecosystems. Humans are constantly molding our ecosystems on fine and grand scales, from xeriscaping our lawns with native, drought-resistant plants to developing large plots of land for new homes. We manipulate nature, for better or for worse.

So, what happens when we change our behavior? Rather than driving, we’re gardening, instead of playing at parks, we’re playing board games at our kitchen tables; we as a society are completely changing our habitat-use patterns. When any top predator changes its habitat-use, switches niches, or drastically changes its behaviors, there are top-down ecosystem effects. When one species changes its behavior, there are major downstream impacts on predation, foraging, diet, and habitat use. For example, when bluegill sunfish underwent large shifts in both diet and habitat, major predator-mediated habitat use changes in other species occurred (Mittelbach 1986). There are multiple studies describing the impacts of human-mediated drivers on ecosystems worldwide. In coastal environments, anthropogenic activities, specifically shipping, industry, and urban development, dramatically change both the coastal and marine ecosystems (Mead et al. 2013).

The highly developed coastline along Los Angeles, CA is a prime example of urban development. (Image source: LA Magazine.)

By far the most pronounced example of how an international halt on travel can alter ecosystems comes from the tragic terrorist attacks on September 11, 2001. Prior to this current, viral pandemic, the events following 9/11 were the first time that nearly all major transit stopped in the USA—including airplanes and major shipping traffic. This halt created a unique opportunity to study some of the secondary impacts, such as a reduction in shipping traffic noise, on cetaceans. Following 9/11, there was a six decibel decrease in underwater noise that co-occurred with a decrease in stress hormones of endangered North Atlantic right whales (Rolland et al. 2012). When I first read about this study, my first thought was “leave it to scientists to make the best out of a terrible situation.” Truly, learning from nature, even in the darkest of days, is an incredible skillset. Research like this inspires me to ask questions about what changes are happening in ecosystems now because of recent events. For example, the entire port of San Diego, its beaches and bays, are closed for all recreational activity and I wonder how this reduction in traffic is similar to the post-9/11 study but on bottlenose dolphins, gray whales, and pinnipeds that are coast-associated. Are urban and suburban neighborhoods slowly becoming more rural and making space for wildlife again?

My dad lives in a suburban neighborhood of San Diego, CA. In the past few weeks, his “Ring doorbell camera” captured a bobcat walking along the raised brick path multiple times. (Media source: Eric Kownacki)

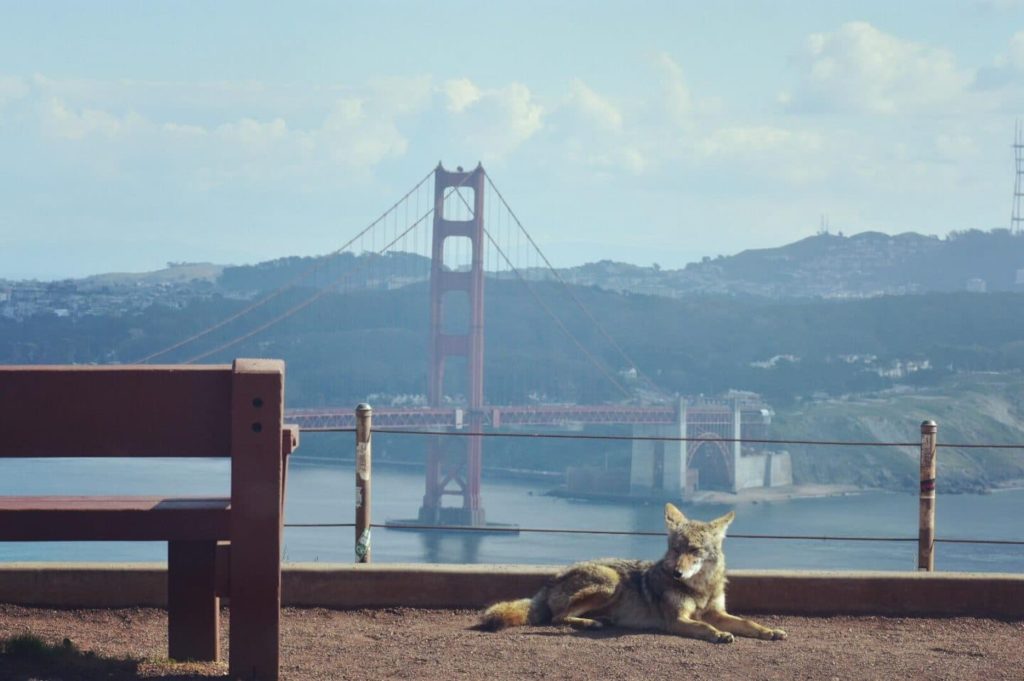
There is increasing news coverage on wild animals “taking over” cities. Dr. Leila Lemos touched on this earlier with her blog post centering on how academics are changing their means of teaching, conferencing, and learning. There are photos of wild goats running through the streets of Wales, UK, coyotes roaming the streets of San Francisco, CA, USA, monkeys swarming the streets in Thailand, pumas wandering the streets of Santiago, Chile, and Sika deer peering into empty restaurants in Nara, Japan (Colarossi 2020). In reality, this wildlife was likely part of the ecosystem prior to the formation of these cities but was forced out of the more urban centers. As we sit in our homes, rather than looking bleakly onto empty streets, we can search for wildlife, create a backyard birding competition with your friends, guess which flowers will bloom first, and ask questions of our changing ecosystems.

Coyote at a park in northern California with the San Francisco Golden Gate Bridge in the background. (Image source: u/beccatravels via Reddit)

Citations:

Colarossi, Natalie. “Photos Show Wild Animals Roaming Empty Streets as Coronavirus Lockdowns Keep Humans Inside.” Insider, Insider, 2 Apr. 2020, www.insider.com/photos-show-animals-roaming-empty-streets-during-coronavirus-lockdowns-2020-4#in-santiago-chile-a-wild-puma-was-seen-pacing-through-the-quiet-streets-according-to-the-chilean-agricultural-and-livestock-service-the-puma-came-down-from-the-mountains-after-seeing-the-streets-were-largely-empty-6.

Mead, A., Griffiths, C.L., Branch, G.M., McQuaid, C.D., Blamey, L.K., Bolton, J.J., Anderson, R.J., Dufois, F., Rouault, M., Froneman, P.W. and Whitfield, A.K., 2013. Human-mediated drivers of change—impacts on coastal ecosystems and marine biota of South Africa. African Journal of Marine Science35(3), pp.403-425.

Mittelbach, Gary. 1986. Predator-mediated habitat use: some consequences for species interactions. Environ Biol Fish 16, 159–169. https://doi.org/10.1007/BF00005168

Rolland, R.M., Parks, S.E., Hunt, K.E., Castellote, M., Corkeron, P.J., Nowacek, D.P., Wasser, S.K. and Kraus, S.D., 2012. Evidence that ship noise increases stress in right whales. Proceedings of the Royal Society B: Biological Sciences279(1737), pp.2363-2368.

Robots are taking over the oceans

By Leila Lemos, PhD Student

In the past few weeks I read an article on the use of aquatic robots in the ocean for research. Since my PhD project uses technology, such as drones and GoPros, to monitor body condition of gray whales and availability of prey along the Oregon coast, I became really interested by the new perspective these robots could provide. Drones produce aerial images while GoPros generate an underwater-scape snapshot. The possible new perspective provided by a robot under the water could be amazing and potentially be used in many different applications.

The article was published on March 21st by The New York Times, and described a new finned robot named “SoFi” or “Sophie”, short for Soft Robotic Fish (Figure 1; The New York Times 2018). The aquatic robot was designed by scientists at the Massachusetts Institute of Technology (MIT) Computer Science and Artificial Intelligence Lab, with the purpose of studying marine life in their natural habitats.

Figure 1: “SoFi”, a robotic fish designed by MIT scientists.
Source: The New York Times 2018.


SoFi’s  first swim trial occurred in a coral reef in Fiji, and the footage recorded can be seen in the following video:


SoFi can swim at depths up to 18 meters and at speeds up to half-its-body-length a second (average of 23.5 cm/s in a straight path; Katzschmann et al. 2018). Sofi can swim for up to ~40 minutes, as limited by battery time. The robot is also well-equipped (Figure 2). It has a compact buoyancy control mechanism and includes a wide-view video camera, a hydrophone, a battery, environmental sensors, and operating and communication systems. The operating and communication systems allow a diver to issue commands by using a controller that operates through sound waves.

Figure 2: “SoFi” system subcomponents overview.
Source: Katzschmann et al. 2018.


The robot designers highlight that while SoFi was swimming, fish didn’t seem to be bothered or get scared by SoFi’s presence. Some fish were seen swimming nearby the robot, suggesting that SoFi has the potential to integrate into the natural underwater environment and therefore record undisturbed behaviors. However, a limitation of this invention is that SoFi needs a diver on scene to control the robot. Therefore, SoFi’s study of marine life without human interference may be compromised until technology develops further.

Another potential impact of SoFi we might be concerned about is noise. Does this device produce noise levels that marine fauna can sense or maybe be stress by? Unfortunately, the answer is yes. Even if fish don’t seem to be bothered by SoFi’s presence, it might bother other animals with hearing sensitivity in the same frequency range of SoFi. Katzschmann and colleagues (2018) explained that they chose a frequency to operate SoFi that would minimally impact marine fauna. They studied the frequencies used by the aquatic animals and, since the hearing ranges of most aquatic species decays significantly above 10 KHz, they selected a frequency above this range (i.e., 36 KHz). However, this high frequency range can be sensed by some species of cetaceans and pinnipeds, but negative affects on these animals will be dependent on the sound amplitude that is produced.

Although not perfect (but what tool is?), SoFi can be seen as a great first step toward a future of underwater robots to assist research efforts.  Battery life, human disturbance, and noise disturbance are limitations, but through thoughtful application and continued innovation this fishy tool can be the start of something great.

The use of aquatic robots, such as SoFi, can help us advance our knowledge in underwater ecosystems. These robots could promote a better understanding of marine life in their natural habitat by studying behaviors, interactions and responses to threats. These robots may offer important new tools in the protection of animals against the effects caused by anthropogenic activities. Additionally, the use of aquatic robots in scientific research may substitute remote operated vehicles and submersibles in some circumstances, such as how drones are substituting for airplanes sometimes, thus providing a less expensive and better-tolerated way of monitoring wildlife.

Through continued multidisciplinary collaboration by robot designers, biologists, meteorologists, and more, innovation will continue allowing data collection with minimal to non-disturbance to the wildlife, providing lower costs and higher safety for the researchers.

It is impressive to see how technology efforts are expanding into the oceans. As drones are conquering our skies today and bringing so much valuable information on wildlife monitoring, I believe that the same will occur in our oceans in a near future, assisting in marine life conservation.


References:

Katzschmann RK, DelPreto J, MacCurdy R, Rus D. 2018. Exploration of Underwater Life with an Acoustically Controlled Soft Robotic Fish. Sci. Robot. 3, eaar3449. DOI: 10.1126/scirobotics.aar3449.

The New York Times. 2018. Robotic Fish to Keep a Fishy Eye on the Health of the Oceans. Available at: https://www.nytimes.com/2018/03/21/science/robot-fish.html.

The five senses of fieldwork

By Leila Lemos, PhD student


This summer was full of emotions for me: I finally started my first fieldwork season after almost a year of classes and saw my first gray whale (love at first sight!).

During the fieldwork we use a small research vessel (we call it “Red Rocket”) along the Oregon coast to collect data for my PhD project. We are collecting gray whale fecal samples to analyze hormone variations; acoustic data to assess ambient noise changes at different locations and also variations before, during and after events like the “Halibut opener”; GoPro recordings to evaluate prey availability; photographs in order to identify each individual whale and assess body and skin condition; and video recordings through UAS (aka “drone”) flights, so we can measure the whales and classify them as skinny/fat, calf/juvenile/adult and pregnant/non-pregnant.

However, in order to collect all of these data, we need to first find the whales. This is when we use our first sense: vision. We are always looking at the horizon searching for a blow to come up and once we see it, we safely approach the animal and start watching the individual’s behavior and taking photographs.

If the animal is surfacing regularly to allow a successful drone overflight, we stay with the whale and launch the UAS in order to collect photogrammetry and behavior data.

Each team member performs different functions on the boat, as seen in the figure below.

Figure 1: UAS image showing each team members’ functions in the boat at the moment just after the UAS launch.


While one member pilots the boat, another operates the UAS. Another team member is responsible for taking photos of the whales so we can match individuals with the UAS videos. And the last team member puts the calibration board of known length in the water, so that we can later calculate the exact size of each pixel at various UAS altitudes, which allows us to accurately measure whale lengths. Team members also alternate between these and other functions.

Sometimes we put the UAS in the air and no whales are at the surface, or we can’t find any. These animals only stay at the surface for a short period of time, so working with whales can be really challenging. UAS batteries only last for 15-20 minutes and we need to make the most of that time as we can. All of the members need to help the UAS pilot in finding whales, and that is when, besides vision, we need to use hearing too. The sound of the whale’s respiration (blow) can be very loud, especially when whales are closer. Once we find the whale, we give the location to the UAS pilot: “whale at 2 o’clock at 30 meters from the boat!” and the pilot finds the whale for an overflight.

The opposite – too many whales around – can also happen. While we are observing one individual or searching for it in one direction, we may hear a blow from another whale right behind us, and that’s the signal for us to look for other individuals too.

But now you might be asking yourself: “ok, I agree with vision and hearing, but what about the other three senses? Smell? Taste? Touch?” Believe it or not, this happens. Sometimes whales surface pretty close to the boat and blow. If the wind is in our direction – ARGHHHH – we smell it and even taste it (after the first time you learn to close your mouth!). Not a smell I recommend.

Fecal samples are responsible for the 5th sense: touch!

Once we identify that the whale pooped, we approach the fecal plume in order to collect as much fecal matter as possible (Fig.2).

Figure 2: A: the poop is identified; B: the boat approaches the feces that are floating at the surface (~30 seconds); C: one of the team members remains at the bow of the boat to indicate where the feces are; D: another team member collects it with a fine-mesh net. Filmed under NOAA/NMFS permit #16111 to John Calambokidis).


After collecting the poop we transfer all of it from the net to a small jar that we then keep cool in an ice chest until we arrive back at the lab and put it in the freezer. So, how do we transfer the poop to the jar? By touching it! We put the jar inside the net and transfer each poop spot to the jar with the help of water pressure from a squeeze bottle full of ambient salt water.

Figure 3: Two gray whale individuals swimming around kelp forests. Filmed under NOAA/NMFS permit #16111 to John Calambokidis).


That’s how we use our senses to study the whales, and we also use an underwater sensory system (a GoPro) to see what the whales were feeding on.

GoPro video of mysid swarms that we recorded near feeding gray whales in Port Orford in August 2016:

Our fieldwork is wrapping up this week, and I can already say that it has been a success. The challenging Oregon weather allowed us to work on 25 days: 6 days in Port Orford and 19 days in the Newport and Depoe Bay region, totaling 141 hours and 50 minutes of effort. We saw 195 whales during 97 different sightings and collected 49 fecal samples. We also performed 67 UAS flights, 34 drifter deployments (to collect acoustic data), and 34 GoPro deployments.

It is incredible to see how much data we obtained! Now starts the second part of the challenge: how to put all of this data together and find the results. My next steps are:

– photo-identification analysis;

– body and skin condition scoring of individuals;

– photogrammetry analysis;

– analysis of the GoPro videos to characterize prey;

– hormone analysis laboratory training in November at the Seattle Aquarium


For now, enjoy some pictures and a video we collected during the fieldwork this summer. It was hard to choose my favorite pictures from 11,061 photos and a video from 13 hours and 29 minutes of recording, but I finally did! Enjoy!

Figure 4: Gray whale breaching in Port Orford on August 27th. (Photo by Leila Lemos; Taken under NOAA/NMFS permit #16111 to John Calambokidis).


Figure 5: Rainbow formation through sunlight refraction on the water droplets of a gray whale individual's blow in Newport on September 15th. (Photo by Leila Lemos; Taken under NOAA/NMFS permit #16111 to John Calambokidis).
Figure 5: Rainbow formation through sunlight refraction on the water droplets of a gray whale individual’s blow in Newport on September 15th. (Photo by Leila Lemos; Taken under NOAA/NMFS permit #16111 to John Calambokidis).


Likely gray whale nursing behavior (Taken under NOAA/NMFS permit #16111 to John Calambokidis):