How fat do baleen whales get? Recent publication shows how humpback whales increase their body condition over the foraging season. 

Dr. KC Bierlich, Postdoctoral Scholar, OSU Department of Fisheries, Wildlife, & Conservation Sciences, Geospatial Ecology of Marine Megafauna (GEMM) Lab

Traveling across oceans takes a lot of energy. Most baleen whales use stored energy acquired on their summer foraging grounds to support the costs of migration to and reproduction on their winter breeding grounds. Since little, if any, feeding takes place during the migration and winter season, it is essential that baleen whales obtain enough food to increase their fat reserves to support reproduction. As such, baleen whales are voracious feeders, and they typically depart the foraging grounds much fatter than when they had arrived. 

So, how fat do baleen whales typically get by the end of the foraging season, and how does this differ across reproductive classes, such as a juvenile female vs. a pregnant female? Understanding these questions is key for identifying what a typical “healthy” whale looks like, information which can then help scientists and managers monitor potential impacts from environmental and anthropogenic stressors. In this blog, I will discuss a recent publication in Frontiers in Marine Science (https://doi.org/10.3389/fmars.2022.1036860) that is from my PhD dissertation with the Duke University Marine Robotics and Remote Sensing (MaRRS) Lab, and also includes GEMM lab members Allison Dawn and Clara Bird. In this study, we analyzed how humpback whales (Megaptera novaeangliae) along the Western Antarctic Peninsula (WAP) increase their fat reserves throughout the austral summer foraging season (Bierlich et al., 2022). This work also helps provide insight to the GEMM Lab’s GRANITE project (Gray whale Response to Ambient Noise Informed by Technology and Ecology), where we are interested in how Pacific Coast Feeding Group (PCFG) gray whales increase their energy reserves in response to environmental variability and increasing human activities. 

Eastern South Pacific humpback whales, identified as Stock G by the International Whaling Commission, travel over 16,000 km between summer foraging grounds along the WAP and winter breeding grounds between Ecuador and Costa Rica (Fig. 1). Like most baleen whales, Stock G humpback whales were heavily exploited by 20th century commercial whaling. Recent evidence suggests that this population is recovering, with an estimated increase in population size of ~7,000 individuals in 2000 to ~19,107 in 2020 (Johannessen et al., 2022). 

However, there are long-term concerns for this population. The WAP is one of the fastest warming regions on the planet, and regional populations of krill, an important food source for humpback whales, have declined steeply over the past half-century. Additionally, the WAP has seen a rapid expansion of human activities, such as tourism and krill fishing. Specifically, the WAP has experienced an increase in tourism from a total of 6,700 visitors from 59 voyages in 1990 to 73,000 visitors from 408 voyages in 2020, which may be causing increased stress levels amongst Stock G (Pallin et al., 2022). Furthermore, the krill fishery has increased harvest activities in key foraging areas for humpback whales (Reisinger et al., 2022). Understanding how humpback whales increase their energy reserves over the course of the foraging season can help researchers establish a baseline to monitor future impacts from climate change and human activities. This work also provides an opportunity for comparisons to other baleen whale populations that are also exposed to multiple stressors, such as the PCFG gray whales off the Newport Coast who are constantly exposed to vessel traffic and at risk of entanglement from fishing gear. 
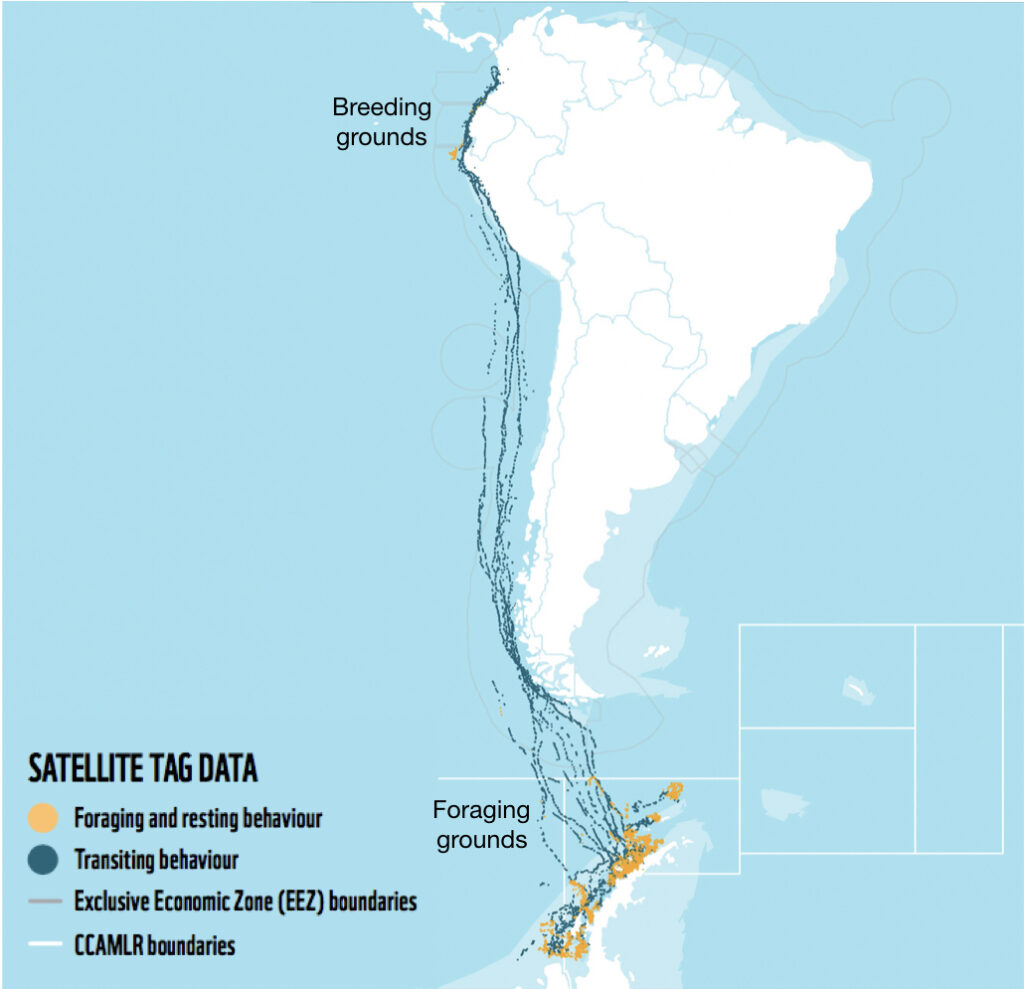
Figure 1. The migration route of the Stock G humpback whale population. Figure adapted from Whales of the Antarctic Peninsula Report, WWF 2018.

To understand how humpback whales increase their energy reserves throughout the foraging season, we collected drone imagery of whales along the WAP between November and June, 2017-2019 (Fig. 2). We used these images to measure the length and width of the whale to estimate body condition, which represents an animal’s relative energy reserve and can reflect foraging success (see previous blog). We collected drone imagery from a combination of research stations (Palmer Station), research vessels (Laurence M. Gould), and tour ships (One Ocean Expeditions). We used several different drones types and accounted for measurement uncertainty associated with the camera, focal length lens, altitude, and altimeter (barometer/LiDAR) from each drone (see previous blog and Bierlich et al., 2021a, 2021b). We also took biopsy samples to identify the sex of each individual and to determine if females were pregnant or not. 

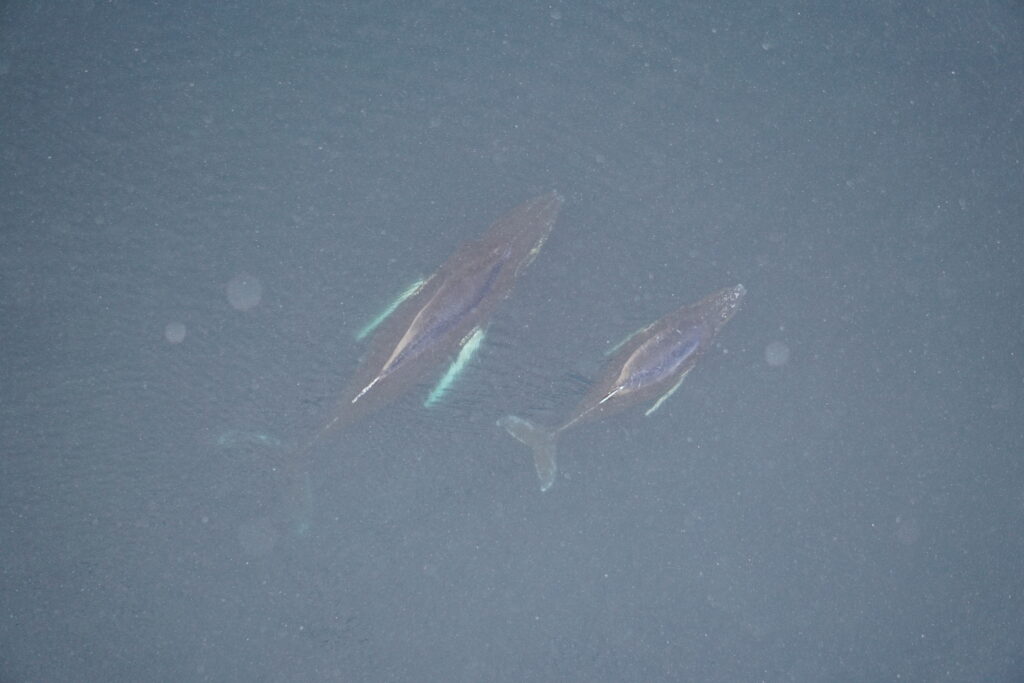
Figure 2. Two humpbacks gracefully swimming in the chilly water along the Western Antarctic Peninsula. Photo taken by KC Bierlich & the Duke University Marine Robotics and Remote Sensing (MaRRS) Lab.

Our final dataset included body condition measurements for 228 total individuals. We found that body condition increased linearly between November and June for each reproductive class, which included calves, juvenile females, juvenile whales of unknown sex, lactating females, mature whales of unknown sex, and non-pregnant females (Fig. 3). This was an interesting finding because a recent publication analyzing tagged whales from the same population found that humpback whales have high foraging rates in early season that then significantly decrease by February and March (Nichols et al., 2022). So, despite these reduced foraging rates throughout the season, humpback whales continue to gain substantial mass into the late season. This continued increase in body condition implies a change in krill abundance and/or quality into the late season, which may compensate for the lower feeding rates. For example, krill density and biomass increases by over an order of magnitude across the season (Reiss et al., 2017) and their lipid content increases by ~4x (Hagen et al., 1996). Thus, humpback whales likely compensate for their lower feeding rates by feeding on denser and higher quality krill, ultimately increasing their efficiency in energy deposition. 

Figure 3. Body condition, here measured as Body Area Index (BAI), increases linearly for each reproductive class across the austral summer foraging season (Nov – June) for humpback whales along the Western Antarctic Peninsula. The shading represents the uncertainty around the estimated relationship. The colors represent the month of data collection.

We found that body condition increase varied amongst reproductive classes. For example, lactating females had the poorest measures of body condition across the season, reflecting the high energetic demands of nursing their calves (Fig. 3). Conversely, non-pregnant females had the highest body condition at the start of the season compared to all the other classes, likely reflecting the energy saved and recovered by skipping breeding that year.  Calves, juvenile whales, and mature whales all reached similar levels of body condition by the end of the season, though mature whales will likely invest most of their energy stores toward reproduction, whereas calves and juveniles likely invest toward growth. We also found a positive relationship between the total length of lactating females and their calves, suggesting that bigger moms have bigger calves (Fig. 4). A similar trend has also been observed in other baleen whale species including southern and North Atlantic right whales (Christiansen et al., 2018; Stewart et al., 2022).
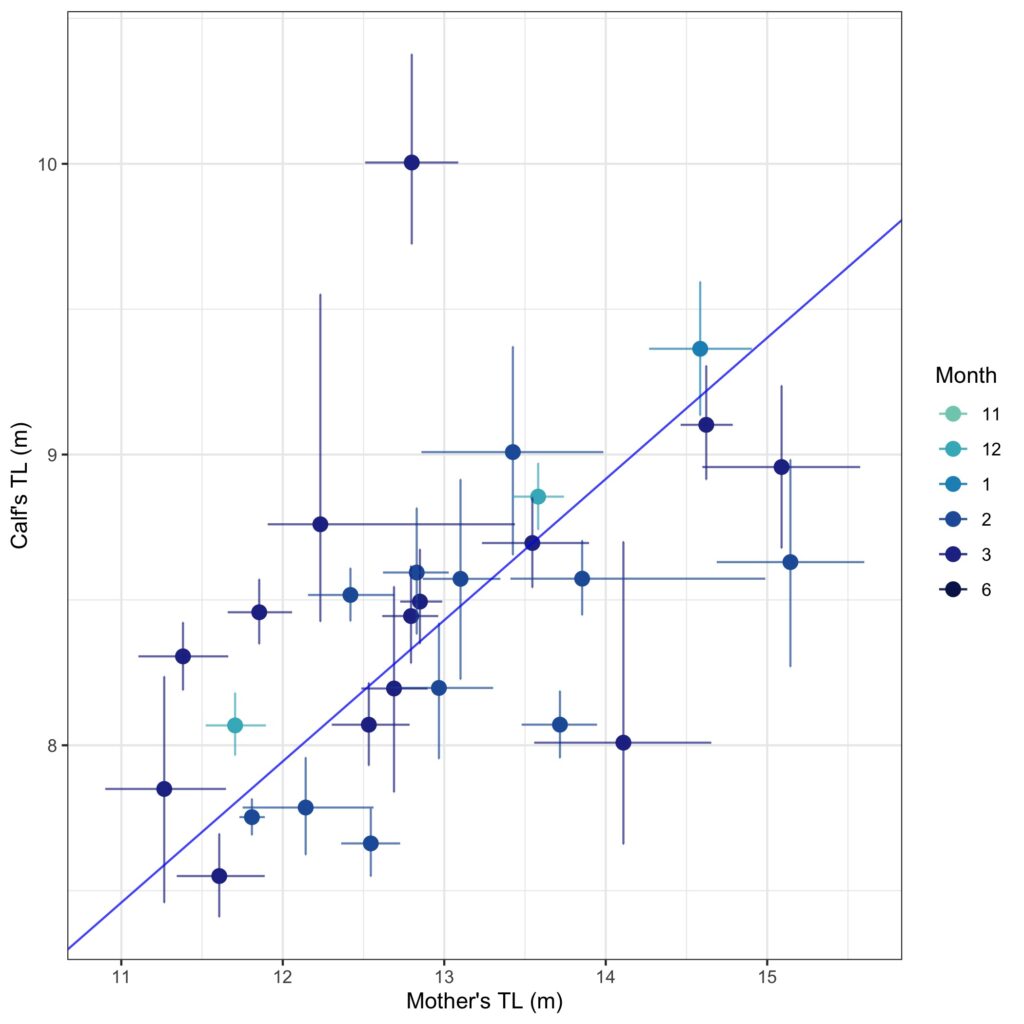
Figure 4. Big mothers have big calves. Total length (TL) measurement between mother-calf pairs. The bars around each point represents the uncertainty (95% highest posterior density intervals). The colors represent the month of data collection. The blue line represents the best fit from a Deming regression, which incorporate measurement uncertainty in both the independent (mother’s TL) and dependent variable (calf’s TL).

The results from the humpback study provide insight for my current work exploring how PCFG gray whales increase their energy reserves in relation to environmental variability and increasing human activities. Over the past seven years, the GEMM Lab has been collecting drone images of PCFG gray whales off the coast of Oregon to measure their body condition (see this GRANITE Project blog). Many of the individuals we encounter are seen across years and throughout the foraging season, providing an opportunity to evaluate how an individual’s body condition is influenced by environmental variation, stress levels, maturity, and reproduction. For example, we had nine total body condition measurements of a female PCFG whale named “Sole”, who had a curvilinear increase in body condition throughout the summer foraging season – a rapid increase in early season that slowed as the season progressed (Fig. 5). This raises many questions for us: is this how most PCFG whales typically increase their body condition during the summer? Is this increase different for pregnant or lactating females? How is this increase impacted by environmental variability or anthropogenic stressors? Repeated measurements of individuals, in addition to Sole, in different reproductive classes across different years will help us determine what body condition is considered a healthy range for gray whales. This is particularly important for monitoring any potential health consequences from anthropogenic stressors, such as vessel noise and traffic (see recent blog by GEMM Lab alum Leila Lemos). We are currently analyzing body condition measurements between 2016 – 2022, so stay tuned for upcoming results!

Figure 6. Body condition, here measured as Body Area Index (BAI), increases curvilinearly for “Sole”, a mature female Pacific Coat Feeding Group gray whale, imaged nine times along the Oregon coast in 2021. The colors represent the month of data collection. 

References

Bierlich, K. C., Hewitt, J., Bird, C. N., Schick, R. S., Friedlaender, A., Torres, L. G., et al. (2021a). Comparing Uncertainty Associated With 1-, 2-, and 3D Aerial Photogrammetry-Based Body Condition Measurements of Baleen Whales. Front. Mar. Sci. 8, 1–16. doi:10.3389/fmars.2021.749943.

Bierlich, K. C., Hewitt, J., Schick, R. S., Pallin, L., Dale, J., Friedlaender, A. S., et al. (2022). Seasonal gain in body condition of foraging humpback whales along the Western Antarctic Peninsula. Front. Mar. Sci. 9, 1–16. doi:10.3389/fmars.2022.1036860.

Bierlich, K., Schick, R., Hewitt, J., Dale, J., Goldbogen, J., Friedlaender, A., et al. (2021b). Bayesian approach for predicting photogrammetric uncertainty in morphometric measurements derived from drones. Mar. Ecol. Prog. Ser. 673, 193–210. doi:10.3354/meps13814.

Christiansen, F., Vivier, F., Charlton, C., Ward, R., Amerson, A., Burnell, S., et al. (2018). Maternal body size and condition determine calf growth rates in southern right whales. Mar. Ecol. Prog. Ser. 592, 267–281.

Hagen, W., Van Vleet, E. S., and Kattner, G. (1996). Seasonal lipid storage as overwintering strategy of Antarctic krill. Mar. Ecol. Prog. Ser. 134, 85–89. doi:10.3354/meps134085.

Johannessen, J. E. D., Biuw, M., Lindstrøm, U., Ollus, V. M. S., Martín López, L. M., Gkikopoulou, K. C., et al. (2022). Intra-season variations in distribution and abundance of humpback whales in the West Antarctic Peninsula using cruise vessels as opportunistic platforms. Ecol. Evol. 12, 1–13. doi:10.1002/ece3.8571.

Nichols, R., Cade, D. E., Kahane-Rapport, S., Goldbogen, J., Simpert, A., Nowacek, D., et al. (2022). Intra-seasonal variation in feeding rates and diel foraging behavior in a seasonally fasting mammal, the humpback whale. Open Sci. 9, 211674.

Pallin, L. J., Botero-Acosta, N., Steel, D., Baker, C. S., Casey, C., Costa, D. P., et al. (2022). Variation in blubber cortisol levels in a recovering humpback whale population inhabiting a rapidly changing environment. Sci. Rep. 12, 1–13. doi:10.1038/s41598-022-24704-6.

Reisinger, R., Trathan, P. N., Johnson, C. M., Joyce, T. W., Durban, J. W., Pitman, R. L., et al. (2022). Spatiotemporal overlap of baleen whales and krill fisheries in the Antarctic Peninsula region. Front. Mar. Sci. doi:doi: 10.3389/fmars.2022.914726.

Reiss, C. S., Cossio, A., Santora, J. A., Dietrich, K. S., Murray, A., Greg Mitchell, B., et al. (2017). Overwinter habitat selection by Antarctic krill under varying sea-ice conditions: Implications for top predators and fishery management. Mar. Ecol. Prog. Ser. 568, 1–16. doi:10.3354/meps12099.

Stewart, J. D., Durban, J. W., Europe, H., Fearnbach, H., Hamilton, P. K., Knowlton, A. R., et al. (2022). Larger females have more calves : influence of maternal body length on fecundity in North Atlantic right whales. Mar. Ecol. Prog. Ser. 689, 179–189. doi:10.3354/meps14040.

To biopsy or not to biopsy? Reflecting on the impact of research activities on marine mammals in the wild

By Solène Derville, Postdoc, OSU Department of Fisheries, Wildlife, and Conservation Science, Geospatial Ecology of Marine Megafauna Lab

This blog is motivated by the recent publication I co-authored with my former PhD supervisor in New Caledonia (Garrigue & Derville 2022). As I am about to present our study entitled “Behavioral responses of humpback whales to biopsy sampling on a breeding ground: the influence of age-class, reproductive status, social context, and repeated sampling” as part of the Society for Marine Mammalogy Seminar Editor’s Selected Series, I have been reflecting on how my research impacts the animals I study.

The overwhelming majority of marine mammal scientists around the world agree that lethal sampling of whales and other marine mammals is unnecessary to fill current knowledge gaps and deplorable in a context of global biodiversity loss and habitat degradation (e.g., Clapham et al. 2003; Cote and Favaro 2016). More so, the academic community consistently seeks to improve the ethical framework within which research on live animals is conducted. While the study of free-living marine mammals poses challenges that are quite different than laboratory experiments, these practices are nonetheless discussed and questioned by the general public, managers, and the scientists themselves.

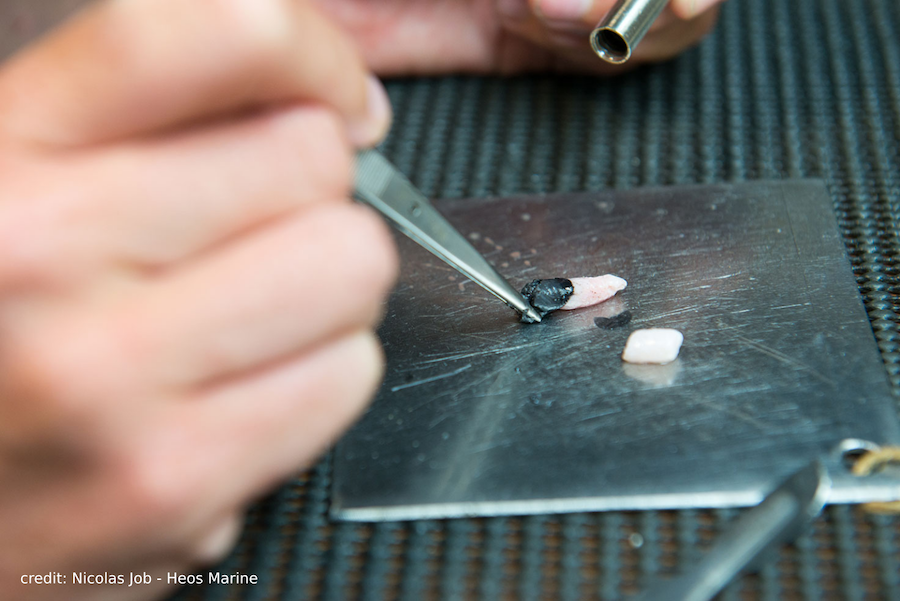
Among the field methods used to collect data from cetaceans, biopsy sampling is perhaps one of the most common. While it is sometimes possible to skim the water to collect the dead skin that individuals may shed during surface activities, cetaceans are most often biopsied remotely, using a veterinary rifle or a crossbow (Figure 1). The devices propel an arrow or a dart towards the animals to remove a small piece of skin and blubber inside a tip. These pieces can be a few centimeters to less than a centimeter long depending on the size of the species that is targeted (e.g., smaller darts are typically used for dolphins compared to large whales). The tissues sampled in this way are essential to address many biological, ecological, and behavioral questions that can ultimately inform conservation. Yet, biopsy sampling is invasive and a few studies have investigated its potential impact on humpback whales (Cantor et al., 2010; Clapham & Mattila, 1993), among other cetaceans (see review in Noren & Mocklin, 2012).

Figure 1: Conducting biopsy sampling of a humpback whale with a crossbow (above), and sample of skin and blubber collected during biopsy sampling (below). Photo credit: Nicolas Job – Heos Marine (MARACAS expeditions 2017, New Caledonia)

When presenting biopsy sampling to the general public, who hasn’t had to answer the tricky question “but does it hurt?”? Well I wish the whale could pop its head out the water and just tell me if it did! Measuring disturbance or pain is unfortunately extremely challenging in the case of cetaceans. Sophisticated methods that rely on new technologies (hormone analysis, drone video footages etc.) are being developed by the GEMM lab and other research groups to assess the impact of human activities around whales and should allow a better understanding of acute and chronic stress in the near future.

The strength of our study that was just published in the Marine Mammal Science journal is not technology, but rather the application of very standard approach over many years of consistent field work. In New Caledonia, in the southwest Pacific, humpback whales have been monitored as part of a long-term program initiated in the mid ‘90s by Dr. Claire Garrigue. Every austral winter, when whales regroup in these warm subtropical waters to breed and nurse their calves, biopsy samples were collected on individuals of all age-classes: adults, juveniles, and calves. During each of the 2,249 biopsies conducted throughout 20 years of research, the behavioral response of individual whales was qualitatively assessed and recorded. First, the response to the boat approach was recorded (whether the whale avoided the boat or not), then the response to the biopsy immediately after the shot, which was categorized as none, weak, moderate, or strong, based on general definitions provided by Weinrich et al. 1991. We investigated the frequency of these behavioral responses according to age-class, sex, female reproductive status, and social context, as well as the sampling system and habitat. We also assessed the effect of repeated biopsy sampling over time at the individual level.

We found that humpback whales did not show observable behavioral responses in over half of the cases (58.7%). Interestingly, we also discovered that calves did not respond more than adult whales, whereas juveniles stood out as the most sensitive age-class (Figure 2). Mothers with a calf reacted more often to the boat compared to non-lactating females and males, but paradoxically had the weakest responses to the biopsy sampling itself. We interpreted this dual response as the result of individually varying baseline stress levels, with some very shy mothers actively avoiding boats and others displaying a very oblivious attitude to both the boat’s proximity and to the brief impact of the biopsy sampling.

Figure 2: Responses of humpback whales to biopsy sampling according to age-class. Sample sizes are reported on the bar plot, except for strong responses (adults: 7, juveniles: 3, calves: 2). Figure reproduced from Garrigue & Derville 2022.

Although biopsies could have stressed animals in a way that was not measurable with our simple behavioral approach, it is still reassuring to see that most whales did not show a response, which allows us to assume that the impact of the biopsy was very minimal. This sort of methodological research is needed to inform managers responsible for the delivery of research permits and for researchers themselves to keep questioning their practices.

As I was analyzing this data and writing the paper, I became more aware of the value each of these tissue samples had. In the case of biopsy sampling, I believe that the gain in knowledge is ultimately worth the cost, but we should always bear in mind that this conclusion comes from a human perspective. From when I am in the field approaching whales, to when I analyze the hard-won data in my office, I think about the ethics of our work. As a supporter of open science, my take-away message from this research journey was that we have responsibility to use and share this biological data as much as possible. We should always aim at making the most out of data, but even more so when it is acquired by working with live animals. The cost is never null, so let’s make it worth it!

Ethics statement

Research was conducted under annual permits delivered by the competent authorities of the government of New Caledonia, and the Northern Province and Southern Province of New Caledonia. This study was carried out following the marine mammal treatment guidelines of the Society for Marine Mammalogy. The data that support the findings of this study are openly available here (DataSuds repository, doi: 10.23708/QYWDPO).

Did you enjoy this blog? Want to learn more about marine life, research, and conservation? Subscribe to our blog and get a weekly message when we post a new blog. Just add your name and email into the subscribe box below.

Loading

References

Cantor, M., Cachuba, T., Fernandes, L., & Engel, M. H. (2010). Behavioural reactions of wintering humpback whales (Megaptera novaeangliae) to biopsy sampling in the western South Atlantic. Journal of the Marine Biological Association of the United Kingdom, 90(8), 1701–1711. https://doi.org/10.1017/S0025315409991561

Clapham, P. J., & Mattila, D. K. (1993). Reactions of humpback whales to skin biopsy sampling on a West Indies breeding ground. Marine Mammal Science, 9(4), 382–391. https://doi.org/10.1111/j.1748-7692.1993.tb00471.x

Cote, Isabelle M., and Corinna Favaro. “The scientific value of scientific whaling.” Marine Policy 74 (2016): 88-90.

Garrigue, C., & Derville, S. (2022). Behavioral responses of humpback whales to biopsy sampling on a breeding ground : the influence of age-class , reproductive status , social context , and repeated sampling. Marine Mammal Science, 38, 102–117. https://doi.org/10.1111/mms.12848

Noren, D. P., & Mocklin, J. A. (2012). Review of cetacean biopsy techniques: Factors contributing to successful sample collection and physiological and behavioral impacts. Marine Mammal Science, 28(1), 154–199. https://doi.org/10.1111/ j.1748-7692.2011.00469.x

Phillip J. Clapham, Per Berggren, Simon Childerhouse, Nancy A. Friday, Toshio Kasuya, Laurence Kell, Karl-Hermann Kock, Silvia Manzanilla-Naim, Giuseppe Notabartolo Di Sciara, William F. Perrin, Andrew J. Read, Randall R. Reeves, Emer Rogan, Lorenzo Rojas-Bracho, Tim D. Smith, Michael Stachowitsch, Barbara L. Taylor, Deborah Thiele, Paul R. Wade, Robert L. Brownell, Whaling as Science, BioScience, Volume 53, Issue 3, March 2003, Pages 210–212, https://doi.org/10.1641/0006-3568(2003)053[0210:WAS]2.0.CO;2

Weinrich, M. T., Lambertsen, R. H., Baker, C. S., Schilling, M. R., & Belt, C. R. (1991). Behavioural responses of humpback whales (Megaptera novaeangliae) in the southern gulf of Maine to biopsy sampling. Reports of the International Whaling Commission, Special Issue 13,91–97

The many dimensions of a fat whale: Using drones to measure the body condition of baleen whales 

Dr. KC Bierlich, Postdoctoral Scholar, OSU Department of Fisheries, Wildlife, & Conservation Sciences, Geospatial Ecology of Marine Megafauna (GEMM) Lab

In my last blog, I discussed how to obtain morphological measurements from drone-based imagery of whales and the importance of calculating and considering uncertainty, as different drone platforms have varying levels of measurement uncertainty. But how does uncertainty scale and propagate when multiple measurements are combined, such as when measuring body condition of the whole animal? In this blog, I will discuss the different methods used for measuring body condition of baleen whales from drone-based imagery and how uncertainty differs between these metrics.

Body condition is defined as the energy stored in the body as a result of feeding and is assumed to indicate an animal’s overall health, as it reflects the balance between energy intake and investment toward growth, maintenance and reproduction (Peig and Green, 2009). Thus, body condition reflects the foraging success of an individual, as well as the potential for reproductive output and the quality of habitat. For example, female North American brown bears (Ursus arctos) in high quality habitats were in better body condition, produced larger litter sizes, and lived in greater population densities compared to females in lower quality habitats (Hilderbrand et al., 1999). As Dawn Barlow and Will Kennerley discussed in their recent blog, baleen whales are top predators and serve as ecosystem sentinels that shed light not only on the health of their population, but on the health of their ecosystem. As ocean climate conditions continue to change, monitoring the body condition of baleen whales is important to provide insight on how their population and ecosystem is responding. 

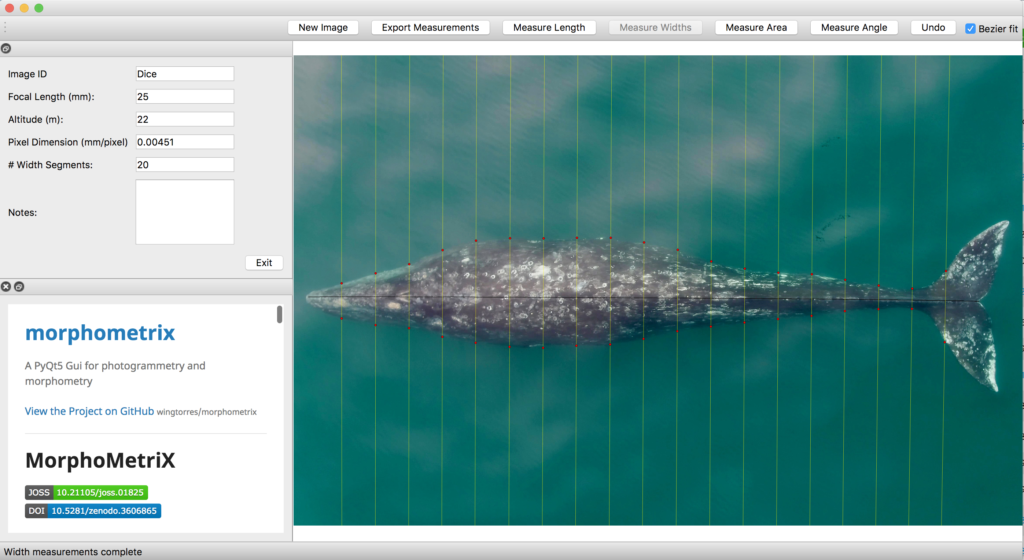
As discussed in a previous blog, drones serve as a valuable tool for obtaining morphological measurements of baleen whales to estimate their body condition. Images are imported into photogrammetry software, such as MorphoMetriX (Torres and Bierlich, 2020), to measure the total length of an individual and that is then divided into perpendicular width segments (i.e., in 5 or 10% increments) down the body (Fig. 1). These total length and width measurements are then used to estimate body condition in either 1-, 2-, or 3-dimensions: a single width (1D), a projected dorsal surface area (2D), or a body volume measure (3D). These 1D, 2D, and 3D measurements of body condition can then be standardized by total length to produce a relative measure of an individual’s body condition to compare among individuals and populations. 

Figure 1. An example of a Pacific Coast Feeding Group (PCFG) gray whale measured in MorphoMetriX (Torres & Bierlich, 2020).

While several different studies have used each of these dimensions to assess whale body condition, it is unclear how these measurements compare amongst each other. Importantly, it is also unclear how measurement uncertainty scales across these multiple dimensions and influences inference, which can lead to misinterpretation of data. For example, the surface area and volume of two geometrically similar bodies of different sizes are not related to their linear dimensions in the same ratio, but rather to the second and third power, respectively (i.e., x2 vs. x3).  Similarly, uncertainty should not be expected to scale linearly across 1D, 2D, and 3D body condition measurements. 

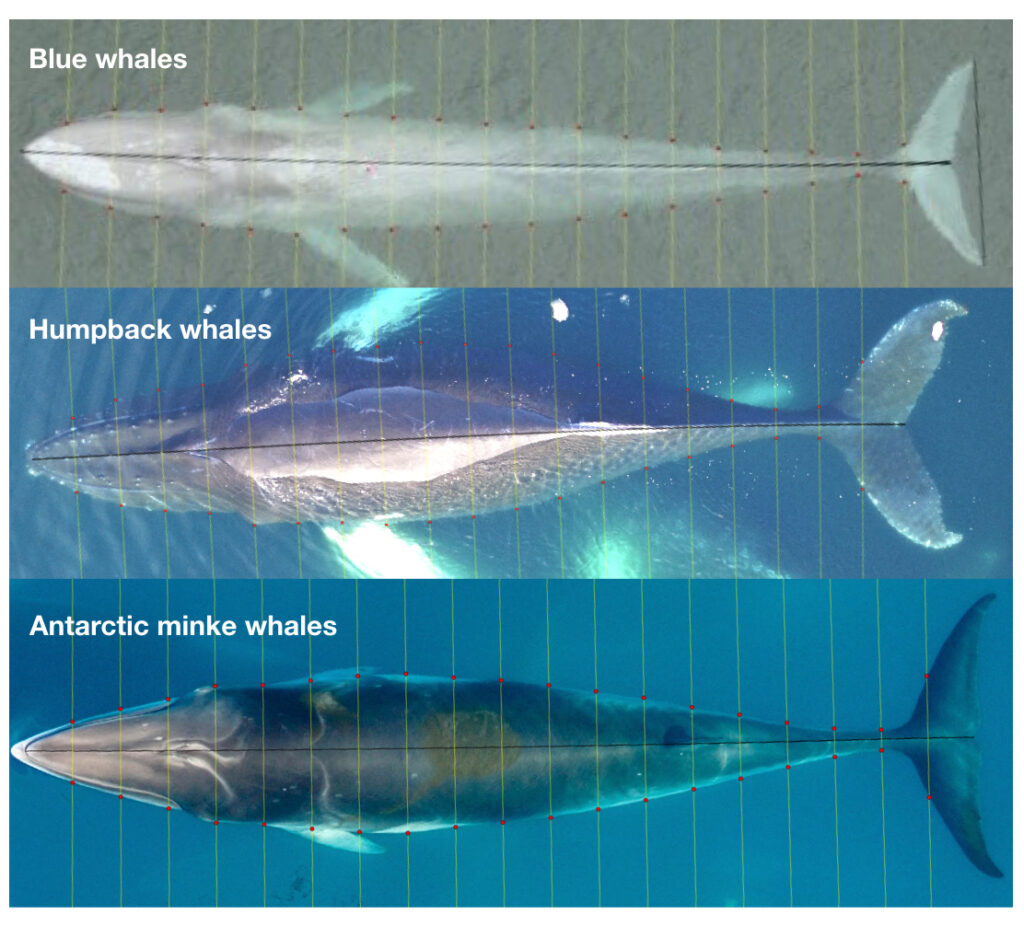
The second chapter of my dissertation, which was recently published in Frontiers in Marine Science and includes Clara Bird and Leigh Torres as co-authors, compared the uncertainty associated with 1D, 2D, and 3D drone-based body condition measurements in three baleen whale species with different ranges in body sizes: blue, humpback, and Antarctic minke whales (Figure 2) (Bierlich et al., 2021). We used the same Bayesian model discussed in my last blog, to incorporate uncertainty associated with each 1D, 2D, and 3D estimate of body condition. 

Figure 2. An example of total length and perpendicular width (in 5% increments of total length) measurements of an individual blue, humpback and Antarctic minke whale. Each image measured using MorphoMetriX (Torres and Bierlich, 2020). 

We found that uncertainty does not scale linearly across multi-dimensional measurements, with 2D and 3D uncertainty increasing by a factor of 1.45 and 1.76 compared to 1D, respectively. This result means that there is an added cost of increased uncertainty when utilizing a multidimensional body condition measurement. Our finding is important to help researchers decide which body condition measurement best suits their scientific question,  particularly when using a drone platform that is susceptible to greater error – as discussed in my previous blog. However, a 1D measurement only relies on a single width measurement, which may be excluding other regions of an individual’s body condition that is important for energy storage. In these situations, a 2D or 3D measure may be more appropriate.

We found that when comparing relative measures of body condition (standardized by total length of the individual), each standardized metric was highly correlated with one another. This finding suggests that 1D, 2D, and 3D metrics will draw similar relative predictions of body condition for individuals, allowing researchers to be confident they will draw similar conclusions relating to the body condition of individuals, regardless of which standardized metric they use. However, when comparing the precision of each of these metrics, the body area index (BAI) – a 2D standardized metric – displayed the highest level of precision. This result highlights how BAI can advantageously detect small changes in body condition, which is useful for comparing individuals or even tracking the same individual over time.

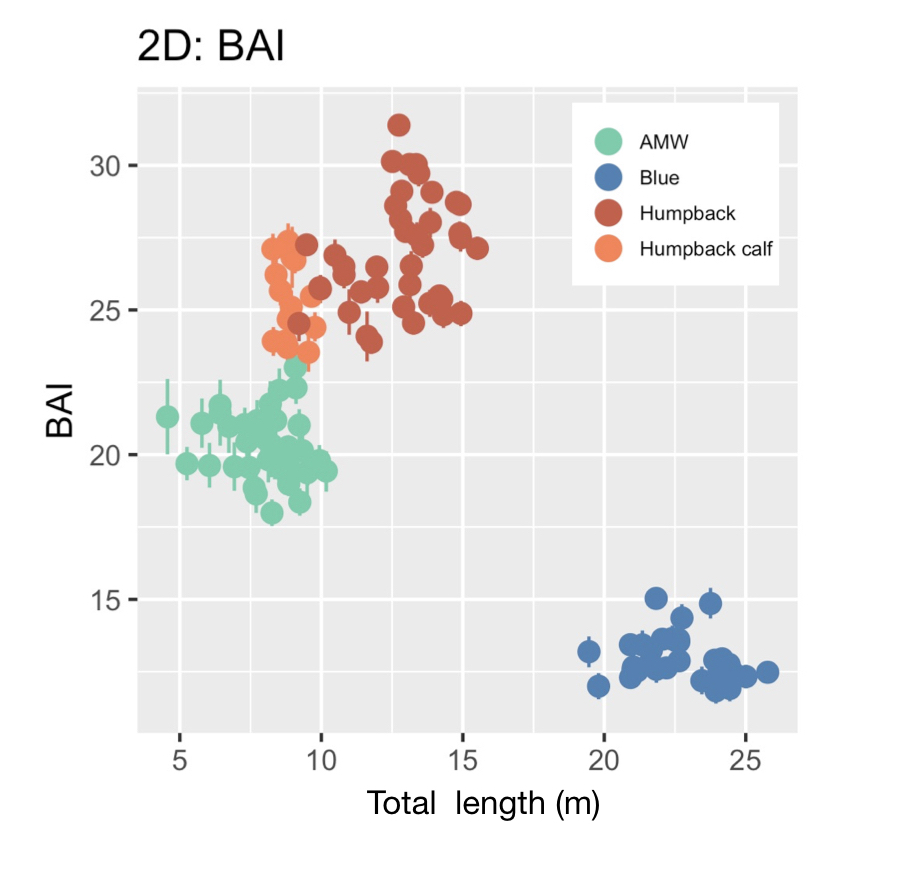
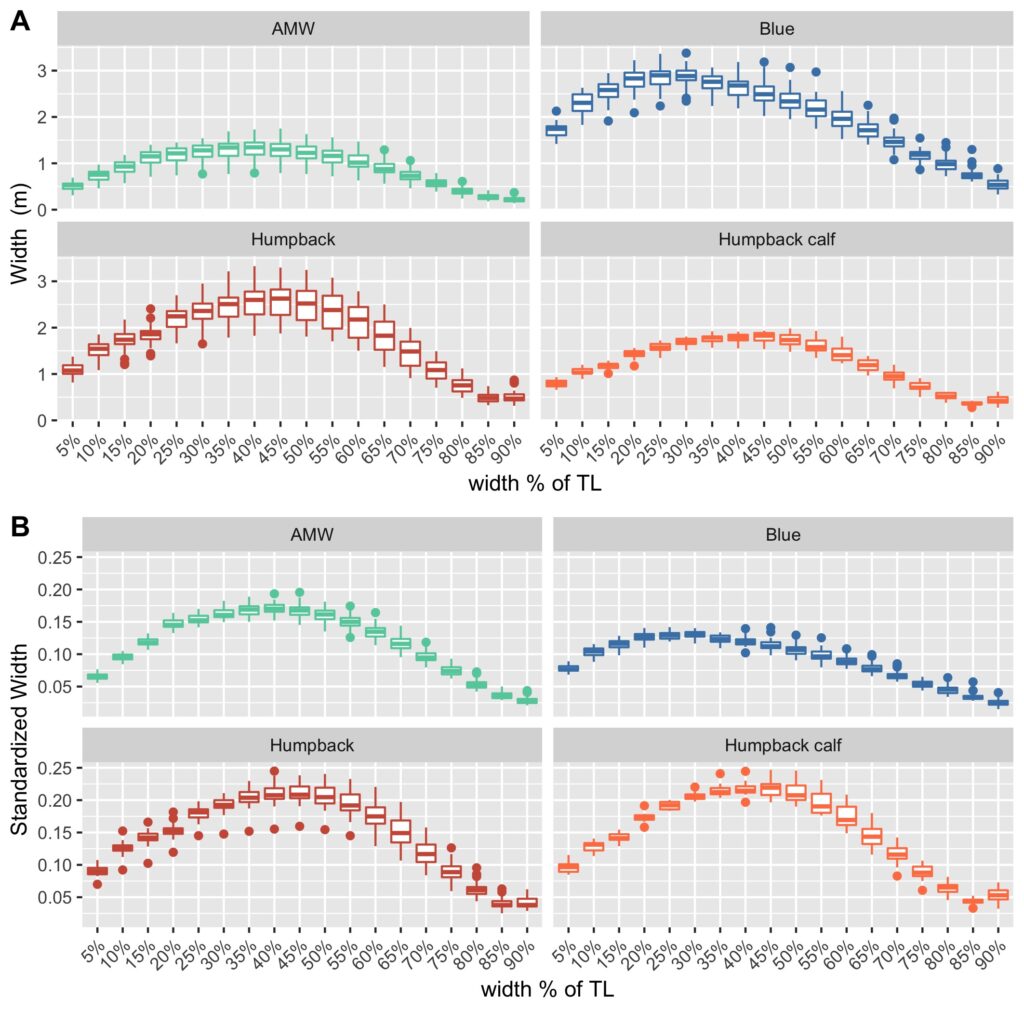
BAI was developed by the GEMM Lab (Burnett et al., 2018) and was designed to be similar to body mass index (BMI) in humans [BMI = mass (kg)/(height (m))2], where BAI uses the calculated surface area as a surrogate for body mass. In humans, a healthy BMI range is generally considered 18.5–24.9, below 18.5 is considered underweight, above 24.9 is considered overweight, and above 30 is considered obese (Flegal et al., 2012). Identifying a healthy range in BAI for baleen whales is challenged by a limited knowledge of what a “healthy” body condition range is for a whale. We found strong evidence that a healthy range of BAI is species-specific, as each species displayed a distinctive range in BAI: blue whales: 11–16; AMW: 17–24; humpback whales: 23–32; humpback whale calves: 23–28 (Fig. 3). These differences in BAI ranges likely reflect differences in the body shape of each species (Fig. 4). For example, humpbacks have the widest range of BAI compared to these other two species, which was also reflected in their larger variation in perpendicular widths (Figs. 2-4). Thus, it seems that BAI offers conditionally “scalefree” comparisons between species, yet it is unreasonable to set a single, all-whale BAI threshold to determine “healthy” versus “unhealthy” body condition.  Collecting a large sample of body condition measurements across many individuals and demographic units over space and time with information on vital rates (e.g., reproductive capacity) will help elucidate a healthy BAI range for each species.

Figure 3. Body area index (BAI) for each species. AMW = Antarctic minke whale.  Figure from Bierlich et al. (2021).
Figure 4. A) Absolute widths (m) and B) relative widths, standardized by total length (TL) to help elucidate the different body shapes of Antarctic minke whales (AMW; n = 40), blue whales (n = 32), humpback whales (n = 40), and humpback whale calves (n = 15). Note how the peak in body width occurs at a different percent body width between species, demonstrating the natural variation in body shape between baleen whales. Figure from Bierlich et al. (2021).

Over the past six years, the GEMM Lab has been collecting drone images of Pacific Coast Feeding Group (PCFG) gray whales off the coast of Oregon to measure their BAI (see GRANITE Project blog). Many of the individuals we encounter are seen across years and throughout the foraging season, providing an opportunity to evaluate how an individual’s BAI is influenced by environmental variation, stress levels, maturity, and reproduction. These data will in turn help determine what the healthy range in BAI for gray whales is. For example, linking BAI to pregnancy – whether a whale is currently pregnant or becomes pregnant the following season – will help determine what BAI is needed to support calf production. We are currently analyzing hundreds of body condition measurements from 2016 – 2021, so stay tuned for upcoming results!

References

Bierlich, K. C., Hewitt, J., Bird, C. N., Schick, R. S., Friedlaender, A., Torres, L. G., … & Johnston, D. W. (2021). Comparing Uncertainty Associated With 1-, 2-, and 3D Aerial Photogrammetry-Based Body Condition Measurements of Baleen Whales. Frontiers in Marine Science, 1729.

Burnett, J. D., Lemos, L., Barlow, D., Wing, M. G., Chandler, T., & Torres, L. G. (2018). Estimating morphometric attributes of baleen whales with photogrammetry from small UASs: A case study with blue and gray whales. Marine Mammal Science35(1), 108–139.

Flegal, K. M., Carroll, M. D., Kit, B. K., & Ogden, C. L. (2012). Prevalence of Obesity and Trends in the Distribution of Body Mass Index Among US Adults, 1999-2010. JAMA307(5), 491. https://doi.org/10.1001/jama.2012.39

Hilderbrand, G. V, Schwartz, C. C., Robbins, C. T., Jacoby, M. E., Hanley, T. A., Arthur, S. M., & Servheen, C. (1999). The importance of meat, particularly salmon, to body size, population productivity, and conservation of North American brown bears. Canadian Journal of Zoology77(1), 132–138.

Peig, J., & Green, A. J. (2009). New perspectives for estimating body condition from mass/length data: the scaled mass index as an alternative method. Oikos118(12), 1883–1891.

Torres, W., & Bierlich, K. C. (2020). MorphoMetriX: a photogrammetric measurement GUI for morphometric analysis of megafauna. Journal of Open Source Software5(45), 1825–1826.

Memoirs from above: drone observations of blue, humpback, Antarctic minke, and gray whales

By KC Bierlich, Postdoctoral Scholar, OSU Department of Fisheries, Wildlife, & Conservation Sciences, Geospatial Ecology of Marine Megafauna Lab

With the GRANITE field season officially over, we are now processing all of the data we collected this summer. For me, I am starting to go through all the drone videos to take snapshots of each whale to measure their body condition. As I go through these videos, I am reflecting on the different experiences I am fortunate enough to have with flying different drones, in different environments, over different species of baleen whales: blue, humpback, Antarctic minke, and now gray whales. Each of these species have a different morphological design and body shape (Woodward et al., 2006), which leads to different behaviors that are noticeable from the drone. Drones create immense opportunity to learn how whales thrive in their natural environments [see previous blog for a quick history], and below are some of my memories from above. 

I first learned how drones could be used to study the morphology and behavior of large marine mammals during my master’s degree at Duke University, and was inspired by the early works of John Durban (Durban et al., 2015, 2016) Fredrick Christiansen (Christiansen et al., 2016) and Leigh Torres (Torres et al., 2018). I immediately recognized the value and utility of this technology as a new tool to better monitor the health of marine mammals. This revelation led me to pursue a PhD with the Duke University Marine Robotics and Remote Sensing (MaRRS) Lab led by Dr. Dave Johnston where I helped further develop tools and methods for collecting drone-based imagery on a range of species in different habitats. 

When flying drones over whales, there are a lot of moving parts; you’re on a boat that is moving, flying something that is moving, following something that is moving. These moving elements are a lot to think about, so I trained hard, so I did not have to think about each step and flying felt intuitive and natural. I did not grow up playing video games, so reaching this level of comfort with the controls took a lot of practice. I practiced for hours over the course of months before my first field excursion and received some excellent mentorship and training from Julian Dale, the lead engineer in the MaRRS Lab. Working with Julian and the many hours of training helped me establish a solid foundation in my piloting skills and feel confident working in various environments on different species. 

Blue whales offshore of Monterey, California. 

In 2017 and 2018 I was involved in collaborative project with the MaRRS Lab and Goldbogen Lab at Stanford University, where we tagged and flew drones over blue whales offshore of Monterey, California. We traveled about an hour offshore and reliably found groups of blue whales actively feeding. Working offshore typically brought a large swell, which can often make landing the drone back into your field partner’s hands tricky as everything is bobbing up and down with the oscillations of the swell. Fortunately, we worked from a larger research vessel (~56 ft) and quickly learned that landing the drone in the stern helped dampen the effects of bobbing up and down. The blue whales we encountered often dove to a depth of around 200 m for about 20-minute intervals, then come to the surface for only a few minutes. This short surface period provided only a brief window to locate the whale once it surfaced and quickly fly over it to collect the imagery needed before it repeated its dive cycle. We learned to be patient and get a sense of the animal’s dive cycle before launch in order to time our flights so the drone would be in the air a couple of minutes before the whale surfaced. 

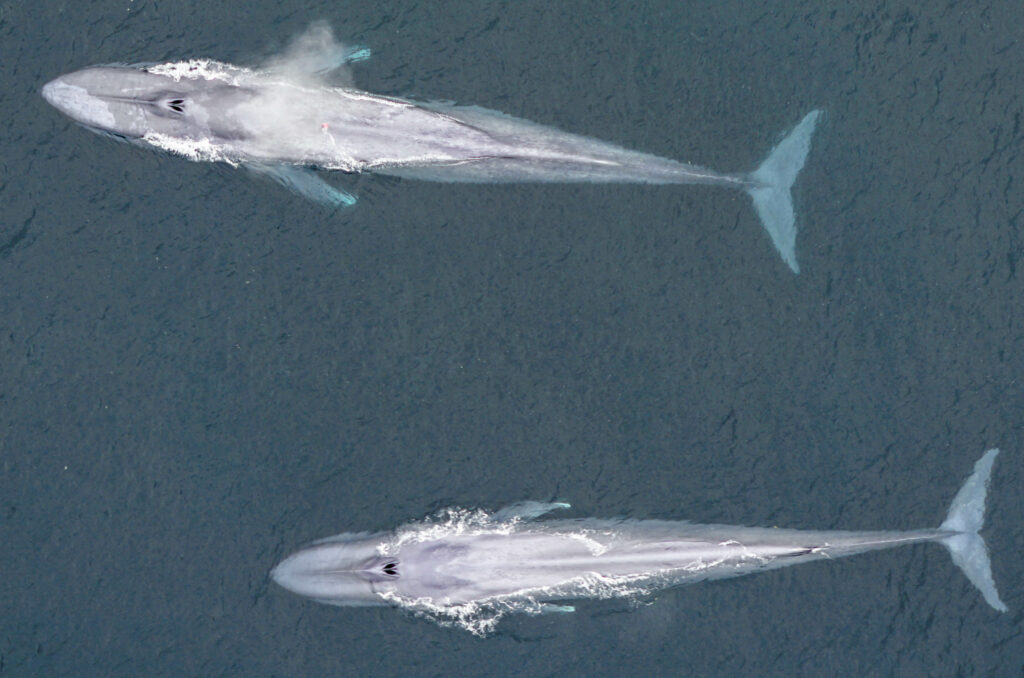
Once over the whales, the streamlined body of the blue whales was noticeable, with their small, high aspect ratio flippers and fluke that make them so well adapted for fast swimming in the open ocean (Fig. 1) (Woodward et al., 2006). I also noticed that because these whales are so large (often 21 – 24 m), I often flew at higher altitudes to be able fit them within the field of view of the camera. It was also always shocking to see how small the tagging boat (~8 m) looked when next to Earth’s largest creatures. 

Figure 1. Two blue whales surface after a deep dive offshore of Monterey, Ca. (Image credit: Duke University Marine Robotics and Remote Sensing under NOAA permit 14809-03)

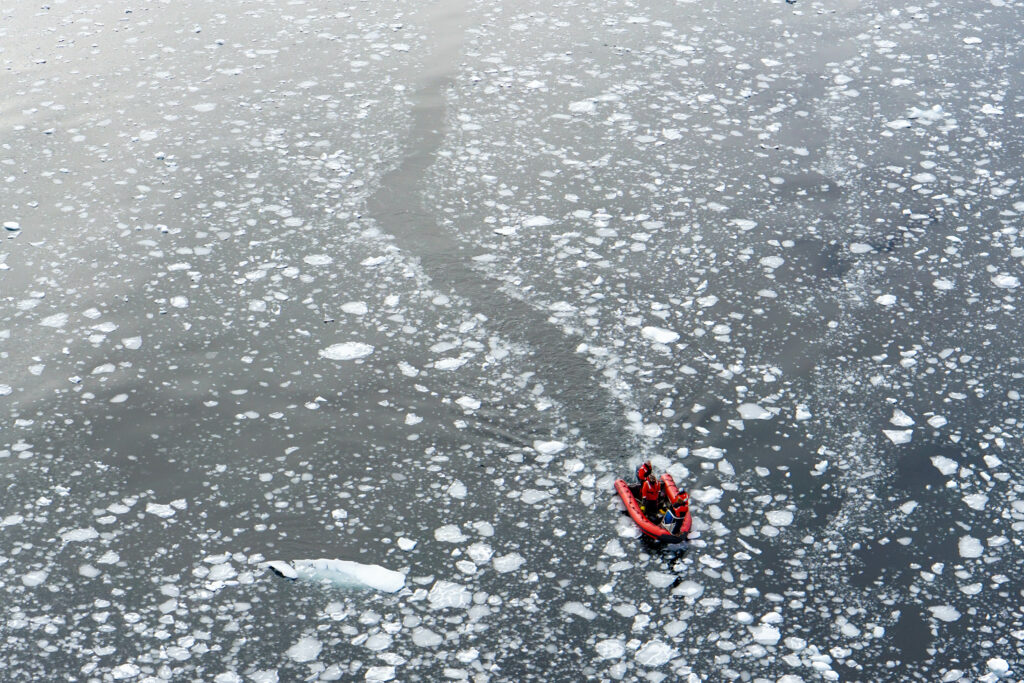
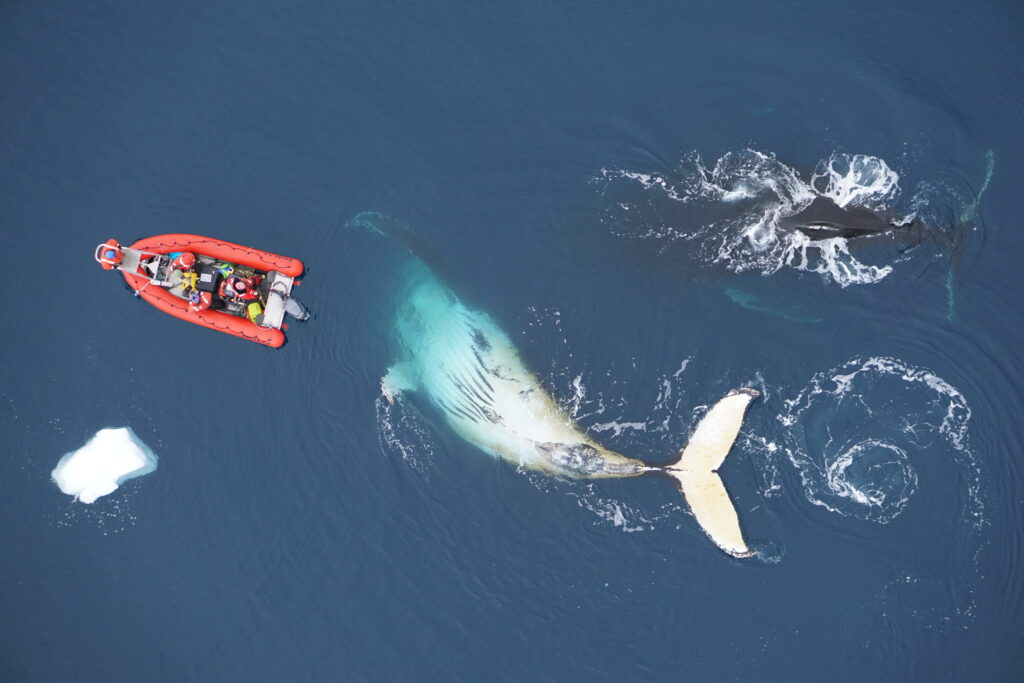
Antarctic minke whales and humpback whales along the Western Antarctic PeninsulaA lot of the data included in my dissertation came from work along the Western Antarctic Peninsula (WAP), which had a huge range of weather conditions, from warm and sunny days to cold and snowy/foggy/rainy/windy/icy days. A big focus was often trying to keep my hands warm, as it was often easier to fly without gloves in order to better feel the controls. One of the coldest days I remember was late in the season in mid-June (almost winter!) in Wilhemina Bay where ice completely covered the bay in just a couple hours, pushing the whales out into the Gerlache Strait; I suspect this was the last ice-free day of the season. Surprisingly though, the WAP also brought some of the best conditions I have ever flown in. Humpback and Antarctic minke whales are often found deep within the bays along the peninsula, which provided protection from the wind. So, there were times where it would be blowing 40 mph in the Gerlache Strait, but calm and still in the bays, such as Andvord Bay, which allowed for some incredible conditions for flying. Working from small zodiacs (~7 m) allowed us more maneuverability for navigating around or through the ice deep in the bays (Fig. 2) 

Figure 2. Navigating through ice-flows along the Western Antarctic Peninsula. (Image credit: Duke University Marine Robotics and Remote Sensing under NOAA permit 14809-03 and ACA permits 2015-011 and 2020-016.)

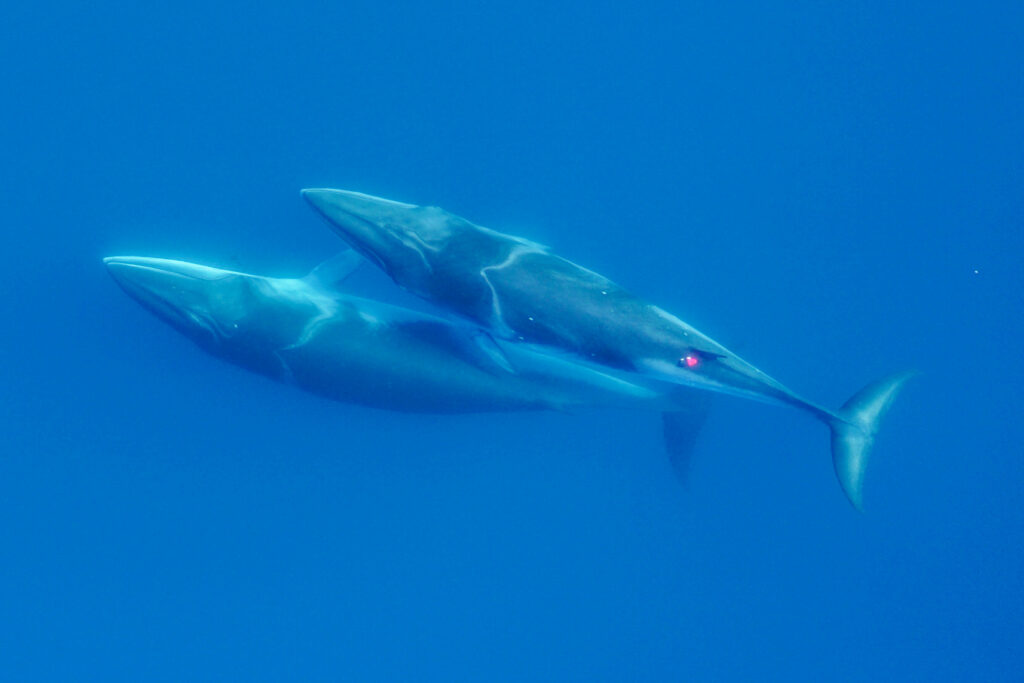
Flying over Antarctic minke whale was always rewarding, as they are very sneaky and can quickly disappear under ice flows or in the deep, dark water. Flying over them often felt like a high-speed chase, as their small streamlined bodies makes them incredibly quick and maneuverable, doing barrel rolls, quick banked turns, and swimming under and around ice flows (Fig. 3). There would often be a group between 3-7 individuals and it felt like they were playing tag with each other – or perhaps with me!  

Figure 3. Two Antarctic minke whales swimming together along the Western Antarctic Peninsula. (Image credit: Duke University Marine Robotics and Remote Sensing under NOAA permit 14809-03 and ACA permits 2015-011 and 2020-016.)

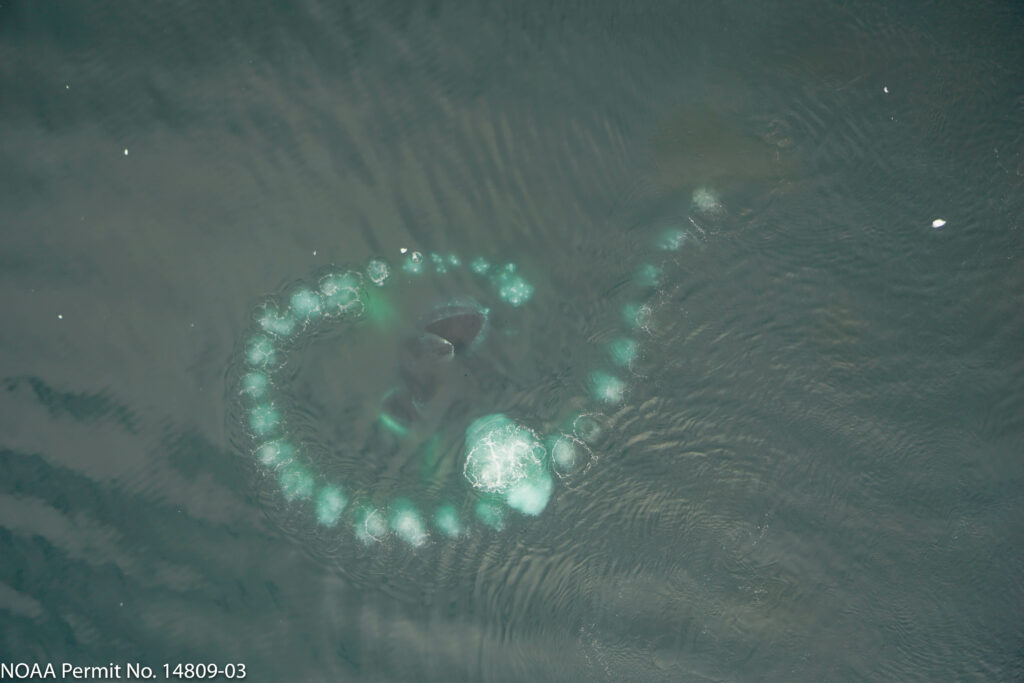
Humpbacks displayed a wide range of behaviors along the WAP. Early in the season they continuously fed throughout the entire day, often bubble net feeding in groups typically of 2-5 animals (Fig. 4). For as large as they are, it was truly amazing to see how they use their pectoral fins to perform quick accelerations and high-speed maneuvering for tight synchronized turns to form bubble nets, which corral and trap their krill, their main food source (Fig. 4) (Woodward et al., 2006). Later in the season, humpbacks switched to more resting behavior in the day and mostly fed at night, taking advantage of the diel vertical migration of krill. This behavior meant we often found humpbacks snoozing at the surface after a short dive, as if they were in a food coma. They also seemed to be more curious and playful with each other and with us later in the season (Fig. 5).

We also encountered a lot of mom and calf pairs along the WAP. Moms were noticeably skinny compared to their plump calf in the beginning of the season due to the high energetic cost of lactation (Fig. 6). It is important for moms to regain this lost energy throughout the feeding season and begin to wean their calves. I often saw moms refusing to give milk to their nudging calf and instead led teaching lessons for feeding on their own.

Figure 4. Two humpback whales bubble-net feeding early in the feeding season (December) along the Western Antarctic Peninsula. (Image credit: Duke University Marine Robotics and Remote Sensing under NOAA permit 14809-03 and ACA permits 2015-011 and 2020-016.)
Figure 5. A curious humpback whale dives behind our Zodiac along the Western Antarctic Peninsula. (Image credit: Duke University Marine Robotics and Remote Sensing under NOAA permit 14809-03 and ACA permits 2015-011 and 2020-016.)
Figure 6. A mom and her calf rest at the surface along the Western Antarctic Peninsula. Note how the mom looks skinnier compared to her plump calf, as lactation is the most energetically costly phase of the reproductive cycle. (Image credit: Duke University Marine Robotics and Remote Sensing under NOAA permit 14809-03 and ACA permits 2015-011 and 2020-016.)

Gray whales off Newport, Oregon

All of these past experiences helped me quickly get up to speed and jump into action with the GRANITE field team when I officially joined the GEMM Lab this year in June. I had never flown a DJI Inspire quadcopter before (the drone used by the GEMM Lab), but with my foundation piloting different drones, some excellent guidance from Todd and Clara, and several hours of practice to get comfortable with the new setup, I was flying over my first gray whale by day three of the job. 

The Oregon coast brings all sorts of weather, and some days I strangely found myself wearing a similar number of layers as I did in Antarctica. Fog, wind, and swell could all change within the hour, so I learned to make the most of weather breaks when they came. I was most surprised by how noticeably different gray whales behave compared to the blue, Antarctic minke, and humpback whales I had grown familiar with watching from above. For one, it is absolutely incredible to see how these huge whales use their low-aspect ratio flippers and flukes (Woodward et al., 2006) to perform low-speed, highly dynamic maneuvers to swim in very shallow water (5-10 m) so close to shore (<1m sometimes!) and through kelp forest or surf zones close to the beach. They have amazing proprioception, or the body’s ability to sense its movement, action, and position, as gray whales often use their pectoral fins and fluke to stay in a head standing position (see Clara Bird’s blog) to feed in the bottom sediment layer, all while staying in the same position and resisting the surge of waves that could smash them against the rocks (Video 1) . It is also remarkable how the GEMM Lab knows each individual whale based on natural skin marks, and I started to get a better sense of each whale’s behavior, including where certain individuals typically like to feed, or what their dive cycle might be depending on their feeding behavior. 

Video 1. Two Pacific Coast Feeding Group (PCFG) gray whales “head-standing” in shallow waters off the coast of Newport, Oregon. NOAA/NMFS permit #21678

I feel very fortunate to be a part of the GRANITE field team and to contribute to data collection efforts. I look forward to the data analysis phase to see what we learn about how the morphology and behavior of these gray whales to help them thrive in their environment. 

References: 

Christiansen, F., Dujon, A. M., Sprogis, K. R., Arnould, J. P. Y., and Bejder, L. (2016).Noninvasive unmanned aerial vehicle provides estimates of the energetic cost of reproduction in humpback whales. Ecosphere 7, e01468–18.

Durban, J. W., Fearnbach, H., Barrett-Lennard, L. G., Perryman, W. L., & Leroi, D. J. (2015). Photogrammetry of killer whales using a small hexacopter launched at sea. Journal of Unmanned Vehicle Systems3(3), 131-135.

Durban, J. W., Moore, M. J., Chiang, G., Hickmott, L. S., Bocconcelli, A., Howes, G., et al.(2016). Photogrammetry of blue whales with an unmanned hexacopter. Mar. Mammal Sci. 32, 1510–1515.

Torres, L. G., Nieukirk, S. L., Lemos, L., & Chandler, T. E. (2018). Drone up! Quantifying whale behavior from a new perspective improves observational capacity. Frontiers in Marine Science5, 319.

Woodward, B. L., Winn, J. P., and Fish, F. E. (2006). Morphological specializations of baleen whales associated with hydrodynamic performance and ecological niche. J. Morphol. 267, 1284–1294.

Rorquals of the California Current

By Solène Derville, Postdoc, OSU Department of Fisheries, Wildlife, and Conservation Science, Geospatial Ecology of Marine Megafauna Lab

About 10 months have passed since I started working on OPAL, a project that aims to identify the co-occurrence between whales and fishing effort in Oregon to reduce entanglement risk. During this period, you would be surprised to know how little ecology I have actually done and how much time has been devoted to data processing! I compiled several million GPS trackline positions, processed hundreds of marine mammal observations, wrote several thousand lines of R code, downloaded and extracted a couple Gb of environmental data… before finally reaching the modeling phase of the OPAL project. And with it, finally comes the time to look more closely at the ecology and behavior of my species of interest. While the previous steps of the project were pretty much devoid of ecological reasoning, the literature homework now comes in handy to guide my choices regarding habitat use models, such as  selecting environmental predictors of whale occurrence, deciding on what seasons should be modeled, and choosing the spatio-temporal scale at which the data should be aggregated.

Whale diversity on the US west coast

The productive waters off the US west coast host a great diversity of cetaceans. Eight species of baleen whales are reported to occur there by NOAA fisheries: blue whales, Bryde’s whales, fin whales, gray whales, humpback whales, minke whales, North Pacific right whales and sei whales. Among them, no less than five are listed as Endangered under the Endangered Species Act. Whether they are only passing by or spending months feeding in the region, the timing and location where these animals are observed varies greatly by species and by population.

During the 113 hours of aerial survey effort and 264 hours of boat-based search conducted for the OPAL project, 563 groups of baleen whales have been observed to-date (up to mid-May 2021 to be exact… more data coming soon!). Among the observations where animals could be identified to the species level, humpback whales are preponderant, as they represent about half of the whale groups observed (n = 293). Blue (n = 41) and gray whales (n = 46) come next, the latter being observed in more nearshore waters. Finally, a few fin whale groups were observed (n = 28). The other baleen whale species reported by NOAA in the US west coast species list were very rarely or not observed at all during OPAL surveys.

The OPAL aerial surveys conducted in partnership with the United States Coast Guard (USCG) were specifically designed to study whales occurring on the continental shelf along the coast of Oregon. Hence, most of this survey effort is located in waters from 800 m to 30 m deep, which may explain the relatively low number of gray whales detected. Indeed, gray whales observed in Oregon may either be migrating along the coast to and from their breeding grounds in Baja California, or be part of the small Pacific Coast Feeding Group that forage in Oregon nearshore and shallow waters during the summer. This group of whales is one the main GEMM lab’s research focus, being at the core of no less than three ongoing research projects: AMBER, GRANITE, and TOPAZ.

So today, let’s turn our eyes to the sea horizon and talk about some other members of the baleen whale community: rorquals. Conveniently, the three species of baleen whales (gray whales aside) most commonly observed during OPAL surveys are all part of the rorqual family, a.k.a Balaenopteridae: humpback whales, blue whales and fin whales (Figure 1). They are morphologically characterized by the pleated throat grooves that allow them to engulf large quantities of food and water, for instance when lunge-feeding. Known cases of hybridization between these three species demonstrate their close relatedness (Jefferson et al., 2021)⁠. They all have worldwide distributions and display unequally understood migratory behaviors, seasonally traveling between warm tropical breeding grounds and temperate-polar feeding grounds. They occur in great numbers in productive waters such as the upwelling system of the California Current.

The three accomplices

Figure 1: Aerial view of three rorquals species: a humpback whale (left), a fin whale (center), and a blue whale (right). Photo credit: Leigh Torres and Craig Hayslip. Photos taken off the Oregon coast under NOAA/NMFS permit during USCG helicopter flights conducted as part of the OPAL project

Humpback whales (Megaptera novaeangliae) are easily differentiated from other rorquals because of their long pectoral fins (up to one third of their body length!), which inspired their scientific name, Megaptera, « big-winged » (Figure 1). Individuals observed in Oregon mostly belong to a mix of two Distinct Population Segments (DPS): the threatened Mexico and endangered Central American DPS. Although humpback whales from different DPS do not show any morphological differences, they are genetically distinct because they have been mating separately in distinct breeding grounds for generations and generations. This genetic differentiation has great implications in terms of conservation since the Central American DPS is recovering at a lesser rate than the Mexican and is therefore subject to different management measures (recovery plan, monitoring plan, designated critical habitats). Humpback whales migrate and feed off the US west coast, with a peak in abundance in the mid to late summer. Compared to other rorquals that are found in the open ocean, humpback whales are mostly observed on the continental shelf (Becker et al., 2019)⁠. They are considered to have a relatively generalist diet, as they feed on a mix of krill (Euphausiids) and fishes (e.g. anchovy, sardines) and are capable of switching their feeding behavior depending on relative prey availability (Fleming, Clark, Calambokidis, & Barlow, 2016; Fossette et al., 2017)⁠.

Blue whales (Balaenoptera musculus) are the largest animals ever known (max length 33 m, Jefferson et al., 2008), and sadly the most at risk of global extinction among our three species of interest (listed as « endangered » in the IUCN red list). They have a distinctive mottled blue and light gray skin, a slender body and a broad U-shaped head (or as some say « like a gothic arch », Figure 1). Blue whales tend to be open ocean animals, but they regroup seasonally to feed in highly productive nearshore areas such as the Southern California Bight (Becker et al. 2019, Abrahms et al. 2019). Blue whales migrating or feeding along the US west coast belong to the Eastern North Pacific stock and are subject to great research and conservation efforts. Contrary to their other rorqual counterparts, blue whales are quite picky eaters, as they exclusively feed on krill. This difference in diet leads to resource partitioning facilitating rorqual coexistence in the California Current (Fossette et al., 2017)⁠. These differences in feeding strategies have important implications for designing predictive models of habitat use.

Fin whales (Balaenoptera physalus) are nicknamed « greyhounds of the sea » due to their exceptional swim speed (max 46 km/h). They are a little smaller than blue whales (max length 27 m, Jefferson, Webber, & Pitman, 2008)⁠ but share a similar sleek and streamlined shape. Their coloration is their most distinctive feature: the left lower jaw being mostly dark while the right is white. V-shaped light-gray « chevrons » color their back, behind the head (Figure 1). The California/Oregon/Washington is one of the three stocks recognized in the North Pacific (NOAA Fisheries, 2018)⁠. Within this region, there is genetic evidence for a geographic separation north and south of Point Conception, CA (Archer et al., 2013)⁠. Like other rorquals, they are migratory, but their seasonal distribution is relatively less well understood as they appear to spend a lot of time in open oceans. For instance, a meta-analysis for the North Pacific found little evidence for fin whales using distinct calving areas (Mizroch, Rice, Zwiefelhofer, Waite, & Perryman, 2009)⁠. In the California Current System, satellite tracking has provided great insights into their space-use patterns. In the Southern California Bight, fin whales show year-round residency and seasonal shifts in habitat use as they move further offshore and north during the spring/summer (Scales et al., 2017)⁠. The Northern California Current offshore waters appeared to be used during the summer months by the whales tagged in the Southern California Bight. Yet, fin whales are observed year-round in Oregon (NOAA Fisheries, 2018)⁠.

Towards predictive models of rorqual distribution

Enough observations have now been collected as part of the OPAL project to be able to model the habitat use of some of these rorqual species. Based on 12 topographic (i.e., depth, slope, distance to canyons) and physical variables (temperature, chlorophyll-a, water column stratification, etc.), I have made my first attempt at predicting seasonal distribution patterns of humpback whales and blue whales in Oregon. These models will be improved in the coming months, with more data pouring in and refined parametrizations, but they already bring insights into the shared habitat use patterns of these species, as well as their specificities.

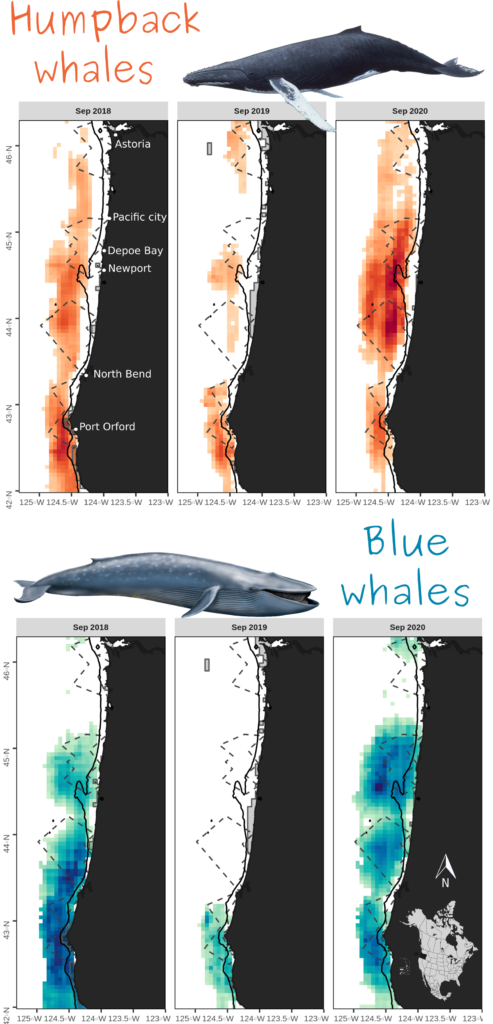
Across multiple cross-validations of the species-specific models, sea surface temperature, sea surface height and depth were recurrently selected among the most important variables influencing both humpback and blue whale distributions. Predicted densities of blue whales were relatively higher at less than 40 fathoms compared to humpback whales, although both species’ hotspots were located outside this newly implemented seasonal fishing limit (Figure 2). Higher densities were generally predicted off Newport and Port Orford, and north of North Bend.

Figure 2: Predicted densities of humpback and blue whales during the month of September 2018, 2019, and 2020 in Oregon waters (OPAL project). Core areas of use (predicted densities in the top 25%) are represented, with darker shades of blue and orange showing higher predicted densities. Dashed lines represent the tracklines followed by USCG monthly aerial surveys. The black line represents the 40 fathom isobath. Grey boxes overlayed on predictions delineate the areas of extrapolation where environmental conditions are non-analogous to the conditions in which the models were trained. Disclaimer: these model outputs are preliminary and should be interpreted with caution.

Once our rorqual models are finalized, we will work with our partners at the Oregon Department of Fisheries and Wildlife to overlay predicted whale hotspots with areas of high crab pot densities. This overlap analysis will help us understand the times and places where co-occurrence of suitable whale habitat and fishing activities put whales at risk of entanglement.

References

Archer, F. I., Morin, P. A., Hancock-Hanser, B. L., Robertson, K. M., Leslie, M. S., Bérubé, M., … Taylor, B. L. (2013). Mitogenomic Phylogenetics of Fin Whales (Balaenoptera physalus spp.): Genetic Evidence for Revision of Subspecies. PLoS ONE, 8(5). https://doi.org/10.1371/journal.pone.0063396

Becker, E. A., Forney, K. A., Redfern, J. V, Barlow, J., Jacox, M. G., Roberts, J. J., & Palacios, D. M. (2019). Predicting cetacean abundance and distribution in a changing climate. Diversity and Distributions, 25(4), 626–643. https://doi.org/10.1111/ddi.12867

Fleming, A. H., Clark, C. T., Calambokidis, J., & Barlow, J. (2016). Humpback whale diets respond to variance in ocean climate and ecosystem conditions in the California Current. Global Change Biology, 22, 1214–1224. https://doi.org/10.1111/gcb.13171

Fossette, S., Abrahms, B., Hazen, E. L., Bograd, S. J., Zilliacus, K. M., Calambokidis, J., … Croll, D. A. (2017). Resource partitioning facilitates coexistence in sympatric cetaceans in the California Current. Ecology and Evolution, 7, 9085–9097. https://doi.org/10.1002/ece3.3409

Jefferson, T. A., Palacios, D. M., Clambokidis, J., Baker, S. C., Hayslip, C. E., Jones, P. A., … Schulman-Janiger, A. (2021). Sightings and Satellite Tracking of a Blue / Fin Whale Hybrid in its Wintering and Summering Ranges in the Eastern North Pacific. Advances in Oceanography & Marine Biology, 2(4), 1–9. https://doi.org/10.33552/AOMB.2021.02.000545

Jefferson, T. A., Webber, M. A., & Pitman, R. L. (2008). Marine Mammals of the World. A comprehensive guide to their identification. Elsevier, London, UK.

Mizroch, S. A., Rice, D. W., Zwiefelhofer, D., Waite, J., & Perryman, W. L. (2009). Distribution and movements of fin whales in the North Pacific Ocean. Mammal Review, 39(3), 193–227. https://doi.org/10.1111/j.1365-2907.2009.00147.x

NOAA Fisheries. (2018). Fin whale stock assessment report ( Balaenoptera physalus physalus ): California / Oregon / Washington Stock.

Scales, K. L., Schorr, G. S., Hazen, E. L., Bograd, S. J., Miller, P. I., Andrews, R. D., … Falcone, E. A. (2017). Should I stay or should I go? Modelling year-round habitat suitability and drivers of residency for fin whales in the California Current. Diversity and Distributions, 23(10), 1204–1215. https://doi.org/10.1111/ddi.12611

Roger that, we are currently enamored

Blog by Rachel Kaplan, PhD student, Oregon State University College of Earth, Ocean, and Atmospheric Sciences and Department of Fisheries, Wildlife, and Conservation Sciences, Geospatial Ecology of Marine Megafauna Lab

Figures by Dawn Barlow, PhD Candidate, OSU Department of Fisheries, Wildlife, and Conservation Sciences, Geospatial Ecology of Marine Megafauna Lab

Hello from the RV Bell M. Shimada! We are currently sampling at an inshore station on the Heceta Head Line, which begins just south of Newport and heads out 45 nautical miles west into the Pacific Ocean. We’ll spend 10 days total at sea, which have so far been full of great weather, long days of observing, and lots of whales.

Dawn and Rachel in matching, many-layered outfits, 125 miles offshore on the flying bridge of the RV Bell M. Shimada.

Run by NOAA, this Northern California Current (NCC) cruise takes place three times per year. It is fabulously interdisciplinary, with teams concurrently conducting research on phytoplankton, zooplankton, seabirds, and more. The GEMM Lab will use the whale survey, krill, and oceanographic data to fuel species distribution models as part of Project OPAL. I’ll be working with this data for my PhD, and it’s great to be getting to know the region, study system, and sampling processes.

I’ve been to sea a number of times and always really enjoyed it, but this is my first time as part of a marine mammal survey. The type and timing of this work is so different from the many other types of oceanographic science that take place on a typical research cruise. While everyone else is scurrying around, deploying instruments and collecting samples at a “station” (a geographic waypoint in the ocean that is sampled repeatedly over time), we – the marine mammal team – are taking a break because we can only survey when the boat is moving. While everyone else is sleeping or relaxing during a long transit between stations, we’re hard at work up on the flying bridge of the ship, scanning the horizon for animals.

Top left: marine mammal survey effort (black lines), and oceanographic sampling stations (red diamonds). Top right: humpback whale sighting locations. Bottom left: fin whale sighting locations. Bottom right: pacific white-sided dolphin sighting locations.

During each “on effort” survey period, Dawn and I cover separate quadrants of ocean, each manning either the port or starboard side. We continuously scan the horizon for signs of whale blows or bodies, alternating between our eyes and binoculars. During long transits, we work in chunks – forty minutes on effort, and twenty minutes off effort. Staring at the sea all day is surprisingly tiring, and so our breaks often involve “going to the eye spa,” which entails pulling a neck gaiter or hat over your eyes and basking in the darkness.  

Dawn has been joining these NCC cruises for the last four years, and her wealth of knowledge has been a great resource as I learn how to survey and identify marine mammals. Beyond learning the telltale signs of separate species, one of the biggest challenges has been learning how to read the sea better, to judge the difference between a frothy whitecap and a whale blow, or a distant dark wavelet and a dorsal fin. Other times, when conditions are amazing and it feels like we’re surrounded by whales, the trick is to try to predict the positions and trajectory of each whale so we don’t double-count them.

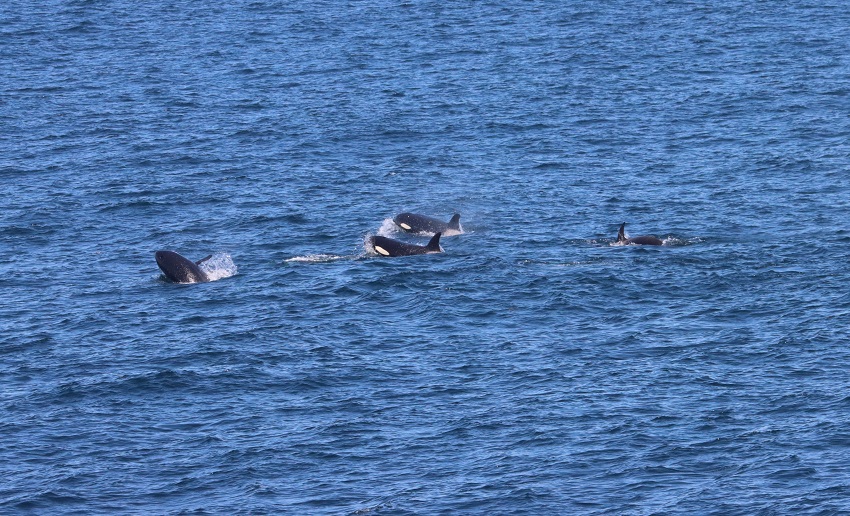
Over the last week, all our scanning has been amply rewarded. We’ve seen pods of dolphins play in our wake, and spotted Dall’s porpoises bounding alongside the ship. Here on the Heceta Line, we’ve seen a diversity of pinnipeds, including Northern fur seals, Stellar sea lions, and California sea lions. We’ve been surprised by several groups of fin whales, farther offshore than expected, and traveled alongside a pod of about 12 orcas for several minutes, which is exactly as magical as it sounds.

Killer whales traveling alongside the Bell M. Shimada, putting on a show for the NCC science team and ship crew. Photo by Dawn Barlow.

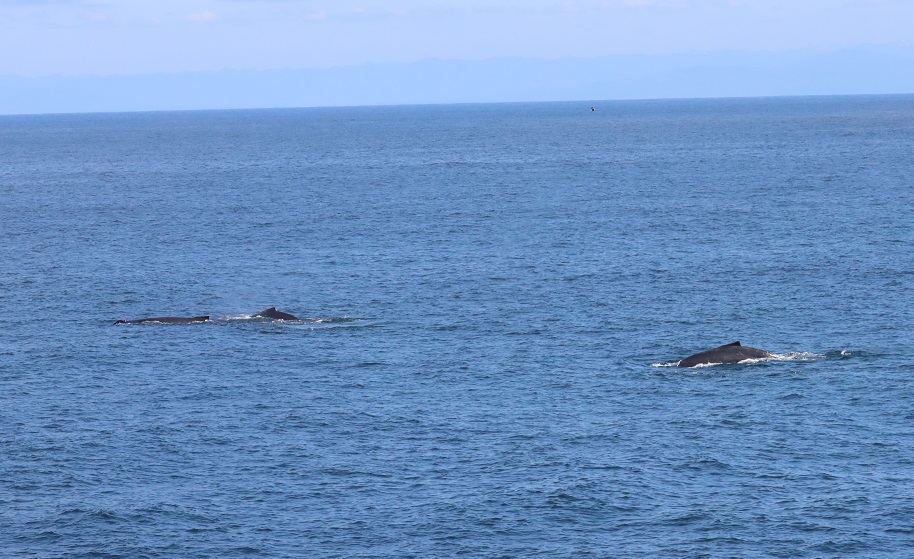
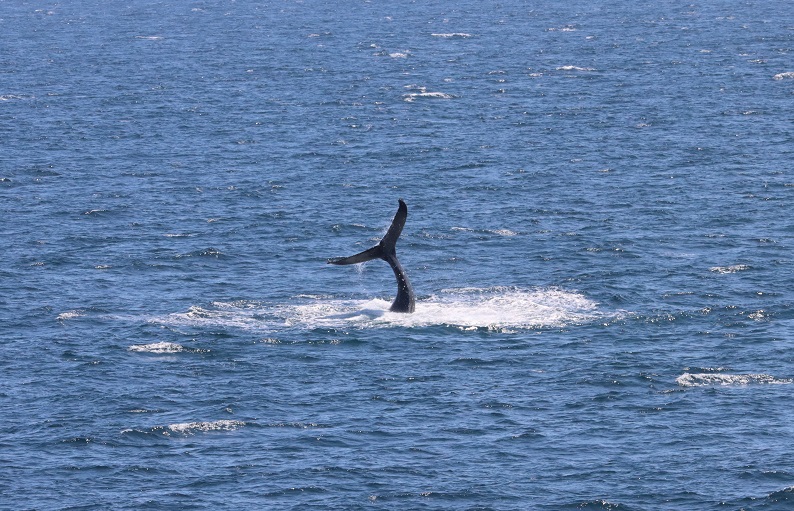
Notably, we’ve also seen dozens of humpbacks, including along what Dawn termed “the humpback highway” during our transit offshore of southern Oregon. One humpback put on a huge show just 200 meters from the ship, demonstrating fluke slapping behavior for several minutes. We wanted to be sure that everyone onboard could see the spectacle, so we radioed the news to the bridge, where the officers control the ship. They responded with my new favorite radio call ever: “Roger that, we are currently enamored.”

A group of humpbacks traveling along the humpback highway. Photo by Dawn Barlow.
A humpback whale fluke slapping. Photo by Dawn Barlow.

Even with long days and tired eyes, we are still constantly enamored as well. It has been such a rewarding cruise so far, and it’s hard to think of returning back to “real life” next week. For now, we’re wishing you the same things we’re enjoying – great weather, unlimited coffee, and lots of whales!

SpeciesNumber of sightingsTotal number observed
California Sea Lion26
Dall’s Porpoise325
Fin Whale1118
Humpback Whale140218
Killer Whale321
Northern Fur Seal99
Northern Right Whale Dolphin28
Pacific White-sided Dolphin13145
Steller Sea Lion33
Unidentified Baleen Whale104127
Unidentified Dolphin628
Unidentified Whale22

Into the Krillscape: A Remote Expedition in Research and Mentorship

By Rachel Kaplan, PhD student, Oregon State University College of Earth, Ocean, and Atmospheric Sciences and Department of Fisheries and Wildlife, Geospatial Ecology of Marine Megafauna Lab

What are the most unexpected things you’ve done on Zoom in the last year? Since the pandemic dramatically changed all our lives in 2020, I think we’ve all been surprised by the diversity of things we’ve done remotely. I’ve baked bagels with a friend in Finland, done oceanography labs from my kitchen, had dance parties with people across the country, and conducted an award ceremony for my family’s Thanksgiving scavenger hunt – all on Zoom. Over the last several months, I’ve also mentored an Undergraduate Research, Scholarship, & the Arts (URSA) Engage student, named Amanda. Although we haven’t met in person yet, we’ve been connecting over Zoom since October. 

Amanda is an Ocean Sciences student working with me and Dr. Kim Bernard (CEOAS) to conduct a literature review about the two species of krill found off the coast of Oregon. Thysanoessa spinifera and Euphausia pacifica are an important food source for many of the animals that live off our coast — including blue, humpback, and fin whales. I am trying to learn how krill distributions shape those of humpback and blue whales as part of project OPAL, as well as which oceanographic factors drive krill abundances and distributions.

Thysanoessa spinifera (source: Scripps Institute of Oceanography). 

We’re also interested in T. spinifera and E. pacifica for the crucial roles they serve in ecosystems, beyond providing dinner for whales. Krill do many things that are beneficial to ecosystems and people, termed “ecosystem services.” These include facilitating carbon drawdown from the surface ocean to the deep, supporting lucrative fisheries species like salmon, flatfish, and rockfish, and feeding seabirds like auklets and shearwaters. We want to understand more fully the niche that T. spinifera and E. pacifica each fill off the coast of Oregon, which will help us anticipate how these important animals can be impacted by forces such as global climate change and marine management efforts.

Trying to understand the ecosystem services fulfilled by krill is inherently interdisciplinary, which means we have to learn a lot of new things, making this project a lot of fun. The questions Amanda and I have pursued together have ranged from intensely specific, to surprisingly broad. How many calories do blue whales need to eat in a day? How many krill do salmon need to eat? How big are krill fecal pellets, and how fast do they sink?

Trying to answer these questions has basically amounted to a heroic scouring of the internet’s krillscape by Amanda. She has hunted down papers dating back to the 1960s, pulled together findings from every corner of the world, and pursued what she refers to as “treasure troves” of data. In the process, she has also revealed the holes that exist in the literature, and given us new questions. This is the basis of the scientific process: understanding the current state of knowledge, identifying gaps in that knowledge, and developing the questions and methods needed to fill those gaps.

Euphausia pacifica (source: University of Irvine California, Peter J. Bryant).

Filling in knowledge gaps about T. spinifera and E. pacifica can help us better understand these animals, the ecosystems where they live, and the whales and other animals that depend on them for prey. It’s exciting to know that we will have the opportunity to help fill some of these gaps, as both Amanda and I continue this research over the course of our degrees.

Being able to engage in remote research and mentorship has been really rewarding, and it has shown me how far we’ve all come over the last year. Learning how to work together remotely has been crucial as we have adjusted to the funny new normal of the pandemic. As much as I miss working with people in person, I’ve learned that there’s a lot of great connection to be found even in remote collaboration – I’ve loved meeting Amanda’s pets on Zoom, learning about her career goals, and seeing her incredibly artistic representations of the carbon cycle held up to the camera.

Even though most of our conversations take place on Zoom from our homes, this research still feels plugged into a bigger community. Amanda and I also join Kim’s bigger Zooplankton Ecology Lab meetings, which include two other graduate students and eight undergraduate students, all of whom are working on zooplankton ecology questions that span from the Arctic to the Antarctic. Even though we’ve never met in person, a supportive and curious community has developed among all of us, which I know will persist when we can move back to in-person research and mentorship.

A Multidisciplinary Treasure Hunt: Learning about Indigenous Whaling in Oregon

By Rachel Kaplan, PhD student, OSU College of Earth, Ocean, and Atmospheric Sciences and Department of Fisheries and Wildlife, Geospatial Ecology of Marine Megafauna Lab

At this year’s virtual State of the Coast conference, I enjoyed tuning into a range of great talks, including one by Zach Penney from the Columbia River Inter-Tribal Fish Commission. In his presentation, “More Than a Tradition: Treaty rights and the Columbia River Inter-Tribal Fish Commission,” Penney described a tribal “covenant with resources,” and noted the success of this approach — “You don’t live in a place for 15,000 years by messing it up.”

Indigenous management of resources in the Pacific Northwest dates back thousands of years. From oak savannahs to fisheries to fires, local tribes managed diverse natural systems long before colonial settlement of the area that is now Oregon. We know comparatively little, however, about how Indigenous groups in Oregon interacted with whale populations before the changes brought by colonialism and commercial whaling.

Makah hunters in Washington bring a harvested whale into Neah Bay (Asahel Curtis/Washington State Historical Society).

I’m curious about how this missing knowledge could inform our understanding of the coastal Oregon ecosystems in which many GEMM Lab projects take place. My graduate research will be part of the effort to identify co-occurrence between whales and fishing in Oregon, with the goal of helping to reduce whale entanglement risk. Penney’s talk, ongoing conversations about decolonizing science, and my own concerns about becoming the scientist that I want to be, have all led me to ask a new set of questions: What did humans know in the past about whale distributions along the Oregon coast? What lost knowledge can be reclaimed from history?

As I started reading about historical Indigenous whale use in Oregon, I was struck by how little we know today, and how this learning process became a multidisciplinary treasure hunt. Clues as to how Indigenous groups interacted with whales along the Oregon coast lie in oral histories, myths, journals, and archaeological artifacts. 

Much of what I read hinged on the question: did Indigenous tribes in Oregon historically hunt whales? Many signs point to yes, but it’s a surprisingly tricky question to answer conclusively. Marine systems and animals, including seals and whales, remain an important part of cultures in the Pacific Northwest today – but historically, documentation of hunting whales in Oregon has been limited. Whale bones have been found in coastal middens, and written accounts describe opportunistic harvests of beached whales. However, people have long believed that only a few North American tribes outside of the Arctic regularly hunted whales. 

But in 2007, archaeologists Robert Losey and Dongya Yang found an artifact that started to shift this narrative. While studying a collection of tools housed at the Smithsonian Institution, they discovered the tip of a harpoon lodged in a whale flipper bone. This artifact came from the Partee site, which was inhabited around AD 300-1150 and is located near present-day Seaside, Oregon.

A gray whale ulna with cut marks found at the Partee site (Wellman, et al. 2017).

Through DNA testing, Losey and Yang determined that the harpoon was made of elk bone, and that the elk was not only harvested locally, but also used locally. This new piece of evidence suggested that whaling did in fact take place at the Partee site, likely by the Tillamook or Clatsop tribes that utilized this area.

Several years later, this discovery inspired Smithsonian Museum of Natural History archaeologist Torben Rick and University of Oregon PhD student Hannah Wellman to comb through the rest of the animal remains in the Smithsonian’s collection from northwest Oregon. Rick and Wellman scrutinized 187 whale bones for signs of hunting or processing, and found that about a quarter of the marks they inspected could have come from either hunting or the opportunistic harvest of stranded whales. They examined tools from the midden as well, and found that they were more suited to hunting animals, like seals and sea lions, or fishing. 

However, Wellman and Rick also used DNA testing to identify which whale species were represented in the midden – and the DNA analyses suggested a different story. Genetic results revealed that the majority of whale bones in the midden came from gray whales, a third from humpback whales, and a few from orca and minke. Modern gray whale stranding events are not uncommon, and so it follows logically that these bones could have simply come from people harvesting beached whales. However, humpback strandings are rare – suggesting that such a large proportion of humpback bones in the midden is likely evidence of people actively hunting humpback whales.

Percentage of whale species identified at the Partee site and percentage of species in the modern stranding record for the Oregon Coast (Wellman, et al. 2017).

These results shed new light on whale harvesting practices at the Partee Site, and, like so much research, they suggest a new set of questions. What does the fact that there were orca, minke, gray, and humpback whales off the Oregon coast 900 years ago tell us about the history of this ecosystem? Could artifacts that have not yet been found provide more conclusive evidence of hunting? What would it mean if these artifacts are found one day, or if they are never found?

As this fascinating research continues, I hope that new discoveries will continue to deepen our understanding of historic Indigenous whaling practices in Oregon – and that this information can find a place in contemporary conversations. Indigenous whaling rights are both a contemporary and contentious issue in the Pacific Northwest, and the way that humans learn about the past has much to do with how we shape the present. 

What we learn about the past can also change how we understand this ecosystem today, and provide new context as we try to understand the impacts of climate change on whale populations in Oregon. I’m interested in how learning more about historical Indigenous whaling practices could provide more information about whale population baselines, ideas for management strategies, and a new lens on the importance of whales in the Pacific Northwest. Even if we can’t fully reclaim lost knowledge from history, maybe we can still read enough clues to help us see both the past and present more fully.

Sources:

Braun, Ashley. “New Research Offers a Wider View on Indigenous North American Whaling.” Hakai Magazine, November 2016, www.hakaimagazine.com/news/new-research-offers-wider-view-indigenous-north-american-whaling/. 

Eligon, John. “A Native Tribe Wants to Resume Whaling. Whale Defenders Are Divided.” New York Times, November 2019. 

Hannah P. Wellman, Torben C. Rick, Antonia T. Rodrigues & Dongya Y. Yang (2017) Evaluating Ancient Whale Exploitation on the Northern Oregon Coast Through Ancient DNA and Zooarchaeological Analysis, The Journal of Island and Coastal Archaeology, 12:2, 255-275, DOI: 10.1080/15564894.2016.1172382

Losey, R., & Yang, D. (2007). Opportunistic Whale Hunting on the Southern Northwest Coast: Ancient DNA, Artifact, and Ethnographic Evidence. American Antiquity, 72(4), 657-676. doi:10.2307/25470439

Sanchez, Gabriel (2014). Conference paper: Cetacean Hunting at the Par-Tee site (35CLT20)?: Ethnographic, Artifact and Blood Residue Analysis Investigation.

The Room Where it Happens

By Rachel Kaplan, PhD student, OSU College of Earth, Ocean, and Atmospheric Sciences and Department of Fisheries and Wildlife, Geospatial Ecology of Marine Megafauna Lab

As I solidified my grad school plans last spring, one of the things that made me most excited to join the GEMM Lab was the direct applicability of its research to management and conservation practices. Seeing research directly plugged into current problems facing society is always inspirational to me. My graduate research will be part of the GEMM Lab’s project to identify co-occurrence between whales and fishing effort in Oregon, with the goal of helping to reduce whale entanglement risk. Recently, watching the Oregon Department of Fish and Wildlife (ODFW) Commission in action gave me a fascinating, direct look at how the management sausage gets made.

Two humpback whales surface together off the coast of Oregon. Photo taken under NOAA/NMFS research permit #21678.

At the September Commission meeting, ODFW Marine Resources Program Manager Caren Braby presented proposed rule changes in the management of the Oregon dungeness crab fleet. As part of a coordinated effort with Washington and California, the main goal of these changes is to reduce the risk of whale entanglements, which have increased sharply in US West Coast waters since 2014. 

With the aim of maximizing the benefit to whales while minimizing change to the fishery, Braby and her staff developed a recommendation for a shift in summer fishing effort, when whales are most abundant in Oregon waters. Based on diverse considerations — including the distributions of humpback whales off Oregon and season fishery economics — she outlined options along what she termed a “spectrum of reduced risk,” which included possible shifts in the fishing season, spatial extent, and number of pots deployed.

Although the GEMM Lab project to provide a robust understanding of whale distribution in Oregon waters is not yet complete, the data collected to-date has already significantly refined knowledge of whale distributions off the coast — and it directly informed the proposed monthly depth limitations for fishing effort. It is never possible to have perfect knowledge of an ecosystem, and resource managers must navigate this inherent complexity as they make decisions. As the GEMM Lab collects and analyzes more data on the distribution of whales and their prey, our ability to inform management decisions can become even more precise and effective.

Braby proposed that the fleet reduce the number of crab pots deployed by 20% and prohibit fishing at depths greater than 30 fathoms, starting May 1, for the next three seasons. The goal of this recommendation is to effectively separate the bulk of fishing effort from the deep waters where humpback whales forage, when they visit their feeding grounds off the coast of Oregon during the summer.

ODFW Marine Resources Program Manager Caren Braby outlined management options along a “spectrum of reduced risk.” Source: ODFW

Following Braby’s presentation, a public comment period allowed stakeholders to offer their own opinions and requests for the Commission to consider. Fisherman, lawyers, and members of conservation nonprofits each provided succinct three-minute statements, offering a wide range of opinions and amendments to the proposed rule changes.

This comment period highlighted how truly multifaceted this decision-making process is, as well as the huge number of livelihoods, economic impacts, and types of data that must be considered. It also raised essential questions — how do you make regulations that protect whales without favoring one group of stakeholders over another? How can you balance multiple levels of law with the needs of local communities?

Even during heated moments of this meeting, the tone of the dialog impressed me. This topic is inevitably a contentious and emotional issue. Yet even people with opposing viewpoints maintained focus on their common goals and common ground, and frequently reiterated their desire to work together.

After more than six hours of presentations, comments, and deliberation, the Commission voted on the proposed rule changes. They decided to adopt somewhat more liberal rule changes than Braby had proposed — a 20% reduction in crab pots and a prohibition on fishing at depths greater than 40 fathoms, starting May 1. After three years, the Commission will evaluate the efficacy of these new policies, and plan to refine or change the rules based on the best available data. 

Witnessing this decision-making process gave me a new perspective on the questions and context my research will fit into, and this understanding will help me become a better collaborator. Watching the Commission in action also underscored the difficult position managers are often put in. They must make decisions based on incomplete knowledge that will inevitably impact people’s lives — but they also need to protect the species and biodiversity, that also have an innate right to exist in natural ecosystems. Seeing the intricacies of this balancing act made me glad that I get to be part of research that can inform important management decisions in Oregon.

ODFW Marine Resources Program Manager Caren Braby’s presentation begins around an hour and 52 minutes into the video, and it is followed by a question and answer session and public testimony.

Tales from the birds in the nest (on the ship at sea)

Clara Bird, PhD Student, OSU Department of Fisheries and Wildlife, Geospatial Ecology of Marine Megafauna Lab

Greetings from the NOAA research vessel Shimada! As you may know from previous blogs, usually one member of the GEMM Lab goes on the Northern California Current (NCC) ecosystem survey cruises as a marine mammal observer to collect data for the project Where are whales in Oregon waters? But for this September 2020 cruise we have two observers on-board. I’m at-sea  with fellow GEMM lab student Dawn Barlow to learn the ropes and procedures for how we collect data. This research cruise is exciting for a few reasons: first, this is my first cruise as a marine mammal observer! And second, this is the first NOAA Northwest Fisheries Science Center research cruise since the COVID-19 pandemic began in the United States.

Our job as observers involves surveying for marine mammals from the flying bridge, which is the upper most deck of the ship, above the Bridge where the officers command the vessel. Here, we are referred to as the “birds in the nest” by the officers (something I find fitting given my last name). We spend our time looking out at the water with our binoculars searching for any sign of a marine mammal. These signs include: a blow, a fluke, a flipper, or the splash of a dolphin. Surveys involve long stretches of time staring at the ocean seeing nothing but blue waves, punctuated by exciting moments. The level of excitement of these moments can range from finally seeing a blow in the distance to seeing a whale breach! As of the time I’m writing this blog, we’ve been at sea for six days and have four more to go, so I will describe the things we’ve seen and my experience being on a primarily oceanographic research cruise.

We started day one transiting offshore of Newport, right into some whale soup! What started as a few distant blows quickly became an ocean full of whales. Dawn and I were some-what frantic as we worked to keep track of the many humpback and blue whales that were around us (I saw my first blue whale!). We even saw a humpback whale breaching! This introduction to marine mammal observation was an exciting exercise in keeping track of blows and rapid species identification. Day two was pretty similar, as we spent the day travelling back inshore along the same path we had followed offshore on day one. It was cool to see that there were still many whales in the same area.

On day three we woke up to dense fog, and overall pretty poor conditions for marine mammal observing. One of the challenges of this work is that not only does bad weather make it hard to see, but it also makes it hard for us to be able to say that mammals were truly absent. In bad observation conditions we cannot know if we did not see anything because the animals were not there or if we just could not see them through the swell, fog or white-caps. However, by the late afternoon the fog cleared and we had a spectacular end of the day. We saw a killer whale breach (Image 1) and a humpback whale tail lobbing (smacking it’s fluke against the surface of the water) in front of a stunning sunset (Image 2).

(Top) Figure 1. A killer whale breaching. Photo credit: Clara Bird. (Bottom) Figure 2. A humpback whale fluke at sunset. Photo credit: Dawn Barlow.

Day four was a bit of a marine mammal work reality check. While spectacular evenings like day three are memorable and exhilarating, they tend to be rare. The weather conditions on day four were pretty poor and we ended up surveying from the bridge for most of the day and not seeing much. Conditions improved on day five and we had some fun dolphin sightings where they came and rode on the wake from the bow, and observed a sperm whale blow in the distance!

The weather was not great today (day six), especially in the morning, but we did have one particularly exciting sighting right along the edge of Heceta Bank. While we were stopped at an oceanographic sampling station, we were visited by a group of ~30 pacific white sided dolphins who spent about half an hour swimming around the ship. We also saw several humpback whales, a fur seal, and a Mola mola (Ocean sunfish)! It was incredible to be surrounded by so many different species, all so close to the ship at the same time.

Overall, it has been wonderful to be out at sea after the many isolating months of COVID. And, it has been an exciting and interesting experience being surrounded by non-whale scientists who think about this ecosystem from a different perspective. This cruise is focused on biological oceanography, so I have had the great opportunity to learn from these amazing scientists about what they study and what oceanographic patterns they document. It’s a good reminder of our interconnected research. While it’s been cool to observe marine mammals and think about something totally different from my research on gray whale behavior, I have also enjoyed finding the similarities. For example, just last night I had a conversation with a graduate student researching forams (check out this link to learn more about these super cool tiny organisms!). Even though the organisms we study are polar opposites in terms of size, we actually found out that we had a good bit in common because we both use images to study our study species and have both encountered similar unexpected technical challenges in our methods.

I am thoroughly enjoying my time being one of the “birds in the nest”, contributing data to this important project, and meeting these wonderful scientists. If you are curious about how the rest of the cruise goes, make sure to check out Dawn’s blog next week!