Scientific publishing: Impact factor, open access and citations

By Leila Lemos1 and Rachel Ann Hauser-Davis2

1PhD candidate, Fisheries and Wildlife Department, OSU

2PhD, CESTEH/ENSP/Fiocruz, Rio de Janeiro, Brazil

Scientific publishing not only communicates new knowledge, but also is a measure of each scientist’s success: the impact each scientist has on his/her field is often measured by his/her number of publications and the reputation of the journals he/she published in. Therefore, publishing in reputable journals, with a high impact factor, is often essential to get a job, promotion and tenure. So, what is an impact factor?

The impact factor (IF) was first created in the 1960’s and is a measure of a journal’s impact on science, as reflected by the yearly average number of citations to recent articles published in that journal. The IF is used to compare the impact of journals within disciplines. Journals with higher impact factors are deemed as more prestigious and of better quality than those with lower ones.

The IF of a journal for any given year is calculated as the number of citations, received in that year, of articles published in that journal during the two preceding years, divided by the total number of articles published in that journal during the two preceding years, as follows:

In recent years, open access (OA) journals have emerged, changing how we perceive publications. However, the role and significance of IF is still present, valuable and used worldwide.

Conventional (non-open access) journals cover publishing costs through access fees, such as subscriptions, site licenses or download charges, which can be paid by universities, research institutions and, sometimes, by individuals. Papers published in OA journals, on the other hand, are distributed online and free of cost. However, there are still publication costs, which are usually paid by the authors. And, open access article processing charges are not cheap, ranging from a few hundred to several thousand dollars, depending on the field (more thoughts on this theme here).

It seems imbalanced that researchers have to pay for their work to be published. They have carried out a study and have obtained results that should be shared with the community. These results should not be treated as a commercial item to be sold. Also, it ends strengthening those who have resources and weakening those who do not have, increasing the division between Northern and Southern hemispheres, and narrowing the knowledge-production system (Burgman 2018).

Thus, a free-of-charge research paper would be interesting for everyone. PeerJ is a good example of a recent OA, free of publishing costs, peer-reviewed, and scholarly journal, that was released in 2013. It’s a totally new model and pushes the boundaries. In addition, there are hybrid journals (i.e., Conservation Biology) that offer both conventional and OA modes, leaving it to the authors to decide what they prefer (Burgman 2018). In many cases, disadvantaged authors might also be able to appeal for waivers. Thus, authors who cannot pay publishing fees might still see their work getting published.

However, this is not how the publishing system typically works. Therefore, researchers need to determine where to publish based on the journal IF and focus/audience, on the different price structures and fees, and whether it is OA or not.

Researchers in general want their articles to be openly accessible for everyone, not just those who can afford to pay the journal for access, so they can increase visibility of their work. Open access can increase the impact/reach of a research paper by facilitating paper downloads, access, and use in other scientific research, which may, in turn, lead to higher citation rate (Eyesenbach 2006).

Higher citation rates would also improve researchers’ H-index: an author-level metric that measures both productivity and citation impact of a scientist or scholar, based on the scientist’s most cited papers and the number of citations that they have received in publications.

The graph below exemplifies the h-index that is based on the maximum value of h such that the given author/journal has published h papers that have each been cited at least h times. In other words, the index is designed to improve with number of publications or citations. The index can only be compared between researchers from same field, as citation conventions might differ widely among different fields.

H-index from a plot of decreasing citations for numbered papers
Source: Wikipedia


However, publishing in an OA journal might easily increase researchers’ H-index and journals’ IF. Many researchers have also considered OA as an “artificial citation enhancer”.

As with any new system, some are opposed to the establishment of the OA system, including researchers, academics, librarians, university administrators, funding agencies, government officials, publishers and editorial staff, among many others (Markin 2017). This opposition claims that OA publishing leads to financial damages to the large publishers worldwide, and, mainly, that this system may damage the peer review system in place today, leading to reduced scientific quality (such as “you pay, you publish” predatory journals that take advantage of the paid system by publishing as fast as possible, without any scientific rigor whatsoever).

However, many reputable journals, such as Elsevier, Springer, Wiley and Blackwell, now offer OA as an option for their established journals. This approach is simply another option for authors, where they may pay if they want for their paper to be available for everyone. Even if this option is available, manuscripts still go through a rigorous peer-review that occurs with both conventional and OA journals. Thus, publishing in OA should be just as rigorous.

Open access papers would be the most “scientifically ethical”, as science is aimed at society, for society, and this type of publishing furthers research reach. However, paying thousands of dollars is sometimes very complicated, as this means less money for fieldwork costs, gears, laboratory analyses, among others.

All in all, OA is a recent development that is changing scientist approach to publication. The future of scientific publication seems uncertain and likely to hold new developments in the near future.


References:

Burgman M. 2018. Open access and academic imperialism. Conservation Biology 0 (0): 1–2. DOI: 10.1111/cobi.13248.

Eysenbach G. 2006. Citation Advantage of Open Access Articles. PLoS Biology 4 (5): e157. doi:10.1371/journal.pbio.0040157. PMC 1459247. PMID 16683865.

Markin P. 2017. The Sustainability of Open Access Publishing Models Past a Tipping Point. Open Science. Retrieved 26 April 2017.

The Intersection of Science and Politics

By Alexa Kownacki, Ph.D. Student, OSU Department of Fisheries and Wildlife, Geospatial Ecology of Marine Megafauna Lab

As much as I try to keep politics out of my science vocabulary, there are some ties between the two that cannot be severed. Often, science in the United States is very linked to the government because funding can be dependent on federal, state, and/or local government decisions. Therefore, it is part of our responsibility as scientists to be, at least, informed on governmental proceedings.

The United States has one agency that is particularly important to those of us conducting marine science: the National Oceanic and Atmospheric Administration (NOAA). NOAA’s mission is science, service, and stewardship with three major components:

  1. To understand and predict changes in climate, weather, oceans and coasts
  2. To share that knowledge and information with others
  3. To conserve and manage coastal and marine ecosystems and resources
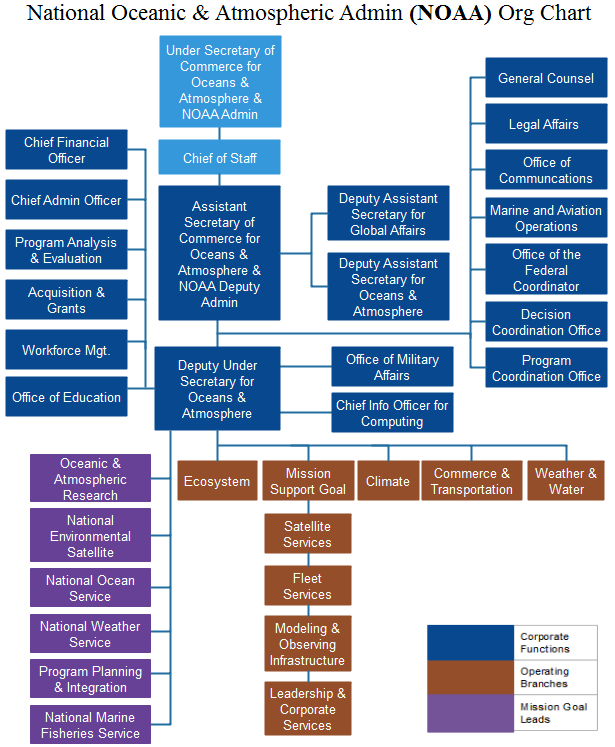
noaa org chart
Organizational Chart of NOAA. (Image source: OrgCharting)

Last year, the U.S. Senate confirmed Retired Rear Admiral Timothy Gallaudet, Ph.D., as the Assistant Secretary of Commerce for Oceans and Atmosphere for the Department of Commerce in NOAA. This position is an appointment by the current President of the United States, and is tasked with overseeing the daily functions and the strategic and operational future of NOAA. NOAA oversees the National Marine Fisheries Service (NMFS), which is an agency responsible for the stewardship and management of the nation’s living marine resources. NMFS is a major player when it comes to marine science, particularly through the determination of priorities for research and management of marine species and habitats within the United States’ exclusive economic zone (EEZ).

In dark blue, the United States’ Exclusive Economic zones, surrounding land masses in green. (Figure by K. Laws)

Recently, I had the opportunity to hear Dr. Gallaudet speak to scientists who work for, or in conjunction with, a NMFS office. After the 16% budget cut from the fiscal year 2017 to 2018, many marine scientists are concerned about how budget changes will impact research. Therefore, I knew Dr. Gallaudet’s visit would provide insight about the future of marine science in the United States.

Dr. Gallaudet holds master’s and doctoral degrees in oceanography from Scripps Institution of Oceanography, as well as a bachelor’s degree from the United States Naval Academy. He spent 32 years in the Navy before stepping into his current role as Assistant Secretary. Throughout the meeting, Dr. Gallaudet emphasized his leadership motto: All in, All Good, and All for One.

Dr. Gallaudet also spoke about where he sees NOAA moving towards: the private sector.

A prominent conservation geneticist asked Dr. Gallaudet how NOAA can better foster advanced degree-seeking students. The geneticist commented that a decade ago there were 10-12 PhD students in this one science center alone. Today, there is “maybe one”. Dr. Gallaudet responded that the science centers should start reaching out to private industry. In response to other questions, he continued to redirect scientists toward United States-based corporations that could join forces with government agencies. He believes that if NMFS scientists share data and projects with local biotechnology, medical, and environmental companies, the country can foster positive relationships with industry. Dr. Gallaudet commented that the President wants to create these win-win situations: where the US government pairs with for-profit companies. It is up to us, as the scientists, how we make those connections.

As scientists, we frequently avoid heated political banter in the hopes of maintaining an objective and impartial approach to our research. However, these lines can be blurred. Much of our science depends on political decisions that mold our future, including how funding is allocated and what goals are prioritized. In 2010, Science Magazine published an online article, “Feeding your Research into the Policy Debate” where Elisabeth Pain highlighted the interdisciplinary nature of science and policy. In Pain’s interview with Troy Benn, a PhD student in Urban Ecology at the time, Benn comments that he learned just how much scientists play a role in policy and how research contributes to policy deliberations. Sometimes our research becomes of interest to politicians and sometimes it is the other way around.

From my experiences collaborating with government entities, private corporations, and nonprofit organizations, I realize that science-related policy is imperative. California established a non-profit, the California Ocean Science Trust (OST), for the specific objective supporting management decisions with the best science and bridging science and policy. A critical analysis of the OST by Pietri et al., “Using Science to Inform Controversial Issues: A Case Study from the California Ocean Science Trust”, matches legislation with science. For example, the Senate Bill (SB) 1319, better known as the California Ocean Protection Act (COPA), calls for “decisions informed by good science” and to “advance scientific understanding”. Science is explicitly written into legislation and I think that is a call to action. If an entire state can mobilize resources to create a team of interdisciplinary experts, I can inform myself on the politics that have potential to shape my future and the future of my science.

An image of the NOAA ship Bell M. Shimada transiting between stations. Multiple members of the GEMM Lab conducted surveys from this NOAA vessel in 2018. (Image source: Alexa Kownacki)

Oregon Sea Otter Status of Knowledge Symposium

By Dominique Kone, Masters Student in Marine Resource Management

Over the past year, the GEMM Lab has been investigating the ecological factors associated with a potential sea otter reintroduction to Oregon. A potential reintroduction is not only of great interest to our lab, but also to several other researchers, managers, tribes, and organizations in the state. With growing interest, this idea is really starting to gain momentum. However, the best path forward to making this idea a reality is somewhat unknown, and will no doubt take a lot of time and effort from multiple groups.

In an effort to catalyze this process, the Elakha Alliance – led by Bob Bailey – organized the Oregon Sea Otter Status of Knowledge Symposium earlier this month in Newport, OR. The purpose of this symposium was to share information, research, and lessons learned about sea otters in other regions. Speakers – primarily scientists, managers, and graduate students – flew in from all over the U.S. and the Canadian west coast to share their expertise and discuss various factors that must be considered before any reintroduction efforts begin. Here, I review some of the key takeaways from those discussions.

Source: The Elakha Alliance

To start the meeting, Dr. Anne Salomon – an associate professor from Simon Fraser University – and Kii’iljuus Barbara Wilson – a Haida Elder – gave an overview of the role of sea otters in nearshore ecosystems and their significance to First Nations in British Columbia. Hearing these perspectives not only demonstrated the various ecological effects – both direct and indirect – of sea otters, but it also illustrated their cultural connection to indigenous people and the role tribes can play (and currently do play in British Columbia) in co-managing sea otters. In Oregon, we need to be aware of all the possible effects sea otters may have on our ecosystems and acknowledge the opportunity we have to restore these cultural connections to Oregon’s indigenous people, such as the Confederated Tribes of Siletz Indians.

Source: The Elakha Alliance and the Confederated Tribes of Siletz Indians.

The symposium also involved several talks on the recovery of sea otter populations in other regions, as well as current limitations to their population growth. Dr. Lilian Carswell and Dr. Deanna Lynch – sea otter and marine conservation coordinators with the U.S. Fish & Wildlife Service – and Dr. Jim Bodkin – a sea otter ecologist – provided these perspectives. Interestingly, not all stocks are recovering at the same rate and each population faces slightly different threats. In California, otter recovery is slowed by lack of available food and mortality due to investigative shark bites, which prevents range expansion. In other regions, such as Washington, the population appears to be growing rapidly and lack of prey and shark bite-related mortality appear to be less important. However, this population does suffer from parasitic-related mortality. The major takeaway from these recovery talks is that threats can be localized and site-specific. In considering a reintroduction to Oregon, it may be prudent to investigate if any of these threats and population growth limitations exist along our coastline as they could decrease the potential for sea otters to reestablish.

Source: The Seattle Aquarium and U.S. Fish & Wildlife Service.

Dr. Shawn Larson – a geneticist and ecologist from the Seattle Aquarium – gave a great overview of the genetic research that has been conducted for historical (pre-fur trade) Oregon sea otter populations. She explained that historical Oregon populations were genetically-similar to both southern and northern populations, but there appeared to be a “genetic gradient” where sea otters near the northern Oregon coast were more similar to northern populations – ranging to Alaska – and otters from the southern Oregon coast were more similar to southern populations – ranging to California. Given this historic genetic gradient, reintroducing a mixture of sea otters – subsets from contemporary northern and southern stocks – should be considered in a future Oregon reintroduction effort. Source-mixing could increase genetic diversity and may more-closely resemble genetic diversity levels found in the original Oregon population.

At the end of the meeting, an expert panel – including Dr. Larson, Dr. Bodkins, Dr. Lynch, and Dr. Carswell – provided their recommendations on ways to better inform this process. To keep this brief, I’ll discuss the top three recommendations I found most intriguing and important.

  1. Gain a better understanding of sea otter social behavior. Sea otters have strong social bonds, and previous reintroductions have failed because relocated individuals returned to their capture sites to rejoin their source populations. While this site fidelity behavior is relatively understood, we know less about the driving mechanisms – such as age or sex – of those behaviors. Having a sound understanding of these behaviors and their mechanisms could help to identify those which may hinder reestablishment following a reintroduction.
  2. When anticipating the impacts of sea otters on ecosystems, investigate the benefits too. When we think of impacts, we typically think of costs. However, there are documented benefits of sea otters, such as increasing species diversity (Estes & Duggins 1995, Lee et al. 2016). Identifying these benefits – as well as to people – would more completely demonstrate their importance.
  3. Investigate the human social factors and culture in Oregon relative to sea otters, such as perceptions of marine predators. Having a clear understanding of people’s attitudes toward marine predators – particularly marine mammals – could help managers better anticipate and mitigate potential conflicts and foster co-existence between otters and people.
Source: Paul Malcolm

While much of the symposium was focused on learning from experts in other regions, I would be remiss if I didn’t recognize the great talks given by a few researchers in Oregon – including Sara Hamilton (OSU doctoral student), Dr. Roberta Hall (OSU emeritus professor), Hannah Wellman (University of Oregon doctoral student), and myself. Individually, we spoke about the work that has already been done and is currently being done on this issue – including understanding bull kelp ecology, studying sea otter archaeological artifacts, and a synthesis of the first Oregon translocation attempt. Collectively, our talks provided some important context for everyone else in the room and demonstrated that we are working to make this process as informed as possible for managers. Oregon has yet to determine if they will move forward with a sea otter reintroduction and what that path forward will look like. However, given this early interest – as demonstrated by the symposium – we, as researchers, have a great opportunity to help guide this process and provide informative science.

References:

Estes, J. A. and D. O. Duggins. 1995. Sea otters and kelp forests in Alaska: generality and variation in a community ecological paradigm. Ecological Monographs. 65: 75-100.

Lee, L. C., Watson, J. C., Trebilco, R., and A. K. Salomon. 2016. Indirect effects and prey behavior mediate interactions between an endangered prey and recovering predator. Ecosphere. 7(12).

Albatrosses at sunrise, dolphins at sunset: Northern California Current cruise

By Dawn Barlow, PhD student, Geospatial Ecology of Marine Megafauna Lab, Department of Fisheries and Wildlife, Oregon State University

Sun on my face and wind in my hair, scanning the expanse of blue. Forty minutes on, twenty minutes off, from sunrise until sunset, day after day. Hours of seemingly empty blue, punctuated by graceful black-footed albatrosses wheeling and gliding over the swells, by the splashing approach of a curious group of Pacific white-sided dolphins coming to play in the bow of the ship, by whale spouts on the horizon and the occasional breaching humpback. A flurry of data entry—geographic coordinates, bearing and distance from the ship, number of animals, species identification, behavior—and then back to blue.

Scanning for marine mammals from the flying bridge of NOAA ship Bell M. Shimada. Photo: Jess O’Loughlin.

I’ve just returned from the Northern California Current (NCC) ecosystem cruise aboard NOAA ship Bell M. Shimada. My role on board was the marine mammal observer, logging marine mammal sightings during the transits between sampling stations. We surveyed and sampled between Cape Mears, Oregon and Trinidad, California, from right along the coast out to 200 nautical miles offshore. Resources in the marine environment are patchy, and our coastline is highly productive. This diversity in environmental conditions creates niche habitats for many species, which is one reason why surveying and sampling across a broad geographic range can be so informative. We left Newport surrounded by gray whales, feeding in green, chilly waters at temperatures around 12°C. Moving west, the marine mammal and seabird sightings were increasingly sparse, the water increasingly blue, and the surface temperature warmed to a balmy 17°C. We had reached offshore waters, an ocean region sometimes referred to as the “blue desert”. For an entire day I didn’t see a single marine mammal and only just a few seabirds, until a handful of common dolphins—more frequently seen in warm-temperate and tropical waters to the south—joined the ship at sunset. As we transited back inshore over the productive Heceta Bank, the water became cooler and greener. I stayed busy logging sightings of humpback and gray whales, harbor porpoise and Dall’s porpoise, pacific white-sided dolphins and sea lions. These far-ranging marine predators must find a way to make a living in the patchy and dynamic ocean environment, and therefore their distribution is also patchy—aggregated around areas of high productivity and prey availability, and occasionally seen transiting in between.

Here are a few cruise highlights:

Curious groups of common dolphins (Delphinus delphis) came to play in the bow wake of the ship and even checked out the plankton nets when they were deployed. Common dolphins are typically found further south, however we saw several groups of them in the warmer waters far offshore.

Ocean sunfish (Mola mola) will occasionally lay themselves flat at the surface so that seabirds will pick them clean of any parasites. I was delighted to observe this for the first time just off Newport! There were several more sunfish sightings throughout the cruise.

Gull picking parasites off an ocean sunfish (Mola mola). Photo: Dawn Barlow.

A masked booby (Sula dactylatra) hung around the ship for a bit, 16 nautical miles from shore, just south of the Oregon-California border. Considered a tropical species, a sighting this far north is extremely rare. While masked boobies are typically distributed in the Caribbean and tropical Pacific from Mexico to Australia, one found its way to the Columbia River in 2006 (first record in the state of Oregon) and another showed up here to Newport in 2015 – reportedly only the second to be recorded north of Mendocino County, California. Perhaps this sighting is the third?

Masked booby (Sula dactylatra). Photo: Dawn Barlow.

While most of my boat-based fieldwork experiences have been focused on marine mammal research, this was an interdisciplinary cruise aimed at studying multiple aspects of the northern California current ecosystem. There were researchers on board studying oceanography, phytoplankton and harmful algal blooms, zooplankton, and microplastics. When a group of enthusiastic scientists with different areas of expertise come together and spend long days at sea, there is a wonderful opportunity to learn from one another. The hydroacoustic backscatter on the scientific echosounder prompted a group discussion about vertical migration of plankton one evening. Another evening I learned about differences in energetic content between krill species, and together we mused about what that might mean for marine predators. This is how collaborations are born, and I am grateful for the scientific musings with so many insightful people.

Thank you to the Shimada crew and the NCC science team for a wonderful cruise!

The NCC science team after a successful cruise!

Over the Ocean and Under the Bridges: STEM Cruise on the R/V Oceanus

By Alexa Kownacki, Ph.D. Student, OSU Department of Fisheries and Wildlife, Geospatial Ecology of Marine Megafauna Lab

From September 22nd through 30th, the GEMM Lab participated in a STEM research cruise aboard the R/V Oceanus, Oregon State University’s (OSU) largest research vessel, which served as a fully-functioning, floating, research laboratory and field station. The STEM cruise focused on integrating science, technology, engineering and mathematics (STEM) into hands-on teaching experiences alongside professionals in the marine sciences. The official science crew consisted of high school teachers and students, community college students, and Oregon State University graduate students and professors. As with a usual research cruise, there was ample set-up, data collection, data entry, experimentation, successes, and failures. And because everyone in the science party actively participated in the research process, everyone also experienced these successes, failures, and moments of inspiration.

The science party enjoying the sunset from the aft deck with the Astoria-Megler bridge in the background. (Image source: Alexa Kownacki)

Dr. Leigh Torres, Dr. Rachael Orben, and I were all primarily stationed on flybridge—one deck above the bridge—fully exposed to the elements, at the highest possible location on the ship for best viewing. We scanned the seas in hopes of spotting a blow, a splash, or any sign of a marine mammal or seabird. Beside us, students and teachers donned binoculars and positioned themselves around the mast, with Leigh and I taking a 90-degree swath from the mast—either to starboard or to port. For those who had not been part of marine mammal observations previously, it was a crash course into the peaks and troughs—of both the waves and of the sightings. We emphasized the importance of absence data: knowledge of what is not “there” is equally as important as what is. Fortunately, Leigh chose a course that proved to have surprisingly excellent environmental conditions and amazing sightings. Therefore, we collected a large amount of presence data: data collected when marine mammals or seabirds are present.

High school student, Chris Quashnick Holloway, records a seabird sighting for observer, Dr. Rachael Orben. (Image source: Alexa Kownacki).

When someone sighted a whale that surfaced regularly, we assessed the conditions: the sea state, the animal’s behavior, the wind conditions, etc. If we deemed them as “good to fly”, our licensed drone pilot and Orange Coast Community College student, Jason, prepared his Phantom 4 drone. While he and Leigh set up drone operations, I and the other science team members maintained a visual on the whale and stayed in constant communication with the bridge via radio. When the drone was ready, and the bridge gave the “all clear”, Jason launched his drone from the aft deck. Then, someone tossed an unassuming, meter-long, wood plank overboard—keeping it attached to the ship with a line. This wood board serves as a calibration tool; the drone flies over it at varying heights as determined by its built-in altimeter. Later, we analyze how many pixels one meter occupied at different heights and can thereby determine the body length of the whale from still images by converting pixel length to a metric unit.

High school student, Alishia Keller, uses binoculars to observe a whale, while PhD student, Alexa Kownacki, radios updates on the whale’s location to the bridge and the aft deck. (Image source: Tracy Crews)

Finally, when the drone is calibrated, I radio the most recent location of our animal. For example, “Blow at 9 o’clock, 250 meters away”. Then, the bridge and I constantly adjust the ship’s speed and location. If the whale “flukes” (dives and exposes the ventral side of its tail), and later resurfaced 500 meters away at our 10 o’clock, I might radio to the bridge to, “turn 60 degrees to port and increase speed to 5 knots”. (See the Hidden Math Lesson below). Jason then positions the drone over the whale, adjusting the camera angle as necessary, and recording high-quality video footage for later analysis. The aerial viewpoint provides major advantages. Whales usually expose about 10 percent of their body above the water’s surface. However, with an aerial vantage point, we can see more of the whale and its surroundings. From here, we can observe behaviors that are otherwise obscured (Torres et al. 2018), and record footage that to help quantify body condition (i.e. lengths and girths). Prior to the batteries running low, Jason returns the drone back to the aft deck, the vessel comes to an idle, and Leigh catches the drone. Throughout these operations, those of us on the flybridge photograph flukes for identification and document any behaviors we observe. Later, we match the whale we sighted to the whale that the drone flew over, and then to prior sightings of this same individual—adding information like body condition or the presence of a calf. I like to think of it as whale detective work. Moreover, it is a team effort; everyone has a critical role in the mission. When it’s all said and done, this noninvasive approach provides life history context to the health and behaviors of the animal.

Drone pilot, Jason Miranda, flying his drone using his handheld ground station on the aft deck. (Photo source: Tracy Crews)

Hidden Math Lesson: The location of 10 o’clock and 60 degrees to port refer to the exact same direction. The bow of the ship is our 12 o’clock with the stern at our 6 o’clock; you always orient yourself in this manner when giving directions. The same goes for a compass measurement in degrees when relating the direction to the boat: the bow is 360/0. An angle measure between two consecutive numbers on a clock is: 360 degrees divided by 12-“hour” markers = 30 degrees. Therefore, 10 o’clock was 0 degrees – (2 “hours”)= 0 degrees- (2*30 degrees)= -60 degrees. A negative degree less than 180 refers to the port side (left).

Killer whale traveling northbound.

Our trip was chalked full of science and graced with cooperative weather conditions. There were more highlights than I could list in a single sitting. We towed zooplankton nets under the night sky while eating ice cream bars; we sang together at sunset and watched the atmospheric phenomena: the green flash; we witnessed a humpback lunge-feeding beside the ship’s bow; and we saw a sperm whale traveling across calm seas.

Sperm whale surfacing before a long dive.

On this cruise, our lab focused on the marine mammal observations—which proved excellent during the cruise. In only four days of surveying, we had 43 marine mammal sightings containing 362 individuals representing 9 species (See figure 1). As you can see from figure 2, we traveled over shallow, coastal and deep waters, in both Washington and Oregon before inland to Portland, OR. Because we ventured to areas with different bathymetric and oceanographic conditions, we increased our likelihood of seeing a higher diversity of species than we would if we stayed in a single depth or area.

Humpback whale lunge feeding off the bow.
Number of sightings Total number of individuals
Humpback whale 22 40
Pacific white-sided dolphin 3 249
Northern right whale dolphin 1 9
Killer whale 1 3
Dall’s porpoise 5 49
Sperm whale 1 1
Gray whale 1 1
Harbor seal 1 1
California sea lion 8 9
Total 43 362

Figure 1. Summary table of all species sightings during cruise while the science team observed from the flybridge.

Pacific white-sided dolphins swimming towards the vessel.

Figure 2. Map with inset displaying study area and sightings observed by species during the cruise, made in ArcMap. (Image source: Alexa Kownacki).

Even after two days of STEM outreach events in Portland, we were excited to incorporate more science. For the transit from Portland, OR to Newport, OR, the entire science team consisted two people: me and Jason. But even with poor weather conditions, we still used science to answer questions and help us along our journey—only with different goals than on our main leg. With the help of the marine technician, we set up a camera on the bow of the ship, facing aft to watch the vessel maneuver through the famous Portland bridges.

Video 1. Time-lapse footage of the R/V Oceanus maneuvering the Portland Bridges from a GoPro. Compiled by Alexa Kownacki, assisted by Jason Miranda and Kristin Beem.

Prior to the crossing the Columbia River bar and re-entering the Pacific Ocean, the R/V Oceanus maneuvered up the picturesque Columbia River. We used our geospatial skills to locate our fellow science team member and high school student, Chris, who was located on land. We tracked each other using GPS technology in our cell phones, until the ship got close enough to use natural landmarks as reference points, and finally we could use our binoculars to see Chris shining a light from shore. As the ship powered forward and passed under the famous Astoria-Megler bridge that connects Oregon to Washington, Chris drove over it; he directed us “100 degrees to port”. And, thanks to clear directions, bright visual aids, and spatiotemporal analysis, we managed to find our team member waving from shore. This is only one of many examples that show how in a few days at sea, students utilized new skills, such as marine mammal observational techniques, and honed them for additional applications.

On the bow, Alexa and Jason use binoculars to find Chris–over 4 miles–on the Washington side of the Columbia River. (Image source: Kristin Beem)

Great science is the result of teamwork, passion, and ingenuity. Working alongside students, teachers, and other, more-experienced scientists, provided everyone with opportunities to learn from each other. We created great science because we asked questions, we passed on our knowledge to the next person, and we did so with enthusiasm.

High school students, Jason and Chris, alongside Dr. Leigh Torres, all try to get a glimpse at the zooplankton under Dr. Kim Bernard’s microscope. (Image source: Tracy Crews).

Check out other blog posts written by the science team about the trip here.

Surprises from the field: Winter in the Falkland Islands

By Rachael Orben, Assistant Professor, Seabird Oceanography Lab

Fieldwork often comes with the unexpected. It is the reason why field work is so exciting – not only discovering something new about a species and ecosystem, but it is also often the catalyst for the development of novel ideas and projects. However, designing a successful field campaign to a new location (and acquiring funding) requires preconceived expectations that are not too far off from reality. Working with colonial breeding seabirds and pinnipeds has its advantages since these animals are predictably found at their colonies during the breeding period.  However, breeding failures can be worse than expected (see my blog on red-legged kittiwakes) and as I just learned, sometimes almost everything can be surprising.

At the end of August, I returned from a 6-week winter field campaign on Bird Island in the Falkland Islands led by Dr. Alastair Baylis a Senior Research Fellow at the South Atlantic Environmental Research Institute. We were there to study the fine-scale foraging ecology of South American fur seals. Despite a healthy research community in the Falklands, very little is known about South American fur seals in the region. Our time on Bird Island was probably the first time people had been on the island in winter since the days of sealing.

So, what did I find surprising?

I will list them here from slightly mundane to the very surprising.

1) First of all, it was winter and I expected it to be cold.

This is probably a case of me not doing my pre-field season research, but it was pleasantly not as cold as I expected. Generally, the temperatures were above freezing, which made doing everything much easier. Of course, I still wore lots of layers and drank lots of hot drinks, but overall it was fairly mild.  It was also less windy and less rainy than I had imagined and we had some beautiful sunny days.

2) I had hay fever!

Not something usually anticipated for winter field work, but the tussac grass was flowering and that left me with itchy eyes, a stuffy nose and lots of sneezes. I should mention that tussac grass is everywhere and many of the tussacs are taller than a person!

Now for the science surprises.

3) FEMALE Fur Seals took foraging trips That were much longer than we had anticipated.

We had a couple of females leave the colony and go on foraging trips for 10 days, others for ~2 weeks, and others for over 3 weeks! Previous work on the island indicated that female fur seals might take 4.1­ +/- 2 day trips (Thompson et al. 2003). Fortunately, we were on the island for the long-haul (6-weeks shower free) so we were able to wait them out and retrieve the tags (and the data) when the females came home. The differences in trip duration could simply reflect annual changes in prey availability, but we know very little about what fur seals are eating, especially during the winter (Baylis et al. 2013).

4) albatrosses were attending their colony.

As a reminder, this was the middle of winter. Generally, black-browed albatrosses do not return to their colonies until September since they lay eggs in October (Strange, 1992). There weren’t many birds the day we arrived in mid-July (n=9), but even so, that was odd enough that I began taking photos of the colony each day with the plan to count birds and quantify colony attendance.

…and for the most surprising of all…

5) South American Sea Lions males were killing and eating female South American fur seals!

We were slow to realize what was happening since it was so unexpected. After we deployed our tracking tags on fur seals we spent many hours at the colony simply observing. We started to see things that didn’t quite make sense. Females cautiously approaching the water. Male sea lions hanging out in the water. Then Dr. Baylis saw a male sea lion go up into the colony and grab a pup and eat it! Shortly after that, we saw two male sea lions chase a female out of the water and up the hill towards the colony. One male eventually came back down to a tide pool with a female he had killed in his mouth. From that point, it because very clear what was happening and we saw multiple kills.

It is unknown how often male southern sea lions eat fur seals, but it has been observed in the Falklands before, both in the 1970s and in more recent years (Gentry & Johnson 1981).  Worldwide, sea lions are known to occasionally eat fur seal pups (Gentry & Johnson 1981, Harcourt 1993, Bradshaw et al. 1998), but people have rarely observed sea lions predating females.

Our three scientific surprises are really what field work is all about. We came home with the tracking data we were hoping for and we came home with something arguably more valuable. We can use these new observations to make informed hypotheses about how marine predators fit into the ecosystem in ways that before our visit to Bird Island we would have never have expected. Hopefully, we will have a chance to go back!
References

Baylis AMM, Arnould JPY, Staniland IJ (2013) Diet of South American fur seals at the Falkland Islands. Marine Mammal Sci 30:1210–1219

Bradshaw CJA, Lalas C, Mcconkey S (1998) New Zealand sea lion predation on New Zealand fur seals. New Zealand Journal of Marine and Freshwater Research 32:101–104

Gentry RL, Johnson JH (1981) Predation by sea lions on northern fur seal neonates. Mammalia 45

Harcourt R (1993) Individual variation in predation on fur seals by southern sea lions (Otaria byronia) in Peru. Canadian Journal of Zoology 71:1908–1911

Strange, IJ (1992) Field Guide to the Wildlife of the Falkland Islands and South Georgia (Collins Pocket Guide)

Thompson DR, Moss S, Lovell P (2003) Foraging behaviour of South American fur seals Arctocephalus australis: extracting fine scale foraging behaviour from satellite tracks. Mar Ecol Prog Ser 260:285–296

Experiencing the Oregon Coast

By Dominique Kone, Masters Student in Marine Resource Management

An ecologist’s research may involve some combination of fieldwork and lab work. Yet, with modern advances in quantitative tools, such as models, computer-based research is becoming more popular. Furthermore, as the predictive capacity of models improve, they are becoming valuable to decision-makers to forecast how marine environments may respond to management decisions or phenomenon like climate change. While this type of research is important to society, I’ve often wondered if and how researchers may benefit by stepping away from their computer, every now and then, to observe the very subjects they’re studying.

For my thesis, I’m conducting an ecological assessment of a potential sea otter reintroduction to the Oregon coast. Through this work, I spend most of my time working at a desktop, analyzing spatial layers, and researching and synthesizing the literature. While I’ve learned a great deal about sea otters and the Oregon Coast, I felt that I needed to gain a better contextual understanding of this area, especially as someone from outside the region. Luckily, this summer, I had the perfect opportunity to explore this great state. Here, I share just some of the places I visited this past summer, what I’ve learned from my travels, and how these explorations have given me a deeper appreciation for the Oregon Coast and the implications of my research.

Source: Beachcombers NW.

For those of you unfamiliar with Oregon geography, the Oregon Coast is an expansive area stretching from Warrenton, which borders the Columbia River, in the north to the Oregon-California border just south of Brookings (approximately 362 miles). However, if we divide this area into three geographic regions – northern, central, and southern – some noticeable regional differences become apparent, both in terms of local topography and human use and visitation.

Relative to the northern and central coastlines, the geology of southern coastline (approximately Coos Bay to Brookings) is much more complex – comprising of rocky shorelines, sheltered coves and inlets, islands, and calm estuaries (overall, less sandy beaches). The region also appears to support a relatively higher biomass of macroalgae, including kelp. Taken altogether, the presence of these physical features appears to make the southern coast potentially suitable sea otter habitat, an important prerequisite of reintroduction efforts.

Pictured: Southern coastlines. Left: Samuel H. Boardman State Park near Brookings, OR. Right: Port Orford Heads State Park in Port Orford, OR. Source: Dominique Kone.

In contrast, the northern and central coastlines are predominantly comprised of sandy shorelines. However, these stretches of beaches are sometimes disrupted by complex and rocky habitat and have some of the largest estuaries and bays found along the entire Oregon Coast – such as Yaquina Bay, Tillamook Bay, and the Columbia River – all of which could also be potentially suitable habitat for sea otters. Furthermore, while you can find some kelp in these regions (i.e. Yaquina Head Lighthouse), these beds appear to be more dispersed and less dense than along the southern coast. By observing these features in person this summer, I came away with a much greater sense of just how biogeographically unique each of these regions is, as well as what it truly means for habitat to be “suitable”.

Pictured: Central coastlines. Left: Yaquina Head Marine Garden. Right: Agate Beach, OR. In this photo, Yaquina Head can be seen in the distance, demonstrating how quickly shorelines can change from sandy to rocky habitat in the northern and central regions. Source: Dominique Kone.

Aside from these physical characteristics, I also came away with a greater sense of the type of people who live and visit these regions. Along the Oregon Coast, dozens of towns, cities, unincorporated communities, and census-designated places are called home by some 653,112 people (State of Oregon. 2012). Yet, the southern coast is much less populated than the rest of the Oregon Coast. In fact, only 13% (people in Coos and Curry County) of the Oregon Coast population lives along the southern coast (State of Oregon. 2012). During my visit to the southern region, I noticed the typical beach-goers and overnight campers at various state parks, but there were not nearly as many in the northern and central regions. This demographic disparity is not surprising, given each region’s location in the state. The northern and central coasts are much closer to highly-populated cities such as Portland, Salem, Corvallis, and Eugene, potentially making them more accessible to weekend or seasonal visitors. In southern Oregon, the nearest in-land cities include Roseburg, Grants Pass, and Medford, but these populations pale in comparison to those in the central and northern regions.

Pictured: Beach-goers enjoying a pleasant stroll on Cannon Beach, OR. Source: Roger’s Inn.

After spending some time on the Oregon Coast, I wonder how these communities may be impacted by sea otters if they were to be reintroduced. Tourism and recreation are a huge part of the Oregon Coast lifestyle and economy. If managers were to bring sea otters back to Oregon, we could potential see an increase in visitation – as sea otters are an iconic and charismatic species – particularly to communities on the southern coast where sea otters may be more likely to establish. This increased tourism may come in the form of tourist redistribution from the northern and central coast to the southern region, an increase in overall tourists from all over the state, or even an influx from outside the state. Although these predictions are premature and based only on my recent observations, it is important to consider the societal impacts of sea otter reintroduction to our local communities.

To brings things back full circle, my coastal adventures provided me with a much deeper understanding of the uniqueness of the Oregon coast, as well as the people who call it home. Having this sound understanding is not only important for me as I conduct my research, but it is also vitally important for managers who are considering a sea otter reintroduction as this action could have coast-wide or localized impacts on these communities. If managers decide to move forward with a reintroduction effort, they could look at other regions along the U.S. west coast that currently have sea otters to assess how wildlife tourism is managed in these communities. For me, I’m glad I decided to step way from the computer to experience this beautiful area because it has provided me with a perspective I could not get from my data and models.


References:

State of Oregon. 2012. Natural Hazards Mitigation Plan: Region 1: Oregon Coast. Accessed here < https://www.oregon.gov/LCD/HAZ/docs/2.A.ORNHMP12-Reg1Profile.pdf >

A Summer of “Firsts” for Team Whale Storm

By Lisa Hildebrand, MSc student, OSU Department of Fisheries and Wildlife, Geospatial Ecology of Marine Megafauna Lab

To many people, six weeks may seem like a long time. Counting down six weeks until your favourite TV show airs can feel like time dragging on slowly (did anyone else feel that way waiting for Blue Planet II to be released?). Or crossing off the days on your calendar toward that much-needed holiday that is still six weeks away can feel like an eternity. It makes sense that six weeks should feel like a long time. After all, six weeks are approximately a ninth of an entire year. Yet, I can assure you that if you asked anyone on my research team this summer whether six weeks was a long time, they would all say no.

As I watched each of my interns present our research to a room of 50 engaged community members (Fig. 1) after our six week research effort, I couldn’t help but feel an overwhelming sense of pride for all of them at how far they had come during the course of the field season.

Figure 1. Our audience at the community presentation on August 31. Photo by Leigh Torres.

On the very first day of our two-week training back in July, I gave my team an introductory presentation covering gray whales, their ecology, what the next six weeks would look like, how this project had developed and its results to date (Quick side-note here: I want to give a huge shout out to Florence and Leigh as this project would not be what it is today without their hard work and dedication as they laid the groundwork for it three years ago and have continued to improve and expand it). I remember the looks on my interns’ faces and the phrase that comes to mind is ‘deer in headlights’. It isn’t surprising that this was the case as this internship was the first time any of them had done marine mammal field work, or any kind of field work for that matter. It makes me think back to my first taste of field work. I was a fresh high school graduate and volunteering with a bottlenose dolphin research group. I remember feeling out of place and unsure of myself, both in terms of data collection skills but also having to live with the same people I had worked with all day. But as the first few days turned into the first few weeks, I grew into my role and by the end of my time there, I felt like an expert in what I was doing. Based on the confidence with which my interns presented our gray whale foraging ecology research to an audience just over a week ago, I know that they too had become experts in these short six weeks. Experts in levelling a theodolite, in sighting a blow several kilometres out from our cliff site, in kayaking in foggy conditions, in communicating effectively in high stress situations – the list goes on and on.

While you may have read the previous blog posts written by each of my interns in the last four weeks and thus have a sense of who they are, I want to tell you a little more about each of these hardworking undergraduates that played a large role in making this year’s Port Orford gray whale season so effective. Although we did not have any local high school interns this year, the whole team hails from Oregon, specifically from Florence, Sweet Home and Portland.

Figure 2. Haley on the cliff equipped with the camera waiting for a whale to surface. Photo by Cynthia Leonard.

Haley Kent (Fig. 2), my co-captain and Marine Studies Initiative (MSI) intern, an Environmental Science major, is going into her senior year at OSU this fall. She is focused and driven, which I know will enable her to pursue her dream of becoming a shark researcher (I can’t even begin to describe her excitement when we saw the thresher shark on our GoPro video). I couldn’t have asked for a better right hand person for my first year taking over this project and I am excited to see what results she will reveal through her project of individual gray whale foraging preferences. Also, Haley has a big obsession for board games and provided the team with many evenings of entertainment thanks to Munchkin and King of Tokyo.

Figure 3. Dylan in the stern of the kayak on a foggy day reeling down the GoPro stick on the downrigger. Photo by Haley Kent.

Dylan Gregory (Fig. 3) is transferring from Portland Community College and is going to be an OSU junior this fall. Not only was Dylan always extremely helpful in working with me to come up with ways to troubleshoot or fix gear, but his portable speaker and long list of eclectic podcasts always made him a very good cliff team partner. He was also Team Whale Storm’s main chef in the kitchen, and while some of his dishes caused tears & sweat among some team members (Dylan is a big fan of spices), there were never any leftovers, indicating how delicious the food was.

Figure 4. Robyn on one of our day’s off visiting the gigantic Redwoods in California. Photo by Haley Kent.

Robyn Norman (Fig. 4) will be a sophomore at OSU this fall and her commitment to zooplankton identification has been invaluable to the project. Last year when she was a freshman, Robyn was given our zooplankton samples from 2017, a few identification guides and instructions on how to use the dissecting microscope, before she was left to her own devices. Her level of independence and dedication as a freshman was incredible and I am very grateful for the time and skills she has given to this work. Besides this though, Robyn always brought an element of happiness to the room and I can speak on behalf of the rest of the team, that when she was gone for a week on a dive trip, the house did not feel the same without her.

Figure 5. Hayleigh Middleton at the community presentation. Her dry humour and quips earned her a lot of laughter from the audience keeping them entertained. Photo by Tom Calvanese.

Hayleigh Middleton (Fig. 5), a fresh high school graduate and freshly turned 18 during the project, is starting as a freshman at OSU this fall. She is extremely perceptive and would (thankfully) often remind others of tasks that they had forgotten to do (like take the batteries out of the theodolite or to mention the Secchi depth on the GoPro videos). I was very impressed by Hayleigh’s determination to continue working on the kayak despite her propensity for sea sickness (though after a few days we did remedy this by giving her raw ginger to chew on – not her favourite flavour or texture but definitely very, very effective!). She is inquisitive about almost everything and I know she will do very well in her first year at OSU.

Thank you, Team Whale Storm (Fig. 6), for giving me six weeks of your summer and for making my first year as project leader as seamless as it could have been! Without each and every one of you, I would not have been able to survey for 149.2 hours on the cliff, collect over 300 zooplankton samples, identify 31 gray whales, or launch a tandem kayak at 6:30 am every morning.

Figure 6. Team Whale Storm. Back row, from left to right: Haley Kent, Robyn Norman, Hayleigh Middleton, Dylan Gregory. Front row, from left to right: Tom Calvanese, Dr. Leigh Torres, Lisa Hildebrand. Photo by Mike Baran.

My interns were not the only ones to experience many “firsts” during this field season. I learned many new things for the first time right alongside them. While taking leadership is not a foreign concept to me, these six weeks were my first real experience of leading a project and a team for a sustained period of time. Managing teams, delegating tasks and compiling data felt gratifying because I felt like I was exactly where I should be (Fig. 7).

Figure 7. From left to right: Tom, myself, Hayleigh & Dylan on the cliff site looking for whales. Photo by Leigh Torres.
Figure 8. Haley & I on a cold evening out on the water but very excited to have gotten back the GoPro stick retrieved by divers after it had been stuck in a crevice for over 5 days. Photo by Lisa Hildebrand.

I dealt with many daunting tasks, yet thanks to the support of my interns, as well as Tom (Port Orford field station’s incredible station manager), Florence and Leigh, I learned how to resolve my problems: I fixed and replaced broken or lost gear (I am not a very mechanically inclined person; Fig. 8), budgeted food for five hungry people doing tiring field work (I’ve only ever budgeted for one person previously), and taught people how to use gear that I had not often used before (I can say now that the theodolite and I are friends, but this wasn’t the case for the first few weeks…).


Figure 9. Me with all the gear packed into the truck ready to leave Port Orford after the end of the field season. Photo by Haley Kent.

In the lead up to the summer field season this year, Leigh said to me, in one of the many emails we exchanged, that leading the project was a big task but that it was just six weeks long. She suggested that I rest up and get organised as much as I could ahead of time because, after all, the data collected this summer was going to be my thesis data, so I would want it to be as good as possible. Looking back, she couldn’t have been more right – the six weeks simply flew by, I did need the rest she had advised, and it definitely was a big task. I can’t wait for it to happen all over again next summer.

Looking through the scope: A world of small marine bugs

By Robyn Norman, GEMM Lab summer 2018 intern, OSU undergraduate

Although the average human may think all zooplankton are the same, to a whale, not all zooplankton are created equal. Just like us, different whales tend to favor different types of food over others. Thus, creating a meal perfect for each individual preference. Using a plankton net off the side of our kayak, each day we take different samples, hoping to figure out more about prey and what species the whales, we see, like best. These samples are then transported back to the lab for analysis and identification. After almost a year of identifying zooplankton and countless hours of looking through the microscope you would think I would have seen everything these tiny organisms have to offer.  Identifying mysid shrimp and other zooplankton to species level can be extremely difficult and time consuming, but equally rewarding. Many zooplankton studies often stop counting at 300 or 400 organisms, however in one very long day in July, I counted over 2,000 individuals. Zooplankton tend to be more difficult to work with due to their small size, fragility, and large quantity.

Figure 1. A sample fresh off the kayak in the beginning stages of identification. Photo by Robyn Norman.

A sample that looks quick and easy can turn into a never-ending search for the smallest of mysids. Most of the mysids that I have sorted can be as small as 5 mm in length. Being difficult to identify is an understatement. Figure 1 shows a sample in the beginning stages of analysis, with a wide range of mysids and other zooplankton. Different species of mysid shrimp generally have the same body shape, structure, size, eyes and everything else you can think of. The only way to easily tell them apart is by their telson, which is a unique structure of their tail. Their telsons cannot be seen with the naked eye and it can also be hard to find with a microscope if you do not know exactly what you are looking for.


Throughout my time identifying these tiny creatures I have found 9 different species of mysid from this gray whale foraging ecology project in Port Orford from the 2017 summer. But in 2018 three mysid species have been particularly abundant, Holmesimysis sculpta, Neomysis rayii, and Neomysis mercedis.

Figure 2. Picture taken with microscope of a Holmesimysis sculpta telson. Photo by Robyn Norman.

H. sculpta has a unique telson with about 18 lateral spines that stop as they reach the end of the telson (Figure 2). The end of the telson has 4 large spines that slightly curve to make a fork or scoop-like shape. From my own observations I have also noticed that H. sculpta has darker coloring throughout their bodies and are often heavily pregnant (or at least during the month of August). Neomysis rayii and Neomysis mercedis have been extremely difficult to identify and work with. While N. rayii can grow up to 65 mm, they can also often be the same small size as N. mercedis. The telsons of these two species are very similar, making them too similar to compare and differentiate. However, N. rayii can grow substantially bigger than N. mercedis, making the bigger shrimp easier to identify. Unfortunately, the small N. rayii still give birth to even smaller mysid babies, which can be confused as large N. mercedis. Identifying them in a timely manner is almost impossible. After a long discussion, we decided it would be easier to group these two species of Neomysis together and then sub-group by size. Our three categories were 1-10 mm, 11-15 mm, 16+ mm. According to the literature, N. mercedis are typically 11-15 mm meaning that anything over this size should be a N. rayii (McLaughlin 1980).

Figure 3. Microscopic photo of a gammarid. Photo source: WikiMedia.
Figure 4. Caprellidae found in sample with unique coloration. Photo by Robyn Norman.

While mysids comprise the majority of our samples, they are not the only zooplankton that I see. Amphipods are often caught along with the shrimp. Gammarids look like the terrestrial potato bug and can grow larger than some species of mysid (Fig. 3).

As well as, Caprellidae (Fig. 4) that remind me of little tiny aliens as they have large claws compared to their body size, making it hard to get them out of our plankton net. These impressive creatures are surprisingly hardy and can withstand long times in the freezer or being poked with tweezers under a microscope without dying.

In 2017, there was a high abundance of amphipods found in both of our study sites, Mill Rocks and Tichenor Cove. Mill Rocks surprisingly had 4 times the number of amphipods than Tichenor Cove. This result could be one of the possible reasons gray whales were observed more in Mill Rocks last year. Mill Rocks also has a substantial amount of kelp, a popular place for mysid swarms and amphipods. The occurrence of mysids at each of these sites was almost equal, whereas amphipods were almost exclusively found at Mill Rocks. Mill Rocks also had a higher average number of organisms than Tichenor Cove per samples, potentially creating better feeding grounds for gray whales here in Port Orford.

Analyzing the 2018 data I can already see some differences between the two years. In 2018 the main species of mysid that we are finding in both sites are Neomysis sp. and Holmesimysis sculpta, whereas in 2017 Alienacanthomysis macropsis, a species of mysid identified by their long eye stalks and blunt telson, made up the majority of samples from Tichenor Cove. There has also been a large decrease in amphipods from both locations compared to last year. Two samples from Mill Rocks in 2017 had over 300 amphipods, however this year less than 100 have been counted in total. All these differences in zooplankton prey availability may influence whale behavior and movement patterns. Further data analysis aims to uncover this possibility.

Figure 5. 2017 zooplankton community analysis from Tichenor Cove. There was a higher percentage and abundance of Neomysis rayii (yellow) and Alienacanthomysis macropsis (orange) than in Mill Rocks.
Figure 6. 2017 zooplankton community analysis from Mill Rocks. There was a higher abundance and percentage of amphipods (blue) and Holmesimysis sculpta (brown) than in Tichenor cove. Caprellidae (red) increased during the middle of the season, and decreased substantially towards the end.

The past 6 weeks working as part of the 2018 gray whale foraging ecology research team in Port Orford have been nothing short of amazing. We have seen over 50 whales, identified hundreds of zooplankton, and have spent almost every morning on the water in the kayak. An experience like this is a once in a lifetime opportunity that we were fortunate to be a part of. For the past few years, I have been creating videos to document important and exciting times in my life. I have put together a short video that highlights the amazing things we did every day in Port Orford, as well as the creatures that live just below the surface. I hope you enjoy our Gray Whale Foraging Ecology 2018 video with music by Myd – The Sun. 

Big Data: Big possibilities with bigger challenges

By Alexa Kownacki, Ph.D. Student, OSU Department of Fisheries and Wildlife, Geospatial Ecology of Marine Megafauna Lab

Did you know that Excel has a maximum number of rows? I do. During Winter Term for my GIS project, I was using Excel to merge oceanographic data, from a publicly-available data source website, and Excel continuously quit. Naturally, I assumed I had caused some sort of computer error. [As an aside, I’ve concluded that most problems related to technology are human error-based.] Therefore, I tried reformatting the data, restarting my computer, the program, etc. Nothing. Then, thanks to the magic of Google, I discovered that Excel allows no more than 1,048,576 rows by 16,384 columns. ONLY 1.05 million rows?! The oceanography data was more than 3 million rows—and that’s with me eliminating data points. This is what happens when we’re dealing with big data.

According to Merriam-Webster dictionary, big data is an accumulation of data that is too large and complex for processing by traditional database management tools (www.merriam-webster.com). However, there are journal articles, like this one from Forbes, that discuss the ongoing debate of how to define “big data”. According to the article, there are 12 major definitions; so, I’ll let you decide what you qualify as “big data”. Either way, I think that when Excel reaches its maximum row capacity, I’m working with big data.

Collecting oceanography data aboard the R/V Shimada. Photo source: Alexa K.

Here’s the thing: the oceanography data that I referred to was just a snippet of my data. Technically, it’s not even MY data; it’s data I accessed from NOAA’s ERDDAP website that had been consistently observed for the time frame of my dolphin data points. You may recall my blog about maps and geospatial analysis that highlights some of the reasons these variables, such as temperature and salinity, are important. However, what I didn’t previously mention was that I spent weeks working on editing this NOAA data. My project on common bottlenose dolphins overlays environmental variables to better understand dolphin population health off of California. These variables should have similar spatiotemporal attributes as the dolphin data I’m working with, which has a time series beginning in the 1980s. Without taking out a calculator, I still know that equates to a lot of data. Great data: data that will let me answer interesting, pertinent questions. But, big data nonetheless.

This is a screenshot of what the oceanography data looked like when I downloaded it to Excel. This format repeats for nearly 3 million rows.

Excel Screen Shot. Image source: Alexa K.

I showed this Excel spreadsheet to my GIS professor, and his response was something akin to “holy smokes”, with a few more expletives and a look of horror. It was not the sheer number of rows that shocked him; it was the data format. Nowadays, nearly everyone works with big data. It’s par for the course. However, the way data are formatted is the major split between what I’ll call “easy” data and “hard” data. The oceanography data could have been “easy” data. It could have had many variables listed in columns. Instead, this data  alternated between rows with variable headings and columns with variable headings, for millions of cells. And, as described earlier, this is only one example of big data and its challenges.

Data does not always come in a form with text and numbers; sometimes it appears as media such as photographs, videos, and audio files. Big data just got a whole lot bigger. While working as a scientist at NOAA’s Southwest Fisheries Science Center, one project brought in over 80 terabytes of raw data per year. The project centered on the eastern north pacific gray whale population, and, more specifically, its migration. Scientists have observed the gray whale migration annually since 1994 from Piedras Blancas Light Station for the Northbound migration, and 2 out of every 5 years from Granite Canyon Field Station (GCFS) for the Southbound migration. One of my roles was to ground-truth software that would help transition from humans as observers to computer as observers. One avenue we assessed was to compare how well a computer “counted” whales compared to people. For this question, three infrared cameras at the GCFS recorded during the same time span that human observers were counting the migratory whales. Next, scientists, such as myself, would transfer those video files, upwards of 80 TB, from the hard drives to Synology boxes and to a different facility–miles away. Synology boxes store arrays of hard drives and that can be accessed remotely. To review, three locations with 80 TB of the same raw data. Once the data is saved in triplet, then I could run a computer program, to detect whale. In summary, three months of recorded infrared video files requires upwards of 240 TB before processing. This is big data.

Scientists on an observation shift at Granite Canyon Field Station in Northern California. Photo source: Alexa K.
Alexa and another NOAA scientist watching for gray whales at Piedras Blancas Light Station. Photo source: Alexa K.

In the GEMM Laboratory, we have so many sources of data that I did not bother trying to count. I’m entering my second year of the Ph.D. program and I already have a hard drive of data that I’ve backed up three different locations. It’s no longer a matter of “if” you work with big data, it’s “how”. How will you format the data? How will you store the data? How will you maintain back-ups of the data? How will you share this data with collaborators/funders/the public?

The wonderful aspect to big data is in the name: big and data. The scientific community can answer more, in-depth, challenging questions because of access to data and more of it. Data is often the limiting factor in what researchers can do because increased sample size allows more questions to be asked and greater confidence in results. That, and funding of course. It’s the reason why when you see GEMM Lab members in the field, we’re not only using drones to capture aerial images of whales, we’re taking fecal, biopsy, and phytoplankton samples. We’re recording the location, temperature, water conditions, wind conditions, cloud cover, date/time, water depth, and so much more. Because all of this data will help us and help other scientists answer critical questions. Thus, to my fellow scientists, I feel your pain and I applaud you, because I too know that the challenges that come with big data are worth it. And, to the non-scientists out there, hopefully this gives you some insight as to why we scientists ask for external hard drives as gifts.

Leila launching the drone to collect aerial images of gray whales to measure body condition. Photo source: Alexa K.
Using the theodolite to collect tracking data on the Pacific Coast Feeding Group in Port Orford, OR. Photo source: Alexa K.

References:

https://support.office.com/en-us/article/excel-specifications-and-limits-1672b34d-7043-467e-8e27-269d656771c3

https://www.merriam-webster.com/dictionary/big%20data