Hearing Gray: Diving into the Sonic World of the Gray Whale

By Natalie Nickells, visiting PhD Student, British Antarctic Survey

For the last three months, I’ve been lucky enough to be welcomed into the GEMM lab as a visiting PhD student to work on the acoustic data from hydrophones in CATS tags deployed on gray whales. This work has been a huge change for me! I’ve gone from studying Antarctic baleen whale foraging, the topic of my PhD, from a distance at my desk in Cambridge England, to studying PCFG gray whales in Newport- and finally being in the same country, state, and even county to the whales I am studying! Unlike my Antarctic research, where whale blows in the distance become tiny points in a sea of data, listening to the CATS tag data has allowed me to really connect with these animals on an emotional level, as I’ve spent days, weeks and months listening to the world as they hear it.

Humans are fundamentally visual creatures- we take in information through sight first, with hearing probably our second, or for some even third, sense in line. However, for marine mammals, the same cannot be said: their world is auditory first. This fact is an important realisation to get our heads around, highlighted beautifully by the phrase “the ears are the window to the soul of the whale” (Sonic Sea (2017)) or Tim Donaghy’s emotive statement that “a deaf whale is a dead whale”. High levels of ocean noise therefore have a huge impact on baleen whales. Imagine trying to do your groceries or find a friend while blindfolded or in a thick fog– you might struggle to access food or communicate with others, and your stress would certainly be high. To succeed, you would likely need to change your behaviour.

Behavioural changes in response to ocean noise are observed in baleen whales: for example, humpback whales change their foraging behaviour when ship noise increases (Blair et al., 2016), and gray whales have been shown to call more frequently and possibly more loudly in conditions of high ocean noise (Dahlheim & Castellote, 2016). However, even in the absence of notable behaviour change due to ocean noise,  North Atlantic  right whales  may still be experiencing a stress response. When shipping traffic in the Bay of Fundy significantly decreased in the aftermath of 9/11, North Atlantic  right whales in the area had decreased chronic stress levels (Rolland et al., 2012).

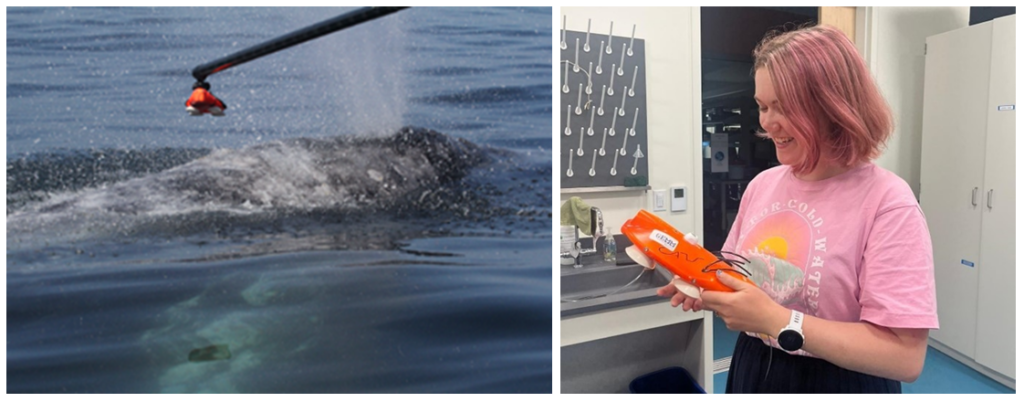
Previous work by the GEMM lab observed this stress response to ocean noise in gray whales. They found a correlation between high levels of glucocorticoid (a stress indicator) in male gray whale faeces with high vessel noise and vessel counts in the area. Vessel noise was measured using two static hydrophones off the Oregon coast, and it was assumed all animals in the area experienced the same noise (Lemos et al., 2022; Pirotta et al., 2023). However, a static hydrophone is an imperfect measure of the sound levels a mobile animal experiences, particularly as we might expect animals to change behaviour when disturbed (Sullivan & Torres, 2018).  This previous work became the starting point for the question I have addressed during my time in the GEMM Lab: can we measure and characterise the sound levels  an individual whale was exposed to? Enter CATS tags. These are suction-cup tags fitted with a host of sensors, which have been used by the GEMM lab since 2021 (see Image 1). So far, they have mostly been used for their accelerometry data (Colson et al. (in press), see also Kate’s blog post). However, the GEMM lab had the foresight to put hydrophones on these tags, and as a result I was welcomed into the lab by a bumper-crop of hydrophone data just waiting to be analysed!

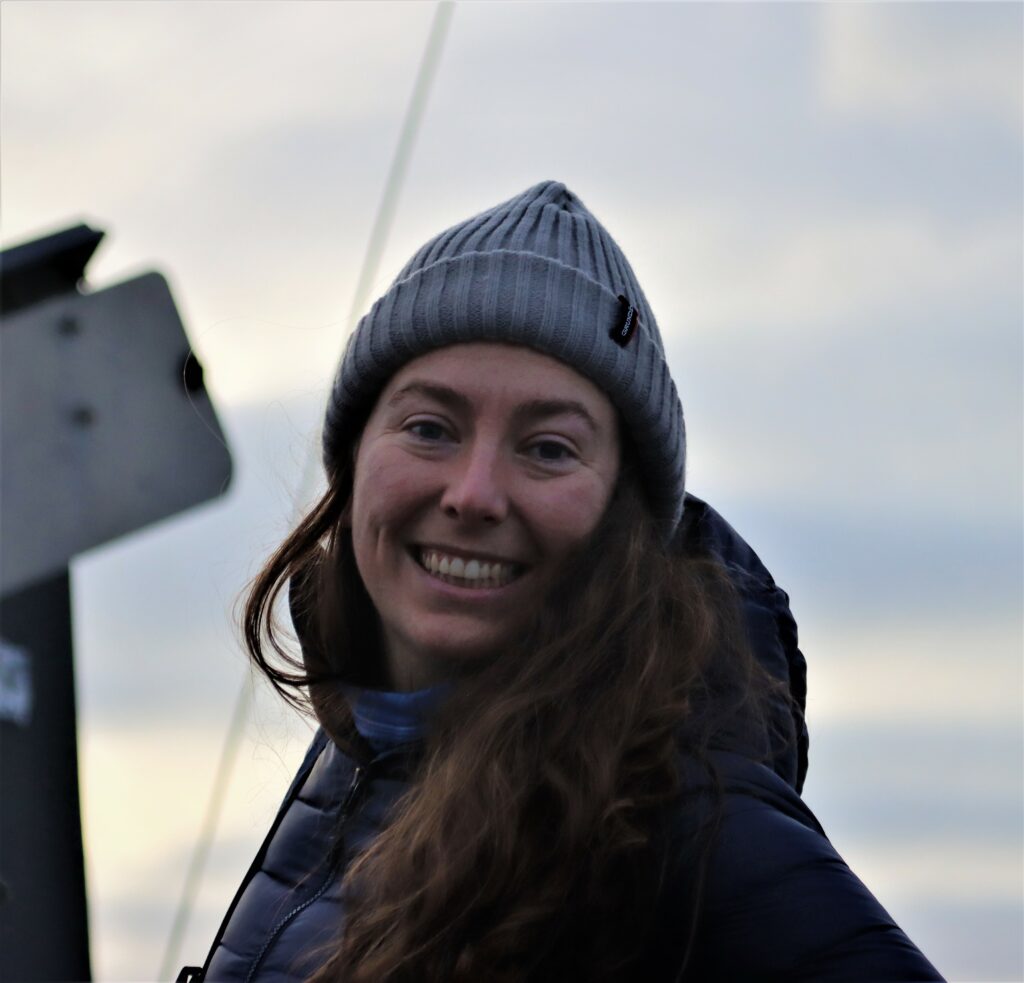
Image 1: A gray whale (“Slush”) being tagged with a CATS tag and Natalie (right) with the same tag.

This tag data is particularly valuable, not only for its ability to follow the acoustic world of an individual whale, but also due to the whole suite of data that comes with the acoustics: essentially, the acoustic data comes with behavioural data. Or at least, it comes with data from which we can infer behaviour (Colson et al, in press)! Incorporating behaviour into passive acoustics work hugely strengthens its ecological usefulness (Oestreich et al., 2024). We can hear what an individual whale is hearing, and we can also infer what they were doing before, during, and after they heard or made that sound. Having behavioural data also means that we can ground-truth the sounds we hear. When hearing an interesting sound, I can go back to the video data and accelerometer data to check what the whale sees, what its body-position is doing (e.g., is it headstand foraging?) and the speed and direction of its travel. Context is key!

The importance of context was highlighted in my very first week here in the GEMM lab. I became very interested in a sound I could hear frequently when the whale would surface- a distorted bark-like noise, but the whale was surely too far offshore for any barking dog to be heard? And almost every time the whale surfaced? After a few days pondering, I shared my mystery with Leigh, who laughingly revealed that one of the whale-watching boats in this area has a ‘whale-alerting’ dog on board! Sometimes if it sounds like a dog… it’s a dog! Besides my slightly anticlimactic discovery of dogs barking, committing time to listening to the tags and hearing what the whales hear, has been a magical experience. My favourite hydrophone sound, that still gets me excited when I hear it, is the gray whale ‘bongo call’- or as it’s more formally known in the literature, M1 vocalisation (Guazzo et al., 2019). I’ll let you decide which name is more appropriate! I first heard this call when investigating a time on “Scarlett’s” tag when we knew her 14 year-old daughter “Pacman” had been close: about 15 minutes before “Pacman” appears on the video, Scarlett makes this call (you can play the clip below to listen).  In “Lunita’s” tag, we even hear this call three times in a row!

Image 2: A ‘bongo call’ made by “Scarlett” when her daughter “Pacman” was nearby.

Relatively little research has been done on gray whale calls compared to other more studied species like humpbacks. Most of this research has taken place on gray whale migratory routes (Guazzo et al., 2019, 2017; Burnham et al. 2018)  or in captivity (Fish et. al, 1974 ) so these tag recordings could be a valuable addition to a small sample from the foraging grounds (Clayton et al., 2023; Haver et al., 2023)- as well as being very personally exciting to hear!

We’ve also been able to use the tag hydrophone data to look at close calls with ships. As I was going through the data on “Scarlett’s” tag, I noticed a spike in vessel noise. Looking at the video from the same timestamp, I could see a small vessel passing directly over her as she surfaced. At the time this vessel passed over her, the tag was only 0.8 m under the surface of the water!

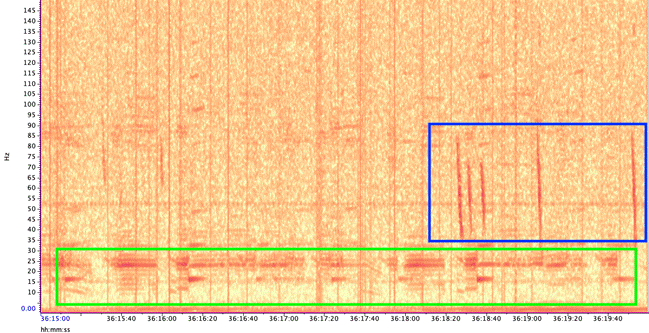
Image 3: A close encounter between a small vessel and “Scarlett”, shown both on the video from the CATS tag (top) and the spectrogram (bottom). The close call is outlined in a yellow box, when a greater intensity of noise occurred as illustrated by the brighter colour intensity compared to the white box (quieter vessel noise). Brighter colours denote a louder volume. The red boxes show surfacing noise- this can essentially be ignored when interpreting the echogram for our purposes.

Sometimes vessels may be more distant, but possibly equally harmful: we have seen vessel noise from larger and presumably more distant vessels dominate the soundscape in some of the tag data. Remembering that to a whale, the sonic world is as important as the visual world is to us, this elevated background noise from ships could have major consequences. So, the first step is to try to quantify the gray whales’ exposure to this vessel noise. I’ve been running some systematic sampling on the tag data to try to quantify background noise levels, and how this changes depending on the time of day: do individual whales experience the same daily spikes in ocean noise that were detected on the static hydrophones, at around 6am and noon due to vessel traffic (Haver et al., 2023)? If not, are they taking evasive action to avoid these spikes? These are just some of the questions that these CATS tags can help us answer, although ideally we need longer acoustic data recordings to capture day and night data, as well as potentially improving the hydrophones on the CATS tags themselves to minimise the impacts of tag interference and random noise.

When explaining to the public what it is to be a PhD student, I often refer to myself as a ‘scientist in training’, or to young children, a ‘baby scientist’. As I look toward my departure from the GEMM lab, I hope to have developed into at least a scientific toddler, having gained the ability to walk through reams of acoustic data with (relative) independence. More than that, I’m excited to take home a refreshed sense of curiosity about what drives marine mammals to behave as they do, an openness to collaboration and new approaches, and a large dose of ‘American emotion’! Let’s hope my British colleagues can handle it!

My heartfelt thanks to all those who welcomed me so warmly at the GEMM lab and Oregon State University, particularly my mentors Leigh Torres and Samara Haver.

Did you enjoy this blog? Want to learn more about marine life, research, and conservation? Subscribe to our blog and get a weekly alert when we make a new post! Just add your name into the subscribe box below!

Loading

Bibliography

Sonic Sea (2017) Directed by Michelle Dougherty [Film] Distributed by the Natural Resources Defense Council.

Blair, H.B., Merchant, N.D., Friedlaender, A.S., Wiley, D.N. & Parks, S.E. (2016) Evidence for ship noise impacts on humpback whale foraging behaviour. Biology Letters. 12 (8), 20160005. doi:10.1098/rsbl.2016.0005.

Burnham, R., Duffus, D. & Mouy, X. (2018) Gray Whale (Eschrictius robustus) Call Types Recorded During Migration off the West Coast of Vancouver Island. Frontiers in Marine Science. 5, 329. doi:10.3389/fmars.2018.00329.

Colson, K., E. Pirotta L. New, D Cade, J Calambokidis, K. Bierlich, C Bird, A Fernandez Ajó, L. Hildebrand, A. Trites, L. Torres. (in press). Using accelerometry tags to quantify gray whale foraging behavior. Marine Mammal Science.

Clayton, H., Cade, D.E., Burnham, R., Calambokidis, J. & Goldbogen, J. (2023) Acoustic behavior of gray whales tagged with biologging devices on foraging grounds. Frontiers in Marine Science. 10, 1111666. doi:10.3389/fmars.2023.1111666.

Dahlheim, M. & Castellote, M. (2016) Changes in the acoustic behavior of gray whales Eschrichtius robustus in response to noise. Endangered Species Research. 31, 227–242. doi:10.3354/esr00759.

Fish, J.F., Sumich, J.L. & Lingle, G.L. (n.d.) Sounds Produced by the Gray Whale, Eschrichtius robustus.

Guazzo, R., Schulman-Janiger, A., Smith, M., Barlow, J., D’Spain, G., Rimington, D. & Hildebrand, J. (2019) Gray whale migration patterns through the Southern California Bight from multi-year visual and acoustic monitoring. Marine Ecology Progress Series. 625, 181–203. doi:10.3354/meps12989.

Guazzo, R.A., Helble, T.A., D’Spain, G.L., Weller, D.W., Wiggins, S.M. & Hildebrand, J.A. (2017) Migratory behavior of eastern North Pacific gray whales tracked using a hydrophone array S. Li (ed.). PLOS ONE. 12 (10), e0185585. doi:10.1371/journal.pone.0185585.

Haver, S.M., Haxel, J., Dziak, R.P., Roche, L., Matsumoto, H., Hvidsten, C. & Torres, L.G. (2023) The variable influence of anthropogenic noise on summer season coastal underwater soundscapes near a port and marine reserve. Marine Pollution Bulletin. 194, 115406. doi:10.1016/j.marpolbul.2023.115406.

Lemos, L.S., Haxel, J.H., Olsen, A., Burnett, J.D., Smith, A., Chandler, T.E., Nieukirk, S.L., Larson, S.E., Hunt, K.E. & Torres, L.G. (2022) Effects of vessel traffic and ocean noise on gray whale stress hormones. Scientific Reports. 12 (1), 18580. doi:10.1038/s41598-022-14510-5.

Oestreich, W.K., Oliver, R.Y., Chapman, M.S., Go, M.C. & McKenna, M.F. (2024) Listening to animal behavior to understand changing ecosystems. Trends in Ecology & Evolution. S0169534724001459. doi:10.1016/j.tree.2024.06.007.

Pirotta, E., Fernandez Ajó, A., Bierlich, K.C., Bird, C.N., Buck, C.L., Haver, S.M., Haxel, J.H., Hildebrand, L., Hunt, K.E., Lemos, L.S., New, L. & Torres, L.G. (2023) Assessing variation in faecal glucocorticoid concentrations in gray whales exposed to anthropogenic stressors S. Cooke (ed.). Conservation Physiology. 11 (1), coad082. doi:10.1093/conphys/coad082.

Rolland, R.M., Parks, S.E., Hunt, K.E., Castellote, M., Corkeron, P.J., Nowacek, D.P., Wasser, S.K. & Kraus, S.D. (2012) Evidence that ship noise increases stress in right whales. Proceedings of the Royal Society B: Biological Sciences. 279 (1737), 2363–2368. doi:10.1098/rspb.2011.2429.

Sullivan, F.A. & Torres, L.G. (2018) Assessment of vessel disturbance to gray whales to inform sustainable ecotourism. The Journal of Wildlife Management. 82 (5), 896–905. doi:10.1002/jwmg.21462.

New publication reveals gray whale habitat use patterns over three decades in the Northern California Current

By Dr. Dawn Barlow, Postdoctoral Scholar, OSU Department of Fisheries, Wildlife, and Conservation Sciences, Geospatial Ecology of Marine Megafauna Lab

The EMERALD project (Examining Marine mammal Ecology through Regional Assessment of Long-term Data) has reached a milestone with a recent publication detailing our findings on long-term gray whale distribution, abundance, and habitat use patterns (Barlow et al. 2024). The study is made possible by an incredible dataset. Every May-July since 1992, a team of observers surveyed the coastline between the Columbia River at the border between Oregon and Washington and San Francisco Bay, California for marbled murrelets, a seabird species of conservation concern. They drive a small vessel along pre-determined tracklines, and record observations of seabirds and marine mammals—not just marbled murrelets—and fortunately for us, that means there is a record of annual gray whale distribution and abundance patterns that spans over three decades.

The Crescent Coastal Research team collecting survey data. We are incredibly grateful to Craig Strong and the many folks who collected these valuable observations over the years!

We analyzed these valuable data using density surface modeling to better understand what drives gray whale distribution and abundance, what their habitat preferences are, and whether and how these occurrence patterns have changed over time. I am excited to share a few of our findings here!

Long-term, stable hotspots

The survey data revealed three main areas with consistently high gray whale density: the central Oregon Coast off Newport, Cape Blanco off Oregon’s south coast, and the mouth of the Klamath River in northern California. Despite fluctuations in how many whales were observed over the years, these areas have remained predicable hotspots for gray whales during their summer feeding season.

(A) Mean gray whale encounter rate (whales/kilometers surveyed) summarized by year, across all latitudes. (B) Mean gray whale encounter rate summarized by 1° latitude bin, across all years. White indicates times and locations with no survey effort. (C) Mean gray whale encounter rate summarized by year and 1° latitude bin. (D) Map of the study area, with region boundaries shown by the dashed lines, and major placenames denoted. Figure and caption reproduced from Barlow et al. 2024.

Key regional differences

Major features like prominent capes divide the California Current into different regions with distinct oceanographic characteristics. We found that gray whales showed different habitat preferences in the different regions. In the northern part of our study area between the Columbia River and Cape Blanco, we found that rocky bottom substrate was strongly related to areas of higher gray whale abundance, despite being far less available than soft, sandy bottom habitat. In the region between Cape Blanco and Cape Mendocino, gray whales were more abundant in areas south of prominent capes and in closer proximity to river estuaries.

Coastal upwelling and relaxation are key

Coastal upwelling—the process by which winds in the spring and summer push surface water offshore that is then replaced by cold, nutrient-rich water that is brought into the sunlight and drives an abundance of marine life—is a critically important influence in the oceanography, ecology, and biodiversity of our study region. But relaxation of those upwelling winds is also important for coastal species, as relaxation events allow the upwelled nutrients to be retained in the nearshore waters and enhance and aggregate local productivity and prey. We found that gray whale abundance was highest when there was a combination of both upwelling and relaxation events—a critical balance of “enough but not too much”—that seems to be optimal for gray whale feeding opportunities in nearshore waters.

You are what, where, and how you eat

Gray whales are incredibly flexible predators and have a wide range of prey items they are known to feed on. We found that throughout our study range, gray whales have different habitat preferences. As they spend their summers here to feed, these habitat preferences are linked to their foraging preferences. Off the central Oregon Coast, gray whales are known to feed on zooplankton that aggregate around rocky reefs and kelp forests (Hildebrand et al. 2022, 2024).

A gray whale surfaces in a patch of kelp, foraging around a rocky reef. UAS image credit: GEMM Lab.

Further south, in the region between Cape Blanco and Cape Mendocino that encompassed the long-term hotspot of gray whale sightings off the Klamath River, our models revealed different habitat preferences. In the soft-bottom habitat off the Klamath River, gray whales are known to do more benthic feeding, whereby they scoop up the seafloor and filter out the invertebrates in the sediment such as amphipods and cumaceans (Mallonée 1991, Jenkinson 2001).

A gray whale surfaces with a mouth full of muddy sediment, filtering out the invertebrate prey. UAS image credit: GEMM Lab.

These differences in regional habitat preferences and preferred prey likely relate to larger-scale phenomena as well. Indeed, when we looked at how gray whale abundance in different regions related to widespread warm or cool phases in the North Pacific Ocean, the responses differed by region. This aspect of the study indicates that what gray whales eat and where they forage influences how they respond to shifting environmental conditions and prey availability.

Conservation of an iconic nearshore predator

The unique mosaic of habitat characteristics throughout the Northern California Current summer feeding range of gray whales provides them the opportunity to gain the energetic stores they need to survive, reproduce, and migrate. Thus, the reliability of these resources has led them to return to these stable foraging hotspots year after year. Under climate change, one potential impact on upwelling systems is shifts in the intensity and location of upwelling (Bograd et al. 2023); in the Northern California Current, this could mean reduced relaxation events that we found are crucial for gray whales feeding in this habitat. Furthermore, these whales overlap with human activities such as vessel disturbance, entanglement and vessel strike risk, and ocean noise throughout the foraging season, and have to bear the consequences of these anthropogenic stressors (Sullivan & Torres 2018, Lemos et al. 2022, Pirotta et al. 2023) as they also navigate changing environmental conditions. Our study highlights the value of long-term monitoring to better understand present ecological patterns in the context of the past, which can be used to inform conservation management decisions for the future.

For more details, we invite you to read the full, open access publication here: https://www.nature.com/articles/s41598-024-59552-z

Did you enjoy this blog? Want to learn more about marine life, research, and conservation? Subscribe to our blog and get a weekly alert when we make a new post! Just add your name into the subscribe box below!

Loading

References

Barlow DR, Strong CS, Torres LG (2024) Three decades of nearshore surveys reveal long-term patterns in gray whale habitat use, distribution, and abundance in the Northern California Current. Sci Rep 14:9352.

Bograd SJ, Jacox MG, Hazen EL, Lovecchio E, Montes I, Pozo Buil M, Shannon LJ, Sydeman WJ, Rykaczewski RR (2023) Climate Change Impacts on Eastern Boundary Upwelling Systems. Ann Rev Mar Sci 15:1–26.

Hildebrand L, Derville S, Hildebrand I, Torres LG (2024) Exploring indirect effects of a classic trophic cascade between urchins and kelp on zooplankton and whales. Sci Rep 14.

Hildebrand L, Sullivan FA, Orben RA, Derville S, Torres LG (2022) Trade-offs in prey quantity and quality in gray whale foraging. Mar Ecol Prog Ser 695:189–201.

Jenkinson RS (2001) Gray whale (Eschrichtius robustus) prey availability and feeding ecology in Northern California, 1999-2000. Humboldt State University

Lemos L, Haxel J, Olsen A, Burnett JD, Smith A, Chandler TE, Nieukirk SL, Larson SE, Hunt KE, Torres LG (2022) Effects of vessel traffic and ocean noise on gray whale stress hormones. Sci Rep 12:1–13.

Mallonée JS (1991) Behaviour of gray whales (Eschrichtius robustus) summering off the northern California coast, from Patrick’s Point to Crescent City. Can J Zool 69:681–690.

Pirotta E, Fernandez Ajó A, Bierlich KC, Bird CN, Buck CL, Haver SM, Haxel JH, Hildebrand L, Hunt KE, Lemos LS, New L, Torres LG (2023) Assessing variation in faecal glucocorticoid concentrations in gray whales exposed to anthropogenic stressors. Conserv Physiol 11:coad082.

Sullivan FA, Torres LG (2018) Assessment of vessel disturbance to gray whales to inform sustainable ecotourism. J Wildl Manage 82:896–905.

A MOSAIC of species, datasets, tools, and collaborators

By Dr. Dawn Barlow, Postdoctoral Scholar, OSU Department of Fisheries, Wildlife, and Conservation Sciences, Geospatial Ecology of Marine Megafauna Lab

Imagine you are 50 nautical miles from shore, perched on the observation platform of a research vessel. The ocean is blue, calm, and seems—for all intents and purposes—empty. No birds fly overhead, nothing disturbs the rolling swells except the occasional whitecap from a light breeze. The view through your binoculars is excellent, and in the distance, you spot a disturbance at the surface of the water. As the ship gets closer, you see splashing, and a flurry of activity emerges as a large group of dolphins leap and dive, likely chasing a school of fish. They swim along with the ship, riding the bow-wave in a brief break from their activity. Birds circle in the air above them and float on the water around them. Together with your team of observers, you rush to record the species, the number of animals, their distance to the ship, and their behavior. The research vessel carries along its pre-determined trackline, and the feeding frenzy of birds and dolphins fades off behind you as quickly as it came. You return to scanning the blue water.

Craig Hayslip and Dawn Barlow scan for marine mammals from the crow’s nest (elevated observation platform) of the R/V Pacific Storm.

The marine environment is highly dynamic, and resources in the ocean are notoriously patchy. One of our main objectives in marine ecology is to understand what drives these ephemeral hotspots of species diversity and biological activity. This objective is particularly important now as the oceans warm and shift. In the context of rapid global climate change, there is a push to establish alternatives to fossil fuels that can support society’s energy needs while minimizing the carbon emissions that are a root cause of climate change. One emergent option is offshore wind, which has become a hot topic on the West Coast of the United States in recent years. The technology has the potential to supply a clean energy source, but the infrastructure could have environmental and societal impacts of its own, depending on where it is placed, how it is implemented, and when it is operational.

Northern right whale dolphins leap into the air. Photo by Craig Hayslip.

Any development in the marine environment, including alternative energy such as offshore wind, should be undertaken using the best available scientific knowledge of the ecosystem where it will be implemented. The Marine Mammal Institute’s collaborative project, Marine Offshore Species Assessments to Inform Clean energy (MOSAIC), was designed for just this reason. As the name “MOSAIC” implies, it is all about using different tools to compile different datasets to establish crucial baseline information on where marine mammals and seabirds are distributed in Oregon and Northern California, a region of interest for wind energy development.

A MOSAIC of species

The waters of Oregon and Northern California are rich with life. Numerous cetaceans are found here, from the largest species to ever live, the blue whale, to one of the smallest cetaceans, the harbor porpoise, with many species filling in the size range in between: fin whales, humpback whales, sperm whales, killer whales, Risso’s dolphins, Pacific white-sided dolphins, northern right whale dolphins, and Dall’s porpoises, to name a few. Seabirds likewise rely on these productive waters, from the large, graceful albatrosses that feature in maritime legends, to charismatic tufted puffins, to the little Leach’s storm petrels that could fit in the palm of your hand yet cover vast distances at sea. From our data collection efforts so far, we have already documented 16 cetacean species and 64 seabird species.

A Laysan albatross glides over the water’s surface. Photo by Will Kennerley.

A MOSAIC of data and tools

Schematic of the different components of the MOSAIC project. Graphic created by Solene Derville.

Through the four-year MOSAIC project, we are undertaking two years of visual surveys and passive acoustic monitoring from Cape Mendocino to the mouth of the Columbia River on the border of Oregon and Washington and seaward to the continental slope. Six comprehensive surveys for cetaceans and seabirds are being conducted aboard the R/V Pacific Storm following a carefully chosen trackline to cover a variety of habitats, including areas of interest to wind energy developers.

These dedicated surveys are complemented by additional surveys conducted aboard NOAA research vessels during collaborative expeditions in the Northern California Current, and ongoing aerial surveys in partnership with the United States Coast Guard through the GEMM Lab’s OPAL project. Three bottom-mounted hydrophones were deployed in August 2022, and are recording cetacean vocalizations and the ambient soundscape, and these recordings will be complemented by acoustic data that is being collected continuously by the Oceans Observing Initiative. In addition to these methods to collect broad-scale species distribution information, concurrent efforts are being conducted via small boats to collect individual identification photographs of baleen whales and tissue biopsy samples for genetic analysis. Building on the legacy of satellite tracking here at the Marine Mammal Institute, the MOSAIC project is breathing new life into tag data from large whales to assess movement patterns over many years and determine the amount of time spent within our study area.

A curious fin whale approaches the R/V Pacific Storm during one of the visual surveys. Photo by Craig Hayslip.
Survey tracklines extending between the Columbia River and Cape Mendocino, designed for the MOSAIC visual surveys aboard the R/V Pacific Storm.

The resulting species occurrence data from visual surveys and acoustic monitoring will be integrated to develop Species Distribution Models for the many different species in our study region. Identification photographs of individual baleen whales, DNA profiles from whale biopsy samples, and data from satellite-tagged whales will provide detailed insight into whale population structure, behavior, and site fidelity (i.e., how long they typically stay in a given area), which will add important context to the distribution data we collect through the visual surveys and acoustic monitoring. The models will be implemented to produce maps of predicted species occurrence patterns, describing when and where we expect different cetaceans and seabirds to be under different environmental conditions.

With five visual surveys down, the MOSAIC team is gearing up for one final survey this month. The hydrophones will be retrieved this summer. Then, with data in-hand, the team will dive deep into analysis.

A MOSAIC of collaborators

The MOSAIC-4 team waves from the crow’s nest (observation platform) of the R/V Pacific Storm. Photo by Craig Hayslip.

The collaborative MOSAIC team brings together a diverse set of tools. The depth of expertise here at the Marine Mammal Institute spans a broad range of disciplines, well-positioned to provide robust scientific knowledge needed to inform alternative energy development in Oregon and Northern California waters.  

I have had the pleasure of participating in three of the six surveys aboard the R/V Pacific Storm, including leading one as Chief Scientist, and have collected visual survey data aboard NOAA Ship Bell M. Shimada and from United States Coast Guard helicopters over the years that will be incorporated in the MOSAIC of datasets for the project. This ecosystem is one that I feel deeply connected to from time spent in the field. Now, I am thrilled to dive into the analysis, and will lead the modeling of the visual survey data and the integration of the different components to produce species distribution maps for cetaceans and seabirds our study region.

This project is funded by the United States Department of Energy. The Principal Investigator is the Institute’s Director Dr. Lisa Ballance, and Co-Principal Investigators include Scott Baker, Barbara Lagerquist, Rachael Orben, Daniel Palacios, Kate Stafford, and Leigh Torres of the Marine Mammal Institute; John Calambokidis of the Cascadia Research Collective; and Elizabeth Becker of ManTech International Corp. For more information, please visit the project website, and stay tuned for updates as we enter the analysis phase.

Did you enjoy this blog? Want to learn more about marine life, research, and conservation? Subscribe to our blog and get a weekly alert when we make a new post! Just add your name into the subscribe box below!

Loading

Learning from the unexpected: the first field season of the SAPPHIRE project

By Dr. Dawn Barlow, Postdoctoral Scholar, OSU Department of Fisheries, Wildlife, and Conservation Sciences, Geospatial Ecology of Marine Megafauna Lab

The SAPPHIRE project’s inaugural 2024 field season has officially wrapped up, and the team is back on shore after an unexpected but ultimately fruitful research cruise. The project aims to understand the impacts of climate change on blue whales and krill, by investigating their health under variable environmental conditions. In order to assess their health, however, a crucial first step is required: finding krill, and finding whales. The South Taranaki Bight (STB) is a known foraging ground where blue whales typically feed on krill found in the cool and productive upwelled waters. This year, however, both krill and blue whales were notoriously absent from the STB, leaving us puzzled as we compulsively searched the region in between periods of unworkable weather (including an aerial survey one afternoon).

A map of our survey effort during the 2024 field season. Gray lines represent our visual survey tracklines, with the aerial survey shown in the dashed line. Red points show blue whale sighting locations. Purple stars are the deployment locations of two hydrophones, which will record over the next year.

The tables felt like they were turning when we finally found a blue whale off the west coast of the South Island, and were able to successfully fly the drone to collect body condition information, and collect a fecal sample for genetic and hormone analysis. Then, we returned to the same pattern. Days of waiting for a weather window in between fierce winds, alternating with days of searching and searching, with no blue whales or krill to be found. Photogrammetry measurements of our drone data over the one blue whale we found determined it to be quite small (only ~17 m) and in poor body condition. The only krill we were able to find and collect were small and sparsely mixed in to a massive gelatinous swarm of salps. Where were the whales? Where was their prey?

Above: KC Bierlich and Dawn Barlow search for blue whales. Below: salps swarm beneath the surface.

Then, a turn of events. A news story with the headline “Acres of krill washing up on the coastline” made its way to our inboxes and news feeds. The location? Kaikoura. On the other side of the Cook Strait, along the east coast of the South Island. With good survey coverage in the STB resulting in essentially no appearances of our study species, this report of krill presence along with a workable weather forecast in the Kaikoura area had our attention. In a flurry of quick decision-making (Leigh to Captain: “Can we physically get there?” Captain to Leigh: “Yes, we can.” Leigh to Captain: “Let’s go.”), we turned the vessel around and surfed the swells to the southeast at high speed.

The team in action aboard the R/V Star Keys, our home for the duration of the three-week survey.

Twelve hours later we arrived at dusk and anchored off the small town of Kaikoura, with plans to conduct a net tow for krill before dawn the next morning. But the krill came to us! In the wee hours of the morning, the research vessel was surrounded by swarming krill. The dense aggregation made the water appear soup-like, and attracted a school of hungry barracuda. These abundant krill were just what was needed to run respiration experiments on the deck, and to collect samples to analyze their calories, proteins, and lipids back in the lab.

Left: An illuminated swarm of krill just below the surface. Right: A blue whale comes up for air with an extended buccal pouch, indicating a recent mouthful of krill. Drone piloted by KC Bierlich.

With krill in the area, we were anxious to find their blue whale predators, too. Once we began our visual survey effort, we were alerted by local whale watchers of a blue whale sighting. We headed straight to this location and got to work. The day that followed featured another round of krill experiments, and a few more blue whale sightings. Predator and prey were both present, a stark contrast to our experience in the previous weeks within the STB and along the west coast of the South Island. The science team and crew of the R/V Star Keys fell right into gear, carefully maneuvering around these ocean giants to collect identification photos, drone flights, and fecal samples, finding our rhythm in what we came here to do. We are deeply grateful to the regional managers, local Iwi representatives, researchers, and tourism operators that supported making our time in Kaikoura so fruitful, on just a moment’s notice.

The SAPPHIRE 2024 field team on a day of successful blue whale sightings. Clockwise, starting top left: Dawn Barlow and Leigh Torres following a sunset blue whale sighting, Mike Ogle in position for biopsy sample collection, Kim Bernard collecting blue whale dive times, KC Bierlich collecting identification photos.

What does it all mean? It’s hard to say right now, but time and data analysis will hopefully tell. While this field season was certainly unexpected, it was valuable in many ways. Our experiences this year emphasize the pay-off of being adaptable in the field to maximize time, money, and data collection efforts (during our three-week cruise we slept in 10 different ports or anchorages, did an aerial survey, and rapidly changed our planned study area). Oftentimes, the cases that initially “don’t make sense” are the ones that end up providing key insights into larger patterns. No doubt this was a challenging and at times frustrating field season, but it could also be the year that provides the greatest insights. After two more years of data collection, it will be fascinating to compare this year’s blue whale and krill data in the greater context of environmental variability.

A blue whale comes up for air. Photo by Dawn Barlow.

One thing is clear, the oceans are without question already experiencing the impacts of global climate change. This year solidified the importance of our research, emphasizing the need to understand how krill—a crucial marine prey item—and their predators are being affected by warming and shifting oceans.  

A blue whale at sunset, off Kaikoura. Photo by Leigh Torres.

Did you enjoy this blog? Want to learn more about marine life, research, and conservation? Subscribe to our blog and get a weekly alert when we make a new post! Just add your name into the subscribe box below!

Loading

Blue whales, krill, and climate change: introducing the SAPPHIRE project

By Dr. Dawn Barlow, Postdoctoral Scholar, OSU Department of Fisheries, Wildlife, and Conservation Sciences, Geospatial Ecology of Marine Megafauna Lab

The world is warming. Ocean ecosystems are experiencing significant and rapid impacts of climate change. However, the cascading effects on marine life are largely unknown. Thus, it is critical to understand how – not just if – environmental change impacts the availability and quality of key prey species in ocean food webs, and how these changes will impact marine predator health and population resilience. With these pressing knowledge gaps in mind, we are thrilled to launch a new project “Marine predator and prey response to climate change: Synthesis of Acoustics, Physiology, Prey, and Habitat in a Rapidly changing Environment (SAPPHIRE).”  We will examine how changing ocean conditions affect the availability and quality of krill, and thus impact blue whale behavior, health, and reproduction. This large-scale research effort is made possible with funding from the National Science Foundation.

The SAPPHIRE project takes place in the South Taranaki Bight (STB) region of Aotearoa New Zealand, and before diving into our new research plans, let’s reflect briefly on what we know so far about this study system based on our previous research. Our collaborative research team has studied blue whales in the STB since 2013 to document the population, understand their ecology and habitat use, and inform conservation management. We conducted boat-based surveys and used hydrophones to record the underwater soundscape, and found the following:

  • Blue whales in Aotearoa New Zealand are a unique population, genetically distinct from all other known populations in the Southern Hemisphere, with an estimated population size of 718 (95% CI = 279 – 1926).1
  • Blue whales reside in the STB region year-round, with feeding and breeding vocalizations detected nearly every day of the year.2,3
  • Wind-driven upwelling over Kahurangi shoals moves a plume of cold, nutrient-rich waters into the STB, supporting aggregations of krill, and thereby critical feeding opportunities for blue whales in spring and summer.4–6
  • We developed predictive models to forecast blue whale distribution up to three weeks in advance, providing managers with a real-time tool in the form of a desktop application to produce daily forecast maps for dynamic management.7
  • During marine heatwaves, blue whale feeding activity was substantially reduced in the STB. Interestingly, their breeding activity was also reduced in the following season when compared to the breeding season following a more productive, typical foraging season. This finding indicates that shifting environmental conditions, such as marine heatwaves and climate change, may have consequences to not just foraging success, but the population’s reproductive patterns.3
A blue whale comes up for air in the South Taranaki Bight. Photo by Leigh Torres.

Project goals

Building on this existing knowledge, we aim to gain understanding of the health impacts of environmental change on krill and blue whales, which can in turn inform management decisions. Over the next three years (2024-2026) we will use multidisciplinary methods to collect data in the field that will enable us to tackle these important but challenging goals. Our broad objectives are to:

  1. Assess variation in krill quality and availability relative to rising temperatures and different ocean conditions,
  2. Document how blue whale body condition and hormone profiles change relative to variable environmental and prey conditions,
  3. Understand how environmental conditions impact blue whale foraging and reproductive behavior, and
  4. Integrate these components to develop novel Species Health Models to predict predator and prey whale population response to rapid environmental change.

Kicking off fieldwork

This coming January, we will set sail aboard the R/V Star Keys and head out in search of blue whales and krill in the STB! Five of our team members will spend three weeks at sea, during which time we will conduct surveys for blue whale occurrence paired with active acoustic assessment of krill availability, fly Unoccupied Aircraft Systems (UAS; “drones”) over whales to determine body condition and potential pregnancy, collect tissue biopsy samples to quantify stress and reproductive hormone levels, deploy hydrophones to record rates of foraging and reproductive calls by blue whales, and conduct on-board controlled experiments on krill to assess their response to elevated temperature.

The team in action aboard the R/V Star Keys in February 2017. Photo by L. Torres.

The moving pieces are many as we work to obtain research permits, engage in important consultation with iwi (indigenous Māori groups), procure specialized scientific equipment, and make travel and shipping arrangements. The to-do lists seem to grow just as fast as we can check items off; such is the nature of coordinating an international, multidisciplinary field effort. But it will pay off when we are underway, and I can barely contain my excitement to back on the water with this research team.

Our team has not collected data in the STB since 2017. We know so much more now than we did when studies of this blue whale population were just beginning. For example, we are eager to put our blue whale forecast tool to use, which will hopefully enable us to direct survey effort toward areas of higher blue whale density to maximize data collection. We are keen to see what new insights we gain, and what new questions and challenges arise.

Research team

The SAPPHIRE project will only be possible with the expertise and coordination of the many members of our collaborative group. We are all thrilled to begin this research journey together, and eager to share what we learn.

Principal Investigators:

Research partners and key collaborators:

Did you enjoy this blog? Want to learn more about marine life, research, and conservation? Subscribe to our blog and get a weekly alert when we make a new post! Just add your name into the subscribe box below!

Loading

References:

1.          Barlow DR, Torres LG, Hodge KB, Steel D, Baker CS, Chandler TE, Bott N, Constantine R, Double MC, Gill P, Glasgow D, Hamner RM, Lilley C, Ogle M, Olson PA, Peters C, Stockin KA, Tessaglia-Hymes CT, Klinck H. Documentation of a New Zealand blue whale population based on multiple lines of evidence. Endanger Species Res. 2018;36:27–40.

2.          Barlow DR, Klinck H, Ponirakis D, Holt Colberg M, Torres LG. Temporal occurrence of three blue whale populations in New Zealand waters from passive acoustic monitoring. J Mammal. 2022;

3.          Barlow DR, Klinck H, Ponirakis D, Branch TA, Torres LG. Environmental conditions and marine heatwaves influence blue whale foraging and reproductive effort. Ecol Evol. 2023;13:e9770.

4.          Barlow DR, Klinck H, Ponirakis D, Garvey C, Torres LG. Temporal and spatial lags between wind, coastal upwelling, and blue whale occurrence. Sci Rep. 2021;11(6915):1–10.

5.          Barlow DR, Bernard KS, Escobar-Flores P, Palacios DM, Torres LG. Links in the trophic chain: Modeling functional relationships between in situ oceanography, krill, and blue whale distribution under different oceanographic regimes. Mar Ecol Prog Ser. 2020;642:207–25.

6.          Torres LG, Barlow DR, Chandler TE, Burnett JD. Insight into the kinematics of blue whale surface foraging through drone observations and prey data. PeerJ. 2020;8:e8906.

7.          Barlow DR, Torres LG. Planning ahead: Dynamic models forecast blue whale distribution with applications for spatial management. J Appl Ecol. 2021;58(11):2493–504.

A Journey From Microbiology to Macrobiology

Mariam Alsaid, University of California Berkeley, GEMM Lab REU Intern

My name is Mariam Alsaid and I am currently a 5th year undergraduate transfer student at the University of California, Berkeley. Growing up on the small island of Bahrain, I was always minutes away from the water and was enraptured by the creatures that lie beneath the surface. Despite my long-standing interest in marine science, I never had the opportunity to explore it until just a few months ago. My professional background up until this point was predominantly in soil microbiology through my work with Lawrence Berkeley National Laboratory, and I was anxious about how I would switch directions and finally be able to pursue my main passion. For this reason, I was thrilled by my acceptance into the OSU Hatfield Marine Science Center’s REU program this year, which led to my exciting collaboration with the GEMM Lab. It was kind of a silly transition to go from studying bacteria, one of the smallest organisms on earth, to whales, who are the largest.

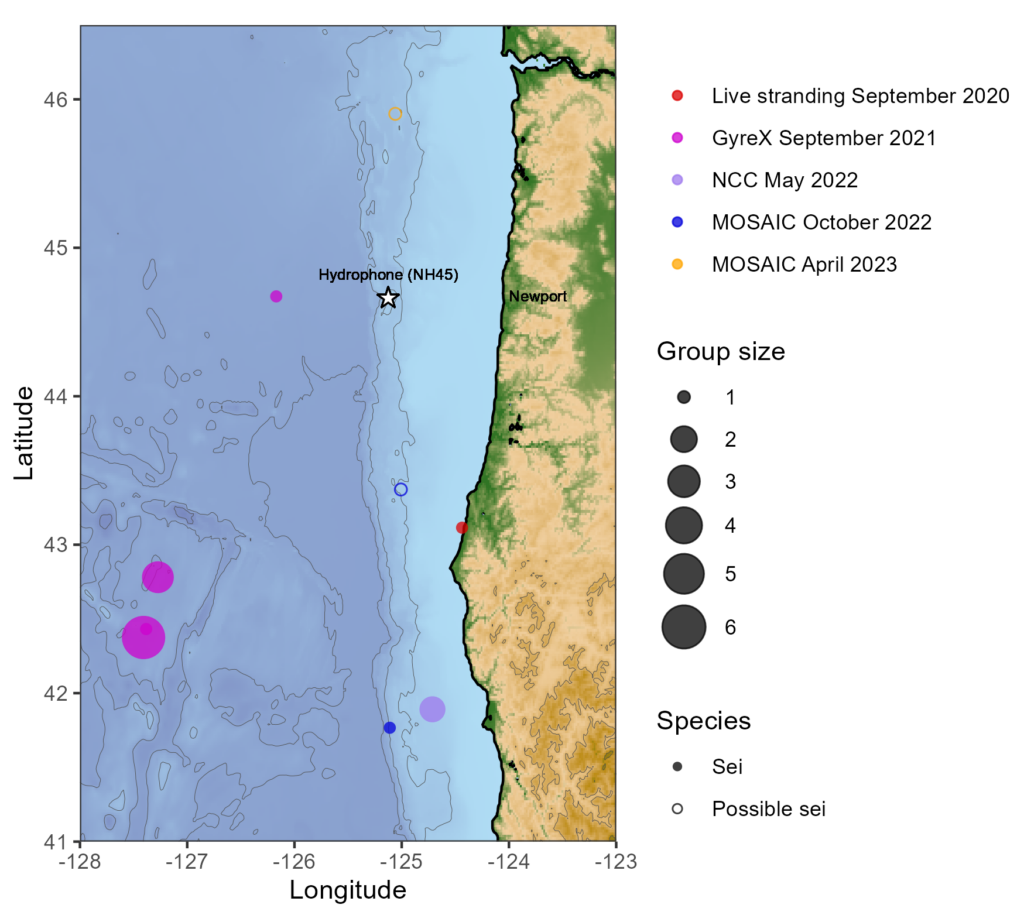
My project this summer focused on sei whale acoustic occurrence off the coast of Oregon. “What’s a sei whale?” is a question I heard a lot throughout the summer and is one that I had to Google myself several times before starting my internship. Believe it or not, sei whales are the third largest rorqual in the world but don’t get much publicity because of their small population sizes and secretive behavior. The commercial whaling industry of the 19th and 20th centuries did a number on sei whale populations globally, rendering them endangered. In consequence, little research has been conducted on their global range, habitat use, and behavior since the ban of commercial whaling in 1986 (Nieukirk et al. 2020). Additionally, sei whales are relatively challenging to study because of their physical similarities to the fin whale, and acoustic similarities to other rorqual vocalizations, most notably blue whale D-calls and fin whale 40 Hz calls. As of today, published literature indicates that sei whale acoustic presence in the Pacific Ocean is restricted to Antarctica, Chile, Hawaii, and possibly British Columbia, Canada (Mcdonald et al. 2005; Espanol-Jiminez et al. 2019; Rankin and Barlow, 2012; Burnham et al. 2019). The idea behind this research project was sparked by sparse visual sightings of sei whales by research cruises conducted by the Marine Mammal Institute (MMI) in recent years (Figure 1). This raised questions about if sei whales are really present in Oregon waters (and not just misidentified fin whales) and if so, how often?

Figure 1. Map of sei whale visual sightings off the coast of Oregon, colored by MMI Lab research cruise, and the location of the hydrophone at NH45 (white star).

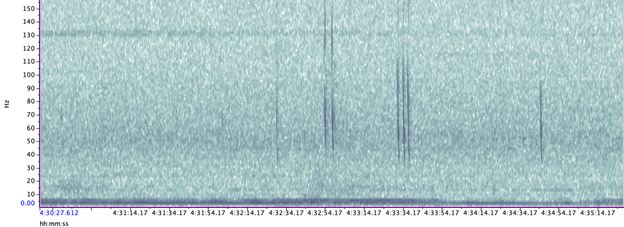
A hydrophone, which is a fancy piece of equipment that records continuous underwater sound, was deployed 45 miles offshore of Newport, OR between October of 2021 and December of 2022. My role this summer was to use this acoustic data to determine whether sei whales are hanging out in Oregon or not. Acoustic data was analyzed using the software Raven Pro, which allowed me to visualize sound in the form of spectrograms (Fig. 2). From there, my task was to select signals that could potentially be sei whale calls. It was a hurdle familiarizing myself with sei whale vocalizations while also keeping in mind that other species (e.g., blue and fin whales) may produce similar sounding (and looking in the spectrograms) calls. For this reason, I decided to establish confidence levels based on published sei whale acoustic research that would help me classify calls with less bias. Vocalizations produced by sei whales are characterized by low frequency, broadband, downsweeps. Sei whales can be acoustically distinguished from other whales because of their tendency to produce uniform groups of calls (typically in doublets and triplets) in a short timeframe. This key finding allowed me to navigate the acoustic data with more ease.

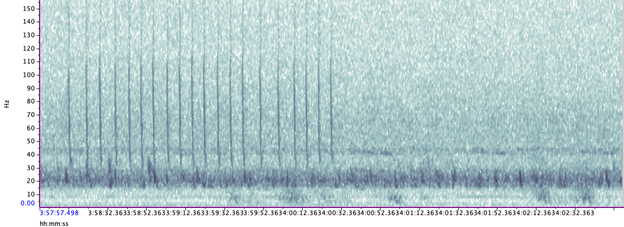
The majority of the summer was spent slowly scanning through the months of data at 5-minute increments. As you can imagine, excitement varied by day. Some days I would find insanely clear signals of blue, fin, and humpback whales and other days I would find nothing. The major discovery and the light at the end of the tunnel was the SEI WHALES!!! I detected numerous high quality sei whale calls throughout the study period with peaks in October and November (but a significantly higher peak in occurrence in 2022 versus 2021). I also encountered a unique vocalization type in fall of 2022, consisting of a very long series of repeated calls that we called “multiplet”, rather than doublets or triplets that is more typical of sei whales (Fig. 3). Lastly, I found no significant diel pattern in sei whale vocalization, indicating that these animals call at any hour of the day. More research needs to go into this project to better estimate sei whale occurrence and understand their behavior in Oregon but this preliminary work provides a great baseline into what sei whales sound like in this part of the world. In the future, the GEMM lab intends on implementing more hydrophone data and work on developing an automated detection system that would identify sei whale calls automatically.

Figure 2. Spectrogram of typical sei whale calls detected in acoustic data
Figure 3. Spectrogram of unique sei whale multiplet call type
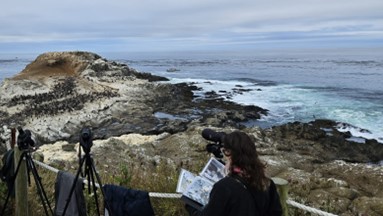
Figure 4. My first time conducting fieldwork! I spent a few mornings assisting Dr. Rachel Orben’s group in surveying murre and cormorant nests (thanks to my good friend Jacque McKay :))

My experience this summer was so formative for me. As someone who has been an aspiring marine biologist for so long, I am so grateful for my experience working with the GEMM Lab alongside incredible scientists who are equally passionate about studying the mysteries of the ocean. This experience has also piqued my interest in bioacoustics and I plan on searching for other opportunities to explore the field in the future. Aside from growing professionally, I learned that I am more capable of tackling and overcoming obstacles than I had thought. I was afraid of entering a field that I knew so little about and was worried about failing and not fitting in. My anxieties were overshadowed by the welcoming atmosphere at Hatfield and I could not have asked for better people to work with. As I was searching for sei whale calls this summer, I suppose that I was also unintentionally searching for my voice as a young scientist in a great, blue field.

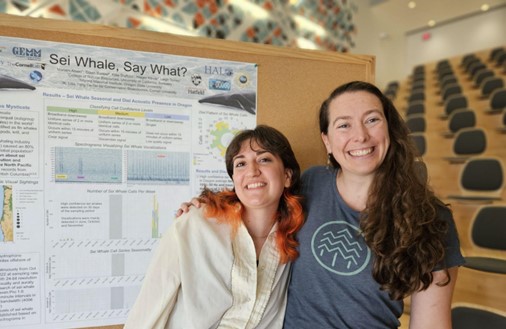
Figure 5. My mentor, Dr. Dawn Barlow, and I with my research poster at the Hatfield Marine Science Center Coastal Intern Symposium

Did you enjoy this blog? Want to learn more about marine life, research, and conservation? Subscribe to our blog and get a weekly alert when we make a new post! Just add your name into the subscribe box below!

Loading

References:

Nieukirk, S. L., Mellinger, D. K., Dziak, R. P., Matsumoto, H., & Klinck, H. (2020). Multi-year occurrence of sei whale calls in North Atlantic polar waters. The Journal of the Acoustical Society of America, 147(3), 1842–1850. https://doi.org/10.1121/10.0000931

McDonald, M. A., Calambokidis, J., Teranishi, A. M., & Hildebrand, J. A. (2001). The acoustic calls of blue whales off California with gender data. The Journal of the Acoustical Society of America, 109(4), 1728–1735. https://doi.org/10.1121/1.1353593

Español-Jiménez, S., Bahamonde, P. A., Chiang, G., & Häussermann, V. (2019). Discovering sounds in Patagonia: Characterizing sei whale (<i>Balaenoptera borealis</i>) downsweeps in the south-eastern Pacific Ocean. Ocean Science, 15(1), 75–82. https://doi.org/10.5194/os-15-75-2019

Rankin, S., & Barlow, J. (2007). VOCALIZATIONS OF THE SEI WHALE BALAENOPTERA BOREALIS OFF THE HAWAIIAN ISLANDS. Bioacoustics, 16(2), 137–145. https://doi.org/10.1080/09524622.2007.9753572

Burnham, R. E., Duffus, D. A., & Mouy, X. (2019). The presence of large whale species in Clayoquot Sound and its offshore waters. Continental Shelf Research, 177, 15–23. https://doi.org/10.1016/j.csr.2019.03.004

As waters warm, what are “anomalous conditions” in the face of climate change?

By Dr. Dawn Barlow, Postdoctoral Scholar, OSU Department of Fisheries, Wildlife, and Conservation Sciences, Geospatial Ecology of Marine Megafauna Lab

Recently, I had the opportunity to attend the Effects of Climate Change on the World’s Ocean (ECCWO) conference. This meeting brought together experts from around the world for one week in Bergen, Norway, to gather and share the latest information on how oceans are changing, what is at risk, responses that are underway, and strategies for increasing climate resilience, mitigation, and adaptation. I presented our recent findings from the EMERALD project, which examines gray whale and harbor porpoise distribution in the Northern California Current over the past three decades. Beyond sharing my postdoctoral research widely for the first time and receiving valuable feedback, the ECCWO conference was an incredibly fruitful learning experience. Marine mammals can be notoriously difficult to study, and often the latest methodological approaches or conceptual frameworks take some time to make their way into the marine mammal field. At ECCWO, I was part of discussions at the ground floor of how the scientific community can characterize the impacts of climate change on the ecosystems, species, and communities we study.

One particular theme became increasingly apparent to me throughout the conference: as the oceans warm, what are “anomalous conditions”? There was an interesting dichotomy between presentations focusing on “extreme events,” “no-analog conditions,” or “non-stationary responses,” compared with discussions about the overall trend of increasing temperatures due to climate change. Essentially, the question that kept arising was, what is our frame of reference? When measuring change, how do we define the baseline?

Marine heatwaves have emerged as an increasingly prevalent phenomenon in recent years (see previous GEMM Lab blogs about marine heatwaves here and here). The currently accepted and typically applied definition of a marine heatwave is when water temperatures exceed a seasonal threshold (greater than the 90th percentile) for a given length of time (five consecutive days or longer) (Hobday et al. 2016). These marine heatwaves can have substantial ecosystem-wide impacts including changes in water column structure, primary production, species composition, distribution, and health, and fisheries management such as closures and quota changes (Cavole et al. 2016, Oliver et al. 2018). Through some of our own previous research, we documented that blue whales in Aotearoa New Zealand shifted their distribution (Barlow et al. 2020) and reduced their reproductive effort (Barlow et al. 2023) in response to marine heatwaves. Concerningly, recent projections anticipate an increase in the frequency, intensity, and duration of marine heatwaves under global climate change (Frölicher et al. 2018, Oliver et al. 2018).

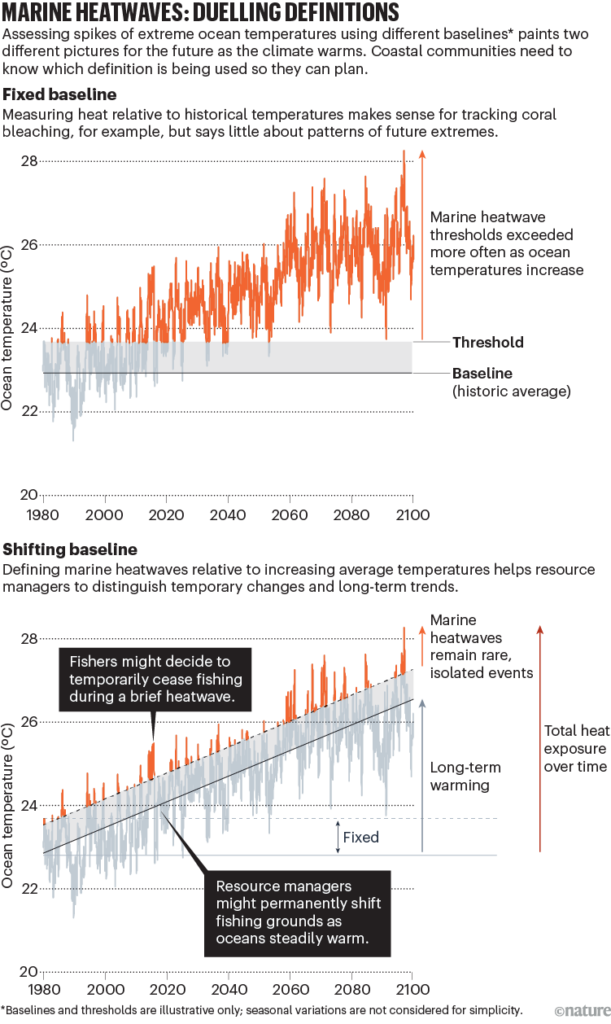
However, as the oceans continue to warm, what baseline do we use to define anomalous events like marine heatwaves? Members of the US National Oceanic and Atmospheric Administration (NOAA) Marine Ecosystem Task Force recently put forward a comment article in Nature, proposing revised definitions for marine heatwaves under climate change, so that coastal communities have the clear information they need to adapt (Amaya et al. 2023). The authors posit that while a “fixed baseline” approach, which compares current conditions to an established period in the past and has been commonly used to-date (Hobday et al. 2016), may be useful in scenarios where a species’ physiological limit is concerned (e.g., coral bleaching), this definition does not incorporate the combined effect of overall warming due to climate change. A “shifting baseline” approach to defining marine heatwaves, in contrast, uses a moving window definition for what is considered “normal” conditions. Therefore, this shifting baseline approach would account for long-term warming, while also calculating anomalous conditions relative to the current state of the system.

An overview of two different definitions for marine heatwaves, relative to either fixed or shifting baselines. Reproduced from Amaya et al. 2023.

Why bother with these seemingly nuanced definitions and differences in terminology, such as fixed versus shifting baselines for defining marine heatwave events? The impacts of these events can be extreme, and potentially bear substantial consequences to ecosystems, species, and coastal communities that rely on marine resources. With the fixed baseline definition, we may be headed toward perpetual heatwave conditions (i.e., it’s almost always hotter than it used to be), at which point disentangling the overall warming trends from these short-term extremes becomes nearly impossible. What the shifting baseline definition means in practice, however, is that in the future temperatures would need to be substantially higher than the historical average in order to qualify as a marine heatwave, which could obscure public perception from the concerning reality of warming oceans. Yet, the authors of the Nature comment article claim, “If everything is extremely warm all of the time, then the term ‘extreme’ loses its meaning. The public might become desensitized to the real threat of marine heatwaves, potentially leading to inaction or a lack of preparedness.” Therefore, clear messaging surrounding both long-term warming and short-term anomalous conditions are critically important for adaptation and resource allocation in the face of rapid environmental change.

While the findings presented and discussed at an international climate change conference could be considered quite disheartening, I left the ECCWO conference feeling re-invigorated with hope. Crown Prince Haakon of Norway gave the opening plenary and articulated that “We need wise and concerned scientists in our search for truth”. Later in the week, I was a co-convenor of a session that gathered early-career ocean professionals, where we discussed themes such as how we deal with uncertainty in our own climate change-related ocean research, and importantly, how do we communicate our findings effectively. Throughout the meeting, I had formal and informal discussions about methods and analytical techniques, and also about what connects each of us to the work that we do. Interacting with driven and dedicated researchers across a broad range of disciplines and career stages gave me some renewed hope for a future of ocean science and marine conservation that is constructive, collaborative, and impactful.

Enjoying the ~anomalously~ sunny April weather in Bergen, Norway, during the ECCWO conference.

Now, as I am diving back in to understanding the impacts of environmental conditions on harbor porpoise and gray whale habitat use patterns through the EMERALD project, I am keeping these themes and takeaways from the ECCWO conference in mind. The EMERALD project draws on a dataset that is about as old as I am, which gives me some tangible perspective on how things have things changed in the Northern California Current during my lifetime. We are grappling with what “anomalous” conditions are in this dynamic upwelling system on our doorstep, whether these anomalies are even always bad, and how conditions continue to change in terms of cyclical oscillations, long-term trends, and short-term events. Stay tuned for what we’ll find, as we continue to disentangle these intertwined patterns of change.

Did you enjoy this blog? Want to learn more about marine life, research, and conservation? Subscribe to our blog and get a weekly alert when we make a new post! Just add your name into the subscribe box below!

Loading

References

Amaya DJ, Jacox MG, Fewings MR, Saba VS, Stuecker MF, Rykaczewski RR, Ross AC, Stock CA, Capotondi A, Petrik CM, Bograd SJ, Alexander MA, Cheng W, Hermann AJ, Kearney KA, Powell BS (2023) Marine heatwaves need clear definitions so coastal communities can adapt. Nature 616:29–32.

Barlow DR, Bernard KS, Escobar-Flores P, Palacios DM, Torres LG (2020) Links in the trophic chain: Modeling functional relationships between in situ oceanography, krill, and blue whale distribution under different oceanographic regimes. Mar Ecol Prog Ser 642:207–225.

Barlow DR, Klinck H, Ponirakis D, Branch TA, Torres LG (2023) Environmental conditions and marine heatwaves influence blue whale foraging and reproductive effort. Ecol Evol 13:e9770.

Cavole LM, Demko AM, Diner RE, Giddings A, Koester I, Pagniello CMLS, Paulsen ML, Ramirez-Valdez A, Schwenck SM, Yen NK, Zill ME, Franks PJS (2016) Biological impacts of the 2013–2015 warm-water anomaly in the northeast Pacific: Winners, losers, and the future. Oceanography 29:273–285.

Frölicher TL, Fischer EM, Gruber N (2018) Marine heatwaves under global warming. Nature 560.

Hobday AJ, Alexander L V., Perkins SE, Smale DA, Straub SC, Oliver ECJ, Benthuysen JA, Burrows MT, Donat MG, Feng M, Holbrook NJ, Moore PJ, Scannell HA, Sen Gupta A, Wernberg T (2016) A hierarchical approach to defining marine heatwaves. Prog Oceanogr.

Oliver ECJ, Donat MG, Burrows MT, Moore PJ, Smale DA, Alexander L V., Benthuysen JA, Feng M, Sen Gupta A, Hobday AJ, Holbrook NJ, Perkins-Kirkpatrick SE, Scannell HA, Straub SC, Wernberg T (2018) Longer and more frequent marine heatwaves over the past century. Nat Commun 9:1–12.

New GEMM Lab publication reveals how blue whale feeding and reproductive effort are related to environmental conditions

By Dr. Dawn Barlow, Postdoctoral Scholar, OSU Department of Fisheries, Wildlife, and Conservation Sciences, Geospatial Ecology of Marine Megafauna Lab

Learning by listening

Studying mobile marine animals that are only fleetingly visible from the water’s surface is challenging. However, many species including baleen whales rely on sound as a primary form of communication, producing different vocalizations related to their fundamental needs to feed and reproduce. Therefore, we can learn a lot about these elusive animals by monitoring the patterns of their calls. In the final chapter of my PhD, we set out to study blue whale ecology and life history by listening. I am excited to share our findings, recently published in Ecology and Evolution.

Blue whales produce two distinct types of vocalizations: song is produced by males and is hypothesized to play a role in breeding behavior, and D calls are a hypothesized social call produced by both sexes in association with feeding behavior. We analyzed how these different calls varied seasonally, and how they related to environmental conditions.

This paper is a collaborative study co-authored by Dr. Holger Klinck and Dimitri Ponirakis of the K. Lisa Yang Center for Conservation Bioacoustics, Dr. Trevor Branch of the University of Washington, and GEMM Lab PI Dr. Leigh Torres, and brings together multiple methods and data sources. Our findings shed light on blue whale habitat use patterns, and how climate change may impact both feeding and reproduction for this species of conservation concern.

The South Taranaki Bight: an ideal study system

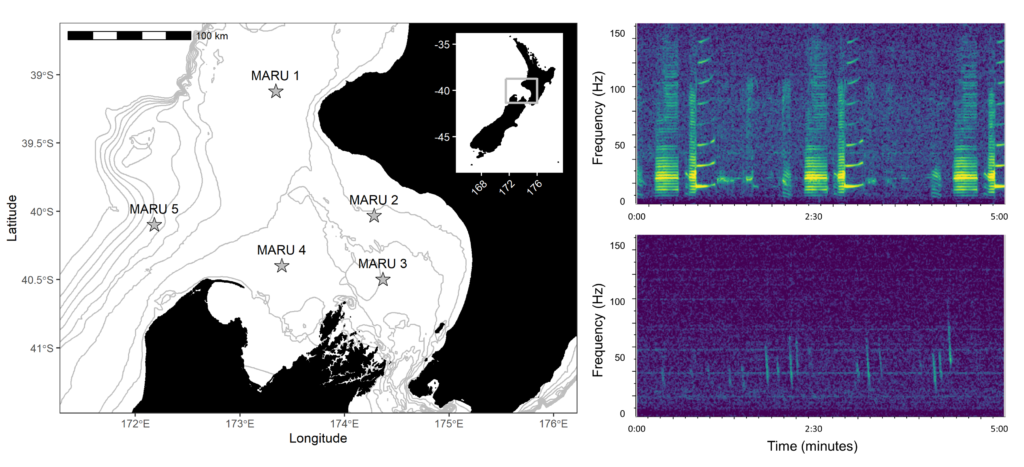
Baleen whales typically migrate between high-latitude, productive feeding grounds and low-latitude breeding grounds. However, the New Zealand blue whale population is present in the South Taranaki Bight (STB) region year-round, which uniquely enabled us to monitor their behavior, ecology, and life history across seasons and years from a single location. We recorded blue whale vocalizations from Marine Autonomous Recording Units (MARUs) deployed at five locations in the STB for two full years (Fig. 1).

Figure 1. Study area map and blue whale call spectrograms. Left panel: map of the study area in the South Taranaki Bight region, with hydrophone (marine autonomous recording unit; MARU) locations denoted by the stars. Gray lines show bathymetry contours at 50 m depth increments, from 0 to 500 m. Location of the study area within New Zealand is indicated by the inset map. Right panels: example spectrograms of the two blue whale call types examined: the New Zealand song recorded on 31 May 2016 (top) and D calls recorded 20 September 2016 (bottom). Figure reproduced from Barlow et al. (2023).

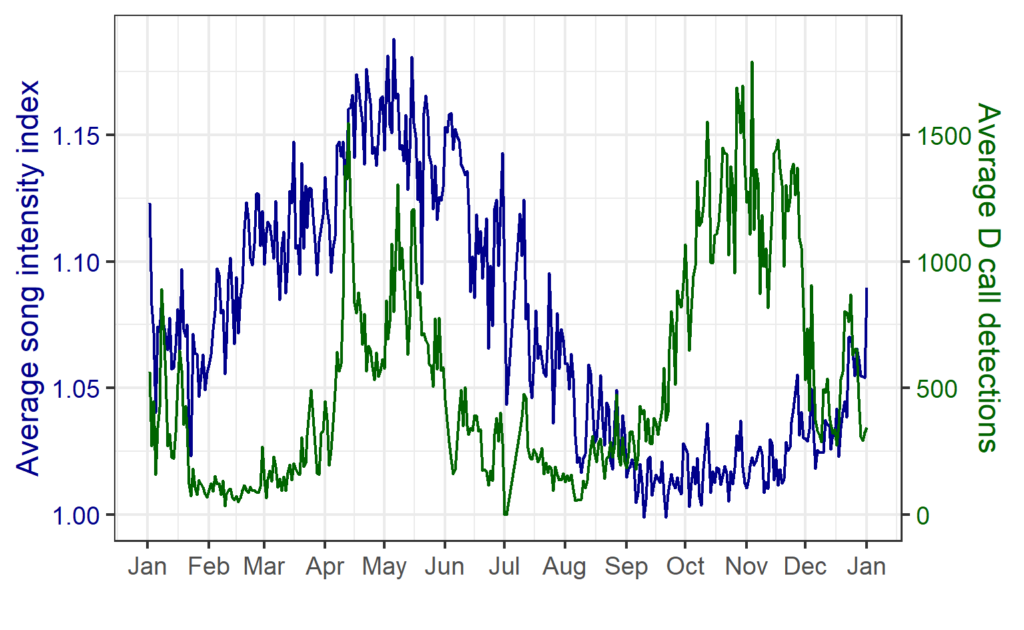
We found that the two vocalization types had different seasonal occurrence patterns (Fig. 2). D calls were associated with upwelling conditions that indicate feeding opportunities, lending evidence for their function as a foraging-related call.

Figure 2. Average annual cycle in the song intensity index (dark blue) and D calls (green) per day of the year, computed across all hydrophone locations and the entire two-year recording period. Figure reproduced from Barlow et al. (2023).

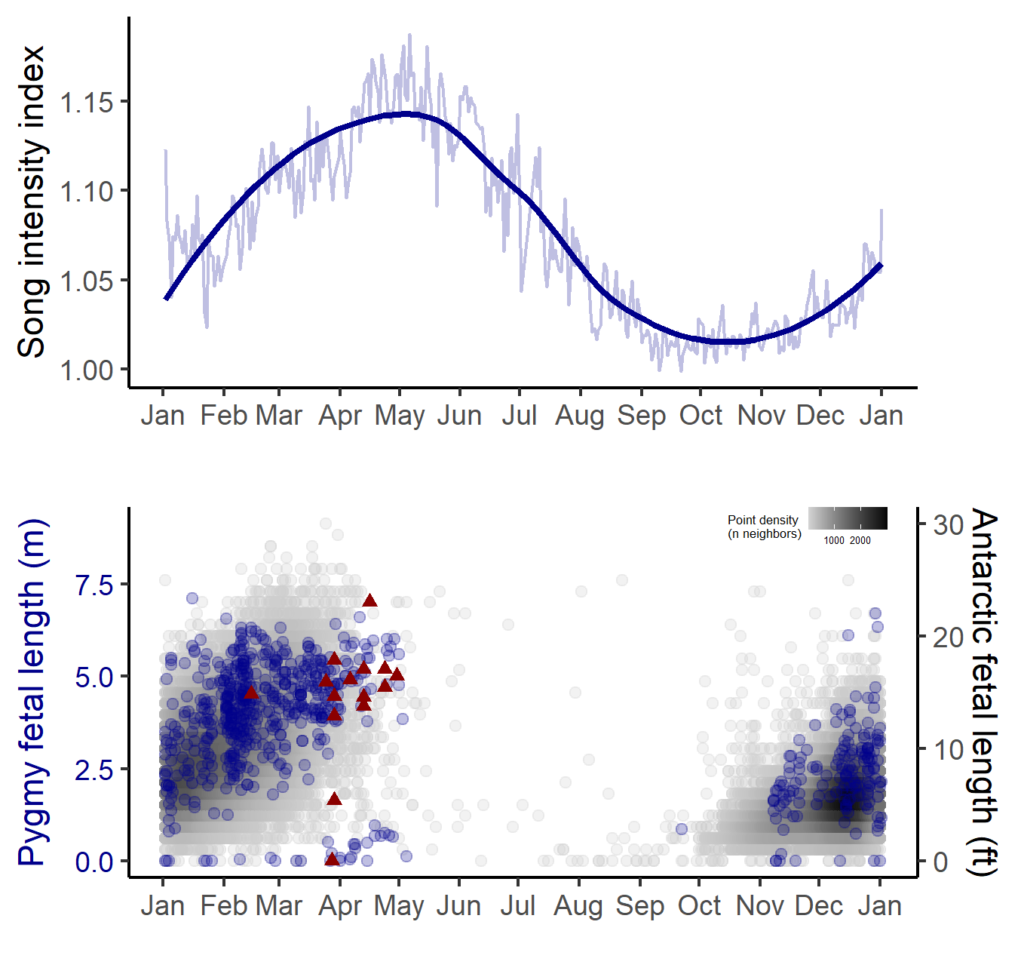
In contrast, blue whale song showed a very clear seasonal peak in the fall and was less obviously correlated with environmental conditions. To investigate the hypothesized function of song as a breeding call, we turned to a perhaps unintuitive source of information: historical whaling records. Whenever a pregnant whale was killed during commercial whaling operations, the length of the fetus was measured. By looking at the seasonal pattern in these fetal lengths, we can presume that births occur around the time of year when fetal lengths are at their longest. The records indicated April-May. By back-calculating the 11-month gestation time for a blue whale, we can presume that mating occurs generally in May-June, which is the exact time of the peak in song intensity from our recordings (Fig. 3).

Figure 3. Annual song intensity and the breeding cycle. Top panel: average yearly cycle in song intensity index, computed across the five hydrophone locations and the entire recording period; dark blue line represents a loess smoothed fit. Bottom panel: fetal length measurements from whaling catch records for Antarctic blue whales (gray, measurements rounded to the nearest foot), pygmy blue whales in the southern hemisphere (blue, measurements rounded to the nearest centimeter). Measurements from blue whales caught within the established range of the New Zealand population are denoted by the dark red triangles. Calving presumably takes place around or shortly after fetal lengths are at their maximum (April–May), which implies that mating likely occurs around May–June, coincident with the peak song intensity. Figure reproduced from Barlow et al. (2023).

With this evidence for D calls as feeding-related calls and song as breeding-related calls, we had a host of new questions, we used this gained knowledge to explore how changing environmental conditions might impact multiple life history processes for New Zealand blue whales

Marine heatwaves impact multiple life history processes

Our study period between January 2016 and February 2018 spanned both typical upwelling conditions and dramatic marine heatwaves in the STB region. While we previously documented that the marine heatwave of 2016 affected blue whale distribution, the population-level impacts on feeding and reproductive effort remained unknown. In our recent study, we found that during marine heatwaves, D calls were dramatically reduced compared to during productive upwelling conditions. During the fall breeding peak, song intensity was likewise dramatically reduced following the marine heatwave. This relationship indicates that following poor feeding conditions, blue whales may invest less effort in reproduction. As marine heatwaves are projected to become more frequent and more intense under global climate change, our findings are perhaps a warning for what is to come as animal populations must contend with changing ocean conditions.

More than a decade of research on New Zealand blue whales

Ten years ago, Leigh first put forward a hypothesis that the STB region was an undocumented blue whale foraging ground based on multiple lines of evidence (Torres 2013). Despite pushback and numerous challenges, Leigh set out to prove her hypothesis through a comprehensive, multi-year data collection effort. I was lucky enough to join the team in 2016, first as a Masters’ student, and then as a PhD student. In the time since Leigh’s hypothesis, we not only documented the New Zealand blue whale population (Barlow et al. 2018), we learned a great deal about what drives blue whale feeding behavior (Torres et al. 2020) and habitat use patterns (Barlow et al. 2020, 2021), and developed forecast models to predict blue whale distribution for dynamic management of the STB (Barlow & Torres 2021). We also documented their unique, year-round presence in the STB, distinct from the migratory or vagrant presence of other blue whale populations (Barlow et al. 2022b). We now understand how marine heatwaves impact both feeding opportunities and reproductive effort (Barlow et al. 2023). We even analyzed blue whale skin condition (Barlow et al. 2019) and acoustic response to earthquakes (Barlow et al. 2022a) along the way. A decade later, it is humbling to reflect on how much we have learned about these whales. This paper is also the final chapter of my PhD, and as I reflect on how I have grown both personally and scientifically since I interviewed with Leigh as a wide-eyed undergraduate student in fall 2015, I am filled with gratitude for the opportunities for learning and growth that Leigh, these whales, and many mentors and collaborators have offered over the years. As is often the case in science, the more questions you ask, the more questions you end up with. We are already dreaming up future studies to further understand the ecology, health, and resilience of this blue whale population. I can only imagine what we might learn in another decade.

Figure 5. A blue whale mother and calf pair come up for air in the South Taranaki Bight. Photo by Dawn Barlow.

Did you enjoy this blog? Want to learn more about marine life, research, and conservation? Subscribe to our blog and get a weekly alert when we make a new post! Just add your name into the subscribe box below!

Loading

References:

Barlow DR, Bernard KS, Escobar-Flores P, Palacios DM, Torres LG (2020) Links in the trophic chain: Modeling functional relationships between in situ oceanography, krill, and blue whale distribution under different oceanographic regimes. Mar Ecol Prog Ser 642:207–225.

Barlow DR, Estrada Jorge M, Klinck H, Torres LG (2022a) Shaken, not stirred: blue whales show no acoustic response to earthquake events. R Soc Open Sci 9:220242.

Barlow DR, Klinck H, Ponirakis D, Branch TA, Torres LG (2023) Environmental conditions and marine heatwaves influence blue whale foraging and reproductive effort. Ecol Evol 13:e9770.

Barlow DR, Klinck H, Ponirakis D, Garvey C, Torres LG (2021) Temporal and spatial lags between wind, coastal upwelling, and blue whale occurrence. Sci Rep 11:1–10.

Barlow DR, Klinck H, Ponirakis D, Holt Colberg M, Torres LG (2022b) Temporal occurrence of three blue whale populations in New Zealand waters from passive acoustic monitoring. J Mammal.

Barlow DR, Pepper AL, Torres LG (2019) Skin deep: An assessment of New Zealand blue whale skin condition. Front Mar Sci 6:757.

Barlow DR, Torres LG (2021) Planning ahead: Dynamic models forecast blue whale distribution with applications for spatial management. J Appl Ecol 58:2493–2504.

Barlow DR, Torres LG, Hodge KB, Steel D, Baker CS, Chandler TE, Bott N, Constantine R, Double MC, Gill P, Glasgow D, Hamner RM, Lilley C, Ogle M, Olson PA, Peters C, Stockin KA, Tessaglia-hymes CT, Klinck H (2018) Documentation of a New Zealand blue whale population based on multiple lines of evidence. Endanger Species Res 36:27–40.

Torres LG (2013) Evidence for an unrecognised blue whale foraging ground in New Zealand. New Zeal J Mar Freshw Res 47:235–248.

Torres LG, Barlow DR, Chandler TE, Burnett JD (2020) Insight into the kinematics of blue whale surface foraging through drone observations and prey data. PeerJ 8:e8906.

How will upwelling ecosystems fare in a changing climate?

By Dawn Barlow, Postdoctoral Scholar, OSU Department of Fisheries, Wildlife, and Conservation Sciences, Geospatial Ecology of Marine Megafauna Lab

Global climate change is affecting all aspects of life on earth. The oceans are not exempt from these impacts. On the contrary, marine species and ecosystems are experiencing significant impacts of climate change at faster rates and greater magnitudes than on land1,2, with cascading effects across trophic levels, impacting human communities that depend on healthy ocean ecosystems3.

In the lobby of the Gladys Valley Marine Studies building that we are privileged to work in here at the Hatfield Marine Science Center, a poem hangs on the wall: “The North Pacific Is Misbehaving”, by Duncan Berry. I read it often, each time moved by how he articulates both the scientific curiosity and the personal emotion that are intertwined in researchers whose work is dedicated to understanding the oceans on a rapidly changing planet. We seek to uncover truths about the watery places we love that capture our fascination; truths that are sometimes beautiful, sometimes puzzling, sometimes heartbreaking. Observations conducted with scientific rigor do not preclude complex human feelings of helplessness, determination, and hope.

Figure 1. Poem by Duncan Berry, entitled, “The North Pacific is Misbehaving”.

Here on the Oregon Coast, we are perched on the edge of a bountiful upwelling ecosystem. Upwelling is the process by which winds drive a net movement of surface water offshore, which is replaced by cold, nutrient-rich water. When this water full of nutrients meets the sunlight of the photic zone, large phytoplankton blooms occur that sustain high densities of forage species like zooplankton and fish, and yielding important feeding opportunities for predators such as marine mammals. Upwelling ecosystems, like the California Current system in our back yard that features in Duncan Berry’s poem, support over 20% of global fisheries catches despite covering an area less than 5% of the global oceans4–6. These narrow bands of ocean on the eastern boundaries of the major oceans are characterized by strong winds, cool sea surface temperatures, and high primary productivity that ultimately support thriving and productive ecosystems (Fig. 2)7.

Figure 2. Reproduced from Bograd et al. 2023. Maps showing global means in several key properties during the warm season (June through August in the Northern Hemisphere and January through March in the Southern Hemisphere). The locations of the four eastern boundary current upwelling systems (EBUSs) are shown by black outlines in each panel. (a) 10-m wind speed (colors) and vectors. (b) SST. (c) Dissolved oxygen concentrations at 200-m depth. (d) Concentration of ocean chlorophyll a. Abbreviations: BenCS, Benguela Current System; CalCS, California Current System; CanCS, Canary Current System; HumCS, Humboldt Current System; SST, sea surface temperature.

Because of their importance to human societies, eastern boundary current upwelling systems (EBUSs) have been well-studied over time. Now, scientists around the world who have dedicated their careers to understanding and describing the dynamics of upwelling systems are forced to reckon with the looming question of what will happen to these systems under climate change. The state of available information was recently synthesized in a forthcoming paper by Bograd et al. (2023). These authors find that the future of upwelling systems is uncertain, as climate change is anticipated to drive conflicting physical changes in their oceanography. Namely, alongshore winds could increase, which would yield increased upwelling. However, a poleward shift in these upwelling systems will likely lead to long-term changes in the intensity, location, and seasonality of upwelling-favorable winds, with intensification in poleward regions but weakening in equatorward areas. Another projected change is stronger temperature gradients between inshore and offshore areas, and vertically within the water column. What these various opposing forces will mean for primary productivity and species community structure remains to be seen.

While most of my prior research has centered around the importance of productive upwelling systems for supporting marine mammal feeding grounds8–10, my recent focus has shifted closer to home, to the nearshore waters less than 5 km from the coastline. Despite their ecological and economic importance, nearshore habitats remain understudied, particularly in the context of climate change. Through the recently launched EMERALD project, we are investigating spatial and temporal distribution patterns of harbor porpoises and gray whales between San Francisco Bay and the Columbia River in relation to fluctuations in key environmental drivers over the past 30 years. On a scientific level, I am thrilled to have such a rich dataset that enables asking broad questions relating to how changing environmental conditions have impacted these nearshore sentinel species. On a more personal level, I must admit some apprehension of what we will find. The excitement of detecting statistically significant northward shift in harbor porpoise distribution stands at odds with my own grappling with what that means for our planet. The oceans are changing, and sensitive species must move or adapt to persist. What does the future hold for this “wild edge of a continent of ours” that I love, as Duncan Berry describes?

Figure 4. The view from Cape Foulweather, showing the complex mosaic of nearshore habitat features. Photo: D. Barlow.

Evidence exists that the nearshore realm of the Northeast Pacific is actually decoupled from coastal upwelling processes11. Rather, these areas may be a “sweet spot” in the coastal boundary layer where headlands and rocky reefs provide more stable retention areas of productivity, distinct from the strong upwelling currents just slightly further from shore (Fig. 4). As the oceans continue to shift under the impacts of climate change, what will it mean for these critically important nearshore habitats? While they are adjacent to prominent upwelling systems, they are also physically, biologically, and ecologically distinct. Will nearshore habitats act as a refuge alongside a more rapidly changing upwelling environment, or will they be impacted in some different way? Many unanswered questions remain. I am eager to continue seeking out truth in the data, with my drive for scientific inquiry fueled by my underlying connection to this wild edge of a continent that I call home.

Did you enjoy this blog? Want to learn more about marine life, research, and conservation? Subscribe to our blog and get a weekly alert when we make a new post! Just add your name into the subscribe box below!

Loading

References:

1.          Poloczanska, E. S. et al. Global imprint of climate change on marine life. Nat. Clim. Chang. 3, (2013).

2.          Lenoir, J. et al. Species better track climate warming in the oceans than on land. Nat. Ecol. Evol. 4, 1044–1059 (2020).

3.          Hoegh-Guldberg, O. & Bruno, J. F. The impact of climate change on the world’s marine ecosystems. Science (2010). doi:10.1126/science.1189930

4.          Mann, K. H. & Lazier, J. R. N. Dynamics of Marine Ecosystems: Biological-physical interactions in the oceans. Blackwell Scientific Publications (1996). doi:10.2307/2960585

5.          Ryther, J. Photosynthesis and fish production in the sea. Science (80-. ). 166, 72–76 (1969).

6.          Cushing, D. H. Plankton production and year-class strength in fish populations: An update of the match/mismatch hypothesis. Adv. Mar. Biol. 9, 255–334 (1990).

7.          Bograd, S. J. et al. Climate Change Impacts on Eastern Boundary Upwelling Systems. Ann. Rev. Mar. Sci. 15, 1–26 (2023).

8.          Barlow, D. R., Bernard, K. S., Escobar-Flores, P., Palacios, D. M. & Torres, L. G. Links in the trophic chain: Modeling functional relationships between in situ oceanography, krill, and blue whale distribution under different oceanographic regimes. Mar. Ecol. Prog. Ser. 642, 207–225 (2020).

9.          Barlow, D. R., Klinck, H., Ponirakis, D., Garvey, C. & Torres, L. G. Temporal and spatial lags between wind, coastal upwelling, and blue whale occurrence. Sci. Rep. 11, 1–10 (2021).

10.        Derville, S., Barlow, D. R., Hayslip, C. & Torres, L. G. Seasonal, Annual, and Decadal Distribution of Three Rorqual Whale Species Relative to Dynamic Ocean Conditions Off Oregon, USA. Front. Mar. Sci. 9, 1–19 (2022).

11.        Shanks, A. L. & Shearman, R. K. Paradigm lost? Cross-shelf distributions of intertidal invertebrate larvae are unaffected by upwelling or downwelling. Mar. Ecol. Prog. Ser. 385, 189–204 (2009).

Harbor porpoise and gray whale distribution over three decades: introducing the EMERALD project

By Dawn Barlow, Postdoctoral Scholar, OSU Department of Fisheries, Wildlife, and Conservation Sciences, Geospatial Ecology of Marine Megafauna Lab

Throughout the world, humans rely on coastal regions for shipping and commerce, fisheries, industrial development, and increasingly for the development of marine renewable energy such as wind and wave energy [1]. Nearshore environments, including the coastal waters of the Northern California Current (NCC), are therefore coupled social-ecological systems, at the intersection of human and biological productivity [2].

The NCC supports a diverse food web of ecologically and commercially important species [3]. The nearshore region of the NCC is further shaped by a rich mosaic of complex features including rocky reefs, kelp forests, and sloping sandy bottom substrate [4], creating habitat for numerous species of conservation interest, including invertebrates, fish, seabirds, and marine mammals [5]. Despite its importance, this realm poses significant challenges for vessel-based data collection, and therefore it remains relatively poorly monitored and understood.

The view from Cape Foulweather, showing the complex mosaic of nearshore habitat features. Photo: D. Barlow.

I am excited to introduce a new project focused on these important nearshore waters, in which we will be Examining Marine mammal Ecology through Region-wide Assessment of Long-term Data (EMERALD). Since 1992, standardized surveys have been conducted between San Francisco Bay, CA, and the Columbia River, OR, to monitor the abundance of marbled murrelets, a seabird of conservation concern. Each spring and summer, researchers have simultaneously been diligently documenting the locations of harbor porpoise and gray whale sightings—two iconic marine mammal species that rely on the nearshore waters of the NCC. This rich and extensive record is rare for marine mammal data, particularly in the challenging, turbulent nearshore environment. Furthermore, harbor porpoises are cryptic, making visual sampling particularly challenging, and gray whales can be sparsely distributed, yielding low sample sizes in the absence of long-term data collection.

Left: The survey team collecting data; Right: Marbled murrelet floating on the water.

For the EMERALD project, we will investigate spatial and temporal distribution patterns of harbor porpoises and gray whales in relation to fluctuations in key environmental drivers. The primary goals of the project are to (1) Identify persistent hotspots in harbor porpoise and gray whale sightings over time, and (2) Examine the environmental drivers of sighting hotspots through spatial and temporal analyses.

A harbor porpoise surfacing off the central Oregon coast. Photo: L. Torres.

From a first look at the data, we are already excited by some emerging patterns. In total, the dataset contains sightings of 6,763 harbor porpoise (mean 233 per year) and 530 gray whales (mean 18 per year). Preliminary data exploration reveals that harbor porpoise sightings increased in 2011-2012, predominantly between Cape Blanco, OR, and Cape Mendocino, CA. Gray whale sightings appear to follow an oscillating, cyclical pattern with peaks approximately every three years, with notable disruption of this pattern during the marine heatwave of 2014-2015. What are the drivers of sighting hotspots and spatial and temporal fluctuations in sighting rates? Time—and a quantitative analytical approach involving density estimation, timeseries analysis, and species distribution modeling—will tell.

A gray whale forages in kelp forest habitat over a nearshore rocky reef. Photo: T. Chandler.

I recently completed my PhD on the ecology and distribution of blue whales in New Zealand (for more information, see the OBSIDIAN project). Now, I am excited to apply the spatial analysis skills have been honing to a new study system and two new study species as I take on a new role in the GEMM Lab as a Postdoctoral Scholar. The EMERALD project will turn my focus to the nearshore waters close to home that I have grown to love over the past six years as a resident of coastal Oregon. The surveys I will be working with began before I was born, and I am truly fortunate to inherit such a rich dataset—a rare treat for a marine mammal biologist, and an exciting prospect for a statistical ecologist.

Dawn and Quin the dog, enjoying views of Oregon’s complex and important nearshore waters. Both are thrilled to remain in Oregon for the EMERALD project. Photo: R. Kaplan.

So, stay tuned for our findings as the project unfolds. In the meantime, I want express gratitude to Craig Strong of Crescent Coastal Research who has led the dedicated survey effort for the marbled murrelet monitoring program, without whom none of the data would exist. This project is funded by the Oregon Gray Whale License Plate funds, and we thank the gray whale license plate holders for their support of marine mammal research.

Did you enjoy this blog? Want to learn more about marine life, research, and conservation? Subscribe to our blog and get a weekly alert when we make a new post! Just add your name into the subscribe box below!

Loading

References:

1.        Jouffray, J.-B., Blasiak, R., Norström, A. V., Österblom, H., and Nyström, M. (2020). The Blue Acceleration: The Trajectory of Human Expansion into the Ocean. One Earth 2, 43–54.

2.        Sjostrom, A.J.C., Ciannelli, L., Conway, F., and Wakefield, W.W. (2021). Gathering local ecological knowledge to augment scientific and management understanding of a living coastal resource: The case of Oregon’s nearshore groundfish trawl fishery. Mar. Policy 131, 104617.

3.        Bograd, S.J., Schroeder, I., Sarkar, N., Qiu, X., Sydeman, W.J., and Schwing, F.B. (2009). Phenology of coastal upwelling in the California Current. Geophys. Res. Lett. 36, 1–5.

4.        Romsos, G., Goldfinger, C., Robison, R., Milstein, R., Chaytor, J., and Wakefield, W. (2007). Development of a regional seafloor surficial geologic habitat map for the continental margins of Oregon and Washington, USA. Mapp. Seafloor Habitat Charact. Geol. Assoc. Canada, Spec. Pap., 219–243.

5.        Oregon Department of Fish and Wildlife (2016). Oregon Nearshore Strategy. Available at: https://oregonconservationstrategy.org/oregon-nearshore-strategy/ [Accessed January 10, 2022].