By Rachel Kaplan, PhD candidate, Oregon State University College of Earth, Ocean, and Atmospheric Sciences and Department of Fisheries, Wildlife, and Conservation Sciences, Geospatial Ecology of Marine Megafauna Lab
What does a whale look for at mealtime? Is it a lot of food, its quality, or the type of food? An improved understanding of what makes krill swarms, an important prey item, appetizing for humpback whales can help us anticipate where and when we will see them in our ocean backyard, the Northern California Current (NCC) foraging grounds. In a new paper, we found that humpback whale presence in the NCC is tied to several different metrics of krill swarm quality and quantity, particularly species composition (what types of krill are in the swarm), energetic density (the caloric richness of the average mouthful), and biomass (how much krill is in the swarm). Interestingly, relationships between humpback whales and these krill swarm quality metrics are variable in time and space, dependent on whether the whale is foraging on or off the continental shelf and if it is early or late in the foraging season.
This study required a special, fine-scale dataset of simultaneous observations of krill and whales at sea. While GEMM Lab members conducted marine mammal surveys, we simultaneously observed the prey that whales had access to, using active acoustics (essentially a fancy fish finder) to profile the water column and net tows to collect krill. When we put all these data streams together, we found that increases in biomass, energetic density, and the amount of a particular species, Thysanoessa spinifera, in a krill swarm were positively related to humpback whale presence. These results suggest that humpback whales balance multiple prey quality factors to select feeding areas that offer both plentiful and high-quality krill.


Species composition
Euphausia pacifica and T. spinifera are the two most common krill species in the NCC region, and other research has shown that many krill foragers, including blue whales, seabirds, and fish, preferentially consume T. spinifera. Although this pickiness is well-warranted – individual T. spinifera tend to be larger than E. pacifica and much higher in calories during the late foraging season – targeting this juicy prey item could place humpback whales in competition with these other species, which may make it harder for them to find a square meal. Nevertheless, we found positive relationships between the proportion of T. spinifera in a krill swarm and humpback whale presence, suggesting humpback whales do in fact preferentially prey upon T. spinifera, particularly during the late foraging season (about July-November).
Energetic density
Humpback whales’ preference for T. spinifera during the late foraging season may be due to its higher caloric content. Although the two krill species offer a similar number of calories early in the foraging season,we found that the energetic density of T. spinifera was elevated during the late foraging season, after productive upwelling conditions have revved up the food web over several months. Krill swarm energetic density had a positive effect on humpback whale occurrence, particularly in the late season when T. spinifera and E. pacifica have significantly different caloric contents. Interestingly, this positive relationship was not present onshore during the early season, when the two krill species have similar caloric contents.

Humpback whales also target forage fish on the continental shelf that have higher energetic densities than krill, indicating that whales may selectively forage on fish – even though it is more energetically expensive to capture them. Variation in seasonal and spatial relationships with krill swarm energetic density may explain why humpback whales prey-switch, selecting prey based on availability and quality. As flexible foragers, humpback whales can consistently target higher-quality swarms that offer more energy per lunge.
Biomass
Biomass, or the total amount of krill in a swarm, was the single best predictor of humpback whale presence that we tested. This result emphasizes the importance of large krill swarms in explaining where humpback whales forage. We found that krill swarm biomass tended to be higher offshore, where swarms were also located deeper in the water column. During the late season offshore, krill quality (elevated due to higher late season caloric contents) together with quantity (higher offshore biomass) may make these offshore swarms the most favorable for foraging whales, despite being deeper.

Future food webs
Environmental conditions are changing in the NCC, with events like marine heatwaves and strong El Niño events shifting food webs. E. pacifica and T. spinifera may respond to climate change differently based on their life history strategies. Distributional shifts, such as the disappearance of T. spinifera from the NCC during the 2014–2015 “Blob” marine heatwave that transformed the northeast Pacific Ocean, could diminish or entirely remove this key prey item. As a result of such climate and environmental changes, humpback whales may encounter lower quality prey and/or shifts in prey distribution that could make it harder for them to find a meal. In changing oceans, better understanding krill prey quality for humpback whales will shape improved tools for conservation management.
References
Chenoweth, E., Boswell, K., Friedlaender, A., McPhee, M., Burrows, J., Heintz, R., and Straley, J. 2021. Confronting assumptions about prey selection by lunge‐feeding whales using a process‐based model. Funct. Ecol., 35.
Croll, D., Marinovic, B., Benson, S., Chavez, F., Black, N., Ternullo, R., and Tershy, B. 2005. From wind to whales: trophic links in a coastal upwelling system. Mar. Ecol. Prog. Ser., 289: 117–130.
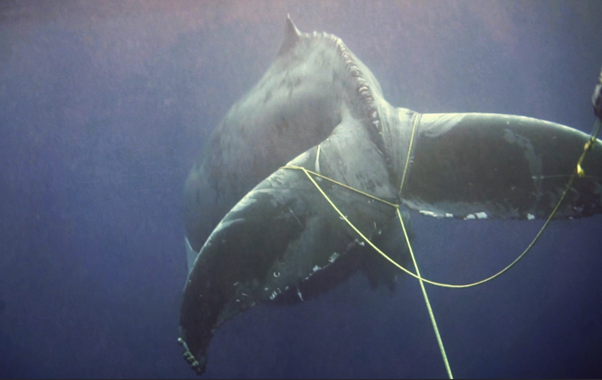
Derville, S., Buell, T. V., Corbett, K. C., Hayslip, C., and Torres, L. G. 2023. Exposure of whales to entanglement risk in Dungeness crab fishing gear in Oregon, USA, reveals distinctive spatio-temporal and climatic patterns. Biol. Conserv., 281: 109989.
Fiedler, P. C., Reilly, S. B., Hewitt, R. P., Demer, D., Philbrick, V. A., Smith, S., Armstrong, W., et al. 1998. Blue whale habitat and prey in the California Channel Islands. Deep Sea Res. Part II, 45: 1781–1801.
Fisher, J. L., Menkel, J., Copeman, L., Shaw, C. T., Feinberg, L. R., and Peterson, W. T. 2020. Comparison of condition metrics and lipid content between Euphausia pacifica and Thysanoessa spinifera in the northern California Current, USA. Prog. Oceanogr., 188.
Murdoch, W. W. 1969. Switching in General Predators: Experiments on Predator Specificity and Stability of Prey Populations. Ecol. Monog., 39: 335–354.
Nickels, C. F., Sala, L. M., and Ohman, M. D. 2018. The morphology of euphausiid mandibles used to assess selective predation by blue whales in the southern sector of the California Current System. J. Crustacean Biol., 38: 563–573.
Price, S. E., Savoca, M. S., Kumar, M., Czapanskiy, M. F., McDermott, D., Litvin, S. Y., Cade, D. E., et al. 2024. Energy densities of key prey species in the California Current Ecosystem. Front. Mar. Sci., 10: 1345525.
Robertson, R. R., and Bjorkstedt, E. P. 2020. Climate-driven variability in Euphausia pacifica size distributions off northern California. Prog. Oceanogr., 188.
Santora, J. A., Mantua, N. J., Schroeder, I. D., Field, J. C., Hazen, E. L., Bograd, S. J., Sydeman, W. J., et al. 2020. Habitat compression and ecosystem shifts as potential links between marine heatwave and record whale entanglements. Nat Commun, 11: 536.
Spitz, J., Trites, A. W., Becquet, V., Brind’Amour, A., Cherel, Y., Galois, R., and Ridoux, V. 2012. Cost of Living Dictates what Whales, Dolphins and Porpoises Eat: The Importance of Prey Quality on Predator Foraging Strategies. PLoS ONE, 7: e50096.
Tanasichuk, R. 1998a. Interannual variations in the population biology and productivity of Thysanoessa spinifera in Barkley Sound, Canada, with special reference to the 1992 and 1993 warm ocean years. Mar. Ecol. Prog. Ser., 173: 181–195.
Videsen, S. K. A., Simon, M., Christiansen, F., Friedlaender, A., Goldbogen, J., Malte, H., Segre, P., et al. 2023. Cheap gulp foraging of a giga-predator enables efficient exploitation of sparse prey. Sci. Adv., 9: eade3889.
Weber, E. D., Auth, T. D., Baumann-Pickering, S., Baumgartner, T. R., Bjorkstedt, E. P., Bograd, S. J., Burke, B. J., et al. 2021. State of the California Current 2019–2020: Back to the Future With Marine Heatwaves? Front. Mar. Sci., 8.