El Niño de Navidad: What is atmospheric Santa Claus bringing to Oregon krill and whales?

By Rachel Kaplan, PhD student, Oregon State University College of Earth, Ocean, and Atmospheric Sciences and Department of Fisheries, Wildlife, and Conservation Sciences, Geospatial Ecology of Marine Megafauna Lab

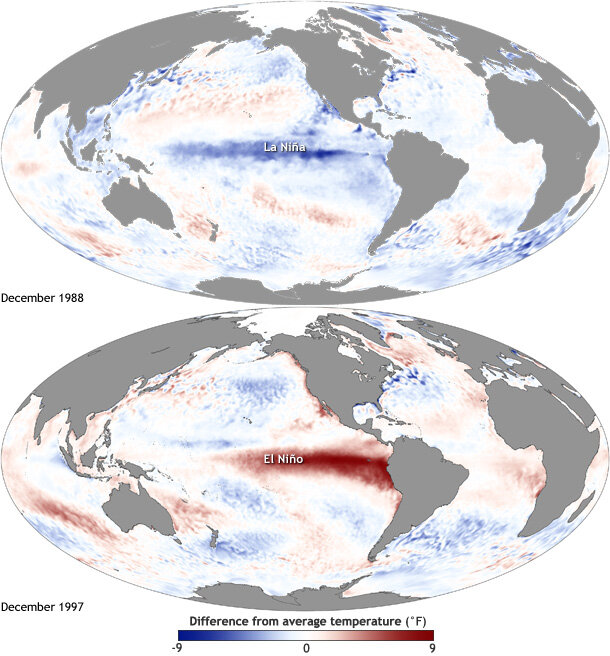
Early June marked the onset of El Niño conditions in the Pacific Ocean , which have been strengthening through the fall and winter. For Oregonians, this climate event means unseasonably warm December days, less snow and overall precipitation (it’s sunny as I write this!), and the potential for increased wildfires and marine heatwaves next summer.

This phenomenon occurs about every two to seven years as part of the El Niño Southern Oscillation (ENSO), a cyclical rotation of atmospheric and oceanic conditions in the Pacific Ocean that is initiated by departures from and returns to “normal conditions” at the equator. Typically, the trade winds blow warm water west along the equator, and El Niño occurs when these winds weaken or reverse. As a result, the upwelling of cold water at the equator ceases, and warm water flows towards the west coast of the Americas, rather than its typical pathway towards Asia. When the trade winds resume their normal direction, usually after months or a year, the system returns to “normal” conditions – or, it can enter the cool La Niña part of the cycle, in which the trade winds are stronger than normal. “El Niño de Navidad” was named by South American fisherman in the 1600s because this event tends to peak in December – and El Niño is clearly going to be a guest for Christmas this year.

Figure 1. Maps of sea surface temperature anomalies show Pacific Ocean conditions during a strong La Niña (top) and El Niño (bottom). Source: NOAA climate.gov

These events at the equator trigger changes in global atmospheric circulation patterns, and they can shape weather around the world. Teleconnection, the coherence between meteorological and environmental phenomena occurring far apart, is to me one of the most incredible things about the natural world.  This coherence means that the biological community off the Oregon coast is strongly impacted by events initiated at the equator, with consequences that we don’t yet fully understand.

The effects of El Niño are diverse – floods in some places, droughts in others – and their onset can mean wildly different things for Oregon, Peru, Alaska, and beyond. As we tap our fingers waiting to be able to ski and snowboard in Oregon, what does our current El Niño event mean for the life in the waters off our coast?

Figure 2. Anomalous conditions at the equator qualified as an El Niño event in June 2023.

ENSO plays a big role in the variability in our local Northern California Current (NCC) system, and the outcomes of these events can differ based on the strength and how the signal propagates through the ocean and atmosphere (Checkley & Barth, 2009). Large-scale “coastal-trapped” waves flowing alongshore can bring the warm water signal of an El Niño to our ocean backyard in a matter of weeks. One of the first impacts is a deepening of the thermocline, the upper ocean’s steep gradient in temperature, which changes the cycling of important nutrients in the surface ocean. This can result in a decrease in upwelling and primary productivity that sends ramifications through the food web, including consequences for grazers and predators like zooplankton, marine mammals, and seabirds (Checkley & Barth, 2009).

In addition to these ecosystem effects that result from local changes, the ocean community can also receive new visitors from afar, and see others flee . For krill, the shrimp-like whale prey that I spend a lot of my time thinking about, community composition can change as subtropical species typically found off southern and Baja California are displaced by horizontal ocean flow, or as resident species head north (Lilly & Ohman, 2021).

Figure 3. This Euphausia gibboides krill is typically found in offshore subtropical habitats but moves north and inshore during El Niño events, and tends to persist awhile in these new environments, impacting the local zooplankton community. Source: Solvn Zankl

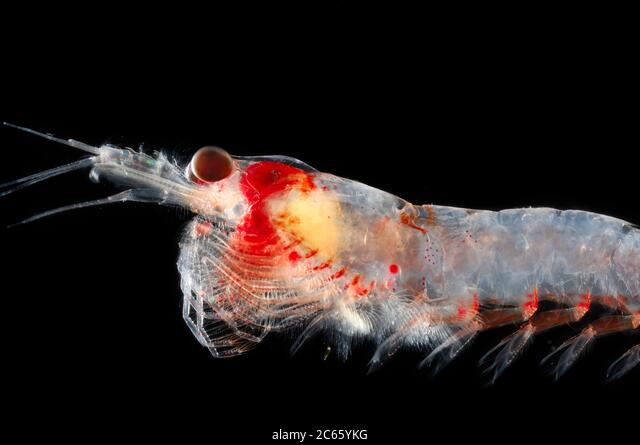
The two main krill species that occur in the NCC, Euphausia pacifica and Thysanoessa spinifera, favor the cool, coastal waters typical off the coast of Oregon. During El Niño events, E. pacifica tends to contract its distribution inshore in order to continue occupying these conditions, increasing its spatial overlap with T. spinifera (Lilly & Ohman, 2021). In addition, both tend to shift their populations north, toward cooler, upwelling waters (Lilly & Ohman, 2021).

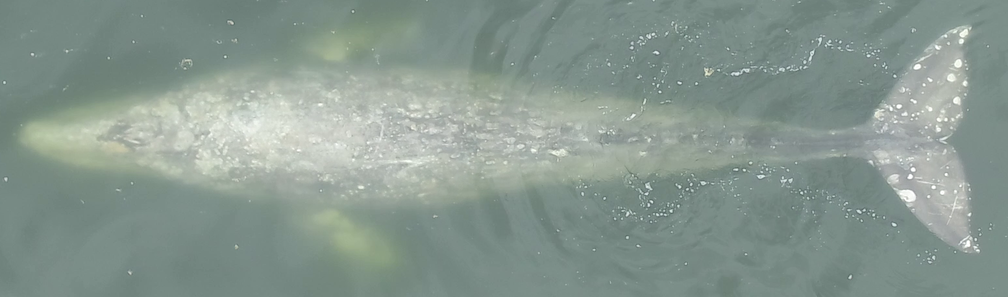
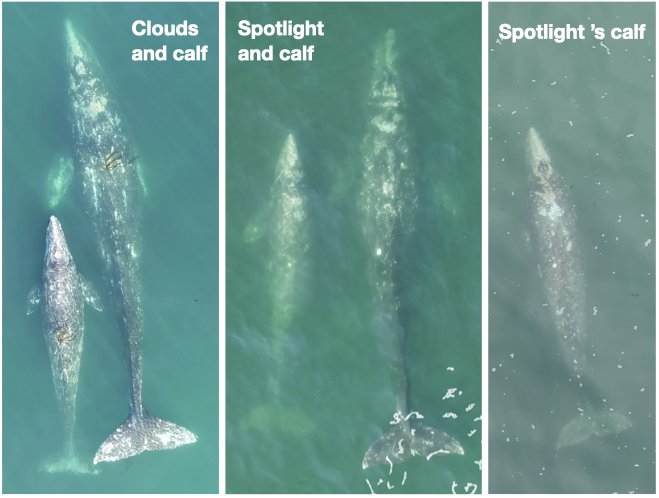
These krill species are a favored prey of rorqual whales, and the coast of Oregon is an important foraging ground for humpback, blue, and fin whales. Predators tend to follow their prey, and shifting distributions of these krill species may cause whales to move, too. During the 2014-2015 “Blob” event in the Pacific Ocean, a marine heatwave was exacerbated by El Niño conditions. Humpback whales in central California shifted their distributions inshore in response to sparse offshore krill, increasing their overlap with fishing gear and leading to an increase in entanglement events (Santora et al., 2020). Further north, these conditions even led humpback whales to forage in the Columbia River!

Figure 4. In September 2015, El Niño conditions led humpback whales to follow their prey and forage in the Columbia River.

As El Niño events compound with the impacts of global climate change, we can expect these distributional shifts – and perhaps surprises – to continue. By the year 2100, the west coast habitat of both T. spinifera and E. pacifica will likely be constrained due to ocean warming – and when El Niños occur, this habitat will decrease even further (Lilly & Ohman, 2021). As a result, the abundances of both species are expected to decrease during El Niño events, beyond what is seen today (Lilly & Ohman, 2021). This decline in prey availability will likely present a problem for future foraging whales, which may already be facing increased environmental challenges.

Understanding connections is inherent to the field of ecology, and although these environmental dependencies are part of what makes life so vulnerable, they can also be a source of resilience. Although humans have known about ENSO for over 400 years, the complex interplay between nature, anthropogenic systems, and climate change means that we are still learning the full implications of these events. Just as waiting for Santa Claus always keeps kids guessing, the dynamic ocean keeps surprising us, too.

Loading

References

Checkley, D. M., & Barth, J. A. (2009). Patterns and processes in the California Current System. Progress in Oceanography, 83(1–4), 49–64. https://doi.org/10.1016/j.pocean.2009.07.028

Lilly, L. E., & Ohman, M. D. (2021). Euphausiid spatial displacements and habitat shifts in the southern California Current System in response to El Niño variability. Progress in Oceanography, 193, 102544. https://doi.org/10.1016/j.pocean.2021.102544

Santora, J. A., Mantua, N. J., Schroeder, I. D., Field, J. C., Hazen, E. L., Bograd, S. J., Sydeman, W. J., Wells, B. K., Calambokidis, J., Saez, L., Lawson, D., & Forney, K. A. (2020). Habitat compression and ecosystem shifts as potential links between marine heatwave and record whale entanglements. Nat Commun, 11(1), 536. https://doi.org/10.1038/s41467-019-14215-w


Migrating back east

By: Kate Colson, MSc Oceans and Fisheries, University of British Columbia, Institute for the Oceans and Fisheries, Marine Mammal Research Unit

With the changing of the season, gray whales are starting their southbound migration that will end in the lagoons off the Baja California Mexico. The migration of the gray whale is the longest migration of any mammal—the round trip totals ~10,000 miles (Pike, 1962)! 

Map of the migration route taken by gray whales along the west coast of North America. (Image credit: Angle, Asplund, and Ostrander, 2017 https://www.slocoe.org/resources/parent-and-public-resources/what-is-a-california-gray-whale/california-gray-whale-migration/)

Like these gray whales, I am also undertaking my own “migration” as I leave Newport to start my post-Master’s journey. However, my migration will be a little shorter than the gray whale’s journey—only ~3,000 miles—as I head back to the east coast. As I talked about in my previous blog, I have finished my thesis studying the energetics of gray whale foraging behaviors and I attended my commencement ceremony at the University of British Columbia last Wednesday. As my time with the GEMM Lab comes to a close, I want to take some time to reflect on my time in Newport. 

Me in my graduation regalia (right) and my co-supervisor Andrew Trites holding the university mace (left) after my commencement ceremony at the University of British Columbia rose garden. 

Many depictions of scientists show them working in isolation but in my time with the GEMM Lab I got to fully experience the collaborative nature of science. My thesis was a part of the GEMM Lab’s Gray whale Response to Ambient Noise Informed by Technology and Ecology (GRANITE) project and I worked closely with the GRANITE team to help achieve the project’s research goals. The GRANITE team has annual meetings where team members give updates on their contributions to the project and flush out ideas in a series of very busy days. I found these collaborative meetings very helpful to ensure that I was keeping the big picture of the gray whale study system in mind while working with the energetics data I explored for my thesis. The collaborative nature of the GRANITE project provided the opportunity to learn from people that have a different skill set from my own and expose me to many different types of analysis. 

GRANITE team members hard at work thinking about gray whales and their physiological response to noise. 

This summer I also was able to participate in outreach with the partnership of the Oregon State University Marine Mammal Institute and the Eugene Exploding Whales (the alternate identity of the Eugene Emeralds) minor league baseball team to promote the Oregon Gray Whale License plates. It was exciting to talk to baseball fans about marine mammals and be able to demonstrate that the Gray Whale License plate sales are truly making a difference for the gray whales off the Oregon coast. In fact, the minimally invasive suction cup tags used in to collect the data I analyzed in my thesis were funded by the OSU Gray Whale License plate fund!

Photo of the GEMM Lab promoting Oregon Gray Whale License plates at the Eugene Exploding Whales baseball game. If you haven’t already, be sure to “Put a whale on your tail!” to help support marine mammal research off the Oregon Coast. 

Outside of the amazing science opportunities, I have thoroughly enjoyed the privilege of exploring Newport and the Oregon coast. I was lucky enough to find lots of agates and enjoyed consistently spotting gray whale blows on my many beach walks. I experienced so many breathtaking views from hikes (God’s thumb was my personal favorite). I got to attend an Oregon State Beavers football game where we crushed Stanford! And most of all, I am so thankful for all the friends I’ve made in my time here. These warm memories, and the knowledge that I can always come back, will help make it a little easier to start my migration away from Newport. 

Me and my friends outside of Reser Stadium for the Oregon State Beavers football game vs Stanford this season. Go Beavs!!!
Me and my friends celebrating after my defense. 

Did you enjoy this blog? Want to learn more about marine life, research, and
conservation? Subscribe to our blog and get a weekly message when we post a new
blog. Just add your name and email into the subscribe box below

Loading

References

Pike, G. C. (1962). Migration and feeding of the gray whale (Eschrichtius gibbosus). Journal of the Fisheries Research Board of Canada19(5), 815–838. https://doi.org/10.1139/f62-051

A non-invasive approach to pregnancy diagnosis in Gray whales is possible!

Dr. Alejandro A. Fernández Ajó, Postdoctoral Scholar, Marine Mammal Institute – OSU Department of Fisheries, Wildlife, & Conservation Sciences, Geospatial Ecology of Marine Megafauna (GEMM) Lab.

In a previous post (link to blog), I discussed the crucial importance of acquiring knowledge on the reproductive parameters of individual animals in wild populations for designing effective strategies in conservation biology. Specifically, the ability to quantify the number of pregnancies within a population offers valuable insights into the health of individual females and the population as a whole [1,2]. This knowledge provides tools to describe important life-history parameters, including the age of sexual maturity, frequency of pregnancy, duration of gestation, timing of reproduction, and population fecundity; all of which are essential components for monitoring trends in reproduction and the overall health of a species [3]. Additionally, I explained some of the challenges inherent in obtaining such information when working with massive wild animals that spend most of their time underwater in vast expanses of the oceans. Yes, I am talking about whales.

As a result of the logistical and methodological challenges that involve the study of large whales, detailed knowledge of the life-history and general reproductive biology of whales is sparse for most species and populations. In fact, much of the available information is derived from whaling records [4], which may be outdated for application in population models [5].

If you are an avid reader of the GEMM Lab blog posts, you might be familiar with the gray whale (Eschrichtius robustus), and with the distinct subgroup of gray whales, known as the Pacific Coast Feeding Group (PCFG). PCFG gray whales are characterized by their shorter migration to spend their feeding season in the coastal waters of Northern California, Oregon, and southeastern Alaska [6], relative to the larger Eastern North Pacific gray whale that forage in the Arctic region.

The GEMM Lab has monitored individual gray whales within the PCFG off the Oregon coast since 2016 (check the GRANITE project). Each individual whale presents a unique pigmentation pattern, or unique marks that we can use to identify who is who among the whales who visit the Oregon coast. In this way, we keep a detailed record of re-sightings of known individuals (visit IndividuWhale to learn more), and we have high individual re-sighting rates, resulting in a long-term data series for individual whales which enables us to monitor their health, body condition, and thus further develop and advance our non-invasive study methods.

Drone-based image of a Gray whale defecating. Source: GEMM Lab, NOAA/NSF permit #16111

In our recently manuscript published in the Royal Society Open Science journal, armed with our robust dataset comprising fecal hormone metabolites, drone-based photogrammetry, and individual sightings, we delved into the strengths and weaknesses of various diagnostic tools for non-invasive pregnancy diagnosis. Ultimately, we propose a methodological approach that can help with the challenging and important task of identifying pregnancies in gray whales. In particular, we explored the variability in fecal progesterone metabolites and body morphology relative to observed reproductive status and estimated the pregnancy probability for mature females using statistical models.

In mammals, the progesterone hormone is secreted in the ovaries during the estrous cycle and gestation, making it the predominant hormone responsible for sustaining pregnancy [7]. As the hormones are cleared from the blood into the gut, they are metabolized and eventually excreted in feces; fecal samples represent a cumulative and integrated concentration of hormone metabolites [8;9], which are useful indicators for endocrine assessments of free-swimming whales. Additionally, our previous studies in this population [10] detected differences in body condition (see KC blog for more details about how we measure whales) that suggest that changes in the whale’s body widths could be useful in detecting pregnancies.

Our exploratory analyses show that in individual whales, the levels of fecal progesterone were elevated when pregnant as compared to when the same whale was not pregnant. But when looking at progesterone levels at the population level, these differences were masked with the intrinsic variability of this measurement. In turn, the body morphometrics, in particular the body width at the 50% of the total body length, helped discriminate pregnancies better, and the statistical models that included this width variable, effectively classified pregnant from non-pregnant females with a commendable accuracy. Thus, our morphometric approach showcased its potential as a reliable alternative for pregnancy diagnosis.

Below, a comparison of body widths at 5% increments along total body length (from 20 % to 70 %) in female gray whales of known reproductive status from UAS-based photogrammetry (example photograph shown at top). Pregnant females (PF; in blue), presumed nonpregnant juvenile females (JF; yellow), and lactating females (LF; orange). Fernandez Ajó et al. 2023.

Notably, when we ran the pregnancy prediction models on data from our 2022 season and compared results with observations of whales in 2023, we identified a known whale from our study area “Clouds” accompanied by a calf, indicating that she was pregnant in 2022. Our model predicted Clouds to be pregnant with a 70% probability. This validation lends strong confidence to our approach to diagnosing pregnancy. Conversely, some whales predicted to be pregnant in 2022 were not observed with a calf during the 2023 season. However, the absence of calves accompanying these females is likely due to the relatively high mortality of newborn calves in gray whales due to predation or other causes [11].

Overall, our findings underscore some limitations of fecal progesterone metabolite in accurately identifying pregnant PCFG gray whales. However, while acknowledging the challenges associated with fecal sample collection and hormone analysis, we advocate for ongoing exploration of alternative hormone quantification methods and antibodies. Our study highlights the importance of continued research in refining these techniques. The unique attributes of our study system, including high individual re-sighting rates and non-invasive fecal hormone analysis, position it as a cornerstone for future advancements in understanding gray whale reproductive health. By improving our ability to monitor reproductive metrics in baleen whale populations, we pave the way for more effective conservation strategies, ensuring the resilience of these magnificent creatures in the face of a changing marine ecosystems.

Loading

References

[1] Burgess EA, Lanyon JM, Brown JL, Blyde D, Keeley T. 2012 Diagnosing pregnancy in free-ranging dugongs using fecal progesterone metabolite concentrations and body morphometrics: A population application. Gen Comp Endocrinol 177, 82–92. (doi:10.1016/J.YGCEN.2012.02.008)

[2] Slade NA, Tuljapurkar S, Caswell H. 1998 Structured-Population Models in Marine, Terrestrial, and Freshwater Systems. J Wildl Manage 62. (doi:10.2307/3802363)

[3] Madliger CL, Love OP, Hultine KR, Cooke SJ. 2018 The conservation physiology toolbox: status and opportunities. Conserv Physiol 6, 1–16. (doi:10.1093/conphys/coy029)

[4] Rice DW, Wolman AA. 1971 Life history and ecology of the gray whale (Eschrichtius robustus). Stillwater, Oklahoma: American Society of Mammalogists.

[5] Melicai V, Atkinson S, Calambokidis J, Lang A, Scordino J, Mueter F. 2021 Application of endocrine biomarkers to update information on reproductive physiology in gray whale (Eschrichtius robustus). PLoS One 16. (doi:10.1371/journal.pone.0255368)

[6] Calambokidis J, Darling JD, Deecke V, Gearin P, Gosho M, Megill W, et al. Abundance, range and movements of a feeding aggregation of gray whales (Eschrichtius robustus) from California to south-eastern Alaska in 1998. J Cetacean Res Manag 2002;4:267–76.

[7] Bronson, F. H. (1989). Mammalian reproductive biology. University of Chicago Press.

[8] Wasser SK, Hunt KE, Brown JL, Cooper K, Crockett CM, Bechert U, Millspaugh JJ, Larson S, Monfort SL (2000) A generalized fecal glucocorticoid assay for use in a diverse array of nondomestic mammalian and avian species. Gen Comp Endocrinol120:260–275.

[9] Hunt, K.E., Rolland, R.M., Kraus, S.D., Wasser, S.K., 2006. Analysis of fecal glucocorticoids in the North Atlantic right whale (Eubalaena glacialis). Gen. Comp. Endocrinol. 148, 260–272. https://doi.org/10.1016/j.ygcen.2006.03.01215.

[10] Soledade Lemos L, Burnett JD, Chandler TE, Sumich JL, Torres LG. 2020 Intra‐ and inter‐annual variation in gray whale body condition on a foraging ground. Ecosphere 11. (doi:10.1002/ecs2.3094)

[11] James L. Sumich, James T. Harvey, Juvenile Mortality in Gray Whales (Eschrichtius robustus), Journal of Mammalogy, Volume 67, Issue 1, 25 February 1986, Pages 179–182, https://doi.org/10.2307/1381019

A smaller sized gray whale: recent publication finds PCFG whales are smaller than ENP whales

Dr. KC Bierlich, Postdoctoral Scholar, OSU Department of Fisheries, Wildlife, & Conservation Sciences, Geospatial Ecology of Marine Megafauna (GEMM) Lab

A recent blog post by GEMM Lab’s PhD Candidate Clara Bird gave a recap of our 8th consecutive GRANITEfield season this year. In her blog, Clara highlighted that we saw 71 individual gray whales this season, 61 of which we have seen in previous years and identified as belonging to the Pacific Coast Feeding Group (PCFG). With an estimated population size of around 212 individuals, this means that we saw almost 1/3 of the PCFG population this season alone. Since the GEMM Lab first started collecting data on PCFG gray whales in 2016, we have collected drone imagery on over 120 individuals, which is over half the PCFG population. This dataset provides incredible opportunity to get to know these individuals and observe them from year to year as they grow and mature through different life history stages, such as producing a calf. A question our research team has been interested in is what makes a PCFG whale different from an Eastern North Pacific (ENP) gray whale, which has a population size around 16,000 individuals and feed predominantly in the Arctic during the summer months? For this blog, I will highlight findings from our recent publication in Biology Letters (Bierlich et al., 2023) comparing the morphology (body length, skull, and fluke size) between PCFG and ENP populations. 

Body size and shape reflect how an animal functions in their environment and can provide details on an individual’s current health, reproductive status, and energetic requirements. Understanding how animals grow is a key component for monitoring the health of populations and their vulnerability to climate change and other stressors in their environment.  As such, collecting accurate morphological measurements of individuals is essential to model growth and infer their health. Collecting such morphological measurements of whales is challenging, as you cannot ask a whale to hold still while you prepare the tape measure, but as discussed in a previous blog, drones provide a non-invasive method to collect body size measurements of whales. Photogrammetry is a non-invasive technique used to obtain morphological measurements of animals from photographs. The GEMM Lab uses drone-based photogrammetry to obtain morphological measurements of PCFG gray whales, such as their body length, skull length (as snout-to-blowhole), and fluke span (see Figure 1). 

Figure 1. Morphological measurements obtained via photogrammetry of a Pacific Coast Feeding Group (PCFG) gray whale. These measurements were used to compare to individuals from the Eastern North Pacific (ENP) population. 

As mentioned in this previous blog, we use photo-identification to identify unique individual gray whales based on markings on their body. This method is helpful for linking all the data we are collecting (morphology, hormones, behavior, new scarring and skin conditions, etc.) to each individual whale. An individual’s sightings history can also be used to estimate their age, either as a ‘minimum age’ based on the date of first sighting or a ‘known age’ if the individual was seen as a calf. By combining the length measurements from drone-based photogrammetry and age estimates from photo-identification history, we can construct length-at-age growth models to examine how PCFG gray whales grow. While no study has previously examined length-at-age growth models specifically for PCFG gray whales, another study constructed growth curves for ENP gray whales using body length and age estimates obtained from whaling, strandings, and aerial photogrammetry (Agbayani et al., 2020). For our study, we utilized these datasets and compared length-at-age growth, snout-to-blowhole length, and fluke span between PCFG and ENP whales. We used Bayesian statistics to account and incorporate the various levels of uncertainty associated with data collected (i.e., measurements from whaling vs. drone, ‘minimum age’ vs. ‘known age’). 

We found that while both populations grow at similar rates, PCFG gray whales reach smaller adult lengths than ENP. This difference was more extreme for females, where PCFG females were ~1 m (~3 ft) shorter than ENP females and PCFG males were ~0.5 m (1.5 ft) shorter than ENP males (Figure 2, Figure 3). We also found that ENP males and females have slightly larger skulls and flukes than PCFG male and females, respectively. Our results suggest PCFG whales are shaped differently than ENP whales (Figure 3)! These results are also interesting in light of our previous published study that found PCFG whales are skinnier than ENP whales (see this previous blog post). 

Figure 2. Growth curves (von Bertalanffy–Putter) for length-at-age comparing male and female ENP and PCFG gray whales (shading represents 95% highest posterior density intervals). Points represent mean length and median age. Vertical bars represent photogrammetric uncertainty. Dashed horizontal lines represent uncertainty in age estimates.

Figure 3. Schematic highlighting the differences in body size between Pacific Coast Feeding Group (PCFG) and Eastern North Pacific (ENP) gray whales. 

Our results raise some interesting questions regarding why PCFG are smaller: Is this difference in size and shape normal for this population and are they healthy? Or is this difference a sign that they are stressed, unhealthy and/or not getting enough to eat? Larger individuals are typically found at higher latitudes (this pattern is called Bergmann’s Rule), which could explain why ENP whales are larger since they feed in the Arctic. Yet many species, including fish, birds, reptiles, and mammals, have experienced reductions in body size due to changes in habitat and anthropogenic stressors (Gardner et al., 2011). The PCFG range is within closer proximity to major population centers compared to the ENP foraging grounds in the Arctic, which could plausibly cause increased stress levels, leading to decreased growth. 

The smaller morphology of PCFG may also be related to the different foraging tactics they employ on different prey and habitat types than ENP whales. Animal morphology is linked to behavior and habitat (see this blogpost). ENP whales feeding in the Arctic generally forage on benthic amphipods, while PCFG whales switch between benthic, epibenthic and planktonic prey, but mostly target epibenthic mysids. Within the PCFG range, gray whales often forage in rocky kelp beds close to shore in shallow water depths (approx. 10 m) that are on average four times shallower than whales feeding in the Arctic. The prey in the PCFG range is also found to be of equal or higher caloric value than prey in the Arctic range (see this blog), which is interesting since PCFG were found to be skinnier.

It is also unclear when the PCFG formed? ENP and PCFG whales are genetically similar, but photo-identification history reveals that calves born into the PCFG usually return to forage in this PCFG range, suggesting matrilineal site fidelity that contributes to the population structure. PCFG whales were first documented off our Oregon Coast in the 1970s (Figure 4). Though, from examining old whaling records, there may have been PCFG gray whales foraging off the coasts of Northern California to British Columbia since the 1920s.

Figure 4. First reports of summer-resident gray whales along the Oregon coast, likely part of the Pacific Coast Feeding Group. Capital Journal, August 9, 1976, pg. 2.

Altogether, our finding led us to two hypotheses: 1) the PCFG range provides an ecological opportunity for smaller whales to feed on a different prey type in a shallow environment, or 2) the PCFG range is an ecological trap, where individuals gain less energy due to energetically costly feeding behaviors in complex habitat while potentially targeting lower density prey, causing them to be skinnier and have decreased growth. Key questions remain for our research team regarding potential consequences of the smaller sized PCFG whales, such as does the smaller body size equate to reduced resilience to environmental and anthropogenic stressors? Does smaller size effect fecundity and population fitness? Stay tuned as we learn more about this unique and fascinating smaller sized gray whale. 

References

Agbayani, S., Fortune, S. M. E., & Trites, A. W. (2020). Growth and development of North Pacific gray whales (Eschrichtius robustus). Journal of Mammalogy101(3), 742–754. https://doi.org/10.1093/jmammal/gyaa028

Bierlich, K. C., Kane, A., Hildebrand, L., Bird, C. N., Fernandez Ajo, A., Stewart, J. D., Hewitt, J., Hildebrand, I., Sumich, J., & Torres, L. G. (2023). Downsized: gray whales using an alternative foraging ground have smaller morphology. Biology Letters19(8). https://doi.org/10.1098/rsbl.2023.0043

Gardner, J. L., Peters, A., Kearney, M. R., Joseph, L., & Heinsohn, R. (2011). Declining body size: A third universal response to warming? Trends in Ecology and Evolution26(6), 285–291. https://doi.org/10.1016/j.tree.2011.03.005

The whales keep coming and we keep learning: a wrap up of the eighth GRANITE field season.

Clara Bird, PhD Candidate, OSU Department of Fisheries, Wildlife, and Conservation Sciences, Geospatial Ecology of Marine Megafauna Lab

As you may remember, last year’s field season was a remarkable summer for our team. We were pleasantly surprised to find an increased number of whales in our study area compared to previous years and were even more excited that many of them were old friends. As we started this field season, we were all curious to know if this year would be a repeat. And it’s my pleasure to report that this season was even better!

We started the season with an exciting day (6 known whales! see Lisa’s blog) and the excitement (and whales) just kept coming. This season we saw 71 individual whales across 215 sightings! Of those 71, 44 were whales we saw last year, and 10 were new to our catalog, meaning that we saw 17 whales this season that we had not seen in at least two years! There is something extra special about seeing a whale we have not seen in a while because it means that they are still alive, and the sighting gives us valuable data to continue studying health and survival. Another cool note is that 7 of our 12 new whales from last year came back this year, indicating recruitment to our study region.

Included in that group of 7 whales are the two calves from last year! Again, indicating good recruitment of new whales to our study area. We saw both Lunita and Manta (previously nick-named ‘Roly-poly’) throughout this season and we were always happy to see them back in our area and feeding on their own.

Drone image of Lunita from 2023
Drone image of Manta from 2023

We had an especially remarkable encounter with Lunita at the end of this season when we found this whale surface feeding on porcelain crab larvae (video 1)! This is a behavior that we rarely observe, and we’ve never seen a juvenile whale use this behavior before, inspiring questions around how Lunita knew how to perform this behavior.

Not only did we resight our one-year-old friends, but we found two new calves born to well-known mature females (Clouds and Spotlight). We had previously documented Clouds with a calf (Cheetah) in 2016 so it was exciting to see her with a new calf and to meet Cheetah’s sibling! Cheetah has become one of our regulars so we’re curious to see if this new calf joins the regular crew as well. We’re also hoping that Spotlight’s calf will stick around; and we’re optimistic since we observed it feeding alone later in the season.

Collage of new calves from 2023! Left: Clouds and her calf, Center: Spotlight and her calf, Right: Spotlight’s calf independently foraging

Of course, 71 whales means heaps of data! We spent 226 hours on the water, conducted 132 drone flights (a record!), and collected 61 fecal samples! Those 132 flights were over 64 individual whales, with Casper and Pacman tying for “best whale to fly over” with 10 flights each. We collected 61 fecal samples from 26 individual whales with a three-way tie for “best pooper” between Hummingbird, Scarlett, and Zorro with 6 fecal samples each. And we continued to collect valuable prey and habitat data through 80 GoPro drops and 79 zooplankton net tows.

And if you were about to ask, “but what about tagging?!”, fear not! We continued our suction cup tagging effort with a successful window in July where we were joined by collaborators John Calambokidis from Cascadia Research Collective and Dave Cade from Hopkins Marine Station and deployed four suction-cup tags.

It’s hard to believe all the work we’ve accomplished in the past five months, and I continue to be honored and proud to be on this incredible team. But as this season has come to a close, I have found myself reflecting on something else. Learning. Over the past several years we have learned so much about not only these whales in our study system but about how to conduct field work. And while learning is continuous, this season in particular has felt like an exciting time for both. In the past year our group has published work showing that we can detect pregnancy in gray whales using fecal samples and drone imagery (Fernandez Ajó et al., 2023), that PCFG gray whales are shorter and smaller than ENP whales (Bierlich et al., 2023), and that gray whales are consuming high levels of microplastics (Torres et al., 2023). We also have several manuscripts in review focused on our behavior work from drones and tags. While this information does not directly affect our field work, it does mean that while we’re observing these whales live, we better understand what we’re observing and we can come up with more specific, in-depth questions based on this foundation of knowledge that we’re building. I have enjoyed seeing our questions evolve each year based on our increasing knowledge and I know that our collaborative, inquisitive chats on the boat will only continue inspiring more exciting research.

On top of our gray whale knowledge, we have also learned so much about field work. When I think back to the early days compared to now, there is a stark difference in our knowledge and our confidence. We do a lot on our little boat! And so many steps that we once relied on written lists to remember to do are now just engrained in our minds and bodies. From loading the boat, to setting up at the dock, to the go pro drops, fecal collections, drone operations, photo taking, and photo ID, our team has become quite the well-oiled machine. We were also given the opportunity to reflect on everything we’ve learned over the past years when it was our turn to train our new team member, Nat! Nat is a new PhD student in the GEMM lab who is joining team GRANITE. Teaching her all the ins and outs of our fieldwork really emphasized how much we ourselves have learned.

On a personal note, this was my third season as a drone pilot, and honestly, I was pleasantly surprised by my experience this season. Since I started piloting, I have experienced pretty intense nerves every time I’ve flown the drone. From stress dreams, to mild nausea, and an elevated heart rate, flying the drone was something that I didn’t necessarily look forward to. Don’t get me wrong – it’s incredibly valuable data and a privilege to watch the whales from a bird’s eye view in real time. But the responsibility of collecting good data, while keeping the drone and my team members safe was something that I felt viscerally. And while I gained confidence with every flight, the nerves were still as present as ever and I was starting to accept that I would never be totally comfortable as a pilot. Until this season, when the nerves finally cleared, and piloting became as innate as all the other field work components. While there are still some stressful moments, the nerves don’t come roaring back. I have finally gone through enough stressful situations to not be fazed by new ones. And while I am fully aware that this is just how learning works, I write this reflection as a reminder to myself and anyone going through the process of learning any new skill to push through that fear. Remember there can be a disconnect between the time when you know how to do something well, or well-enough, and the time when you feel comfortable doing it. I am just as proud of myself for persevering as I am of the team for collecting so much incredible data. And as I look ahead to my next scary challenge (finishing my PhD!), this is a feeling that I am trying to hold on to. 

Stay tuned for updates from team GRANITE!

Did you enjoy this blog? Want to learn more about marine life, research, and conservation? Subscribe to our blog and get a weekly alert when we make a new post! Just add your name into the subscribe box below!

Loading

References

Bierlich, K. C., Kane, A., Hildebrand, L., Bird, C. N., Fernandez Ajo, A., Stewart, J. D., Hewitt, J., Hildebrand, I., Sumich, J., & Torres, L. G. (2023). Downsized: Gray whales using an alternative foraging ground have smaller morphology. Biology Letters19(8), 20230043. https://doi.org/10.1098/rsbl.2023.0043

Fernandez Ajó, A., Pirotta, E., Bierlich, K. C., Hildebrand, L., Bird, C. N., Hunt, K. E., Buck, C. L., New, L., Dillon, D., & Torres, L. G. (2023). Assessment of a non-invasive approach to pregnancy diagnosis in gray whales through drone-based photogrammetry and faecal hormone analysis. Royal Society Open Science10(7), 230452. https://doi.org/10.1098/rsos.230452

Torres, L. G., Brander, S. M., Parker, J. I., Bloom, E. M., Norman, R., Van Brocklin, J. E., Lasdin, K. S., & Hildebrand, L. (2023). Zoop to poop: Assessment of microparticle loads in gray whale zooplankton prey and fecal matter reveal high daily consumption rates. Frontiers in Marine Science10. https://www.frontiersin.org/articles/10.3389/fmars.2023.1201078

Fantastic beasts and how to measure  them! 

Sagar Karki, Master’s student in the Computer Science Department at Oregon State University 

What beasts? Good question! We are talking about gray whales in this article but honestly we can tweak the system discussed in this blog a little and make it usable for other marine animals too.  

Understanding the morphology, such as body area and length, of wild animals and populations can provide important information on animal  behavior and health (check out postdoc Dr. KC Bierlich’s post on this topic). Since 2015, the GEMM Lab has been flying drones over whales to collect aerial imagery to allow for photogrammetric measurements to gain this important morphological data. This photogrammetry data has shed light on multiple important aspects of gray whale morphology, including the facts that the whales feeding off Oregon are skinnier [1] and shorter [2] than the gray whales that feed in the Arctic region.  But, these surprising conclusions overshadow the immense, time-consuming labor that takes place behind the scenes to move from aerial images to accurate measurements.  

To give you a sense of this laborious process, here is a quick run through of the methods: First the 10 to 15 minute videos must be carefully watched to select the perfect frames of a whale (flat and straight at the surface) for measurement. The selected frames from the drone imagery are then imported into MorphoMetriX, which is a custom software developed for photogrammetry measurement [1]. MorphoMetriX is an interactive application that allows an analyst to manually measure the length by clicking points along the centerline of the whale’s body. Based on this line, the whale is divided into a set of sections perpendicular to the centerline, these are used to then measure widths along the body. The analyst then clicks border points at the edge of the whale’s body to delineate the widths following the whale’s body curve. MorphoMetriX then generates a file containing the lengths and widths of the whale in pixels for each measured image. The length and widths of whales are converted from pixels to metric units using a software called CollatriX [4] and this software also calculates metrics of body condition from the length and width measurements. 

While MorphoMetriX [3] and CollatriX [4] are both excellent platforms to facilitate these photogrammetry measurements, each measurement takes time, a keen eye, and attention to detail. Plus, if you mess up one step, such as an incorrect length or width measurement, you have to start from the first step. This process is a bottleneck in the process of obtaining important morphology data on animals. Can we speed this process up and still obtain reliable data? 

What if we can apply automation using computer vision to extract the frames we need and automatically obtain measurements that are as accurate as humans can obtain? Sounds pretty nice, huh? This is where I come into the picture. I am a Master’s student in the Computer Science Department at OSU, so I lack a solid background in marine science, but bring to the table my skills as a computer programmer. For my master’s project, I have been working in the GEMM Lab for the past year to develop automated methods to obtain accurate photogrammetry measurements of whales.  

We are not the first group to attempt to use computers and AI to speed up and improve the identification and detection of whales and dolphins in imagery. Researchers have used deep learning networks to speed up the time-intensive and precise process of photo-identification of  individual whales and dolphins [5], allowing us to more quickly determine animal location, movements and abundance. Millions of satellite images of the earth’s surface are collected daily and scientists are attempting to utilize these images to  benefit marine life by studying patterns of species occurrence, including detection of gray whales in satellite images using deep learning [6]. There has also been success using computer vision to identify whale species and segment out the body area of the whales  from drone imagery [7]. This process involves extracting segmentation masks of the whale’s body followed by length extraction from the mask. All this previous research shows promise for the application of computer vision and AI to assist with animal research and conservation. As discussed earlier, the automation of image extraction and photogrammetric measurement  from drone videos will help researchers collect vital data more quickly so that decisions that impact  the health of whales can be more responsive and effective.For instance,  photogrammetry data extracted from drone images can diagnose pregnancy of the whales [8], thus automation of this information could speed up our ability to understand population trends. 

Computer vision and natural language processing fields are growing exponentially. There are new foundation models like ChatGPT that can do most of the natural language understanding and processing tasks. Foundational models are also emerging for computer vision tasks, such as “the segment anything model” from Meta. Using these foundation models along with other existing research work in computer vision, we have developed and deployed a system that automates the manual and computational tasks of MorphoMetriX and CollatriX systems.  

This system is currently in its testing and monitoring phase, but we are rapidly moving toward a publication to disseminate all the tools developed, so stay tuned for the research paper that will explain in detail the methodologies followed on data processing, model training and test results. The following images give a sneak peak of results. Each image  illustrates a frame from a drone video that was  identified and extracted through automation, followed by another automation process that identified important points along the whale’s body and curvature.  The user interface of the system aims to make the user experience intuitive and easy to follow. The deployment is carefully designed to run on different hardwares, with easy monitoring and update options using the latest open source frameworks. The user has to do just two things. First, select the videos for analysis. The system then generates potential frames for photogrammetric analysis (you don’t need to watch 15 mins of drone footage!). Second, the user selects the frame of choice for photogrammetric analysis and waits for the system to give you measurements. Simple! Our goal is for these softwares to be a massive time-saver while  still providing vital, accurate body measurements  to the researchers in record time. Furthermore, an advantage of this approach is that researchers can follow the methods in our to-be-soon-published research paper to make  a few adjustments enabling the software to measure other marine species, thus expanding the impact of this work to many other life forms.  

Did you enjoy this blog? Want to learn more about marine life, research, and conservation? Subscribe to our blog and get a weekly message when we post a new blog. Just add your name and email into the subscribe box below.

Loading

References 

  1. Torres LG, Bird CN, Rodríguez-González F, Christiansen F, Bejder L, Lemos L, Urban R J, Swartz S, Willoughby A, Hewitt J, Bierlich K (2022) Range-Wide Comparison of Gray Whale Body Condition Reveals Contrasting Sub-Population Health Characteristics and Vulnerability to Environmental Change. Front Mar Sci 910.3389/fmars.2022.867258 
  1. Bierlich KC, Kane A, Hildebrand L, Bird CN, Fernandez Ajo A, Stewart JD, Hewitt J, Hildebrand I, Sumich J, Torres LG (2023) Downsized: gray whales using an alternative foraging ground have smaller morphology. Biol Letters 19:20230043 doi:10.1098/rsbl.2023.0043 
  1. Torres et al., (2020). MorphoMetriX: a photogrammetric measurement GUI for morphometric analysis of megafauna. Journal of Open Source Software, 5(45), 1825, https://doi.org/10.21105/joss.01825 
  1. Bird et al., (2020). CollatriX: A GUI to collate MorphoMetriX outputs. Journal of Open Source Software, 5(51), 2328, https://doi.org/10.21105/joss.02328 
  1. Patton, P. T., Cheeseman, T., Abe, K., Yamaguchi, T., Reade, W., Southerland, K., Howard, A., Oleson, E. M., Allen, J. B., Ashe, E., Athayde, A., Baird, R. W., Basran, C., Cabrera, E., Calambokidis, J., Cardoso, J., Carroll, E. L., Cesario, A., Cheney, B. J. … Bejder, L. (2023). A deep learning approach to photo–identification demonstrates high performance on two dozen cetacean species. Methods in Ecology and Evolution, 00, 1–15. https://doi.org/10.1111/2041-210X.14167 
  1. Green, K.M., Virdee, M.K., Cubaynes, H.C., Aviles-Rivero, A.I., Fretwell, P.T., Gray, P.C., Johnston, D.W., Schönlieb, C.-B., Torres, L.G. and Jackson, J.A. (2023), Gray whale detection in satellite imagery using deep learning. Remote Sens Ecol Conserv. https://doi.org/10.1002/rse2.352 
  1. Gray, PC, Bierlich, KC, Mantell, SA, Friedlaender, AS, Goldbogen, JA, Johnston, DW. Drones and convolutional neural networks facilitate automated and accurate cetacean species identification and photogrammetry. Methods Ecol Evol. 2019; 10: 1490–1500. https://doi.org/10.1111/2041-210X.13246 
  1. Fernandez Ajó A, Pirotta E, Bierlich KC, Hildebrand L, Bird CN, Hunt KE, Buck CL, New L, Dillon D, Torres LG (2023) Assessment of a non-invasive approach to pregnancy diagnosis in gray whales through drone-based photogrammetry and faecal hormone analysis. Royal Society Open Science 10:230452 

A Journey From Microbiology to Macrobiology

Mariam Alsaid, University of California Berkeley, GEMM Lab REU Intern

My name is Mariam Alsaid and I am currently a 5th year undergraduate transfer student at the University of California, Berkeley. Growing up on the small island of Bahrain, I was always minutes away from the water and was enraptured by the creatures that lie beneath the surface. Despite my long-standing interest in marine science, I never had the opportunity to explore it until just a few months ago. My professional background up until this point was predominantly in soil microbiology through my work with Lawrence Berkeley National Laboratory, and I was anxious about how I would switch directions and finally be able to pursue my main passion. For this reason, I was thrilled by my acceptance into the OSU Hatfield Marine Science Center’s REU program this year, which led to my exciting collaboration with the GEMM Lab. It was kind of a silly transition to go from studying bacteria, one of the smallest organisms on earth, to whales, who are the largest.

My project this summer focused on sei whale acoustic occurrence off the coast of Oregon. “What’s a sei whale?” is a question I heard a lot throughout the summer and is one that I had to Google myself several times before starting my internship. Believe it or not, sei whales are the third largest rorqual in the world but don’t get much publicity because of their small population sizes and secretive behavior. The commercial whaling industry of the 19th and 20th centuries did a number on sei whale populations globally, rendering them endangered. In consequence, little research has been conducted on their global range, habitat use, and behavior since the ban of commercial whaling in 1986 (Nieukirk et al. 2020). Additionally, sei whales are relatively challenging to study because of their physical similarities to the fin whale, and acoustic similarities to other rorqual vocalizations, most notably blue whale D-calls and fin whale 40 Hz calls. As of today, published literature indicates that sei whale acoustic presence in the Pacific Ocean is restricted to Antarctica, Chile, Hawaii, and possibly British Columbia, Canada (Mcdonald et al. 2005; Espanol-Jiminez et al. 2019; Rankin and Barlow, 2012; Burnham et al. 2019). The idea behind this research project was sparked by sparse visual sightings of sei whales by research cruises conducted by the Marine Mammal Institute (MMI) in recent years (Figure 1). This raised questions about if sei whales are really present in Oregon waters (and not just misidentified fin whales) and if so, how often?

Figure 1. Map of sei whale visual sightings off the coast of Oregon, colored by MMI Lab research cruise, and the location of the hydrophone at NH45 (white star).

A hydrophone, which is a fancy piece of equipment that records continuous underwater sound, was deployed 45 miles offshore of Newport, OR between October of 2021 and December of 2022. My role this summer was to use this acoustic data to determine whether sei whales are hanging out in Oregon or not. Acoustic data was analyzed using the software Raven Pro, which allowed me to visualize sound in the form of spectrograms (Fig. 2). From there, my task was to select signals that could potentially be sei whale calls. It was a hurdle familiarizing myself with sei whale vocalizations while also keeping in mind that other species (e.g., blue and fin whales) may produce similar sounding (and looking in the spectrograms) calls. For this reason, I decided to establish confidence levels based on published sei whale acoustic research that would help me classify calls with less bias. Vocalizations produced by sei whales are characterized by low frequency, broadband, downsweeps. Sei whales can be acoustically distinguished from other whales because of their tendency to produce uniform groups of calls (typically in doublets and triplets) in a short timeframe. This key finding allowed me to navigate the acoustic data with more ease.

The majority of the summer was spent slowly scanning through the months of data at 5-minute increments. As you can imagine, excitement varied by day. Some days I would find insanely clear signals of blue, fin, and humpback whales and other days I would find nothing. The major discovery and the light at the end of the tunnel was the SEI WHALES!!! I detected numerous high quality sei whale calls throughout the study period with peaks in October and November (but a significantly higher peak in occurrence in 2022 versus 2021). I also encountered a unique vocalization type in fall of 2022, consisting of a very long series of repeated calls that we called “multiplet”, rather than doublets or triplets that is more typical of sei whales (Fig. 3). Lastly, I found no significant diel pattern in sei whale vocalization, indicating that these animals call at any hour of the day. More research needs to go into this project to better estimate sei whale occurrence and understand their behavior in Oregon but this preliminary work provides a great baseline into what sei whales sound like in this part of the world. In the future, the GEMM lab intends on implementing more hydrophone data and work on developing an automated detection system that would identify sei whale calls automatically.

Figure 2. Spectrogram of typical sei whale calls detected in acoustic data
Figure 3. Spectrogram of unique sei whale multiplet call type
Figure 4. My first time conducting fieldwork! I spent a few mornings assisting Dr. Rachel Orben’s group in surveying murre and cormorant nests (thanks to my good friend Jacque McKay :))

My experience this summer was so formative for me. As someone who has been an aspiring marine biologist for so long, I am so grateful for my experience working with the GEMM Lab alongside incredible scientists who are equally passionate about studying the mysteries of the ocean. This experience has also piqued my interest in bioacoustics and I plan on searching for other opportunities to explore the field in the future. Aside from growing professionally, I learned that I am more capable of tackling and overcoming obstacles than I had thought. I was afraid of entering a field that I knew so little about and was worried about failing and not fitting in. My anxieties were overshadowed by the welcoming atmosphere at Hatfield and I could not have asked for better people to work with. As I was searching for sei whale calls this summer, I suppose that I was also unintentionally searching for my voice as a young scientist in a great, blue field.

Figure 5. My mentor, Dr. Dawn Barlow, and I with my research poster at the Hatfield Marine Science Center Coastal Intern Symposium

Did you enjoy this blog? Want to learn more about marine life, research, and conservation? Subscribe to our blog and get a weekly alert when we make a new post! Just add your name into the subscribe box below!

Loading

References:

Nieukirk, S. L., Mellinger, D. K., Dziak, R. P., Matsumoto, H., & Klinck, H. (2020). Multi-year occurrence of sei whale calls in North Atlantic polar waters. The Journal of the Acoustical Society of America, 147(3), 1842–1850. https://doi.org/10.1121/10.0000931

McDonald, M. A., Calambokidis, J., Teranishi, A. M., & Hildebrand, J. A. (2001). The acoustic calls of blue whales off California with gender data. The Journal of the Acoustical Society of America, 109(4), 1728–1735. https://doi.org/10.1121/1.1353593

Español-Jiménez, S., Bahamonde, P. A., Chiang, G., & Häussermann, V. (2019). Discovering sounds in Patagonia: Characterizing sei whale (<i>Balaenoptera borealis</i>) downsweeps in the south-eastern Pacific Ocean. Ocean Science, 15(1), 75–82. https://doi.org/10.5194/os-15-75-2019

Rankin, S., & Barlow, J. (2007). VOCALIZATIONS OF THE SEI WHALE BALAENOPTERA BOREALIS OFF THE HAWAIIAN ISLANDS. Bioacoustics, 16(2), 137–145. https://doi.org/10.1080/09524622.2007.9753572

Burnham, R. E., Duffus, D. A., & Mouy, X. (2019). The presence of large whale species in Clayoquot Sound and its offshore waters. Continental Shelf Research, 177, 15–23. https://doi.org/10.1016/j.csr.2019.03.004

That’s so Real: Adult Beginners, Serial Podcast(s), and a whole lotta of Baja Gray Whale Video Analysis.

Celest Sorrentino, Research Technician, Geospatial Ecology of Marine Megafauna Lab

Hello again GEMM Lab family. I write to you exactly a year after (okay maybe 361 days after but who’s counting…) from my previous blog post describing my 2022 summer working in the GEMM Lab as an NSF REU intern. Since then, so much has changed, and I can’t wait to fill you in on it.

In June I walked across the commencement stage at UC Santa Barbara, earning my BS in Ecology, Evolution, and Marine Biology and my minor in Italian language. A week later, I packed my bags and headed straight back to the lukewarm beaches of Newport, Oregon as a Research Technician in the GEMM Lab. I am incredibly fortunate to have been invited back to the OSU Marine Mammal Institute to lend a hand analyzing drone footage of gray whales collected back in March 2023 when Leigh and Clara went down to Baja California, as mentioned previously in Clara’s blog

Fig. 1. View from the top! (of the bridge at Yaquina Bay Bridge in Newport, OR)

During my first meeting with Clara at the beginning of the summer we discussed that a primary goal of my position was to process all the drone footage collected in Baja so that the generated video clips could be later used in other analytical software such as BORIS and SLEAP A.I. Given my previous internships and past summer project, this video processing is familiar to me. My initial thoughts were:

Sweet! Watch drone footage, pop in some podcasts, note down when I see whales, let’s do this!*

Like any overly eager 23-year-old, I might have mentally cracked open a Celsius and kicked my feet up too soon. We added another layer to the goal: develop an ethogram – which requires me to identify and define the behaviors that the gray whales appear to be demonstrating within the videos (more on ethogram development in Clara’s previous blog.) This made me nervous. 

I don’t have any experience with behavior. How do I tell what is a real behavior or if the whale is just existing? What if I’m wrong and ruin the project? What if I totally mess this up?

Naturally, as any sane person, to resolve these thoughts I took to the Reddit search bar: “How to do a job you’ve never done before.” No dice. 

I pushed these thoughts aside and decided to just start the video analysis process. Clara provided me with the ethogram she is developing during her PhD as a point of reference (based on the published gray whale ethogram in Torres et al. 2018), I was surrounded by an insanely supportive lab, and I could Google anything at my fingertips. Fast-forward 6 weeks later: I had analyzed 128 drone videos of adult gray whales as well as mother-calf pairs, and developed an ethogram describing, 26 behaviors**. I named one of my favorite behaviors  a “Twirl” to describe when a gray whale lifts their head out of the water and performs a 360 turn. Reminds me of times when as a kid, sometimes all you really needed is a good spin!

Now I was ready to start a productive, open conversation with Leigh and Clara about this ethogram and my work. However, even walking up to that last meeting, remnants of those daunting, doubtful early summer thoughts persisted. Even after I double checked all the definitions I wrote, rewatched all videos with said behaviors, and had something to show for my work. What gives Brain?

A few days ago, as I sat on my family’s living room couch with my two younger sisters, Baylie and Cassey, Baylie wanted to watch some TikToks with me. One video that came up was of a group of adults taking a beginner dance class, having so much fun and radiating joy. The caption read, Being a beginner as an adult is such a fun and wild thing. Baylie and I watched the video at least 10x, repeating to each other phrases like, “Wow!” and “They’re so cool.” That caption and video has been on my mind since: 

Being a beginner as an adult is such a fun and wild thing.

Being a beginner as an adult is also scary. 

Having just graduated, I can no longer say I am undergraduate student. Now, I am a young adult. This was my first research technician job, as an adult. Don’t adults usually have everything figured out? Can adults be beginners too?

Yes. In fact, we’re beginners more than we realize. 

  • I was a beginner cooking my mother’s turkey recipe 3 years ago for my housemates during the pandemic (Even after having her on Facetime, I still managed to broil it a little too long.) 
  • I was a beginner driver 5 years ago in a rickety Jeep driving myself to school (Now, since I’ve been back home, I’ve been driving my little sisters to school.)
  • I was a beginner NSF REU intern just a year ago. (This summer I was the alumni on the panel for the current NSF REU interns at Hatfield.)
  • I was a beginner science communicator presenting my NSF REU project at Hatfield last summer. (This summer, I presented my research at the Animal Behavior Society Conference.) 
Fig 2A. Group Pic with the LABIRINTO Lab and GEMM Lab at the ABS Portland Conference!
Fig 2B. Clara Bird (left), Dr. Leigh Torres (middle), and I (right) at the ABS Portland Conference. 

I now recognize that during my time identifying and defining behaviors of gray whales in videos made me take on the seat of a “beginner video and behavioral analyst”. I could not rely on the automated computer vision lens I gained from previous internships, which felt familiar and secure. 

 Instead, I had to allow myself to be creative. Dig into the unfamiliar in an effort to complete a task or job I had never done before. Allowing myself to be imperfect, make mistakes, meanwhile unconsciously building a new skill. 

This is what makes being a beginner as an adult such a fun thing. 

I don’t think being a beginner is a wild thing, although it can definitely make you feel a wild range of emotions. Being a beginner means you’re allowing yourself to try something new. Being a beginner means you’re allowing yourself the chance to learn.

Whether you’re an adult beginner as you enter your 30s, adult beginner as you enter parenthood, adult beginner grabbing a drink with friends after a long day in lab, adult beginner as a dancer, or like me, a beginner of leaving behind my college student persona and entering a new identity of adulthood, being a beginner as an adult is such a fun and normal thing.

I am not sure what will be next, but I hope to write to you all again from this blog a year from now, as an adult beginner as a grad student in the GEMM Lab. For anyone approaching the question of “What’s next”, I encourage you to read “Never a straight Path” by GEMM Lab MSc alum Florence Sullivan, a blog that has brought me such solace in my new adult journey and advice that never gets old.

Being a beginner—that, is so real. 

Fig 3A. Kayaking as an adult beginner of the Port Orford Field Team!
Fig 3B “See you soon:” Wolftree evenings with the lab.
Fig 3C. GEMM Lab first BeReal!

*I listened to way too many podcasts to list them all, but I will include two that have been a GEMM Lab “gem” —-thanks to Lisa and Clara for looping me in and now, looping you in!)

**(subject to change)

References

Torres LG, Nieukirk SL, Lemos L, Chandler TE (2018) Drone Up! Quantifying Whale Behavior From a New Perspective Improves Observational Capacity. Front Mar Sci 510.3389/fmars.2018.00319

Did you enjoy this blog? Want to learn more about marine life, research, and conservation? Subscribe to our blog and get a weekly message when we post a new blog. Just add your name and email into the subscribe box below.

Loading

Exploring the Western Antarctic Peninsula  

By Abby Tomita, undergraduate student, OSU College of Earth, Ocean, and Atmospheric Sciences, research intern in the GEMM and Krill Seeker Labs

This February, during the winter term of my third year at Oregon State, I was presented with a once-in-a-lifetime opportunity. After spending the last year studying the zooplankton krill as part of Project OPAL, I was invited to spend the austral winter season doing research on Antarctic krill (Euphausia superba) under supervision of experts Dr. Kim Bernard and PhD student Rachel Kaplan. Additionally, we were lucky enough to participate in two research cruises along the Western Antarctic Peninsula (WAP). 

Figure 1. Sailing into the sunset on the RV Laurence M. Gould.

Unsurprisingly, it is no easy feat getting to the bottom of the world. After an incredibly thorough physical qualification process and two days of air travel from Portland, Oregon, we reached the lovely city of Punta Arenas, Chile. It was such a relief to arrive – but we were only halfway there. The next portion of our trip was the one that I was most anxious about, especially as someone who is prone to seasickness: crossing the Drake Passage. This stretch of the ocean, from the southernmost tip of South America to the Antarctic Peninsula, is notoriously treacherous as water in this area circulates the globe completely unobstructed by land masses. I soon learned the value of scopolamine patches and nausea bracelets, which helped me immensely through this five day journey. From Punta Arenas, we boarded the RV Laurence M. Gould, along with a seal research team from the University of North Carolina Wilmington. They were headed down south to look for crabeater seals to better understand not only their physiology, but also their role in the trophic ecology of the WAP. 

The Passage was rough, but not as terrible as I expected. The hype around it made me think I’d be faced with something as menacing as the giant wave from The Perfect Storm, and while the rocking and rolling of the ship was far from pleasant, my nausea aids, as well as the amazing people and vast selection of movies on board made it manageable. Despite being extremely nervous for the Passage, I was also very excited to celebrate my twenty-first birthday during it. It was a memorable, although untraditional birthday experience that was made all the more special by my friends on the ship who took the time to celebrate the day as best as we could. 

Figure 2. Taking in the sights of the Neumayer Channel with Kim!

The morning that we reached the Bransfield Strait was something truly unforgettable. Up until that point, I knew our destination was Antarctica, but I couldn’t really wrap my head around it because it was such a distant place and concept to me. I remember walking out onto the starboard side of the second level deck and seeing huge mountains out in the distance. For some reason, I had never considered how massively tall the mountains of the peninsula are, and just the fact that there were mountains down here at all. I joined the others at the bow, where we stood for hours in awe at the first land we had seen in days. Though many of the other scientists and crew members on board had been to this icy continent before, this was my first time, and I was in a state of disbelief. We’d finally made it and it sunk into me that I was in Antarctica, and that I would be here for the next five and half months.

After a day of hiding from strong winds in the Neumayer Channel, we were able to dock at Palmer Station (the smallest of the three US research bases in Antarctica) for our first port call, and seeing Palmer for the first time was just as exciting as seeing the continent. It looked so small at first, especially with the glacier and mountains looming behind it. Once the ship was tied up, orientation began. The station manager came onto the ship to give us an overview of what we could expect on station and the general Palmer etiquette. Next, we were given a tour of the facilities, from the lab spaces and aquarium room, up through the galley/dining area, past the hot tub and sauna, and into the lounge and bar in the GWR (Garage, Warehouse, and Recreation) building. I was surprised at how cozy the station was on the inside. In pictures, the buildings’ exteriors looked similar to the outside of a metal shipping container, but the inside was welcoming and warm. Those of us staying on station then sat through several hours of a more detailed orientation that somehow wore us out despite sitting in comfy recliner sofas the whole time. After sleeping on the rocking ship for about a week, I had some of the best sleep of my life that first night at Palmer Station.

Figure 3. Arriving at the Palmer Station pier in the first morning light.

Our first research cruise started a few days after arriving at Palmer, and just like that, we were off to explore the Southern Ocean. This leg of the trip took us south, down to Marguerite Bay and the region of Alexander Island, for ten days. The views were just spectacular everywhere we went, and it was so humbling to step out onto the deck to see gigantic mountains all around the ship. By day, us “krillers”, as our team is known, camped out on the bridge of the ship with the seal team, where we looked for sea ice floes with lounging crabeater seals. By night we conducted CTD casts, filtered water for chlorophyll, and deployed nets to catch our favorite tiny crustacean critters, along with any other zooplankton in our track. Unfortunately for both our group and the seal team, many areas that we visited were not frequented by krill or crabeater seals, though the seal team did successfully study and tag one seal over the course of the first cruise. 

Figure 4. Rachel (right) and I (left) filtering water for chlorophyll on the LMG. 

One of the highlights of this leg of the cruise was our Crossing Ceremony, as we’d crossed the Antarctic Circle (approximately 66.5ºS) shortly after leaving Palmer station. Myself and six others were crossing for the first time, so to earn our “Red Noses”, we had to pay tribute to King Neptune and his court. It would not be a Crossing Ceremony without at least some light pranking, so when they brought us out individually to the main deck, I knew something was coming our way.

Figure 5. Taking a celebratory picture with King Neptune’s court…with a surprise after.

The ten days flew by, and when we arrived back on station, we had less than a week to prepare for our next excursion on the LMG, which would be fifteen days. The time back at Palmer went quickly as we organized our lab space and entered data from the first cruise. The ship came back once more and we were off, this time heading north along the Peninsula to the Gerlache Strait. The sights were as breathtaking as ever, and I was excited to be back with my friends from the ship. 

Figure 6. Kim (left) and I (right) pour krill we caught into an XACTIC tank.

Our first day of transit was through the Lemaire Channel, one of the most stunning areas that we passed through (check out the photo gallery at the end of this post!). We spent the majority of the day on the bow and the deck of the bridge taking in the beautiful towering mountains on either side of the narrow channel and watching for penguins and humpbacks, of which there were many. This voyage segued into an extremely productive night of science for us where we caught thousands of krill that we were able to keep live in tanks on the ship, in preparation for later use for our experiments on station. Our first productive night of science was auspicious for the rest of the cruise as we caught and processed thousands more krill, and the seal team had a much more fruitful experience finding crabeater seals (they found/worked on 8 seals and named them all after fruits!). The highlight of this second cruise for me was getting to accompany the seal team onto an ice floe in the Lemaire Channel to assist them in their work on the crabeater, a female juvenile who they named Mango!

Figure 7. Watching Mango’s nose to calculate and record her breaths per minute (US NMSF Permit #25770).

Returning to Palmer for the final time on the LMG was just as exciting as arriving the first time, especially with the knowledge that we’d have one last night of celebration with our friends from the ship at the Cross Town Dinner – a night to celebrate the solstice with both the Palmer crew and LMG crew. Although the dinner and subsequent party were a blast, I felt a lingering sadness knowing that the majority of the people I spent almost two months with would be heading north, back to their respective homes while Kim, Rachel, and I stayed at Palmer for the next few months. The next day, after saying our goodbyes, the three of us stood on the Palmer pier with tears streaming down our faces, waving frantically at the ship to our friends on the deck. In spite of my sadness, I knew that the coming months would be a thrilling series of new experiences in one of the most magical and special places that I have ever had the pleasure of being in. 

Figure 8. The LMG departs Palmer Station for the last time this winter! 

Loading

Familiar flukes and flanks: The 9th GRANITE field season is underway

By Lisa Hildebrand, PhD student, OSU Department of Fisheries, Wildlife, & Conservation Sciences, Geospatial Ecology of Marine Megafauna Lab

The winds are consistently (and sometimes aggressively) blowing from the north here on the Oregon coast, which can only mean one thing – summer has arrived! Since mid-May, the GRANITE (Gray whale Response to Ambient Noise Informed by Technology and Ecology) team has been looking for good weather windows to survey for gray whales and we have managed to get five great field work days already. In today’s blog post, I am going to share what (and who) we have seen so far.

On our first day of the field season, PI Leigh Torres, postdoc KC Bierlich and myself, were joined by a special guest: Dr. Andy Read. Andy is the director of the Duke University Marine Lab, where he also runs his own lab, which focuses on conservation biology and ecology of marine vertebrates. Andy was visiting the Hatfield Marine Science Center as part of the Lavern Weber Visiting Scientist program and was hosted here by Leigh. For those of you that do not know, Andy was Leigh’s graduate school advisor at Duke where she completed her Master’s and doctoral degrees. It felt very special to have Andy on board our RHIB Ruby for the day and to introduce him to some friends of ours. The first whale we encountered that day was “Pacman”. While we are always excited to re-sight an individual that we know, this sighting was especially mind-blowing given the fact that Leigh had “just” seen Pacman approximately two months earlier in Guerrero Negro, one of the gray whale breeding lagoons in Mexico (read this blog about Leigh and Clara’s pilot project there). Aside from Pacman, we saw five other individuals, all of which we had seen during last year’s field season. 

The first day of field work for the 2023 GRANITE field season! From left to right: Leigh Torres, Lisa Hildebrand, Andy Read, and KC Bierlich. Source: L. Torres.

Since that first day on the water, we have conducted field work on four additional days and so far, we have only encountered known individuals in our catalog. This fact is exciting because it highlights the strong site fidelity that Pacific Coast Feeding Group (PCFG) gray whales have to areas within their feeding range. In fact, I am examining the residency and space use of each individual whale we have observed in our GRANITE study for one of my PhD chapters to better understand the level of fidelity individuals have to the central Oregon coast. Furthermore, this site fidelity underpins the unique, replicate data set on individual gray whale health and ecology that the GRANITE project has been able to progressively build over the years. So far during this field season in 2023, we have seen 13 unique individuals, flown the drone over 10 of them and collected four fecal samples from two, which represent critical data points from early on in the feeding season.

Our sightings this year have not only highlighted the high site fidelity of whales to our study area but have also demonstrated the potential for internal recruitment of calves born to “PCFG mothers” into the PCFG. Recruitment to a population can occur in two ways: externally (individuals immigrate into a population from another population) or internally (calves born to females that are part of the population return to, or stay, within their mothers’ population). Three of the whales we have seen so far this year are documented calves from females that are known to consistently use the PCFG range, including our central Oregon coast study area. In fact, we documented one of these calves, “Lunita”, just last year with her mother (see Clara’s recap of the 2022 field season blog for more about Lunita). The average calf survival estimate between 1997-2017 for the PCFG was 0.55 (Calambokidis et al. 2019), though it varied annually and widely (range: 0.34-0.94). Considering that there have been years with calf survival estimates as low as ~30%, it is therefore all the more exciting when we re-sight a documented calf, alive and well!

“Lunita”, an example of successful internal recruitment

We have also been collecting data on the habitat and prey in our study system by deploying our paired GoPro/RBR sensor system. We use the GoPro to monitor the benthic substrate type and relative prey densities in areas where whales are feeding. The RBR sensor collects high-frequency, in-situ dissolved oxygen and temperature data, enabling us to relate environmental metrics to relative prey measurements. Furthermore, we also collect zooplankton samples with a net to assess prey community and quality. On our five field work days this year, we have predominantly collected mysid shrimp, including gravid (a.k.a. pregnant) individuals, however we have also caught some Dungeness and porcelain crab larvae. The GEMM Lab is also continuing our collaboration with Dr. Susanne Brander’s lab at OSU and her PhD student Lauren Kashiwabara, who plan on conducting microplastic lab experiments on wild-caught mysid shrimp. Their plan is to investigate the growth rates of mysid shrimp under different temperature, dissolved oxygen, and microplastic load conditions. However, before they can begin their experiments, they need to successfully culture the mysids in the lab, which is why we collect samples for them to use as their ‘starter culture’. Stay tuned to hear more about this project as it develops!

So, all in all, it has been an incredibly successful start to our field season, marked by the return of many familiar flukes and flanks! We are excited to continue collecting rock solid GRANITE data this summer to increase our efforts to understand gray whale ecology and physiology. 

Loading

References

Calambokidis, J., Laake, J., and Perez, A. (2019). Updated analyses of abundance and population structure of seasonal gray whales in the Pacific Northwest, 1996-2017. IWC, SC/A17/GW/05 for the Workshop on the Status of North Pacific Gray Whales. La Jolla: IWC.