Marine megafauna as ecosystem sentinels: What animals can tell us about changing oceans

By Dawn Barlow1 and Will Kennerley2

1PhD Candidate, OSU Department of Fisheries, Wildlife, and Conservation Sciences, Geospatial Ecology of Marine Megafauna Lab

2MS Student, OSU Department of Fisheries, Wildlife, and Conservation Sciences, Seabird Oceanography Lab

The marine environment is dynamic, and mobile animals must respond to the patchy and ephemeral availability of resource in order to make a living (Hyrenbach et al. 2000). Climate change is making ocean ecosystems increasingly unstable, yet these novel conditions can be difficult to document given the vast depth and remoteness of most ocean locations. Marine megafauna species such as marine mammals and seabirds integrate ecological processes that are often difficult to observe directly, by shifting patterns in their distribution, behavior, physiology, and life history in response to changes in their environment (Croll et al. 1998, Hazen et al. 2019). These mobile marine animals now face additional challenges as rising temperatures due to global climate change impact marine ecosystems worldwide (Hazen et al. 2013, Sydeman et al. 2015, Silber et al. 2017, Becker et al. 2019). Given their mobility, visibility, and integration of ocean processes across spatial and temporal scales, these marine predator species have earned the reputation as effective ecosystem sentinels. As sentinels, they have the capacity to shed light on ecosystem function, identify risks to human health, and even predict future changes (Hazen et al. 2019). So, let’s explore a few examples of how studying marine megafauna has revealed important new insights, pointing toward the importance of monitoring these sentinels in a rapidly changing ocean.

Cairns (1988) is often credited as first promoting seabirds as ecosystem sentinels and noted several key reasons why they were perfect for this role: (1) Seabirds are abundant, wide-ranging, and conspicuous, (2) although they feed at sea, they must return to land to nest, allowing easier observation and quantification of demographic responses, often at a fraction of the cost of traditional, ship-based oceanographic surveys, and therefore (3) parameters such as seabird reproductive success or activity budgets may respond to changing environmental conditions and provide researchers with metrics by which to assess the current state of that ecosystem.

The unprecedented 2014-2016 North Pacific marine heatwave (“the Blob”) caused extreme ecosystem disruption over an immense swath of the ocean (Cavole et al. 2016). Seabirds offered an effective and morbid indication of the scale of this disruption: Common murres (Uria aalge), an abundant and widespread fish-eating seabird, experienced widespread breeding failure across the North Pacific. Poor reproductive performance suggested that there may have been fewer small forage fish around and that these changes occurred at a large geographic scale. The Blob reached such an extreme as to kill immense numbers of adult birds, which professional and community scientists found washed up on beach-surveys; researchers estimate that an incredible 1,200,000 murres may have died from starvation during this period (Piatt et al. 2020). While the average person along the Northeast Pacific Coast during this time likely didn’t notice any dramatic difference in the ocean, seabirds were shouting at us that something was terribly wrong.

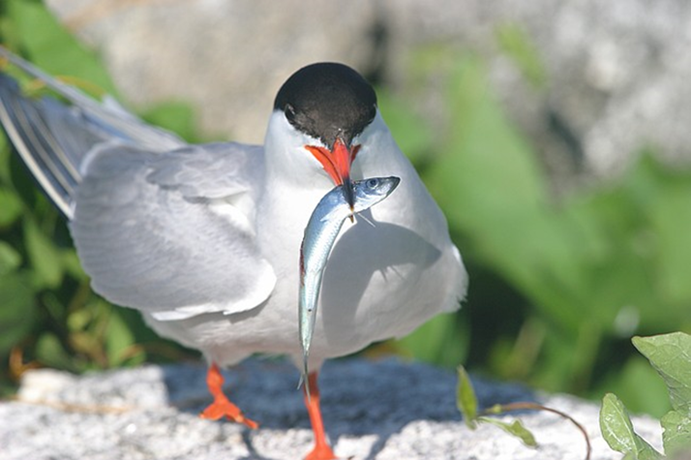
Happily, living seabirds also act as superb ecosystem sentinels. Long-term research in the Gulf of Maine by U.S. and Canadian scientists monitors the prey species provisioned by adult seabirds to their chicks. Will has spent countless hours over five summers helping to conduct this research by watching terns (Sterna spp.) and Atlantic puffins (Fratercula arctica) bring food to their young on small islands off the Maine coast. After doing this work for multiple years, it’s easy to notice that what adults feed their chicks varies from year to year. It was soon realized that these data could offer insight into oceanographic conditions and could even help managers assess the size of regional fish stocks. One of the dominant prey species in this region is Atlantic herring (Clupea harengus), which also happens to be the focus of an economically important fishery.  While the fishery targets four or five-year-old adult herring, the seabirds target smaller, younger herring. By looking at the relative amounts and sizes of young herring collected by these seabirds in the Gulf of Maine, these data can help predict herring recruitment and the relative number of adult herring that may be available to fishers several years in the future (Scopel et al. 2018).  With some continued modelling, the work that we do on a seabird colony in Maine with just a pair of binoculars can support or maybe even replace at least some of the expensive ship-based trawl surveys that are now a popular means of assessing fish stocks.

A common tern (Sterna hirundo) with a young Atlantic herring from the Gulf of Maine, ready to feed its chick (Photo courtesy of the National Audubon Society’s Seabird Institute)

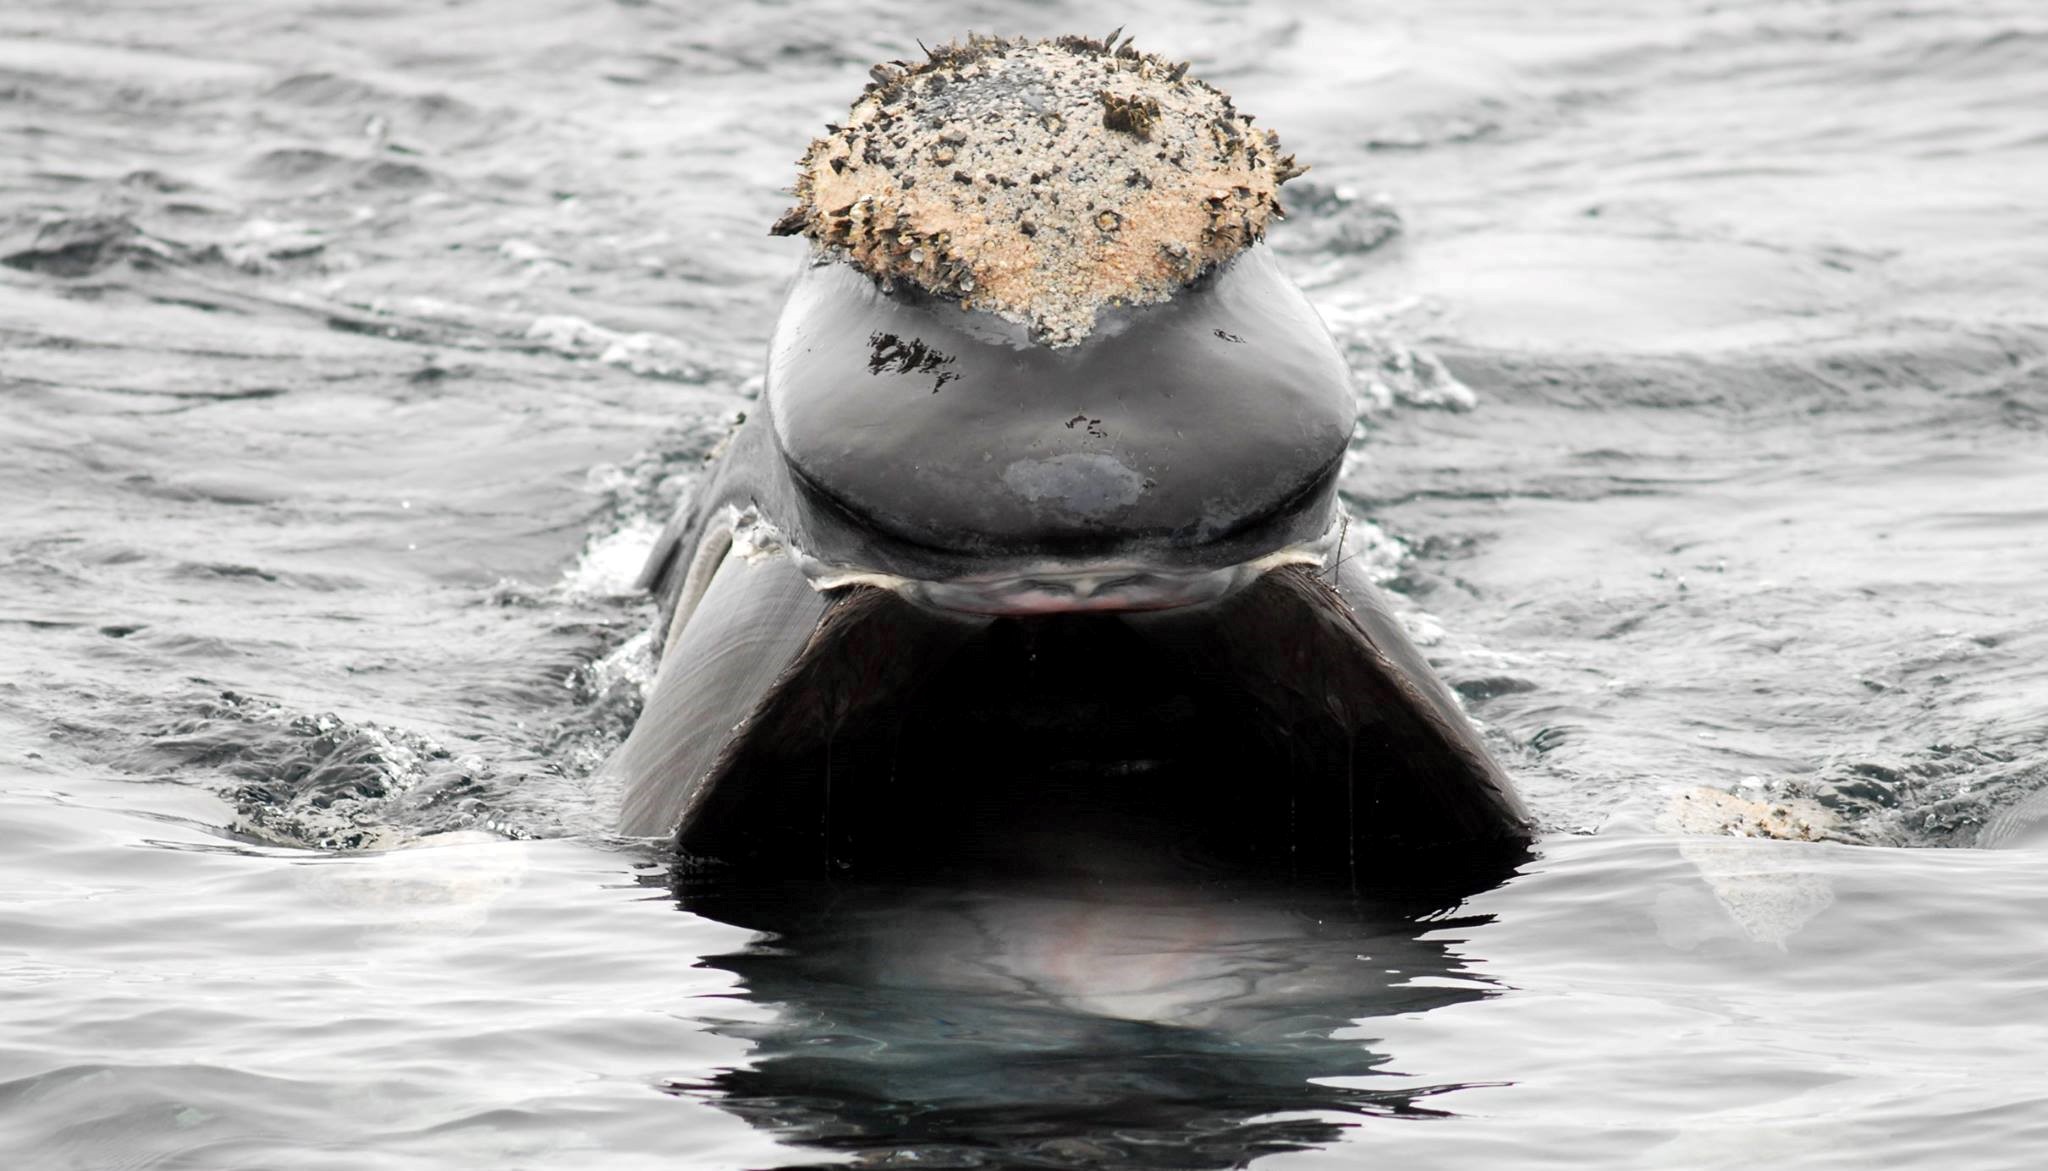
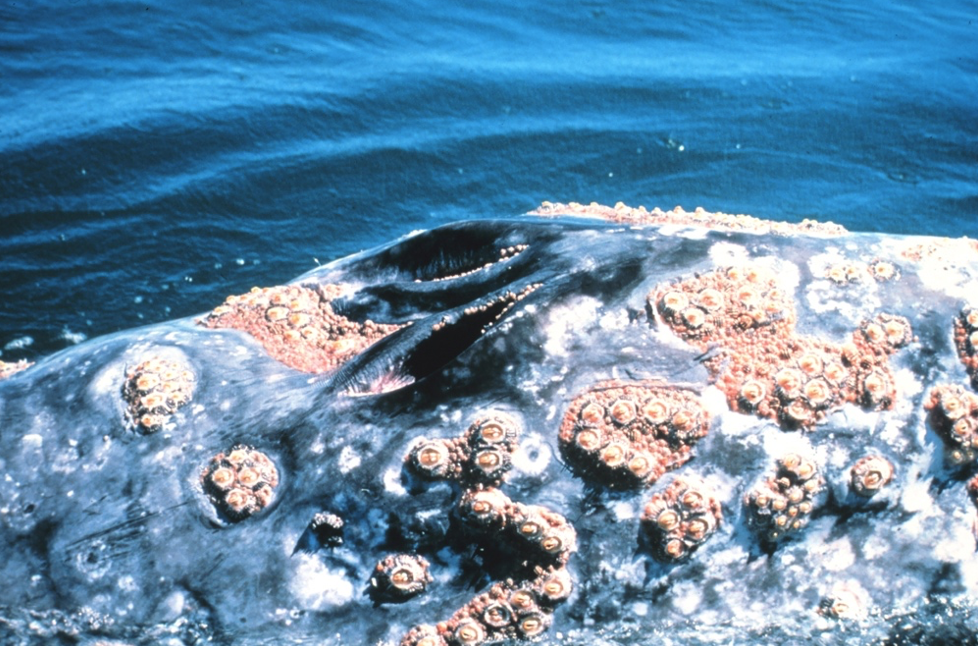
For more far-ranging and inaccessible marine predators such as whales, measuring things such as dietary shifts can be more challenging than it is for seabirds. Nevertheless, whales are valuable ecosystem sentinels as well. Changes in the distribution and migration phenology of specialist foragers such as blue whales (Balaenoptera musculus) and North Atlantic right whales (Eubalaena glacialis) can indicate relative changes in the distribution and abundance of their zooplankton prey and underlying ocean conditions (Hazen et al. 2019). In the case of the critically endangered North Atlantic right whale, their recent declines in reproductive success reflect a broader regime shift in climate and ocean conditions. Reduced copepod prey has resulted in fewer foraging opportunities and changing foraging grounds, which may be insufficient for whales to obtain necessary energetic stores to support calving (Gavrilchuk et al. 2021, Meyer-Gutbrod et al. 2021). These whales assimilate and showcase the broad-scale impacts of climate change on the ecosystem they inhabit.

Blue whales that feed in the rich upwelling system off the coast of California rely on the availability of their krill prey to support the population (Croll et al. 2005). A recent study used acoustic monitoring of blue whale song to examine the timing of annual population-level transition from foraging to breeding migration compared to oceanographic variation, and found that flexibility in timing may be a key adaptation to persistence of this endangered population facing pressures of rapid environmental change (Oestreich et al. 2022). Specifically, blue whales delayed the transition from foraging to breeding migration in years of the highest and most persistent biological productivity from upwelling, and therefore listening to the vocalizations of these whales may be valuable indicator of the state of productivity in the ecosystem.

Figure reproduced from Oestreich et al. 2022, showing relationships between blue whale life-history transition and oceanographic phenology of foraging habitat. Timing of the behavioral transition from foraging to migration (day of year on the y-axis) is compared to (a) the date of upwelling onset; (b) the date of peak upwelling; and (c) total upwelling accumulated from the spring transition to the end of the upwelling season.

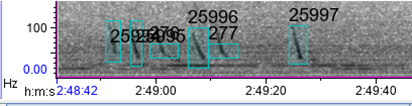
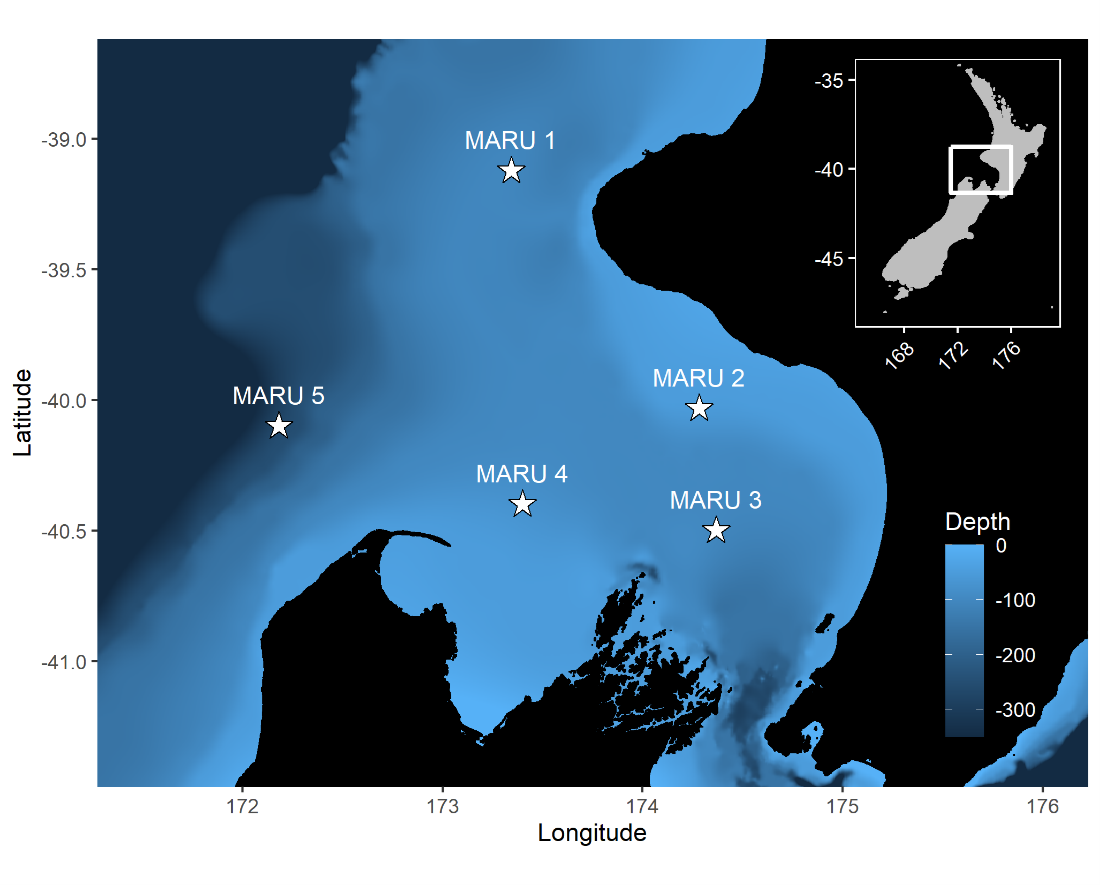
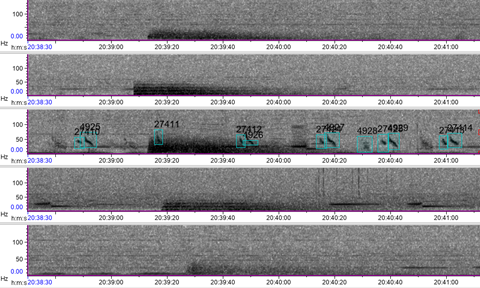
In a similar vein, research by the GEMM Lab on blue whale ecology in New Zealand has linked their vocalizations known as D calls to upwelling conditions, demonstrating that these calls likely reflect blue whale foraging opportunities (Barlow et al. 2021). In ongoing analyses, we are finding that these foraging-related calls were drastically reduced during marine heatwave conditions, which we know altered blue whale distribution in the region (Barlow et al. 2020). Now, for the final component of Dawn’s PhD, she is linking year-round environmental conditions to the occurrence patterns of different blue whale vocalization types, hoping to shed light on ecosystem processes by listening to the signals of these ecosystem sentinels.

A blue whale comes up for air in the South Taranaki Bight of New Zealand. photo by L. Torres.

It is important to understand the widespread implications of the rapidly warming climate and changing ocean conditions on valuable and vulnerable marine ecosystems. The cases explored here in this blog exemplify the importance of monitoring these marine megafauna sentinel species, both now and into the future, as they reflect the health of the ecosystems they inhabit.

Did you enjoy this blog? Want to learn more about marine life, research and conservation? Subscribe to our blog and get a weekly email when we make a new post! Just add your name into the subscribe box on the left panel.

References:

Barlow DR, Bernard KS, Escobar-Flores P, Palacios DM, Torres LG (2020) Links in the trophic chain: Modeling functional relationships between in situ oceanography, krill, and blue whale distribution under different oceanographic regimes. Mar Ecol Prog Ser 642:207–225.

Barlow DR, Klinck H, Ponirakis D, Garvey C, Torres LG (2021) Temporal and spatial lags between wind, coastal upwelling, and blue whale occurrence. Sci Rep 11:1–10.

Becker EA, Forney KA, Redfern J V., Barlow J, Jacox MG, Roberts JJ, Palacios DM (2019) Predicting cetacean abundance and distribution in a changing climate. Divers Distrib 25:626–643.

Cairns DK (1988) Seabirds as indicators of marine food supplies. Biol Oceanogr 5:261–271.

Cavole LM, Demko AM, Diner RE, Giddings A, Koester I, Pagniello CMLS, Paulsen ML, Ramirez-Valdez A, Schwenck SM, Yen NK, Zill ME, Franks PJS (2016) Biological impacts of the 2013–2015 warm-water anomaly in the northeast Pacific: Winners, losers, and the future. Oceanography 29:273–285.

Croll DA, Marinovic B, Benson S, Chavez FP, Black N, Ternullo R, Tershy BR (2005) From wind to whales: Trophic links in a coastal upwelling system. Mar Ecol Prog Ser 289:117–130.

Croll DA, Tershy BR, Hewitt RP, Demer DA, Fiedler PC, Smith SE, Armstrong W, Popp JM, Kiekhefer T, Lopez VR, Urban J, Gendron D (1998) An integrated approch to the foraging ecology of marine birds and mammals. Deep Res Part II Top Stud Oceanogr.

Gavrilchuk K, Lesage V, Fortune SME, Trites AW, Plourde S (2021) Foraging habitat of North Atlantic right whales has declined in the Gulf of St. Lawrence, Canada, and may be insufficient for successful reproduction. Endanger Species Res 44:113–136.

Hazen EL, Abrahms B, Brodie S, Carroll G, Jacox MG, Savoca MS, Scales KL, Sydeman WJ, Bograd SJ (2019) Marine top predators as climate and ecosystem sentinels. Front Ecol Environ 17:565–574.

Hazen EL, Jorgensen S, Rykaczewski RR, Bograd SJ, Foley DG, Jonsen ID, Shaffer SA, Dunne JP, Costa DP, Crowder LB, Block BA (2013) Predicted habitat shifts of Pacific top predators in a changing climate. Nat Clim Chang 3:234–238.

Hyrenbach KD, Forney KA, Dayton PK (2000) Marine protected areas and ocean basin management. Aquat Conserv Mar Freshw Ecosyst 10:437–458.

Meyer-Gutbrod EL, Greene CH, Davies KTA, Johns DG (2021) Ocean regime shift is driving collapse of the north atlantic right whale population. Oceanography 34:22–31.

Oestreich WK, Abrahms B, Mckenna MF, Goldbogen JA, Crowder LB, Ryan JP (2022) Acoustic signature reveals blue whales tune life history transitions to oceanographic conditions. Funct Ecol.

Piatt JF, Parrish JK, Renner HM, Schoen SK, Jones TT, Arimitsu ML, Kuletz KJ, Bodenstein B, Garcia-Reyes M, Duerr RS, Corcoran RM, Kaler RSA, McChesney J, Golightly RT, Coletti HA, Suryan RM, Burgess HK, Lindsey J, Lindquist K, Warzybok PM, Jahncke J, Roletto J, Sydeman WJ (2020) Extreme mortality and reproductive failure of common murres resulting from the northeast Pacific marine heatwave of 2014-2016. PLoS One 15:e0226087.

Scopel LC, Diamond AW, Kress SW, Hards AR, Shannon P (2018) Seabird diets as bioindicators of atlantic herring recruitment and stock size: A new tool for ecosystem-based fisheries management. Can J Fish Aquat Sci.

Silber GK, Lettrich MD, Thomas PO, Baker JD, Baumgartner M, Becker EA, Boveng P, Dick DM, Fiechter J, Forcada J, Forney KA, Griffis RB, Hare JA, Hobday AJ, Howell D, Laidre KL, Mantua N, Quakenbush L, Santora JA, Stafford KM, Spencer P, Stock C, Sydeman W, Van Houtan K, Waples RS (2017) Projecting marine mammal distribution in a changing climate. Front Mar Sci 4:413.

Sydeman WJ, Poloczanska E, Reed TE, Thompson SA (2015) Climate change and marine vertebrates. Science 350:772–777.

Wavelet analysis to describe biological cycles and signals of non-stationarity

By Allison Dawn, GEMM Lab Master’s student, OSU Department of Fisheries, Wildlife, and Conservation Sciences, Geospatial Ecology of Marine Megafauna Lab 

During my second term of graduate school, I have been preparing to write my research proposal. The last two months have been an inspiring process of deep literature dives and brainstorming sessions with my mentors. As I discussed in my last blog, I am interested in questions related to pattern and scale (fine vs. mesoscale) in the context of the Pacific Coast Feeding Group (PCFG) of gray whales, their zooplankton prey, and local environmental variables.

My work currently involves exploring which scales of pattern are important in these trophic relationships and whether the dominant scale of a pattern changes over time or space. I have researched which analysis tools would be most appropriate to analyze ecological time series data, like the impressive long-term dataset the GEMM lab has collected in Port Orford as part of the TOPAZ  project, where we have monitored the abundance of whales and zooplankton, as well as environmental variables since 2016. 

A useful analytical tool that I have come across in my recent coursework and literature review is called wavelet analysis. Importantly, wavelet analysis can handle non-stationarity and edge detection in time series data. Non-stationarity is when a dataset’s mean and/or variance can change over time or space, and edge detection is the identification of the change location (in time or space). For example, it is not just the cycles or “ups and downs” of zooplankton abundance I am interested in, but when in time or where in space these cycles of “ups and downs” might change in relation to what their previous values, or distances between values, were. Simply stated, non-stationarity is when what once was normal is no longer normal. Wavelet analysis has been applied across a broad range of fields, such as environmental engineering (Salas et al. 2020), climate science (Slater et al. 2021), and bio-acoustics (Buchan et al. 2021). It can be applied to any time series dataset that might violate the traditional statistical assumption of stationarity. 

In a recent review of climate science methodology, Slater et al. (2021) outlined the possible behavior of time series data. Using theoretical plots, the authors show that data can a) have the same mean and variance over time, or b) have non-stationarity that can be broken into three major groups – trend, step change, or shifts in variance. Figure 1 further demonstrates the difference between stationary vs. non-stationary data in relation to a given variable of interest over time. 

Figure 1. Plots showing the possible magnitude of a given variable across a time series: a) Stationary behavior, b) Non-stationary trend, step-change, and a shift in variance. [Taken from Slater et. al (2021)].

Traditional correlation statistics assumes stationarity, but it has been shown that ecological time series are often non-stationary at certain scales (Cazelles & Hales, 2006). In fact, ecological data rarely meets the requirements of a controlled experiment that traditional statistics require. This non-stationarity of ecological data means that while widely-used methods like generalized linear models and analyses of variances (ANOVAs) can be helpful to assess correlation, they are not always sufficient on their own to describe the complex natural phenomena ecologists seek to explain. Non-stationarity occurs frequently in ecological time series, so it is appropriate to consider analysis tools that will allow us to detect edges to further investigate the cause.

Wavelet analysis can also be conducted across a time series of multiple response variables to assess if these variables share high common power (correlation). When data is combined in this way it is called a cross-wavelet analysis. An interesting paper used cross-wavelet analysis to assess the seasonal response of zooplankton life history in relation to climate warming (Winder et. al 2009). Results from their cross-wavelet analysis showed that warming temperatures over the past two decades increased the voltinism (number of broods per year) of copepods. The authors show that where once annual recruitment followed a fairly stationary pattern, climate warming has contributed to a much more stochastic pattern of zooplankton abundance. From these results, the authors contribute to the hypothesis that climate change has had a temporal impact on zooplankton population dynamics, and recruitment has increasingly drifted out of phase from the original annual cycles. 

Figure 2. Cross-wavelet spectrum for immature and adult Leptodiaptomus ashlandi for 1965 through either 2000 or 2005. Plots show a) immatures and temperature, b) adults and temperature, c) immatures and phytoplankton, and d) adults and phytoplankton. Arrows indicate phase between combined time series. 0 degrees is in-phase and 180 degrees is anti-phase. Black contour lines show “cone of influence” or the 95% significance level, every value within the cone is considered significant. Left axis shows the temporal period, and the color legend shows wavelet frequency power, with low frequencies in blue and high frequencies in red. Plots show strong covariation of high common power at the 12-month period until the 1980s. This pattern is especially evident in plot c) and d). [Taken from (Winder et. al 2009)].

While wavelet and cross-wavelet analyses should not be the only tool used to explore data, due to its limitations with significance testing, it is still worth implementing to gain a better understanding of how time series variables relate to each other over multiple spatial and/or temporal scales. It is often helpful to combine multiple methods of analysis to get a larger sense of patterns in the data, especially in spatio-temporal research.

When conducting research within the context of climate change, where the concentration of CO2 in ppm in the atmosphere is a non-stationary time series itself (Figure 3), it is important to consider how our datasets might be impacted by climate change and wavelet analysis can help identify the scales of change. 

Figure 3. Plot showing the historic fluctuations of CO^2 and the recent deviation from normal levels. Source: https://globalclimate.ucr.edu/resources.html

When considering our ecological time series of data in Port Orford, we want to evaluate how changing ocean conditions may be related to data trends. For example, has the annual mean or variance of zooplankton abundance changed over time, and where has that change occurred in time or space? These changes might have occurred at different scales and might be invisible at other scales. I am eager to see if wavelet analysis can detect these sorts of changes in the abundance of zooplankton across our time series of data, particularly during the seasons of intense heat waves or upwelling. 

Did you enjoy this blog? Want to learn more about marine life, research and conservation? Subscribe to our blog and get a weekly email when we make a new post! Just add your name into the subscribe box on the left panel.

References

Buchan, S. J., Pérez-Santos, I., Narváez, D., Castro, L., Stafford, K. M., Baumgartner, M. F., … & Neira, S. (2021). Intraseasonal variation in southeast Pacific blue whale acoustic presence, zooplankton backscatter, and oceanographic variables on a feeding ground in Northern Chilean Patagonia. Progress in Oceanography, 199, 102709.

Cazelles, B., & Hales, S. (2006). Infectious diseases, climate influences, and nonstationarity. PLoS Medicine, 3(8), e328.

Salas, J. D., Anderson, M. L., Papalexiou, S. M., & Frances, F. (2020). PMP and climate variability and change: a review. Journal of Hydrologic Engineering, 25(12), 03120002.

Slater, L. J., Anderson, B., Buechel, M., Dadson, S., Han, S., Harrigan, S., … & Wilby, R. L. (2021). Nonstationary weather and water extremes: a review of methods for their detection, attribution, and management. Hydrology and Earth System Sciences, 25(7), 3897-3935.

Winder, M., Schindler, D. E., Essington, T. E., & Litt, A. H. (2009). Disrupted seasonal clockwork in the population dynamics of a freshwater copepod by climate warming. Limnology and Oceanography, 54(6part2), 2493-2505.

Social turmoil due to the approval of an offshore oil exploration project off the coast of Argentina.

Dr. Alejandro A. Fernández Ajó, Postdoctoral Scholar, Marine Mammal Institute – OSU Department of Fisheries, Wildlife, & Conservation Sciences, Geospatial Ecology of Marine Megafauna (GEMM) Lab.

I just returned to my home country, Argentina, after over 2 years without leaving the USA due to COVID-19 travel restrictions. Being back with my family, my friends, my culture, and speaking my native language feels great and relaxing. However, I returned to a country struggling to rebound from the coronavirus pandemic. I am afraid this post pandemic scenario places Argentina in a vulnerable situation. The need for economic growth could result in decisions or policies that, in the long term, hurt the country, leaving environmental damage for potential economic growth.

Argentina holds extensive oil and gas deposits, including the world’s second largest gas formation, Vaca Muerta. Although offshore (i.e., in the ocean) oil exploration and exploitation are not yet extensively developed, the intention of offshore gas and oil drilling is on the agenda. In July 2021, a public hearing was held with the purpose to consider the environmental impact assessment for carrying out seismic exploration in the North Argentinian basin off the southern coast of the Buenos Aires province. Over 90% of the participants, including scientists, researchers, technicians from various institutions, non-governmental organizations and representatives of the fishing sector spoke against the project and highlighted the negative impacts that such activity can generate on marine life, and to other socioeconomic activities such as tourism and fishing, not only in Argentina but at the regional level.

Thousands of people marched along the beaches and the main coastal cities of Argentina to protest against the approval for a seismic explorations project in the Argentinian basin. Photo source: prensaobrera.com

Seismic prospections are usually done with the purpose for oil and gas exploitation and less frequently for research purposes. In seismic prospections, ships carry out explosions with airguns, whose sound waves reach the seabed, bounce back and are captured by receivers on the ships to map the petroleum deposits in seafloor and identify potential areas for hydrocarbon extractions. The sound emitted by the seismic airguns can reach extremely loud levels of sounds that travel for thousands of miles underwater. Such extreme high levels of sound can alter the behavior of many marine species, from the smallest planktonic species, to the largest marine mammals, masking their communication, causing physical and physiological stress, interfering with their vital functions, and reducing the local availability of prey (Di Iorio & Clark, 2010; Hildebrand, 2009; Weilgart, 2018).

Here you can listen to a short audio clip of a seismic airgun firing every ~8 seconds, a typical pattern. Close your eyes and imagine you are a whale living in this environment. Now, put the clip on loop and play it for three months straight. This would be the soundscape that whales living in a region of oil and gas exploration hear, as seismic surveys often last 1-4 months (see our previous post “Hearing is believing” for more details).

Despite the public rejection and the mounting evidence about the negative impacts and environmental risks associated with such activities, the government approved the initiation of the seismic prospection off the southern coast of Buenos Aires. In response, thousands of people marched along the beaches and the main coastal cities of Argentina to protest against the oil exploration project. The areas where the seismic surveys will be carried out overlap largely with the southern right whale’s migration routes and feeding areas during their spring and summer (Figure 1). Likewise, the area overlaps with highly productive areas in the ocean that hosts great biodiversity of species of ecological and commercial importance, including the feeding areas of seabirds, turtles and other marine mammals. Additionally, the seismic activity will endanger the health of the beaches of the coast of Buenos Aires and Uruguay where thousands of tourists spend the summer to escape from the large cities.

Figure 1. The map on the left is showing (light blue squares CAN_100, CAN_108, and CAN_114) the areas where seismic prospections are proposes. The map on the right is showing the individual satellite track lines for eleven individual southern right whales (SRW) during the feeding season. You can observe that the proposed area for seismic explorations overlaps with critical feeding habitat for the SRW. Source: Whale Conservation Institute of Argentina (ICB).

The impacts of these activities to marine wildlife are difficult to control and monitor (Elliott et al. 2019, Gordon et al, 2003), especially for large whales that are a very challenging taxa to study (Hunt et al. 2013). We know that the ability to perceive biologically important sounds is critical to marine mammals, and acoustic disturbance through human-generated noise can interfere with their natural functions. Sounds from seismic surveys are intense and have peak frequency bands overlapping those used by baleen whales (Di Lorio & Clark, 2010); however, evidence of interference with baleen whale acoustic communication, and the effects on their health and physiology are sparse. In this context, the GEMM Lab project GRANITE (Gray Whale Response to Ambient Noise Informed by Technology and Ecology), plans to generate information to fulfill these knowledge gaps and provide tools to aid conservation and management decisions in terms of allowable noise level in whale habitats. I am hopeful such information will reach decision makers and influence their decisions, however, sometimes it is frustrating to see how evidence-based information generated with high quality standards are often ignored.

The recent approval of the seismic exploration in Argentina is an example of my frustration. There is no way that the oil industry can guarantee a low-risk of impact on biodiversity and the environment. There are too many examples of environmental catastrophes related to the oil industries at sea that speak for themselves. Moreover, the promotion of such activities goes against the compromises assumed by the country to work to mitigate the effects of Climate Change, and to achieve the reductions of the greenhouse gas emissions to comply with the Paris Agreement. Decades of research help recognized the areas that would be impacted by these seismic activities as key habitat for the life cycle of whales, penguins, seals and more. But, apparently all these scientific data are ignored at the time of weighing the tradeoffs between “economic development” and environmental impacts. As a conservation biologist, I am questioning what can be done in order to be heard and significantly influence such decisions.

Did you enjoy this blog? Want to learn more about marine life, research, and conservation? Subscribe to our blog and get a weekly alert when we make a new post! Just add your name into the subscribe box on the left panel.

References:

  • Di Iorio, L., & Clark, C. W. (2010). Exposure to seismic survey alters blue whale acoustic communication. Biology Letters, 6(1), 51–54. https://doi.org/10.1098/rsbl.2009.0651
  • Weilgart, L. (2018). The impact of ocean noise pollution on fish and invertebrates. Report for OceanCare, Switzerland.
  • Elliott, B. W., Read, A. J., Godley, B. J., Nelms, S. E., & Nowacek, D. P. (2019). Critical information gaps remain in understanding impacts of industrial seismic surveys on marine vertebrates. In Endangered Species Research (Vol. 39, pp. 247–254). Inter-Research. https://doi.org/10.3354/esr00968
  • Gordon, J., Gillespie, D., Potter, J., Frantzis, A., Simmonds, M. P., Swift, R., & Thompson, D. (2003). A review of the effects of seismic surveys on marine mammals. Marine Technology Society Journal37(4), 16-34.
  • Hunt, K. E., Moore, M. J., Rolland, R. M., Kellar, N. M., Hall, A. J., Kershaw, J., Raverty, S. A., Davis, C. E., Yeates, L. C., Fauquier, D. A., Rowles, T. K., & Kraus, S. D. (2013). Overcoming the challenges of studying conservation physiology in large whales: a review of available methods. Conservation Physiology, cot006–cot006. https://doi.org/10.1093/conphys/cot006

Drones with lasers: almost as cool as “sharks with laser beams attached to their heads”

Dr. KC Bierlich, Postdoctoral Scholar, OSU Department of Fisheries, Wildlife, & Conservation Sciences, Geospatial Ecology of Marine Megafauna (GEMM) Lab

The recent advancement in drones (or unoccupied aircraft systems, UAS) has greatly enhanced opportunities for scientists across a broad range of disciplines to collect high-resolution aerial imagery. Wildlife researchers in particular have utilized this technology to study large elusive animals, such as whales, to observe their behavior (see Clara Bird’s blog) and obtain morphological measurements via photogrammetry (see previous blog for a brief history on photogrammetry and drones). However, obtaining useful measurement data is not as easy as flying the drone and pressing record. For this blog, I will provide a brief overview on the basics of using photogrammetry to extract morphological measurements from images collected with drones, as well as the associated uncertainty from using different drone platforms. 

During my PhD at Duke University, I co-developed an open-source photogrammetry software called MorphoMetriX to measure whales in images I collected using drones (Fig. 1) (Torres and Bierlich, 2020) (see this blog for some fieldwork memoirs!). The software is designed to be flexible, simple to use, and customizable without knowledge of scripting languages. Using MorphoMetriX, measurements are made in pixels and then multiplied by the ground sampling distance (GSD) to convert to standard units (e.g., meters) (Fig. 2A). GSD represents the distance on the ground each pixel represents (i.e., the linear size of the pixel) and therefore sets the scale of the image (i.e., cm per pixel). Figure 2A describes how GSD is dependent on the camera sensor, focal length lens, and altitude. Thus, drones equipped with different cameras and focal length lenses will have inherent differences in GSD as altitude increases (Fig. 2B). A larger GSD increases the length each pixel represents in a photo and results in a lower resolution image, potentially obscuring important features in the photo and introducing measurement error.

Figure 1. An example of a Pacific Coast Feeding Group gray whale measured in MorphoMetriX (Torres & Bierlich, 2020).
Figure 2: Overview of photogrammetry methods and calculating ground sampling distance (GSD). A) Photogrammetry methods for how each image is scaled to convert measurements in pixels to standard units (e.g., meters). Altitude is the distance between the camera lens and whale (usually at the surface of the water). Figure from Torres and Bierlich (2020). B) The exact (not accounting for distortion or altitude error) ground sampling distance (GSD) for two drone platforms commonly used to obtain morphological measurements of cetaceans. The difference in GSD between the P4Pro and Inspire 1 is due to the difference in sensor width and focal lengths of the cameras used. Figure from Bierlich et al. (2021).

Obtaining accurate altitude information is a key component in obtaining accurate measurements. All drones are equipped with a barometer, which measures altitude from changes in pressure. In general, barometers usually yield low accuracy in the altitude recorded, particularly for low-cost sensors commonly found on small, off-the-shelf drones (Wei et al., 2016). Dawson et al. (2017) added a laser altimeter (i.e., LightWare SF11/C, https://www.mouser.com//datasheet//2//321//28054-SF11-Laser-Altimeter-Manual-Rev8-1371857.pdf) to a drone, which yields higher accuracy in the altitude recorded. Since then, several studies have adopted use of a laser altimeter to study different species of baleen whales (i.e., Gough et al., 2019; Christiansen et al., 2018).

The first chapter of my dissertation, which was published last year in Marine Ecology Progress Series, compared the accuracy of several drones equipped with different camera sensors, focal length lenses, and a barometer vs. laser altimeter (Bierlich et al., 2021). We flew each drone over a known sized object floating at the surface and collected images at various altitudes (between 10 – 120 m). We used the known size of the floating object to determine the percent error of each measurement at each altitude. We found that 1) there is a lot of variation in measurement error across the different drones when using a barometer to measure altitude and 2) using a laser altimeter dramatically reduces measurement error for each drone (Fig. 3).

Figure 3. The % error for measurements from different drones. Black dashed line represents 0% error (true length = 1.48 m). The gray dashed lines represent under- and over-estimation of the true length by 5% (1.41 and 1.55 m, respectively).

These findings are important because if a study is analyzing measurements that are from more than one drone, the uncertainty associated with those measurements must be taken into account to know if measurements are reliable and comparable. For instance, let’s say we are comparing the body length of two different populations and found that population A is significantly longer than population B. From looking at Figure 3, that significant difference in length between population A and B could be unreliable as the difference may be due to the bias introduced by the type of drone, camera sensor, focal length lens, and whether a barometer or laser altimeter was used for recording altitude. In other words, without incorporating uncertainty associated with each measurement, how do you trust your measurement? 

Hence, the National Institute of Standards and Technology (NIST) states that a measurement is complete only when accompanied by a quantitative statement of its uncertainty (Taylor & Kuyatt, 1994). In our Bierlich et al. (2021) study, we develop a Bayesian statistical model where we use the measurements of the known-sized object floating at the surface (what was used for Fig. 3) as training data to predict the lengths of unknown-sized whales. This Bayesian approach views data and the underlying parameters that generated the data (such as the mean or standard deviation) as random, and thus can be described by a statistical distribution. Using Bayes’ Theorem, a model of the observed data (called the likelihood function), is combined with prior knowledge pertaining to the underlying parameters (called the prior probability distribution) to form the posterior probability distribution, which serves as updated knowledge about the underlying parameter. For example, if someone told me they saw a 75 ft blue whale, I would not be phased. But if someone told me they saw a 150 ft blue whale, I would be skeptical – I’m using prior knowledge to determine the probability of this statement being true. 

The posterior probability distribution produced by this Bayesian approach can also serve as new prior information for subsequent analyses. Following this framework, we used the known-sized objects to first estimate the posterior probability distribution for error for each drone. We then used that posterior probability distribution for error specific to each drone platform as prior information to form a posterior predictive distribution for length of unknown-sized whales. The length of an individual whale can then be described by the mean of this second posterior predictive distribution, and its uncertainty defined as the variance or an interval around the mean (Fig. 4). 

Figure 4. An example of a posterior predictive distribution for total length of an individual blue whale. The black bars represent the uncertainty around the mean value (the black dot) – the longer black bars represent the 95% highest posterior density (HPD) interval, and the shorter black bars represent the 65% HPD interval. 

For over half a decade, the GEMM Lab has been collecting drone images of Pacific Coast Feeding Group (PCFG) of gray whales off the coast of Oregon to measure their morphology and body condition (see GRANITE Project Blog). We have been using several different types of drones equipped with different cameras, focal length lenses, barometers, and laser altimeters. These measurements from different drones will inherently have different levels of error associated with them, so adapting these methods for incorporating uncertainty will be key to ensure our measurements are comparable and analyses are robust. To do this, we fly over a known-sized board (1 m) at the start of each flight to use as training data to generate a posterior predictive distribution for length of the an unknown-sized PCFG gray whale that we fly over (Fig. 5). Likewise, we are working closely with several other collaborators who are also using different drones. Incorporating measurement uncertainty from drones used across research labs and in different environments will help ensure robust analyses and provide great opportunity for some interesting comparisons – such as differences in gray whale body condition on their feeding grounds in Oregon vs. their breeding grounds in Baja, Mexico, and morphological comparisons with other baleen whale species, such as blue and humpback whales. We are currently wrapping up measurement from thousands of boards (Fig. 5) and whales (Fig. 1) from 2016 – 2021, so stay tuned for the results!

Figure 5. An example of a known-sized object (1 m long board) used as training data to assess measurement uncertainty. 

References

Bierlich, K.C., Schick, R.S., Hewitt, J., Dale, J., Goldbogen, J.A., Friedlaender, A.S., Johnston D.J. (2021). A Bayesian approach for predicting photogrammetric uncertainty in morphometric measurements derived from UAS. Marine Ecology Progress Series. DOI: https://doi.org/10.3354/meps13814

Christiansen F, Vivier F, Charlton C, Ward R, Amerson A, Burnell S, Bejder L (2018) Maternal body size and condition determine calf growth rates in southern right whales. Mar Ecol Prog Ser 592: 267−281

Dawson SM, Bowman MH, Leunissen E, Sirguey P (2017) Inexpensive aerial photogrammetry for studies of whales and large marine animals. Front Mar Sci 4: 366

Gough, W.T., Segre, P.S., Bierlich, K.C., Cade, D.E., Potvin, J., Fish, F. E., Dale, J., di Clemente, J., Friedlaender, A.S., Johnston, D.W., Kahane-Rapport, S.R., Kennedy, J., Long, J.H., Oudejans, M., Penry, G., Savoca, M.S., Simon, M., Videsen, S.K.A., Visser, F., Wiley, D.N., Goldbogen, J.A. (2019). Scaling of swimming performance in baleen whales. Journal of Experimental Biology222(20).https://doi.org/10.1242/jeb.204172  

Taylor, B. N., and Kuyatt, C. E. (1994). Guidelines for Evaluating and Expressing the Uncertainty of NIST Measurement Results. Washington, DC: National Institute of Standards and Technology. 1–25.

Torres, W.I., & Bierlich, K.C. (2020). MorphoMetriX: a photogrammetric measurement GUI for morphometric analysis of megafauna. Journal of Open Source Software5(45), 1825. https://doi.org/10.21105/joss.01825  

Wei S, Dan G, Chen H (2016) Altitude data fusion utilizing differential measurement and complementary filter. IET Sci Meas Technol (Singap) 10: 874−879

Of snakes and whales: How food availability and body condition affect reproduction

Clara Bird, PhD Student, OSU Department of Fisheries, Wildlife, and Conservation Sciences, Geospatial Ecology of Marine Megafauna Lab

Over six field seasons the GEMM lab team has conducted nearly 500 drone flights over gray whales, equaling over 100 hours of footage. These hours of footage are the central dataset for my PhD dissertation, so it’s up to me to process them all. This process can be challenging, tedious, and daunting, but it is also quite fun and a privilege to be the one person who gets to watch all the footage. It’s fascinating to get to know the whales and their behaviors and pick up on patterns. It motivates me to get through this video processing step and start doing the data analysis. Recently, it’s been especially fun to notice patterns that I’ve seen mentioned in the literature. One example is adult social behavior. 

There are two categories of social behavior that I’m interested in studying: maternal behavior, defined as interactions between a mom and its calf, and general social behaviors, defined as social interactions between non-mom/calf pairs. In this blog I’ll focus on general social behaviors, but if you’re interested in maternal behavior check out this blog. General social behavior, which I’ll refer to as social behavior moving forward, includes tactile interactions and promiscuous behaviors (Torres et al. 2018; Clip 1). While gray whales in the PCFG range are primarily foraging, researchers have observed increases in social behavior towards the end of the foraging season (Stelle et al., 2008; Torres et al., 2018). We think that this indicates that the whales are starting to focus less on feeding and more on breeding. This tradeoff of foraging vs. socializing time is interesting because it comes at an energetic cost.

Clip 1. Example of social interaction between a male and female gray whale off the coast of Oregon, USA. Collected under NOAA/NMFS permit #21678

Broadly, animals need to balance the energetic demands of survival with those of reproduction. They need to reproduce to pass on their genes, but reproduction is energetically demanding, and animals also need to survive and grow to be able to reproduce. The decision to reproduce is costly because reproduction requires energetic investment and time investment since animals do not forage (gaining energy) when they are socializing. Consequently, only animals with sufficient energy reserves (i.e., body condition) to invest in reproduction actually engage in reproduction. Given these costs associated with reproduction, we expect to see a relationship between social behavior and body condition (Green, 2001) with mainly animals in good body condition engaging in social behavior because these animals have sufficient reserves to sustain the cost. Furthermore, since body condition is an indicator of foraging success and prey availability, environmental conditions can also affect social behavior and reproduction through this pathway. 

Rahman et al. (2014) used a lab experiment to study the relationship between nutritional stress and male guppy courtship behavior (Figure 1). In their experiment they tested for the effects of both decreased diet quantity and quality on the frequency of male courtship behaviors. Rahman et al (2014) found that individuals in the low-quantity group were significantly smaller than those in the high-quality group and that diet quantity had a significant effect on the frequency of courtship behaviors. Males fed a low-quantity diet performed fewer courtship behaviors. Interestingly, there was no significant effect of diet quality on courtships behavior, although there was some evidence of an interaction effect, which suggests that within the low-quantity group, males fed with high-quality food performed more courtship behaviors that those fed with low-quality food. This study is interesting because it shows how foraging success (diet quantity and quality) can affect courting behavior. 

Figure 1. A guppy (Rahman et al., 2013)

However, guppies are not the ideal species for comparison to gray whales because gray whales and guppies have quite different life history traits. A more fitting comparison would be with an example species with more in common with gray whales, such as viviparous capital breeders. Viviparous animals develop the embryo inside the body and give live birth. Capital breeders forage to build energy reserves and then rely on those energy reserves during reproduction. Surprisingly, I found asp vipers to be a good example species for comparison to gray whales.

Asp vipers (Figure 2) are viviparous snakes who are considered capital breeders because they forage prior to hibernation, and then begin reproduction immediately following hibernation without additional foraging. Naulleau & Bonnet (1996) conducted a field study on female asp vipers to determine if there was a difference in body condition at the start of the breeding season between females who reproduced or not during that season. To do this they marked individuals and measured their body condition at the start of the breeding season and then recaptured those individuals at the end of the breeding season and recorded whether the individual had reproduced. Interestingly, they found that there was a strongly significant difference in body condition between females that did and did not reproduce. In fact, they discovered that no female below a certain body condition value reproduced, meaning that they found a body condition threshold for reproduction. 

Figure 2. An asp viper

Additionally, a study on water pythons found that their body condition threshold for reproduction shifted over time in response to prey availability (Madsen & Shine, 1999). These authors found that females lowered their threshold after several consecutive years of poor prey availability. These studies are really exciting to me because they address questions that the GRANITE project team is interested in tackling.

Understanding the relationship between body condition and reproduction in gray whales is an important puzzle piece for our work. The aim of the GRANITE project is to understand how the effects of stressors on individual whales scales up to population level impacts (read Lisa’s blog to learn more). Reproduction rates play a big role in population dynamics, so it is important to understand what factors affect reproduction. Since we’re studying these whales on their foraging grounds, assessing body condition provides an important link between foraging behavior and reproduction. 

For example, if an individual’s response to a stressor is to forage less, that may lead to poorer body condition, meaning that they may be less likely to reproduce. While reduced reproduction in one individual may not have a big effect on the population, the same response from multiple individuals could impact the population’s dynamics (i.e., increasing or decreasing abundance). Understanding these different relationships between behavior, body condition, and reproduction rates is a big undertaking, but it’s exciting to be a member of the GRANITE team as this strong group of scientists works to bring together different data streams to work on this big picture question. We’re all deep into data processing right now so stay tuned over the next few years to learn more about gray whale social behavior and to find out if fat whales are more social than skinny whales. 

Did you enjoy this blog? Want to learn more about marine life, research, and conservation? Subscribe to our blog and get weekly updates and more! Just add your name into the subscribe box on the left panel.  

References

Green, A. J. (2001). Mass/Length Residuals: Measures of Body Condition or Generators of Spurious Results? Ecology82(5), 1473–1483. https://doi.org/10.1890/0012-9658(2001)082[1473:MLRMOB]2.0.CO;2

Madsen, T., & Shine, R. (1999). The adjustment of reproductive threshold to prey abundance in a capital breeder. Journal of Animal Ecology68(3), 571–580. https://doi.org/10.1046/j.1365-2656.1999.00306.x

Naulleau, G., & Bonnet, X. (1996). Body Condition Threshold for Breeding in a Viviparous Snake. Oecologia107(3), 301–306.

Rahman, M. M., Kelley, J. L., & Evans, J. P. (2013). Condition-dependent expression of pre- and postcopulatory sexual traits in guppies. Ecology and Evolution3(7), 2197–2213. https://doi.org/10.1002/ece3.632

Rahman, M. M., Turchini, G. M., Gasparini, C., Norambuena, F., & Evans, J. P. (2014). The Expression of Pre- and Postcopulatory Sexually Selected Traits Reflects Levels of Dietary Stress in Guppies. PLOS ONE9(8), e105856. https://doi.org/10.1371/journal.pone.0105856

Stelle, L. L., Megill, W. M., & Kinzel, M. R. (2008). Activity budget and diving behavior of gray whales (Eschrichtius robustus) in feeding grounds off coastal British Columbia. Marine Mammal Science24(3), 462–478. https://doi.org/10.1111/j.1748-7692.2008.00205.x

Torres, L. G., Nieukirk, S. L., Lemos, L., & Chandler, T. E. (2018). Drone up! Quantifying whale behavior from a new perspective improves observational capacity. Frontiers in Marine Science5(SEP). https://doi.org/10.3389/fmars.2018.00319

Harmful algal blooms expose southern right whales to domoic acid and can potentially cause endocrine alterations

Dr. Alejandro Fernández Ajó, OSU Department of Fisheries, Wildlife, & Conservation Sciences, Geospatial Ecology of Marine Megafauna Lab

Rises in ocean temperatures can lead to multiple alterations in marine ecosystems, including the increase and the frequency of Harmful Algal Blooms (HABs). HABs are characterized by the rapid growth of toxin-producing species of algae that can be harmful to people, animals, and the local ecology, even causing death in severe cases. Species of marine diatom within the genus Pseudo-nitzschia and Nitzschia can form HABs when they produce domoic acid (DA), a potent neurotoxin responsible for amnesic shellfish poisoning (D’Agostino et al., 2018, 2017).

Figure 1. Southern right whale (E. australis) mother and calf swimming at the gulfs of Peninsula Valdes, Argentina, during a phytoplankton bloom. Photo: Mariano Sironi / Instituto de Conservacion de Ballenas de Argentina.

During HABs, DA is transferred to higher organisms through the pelagic food web and is accumulated by intermediate vectors, such as copepods, euphausiids (i.e., krill), shellfish, and fish. As this neurotoxin affects top predators, DA poisoning poses a risk to the safety and health of humans and wildlife. This neurotoxin has caused mortality in many marine mammal species, including both pinnipeds and cetaceans (Gulland 1999; Lefebvre et al. 1999; Fire et al. 2010, 2021; Broadwater et al. 2018). In addition, the exposure to DA constitutes a stressor that may affect glucocorticoids (hormones involved in the stress response) concentrations.

The glucocorticoids (GCs; cortisol and corticosterone) are adrenal steroid hormones that maintain the essential functions of metabolism and energy balance in mammals. GCs can increase sharply in response to environmental stressors to elicit physiological and behavioral adaptations by individuals to support survival (Sapolsky et al. 2000; Bornier et al. 2009). However, with the chronic exposure to a stressor, this relationship can reverse, with GCs sometimes declining below its baseline levels (Dickens and Romero, 2013; Fernández Ajó et al., 2018). Moreover, DA can interfere with the stress response in mammals, and cause alterations in their physiological response. DA is an excitatory amino acid analog of glutamate (Pulido 2008), a well-known brain neurotransmitter that play an important role in the activation of the adrenal axis (which in turn regulate the production and secretion of the GCs) and regulate many of the pituitary hormones involved in the stress response (Brann and Mahesh 1994; Johnson et al. 2001). Hence, monitoring GC levels in marine mammals can be a potential useful metric for assessing the physiological impacts of exposure to DA.

Glucocorticoids are traditionally measured in plasma, but given that plasma sampling from free-ranging large whales is currently impossible, alternative sample types such as fecal samples, among others, can be utilized to quantify GCs in large whales (Ajó et al., 2021; Burgess et al., 2018, 2016; Fernández Ajó et al., 2020, 2018; Hunt et al., 2019, 2014, 2006; Rolland et al., 2017, 2005)(Figure 2). The analyses of fecal glucocorticoid metabolites (fGCm) is particularly useful for endocrine assessments of free-swimming whales, with several studies showing that fGCm correlate in meaningful ways with presumed stressors. For example, high levels of fGCm in North Atlantic right whales (NARW, Eubalaena glacialis) and in gray whales (Eschrichtius robustus) correlate with poor body condition (Hunt et al., 2006; Lemos et al., 2021), and fGCm increases were associated with whale entanglements and ship strikes (i.e., Lemos et al., 2020; Rolland et al., 2017).

Figure 2. Alternative samples types can be used to study hormones in large whales. 1-2-3 are sample types that can be obtained from free-living whales and provide a more instantaneous and acute measurement of the whales´ physiology. 4-5 can be obtained at necropsy when the whale is found dead at the beach and provide an integrated measure of the whale physiology that can expand through years or even the lifespan of an individual.

In Península Valdés, Argentina, southern right whales (SRW, E. australis) gather in large numbers to mate and nurse their calves during the austral winter months (Bastida and Rodríguez, 2009). SRWs are capital breeders, largely fasting during the breeding season and instead relying on stored blubber fuel reserves. However, they can occasionally feed on calanoid copepods (D’Agostino et al., 2018, 2016), particularly during the phytoplankton blooms that are dominated by diatoms of the genus Pseudo-nitzschia (Sastre et al. 2007; D’Agostino et al. 2015, 2018). Therefore, feeding SRWs in Península Valdés temporally overlap with these Pseudo-nitzschia blooms (D’Agostino et al. 2018, 2015) and represents a test case for assessing the relationship of DA exposure with GC levels (Figure 3).

Figure 3. Southern right whale (E. australis) skim feeding at the Peninsula Valdes breeding ground. Photo: Lucas Beltranino.

In our recent scientific publication (D’Agostino et al. 2021), we investigate SRW exposure to DA at their breeding ground in Peninsula Valdes and assessed its effects on fecal glucocorticoid concentrations. Although the sample size of this study is unavoidably small due to the difficulties of obtaining fecal samples from whales at their calving grounds where defecation is infrequent, we observed significantly lower fGCm in samples from whales exposed to DA (Figure 4). Our results agree with findings from a previous study in California sea lions (Zalophus californianus) exposed to DA, where these authors found a significant association of DA exposure with reduced serum cortisol (Gulland et al., 2009), which can be tentatively attributed to abnormal function of the adrenal axis due to the exposure.

Figure 4. Fecal glucocorticoid metabolite levels in southern right whales exposed (YES, solid triangles) and not-exposed (NO, open circles) to DA. Left panel: immunoreactive fecal corticosterone metabolites. Right panel: immunoreactive fecal cortisol metabolites. Hormone concentrations are expressed in ng of immunoreactive hormone per gram of dry fecal sample. Significant differences between groups are denoted with an asterisk (P<0.05). The black solid line indicates the mean for each group, and in parenthesis is the sample size for each group. Adapted from D’Agostino et al. 2021.

If ingestion of toxins produced by phytoplankton can result in long-term suppression of baseline GCs, whales and marine mammals in general, could suffer reduced ability to cope with additional stressors. The adrenal function is essential to maintain circulating blood glucose and other aspects of metabolism within normal bounds. Additionally, the ability to elevate GCs facilitates energy mobilization to physiologically cope with a stressful event and to initiate appropriate behavioral responses (i.e., flee from predators, heal wounds). Various toxicants have been shown to reduce adrenal function across taxa (Romero and Wingfield, 2016) and could have negative consequences on the ability of cetaceans to respond and adapt to ongoing environmental and anthropogenic changes. Compounding this problem, whales are exposed to an increasing number of stressors from multiple sources and with cumulative effects and they need to be able to physiologically respond to continue to reproduce and survive.

To our knowledge, this study provides the first quantification of fGCm levels in whales exposed to DA; and we hope this effort starts a growing dataset to which other researchers can add. Sampling and analysis of non-traditional matrices, such as feces, blubber, baleen and others, would likely increase sample sizes and thus our understanding of the interrelationships among DA exposure and age, sex, and reproductive status of cetaceans. Given that chronic exposure to DA could alter the capacity of animals to respond to stress, and indications that HABs are becoming more frequent and intense world-wide (Van Dolah 2000; Masó et al. 2006; Erdner et al. 2008), we believe that research evaluating the health status of marine mammal populations should include the assessment of stress physiology relative to natural and anthropogenic stressors including exposure to toxicants.

Did you enjoy this blog? Want to learn more about marine life, research, and conservation? Subscribe to our blog and get weekly updates and more! Just add your name into the subscribe box on the left panel.  

Loading

References

Bastida R, Rodríguez D (2009) Ballena franca austral [Southern right whale]. In: Mazzini V (ed) Mamíferos marinos de Patagonia y Antártida [Marine mammals of Patagonia and Antarctica]. Zagier & Urruty Publications, Buenos Aires, pp 72–84.

Bonier F, Moore IT, Martin PR, Robertson RJ (2009) The relationship between fitness and baseline glucocorticoids in a passerine bird. Gen Comp Endocrinol 163:208–213. https:// doi. org/ 10. 1016/j.ygcen. 2008. 12. 013.

Brann DW, Mahesh VB (1994) Excitatory amino acids: function and significance in reproduction and neuroendocrine regulation. Front Neuroendocrinol 15:3–49. https:// doi. org/ 10. 1006/ frne. 1994. 1002.

Broadwater MH, Van Dolah FM, Fire SE (2018) Vulnerabilities of marine mammals to harmful algal blooms. Harmful Algal Blooms 2:191–222.

Burgess, E.A., Hunt, K.E., Kraus, S.D., Rolland, R.M., 2016. Get the most out of blow hormones: Validation of sampling materials, field storage and extraction techniques for whale respiratory vapour samples. Conserv. Physiol. 4, cow024. https://doi.org/10.1093/conphys/cow024

Burgess, E.A., Hunt, K.E., Kraus, S.D., Rolland, R.M., 2018. Quantifying hormones in exhaled breath for physiological assessment of large whales at sea. Sci. Rep. 8, 10031. https://doi.org/10.1038/s41598-018-28200-8

D’Agostino VC, Hoffmeyer MS, Almandoz GO, Sastre V, Degrati M., 2015. Potentially toxic Pseudo-nitzschia species in plankton and fecal samples of Eubalaena australis from Península Valdés calv-ing ground, Argentina. J Sea Res 106:39–43. https:// doi. org/ 10.1016/j. seares.

D’Agostino, V.C., Degrati, M., Santinelli, N., Sastre, V., Dans, S.L., Hoffmeyer, M.S., 2018. The seasonal dynamics of plankton communities relative to the foraging of the southern right whale (Eubalaena australis) in northern Patagonian gulfs, Península Valdés, Argentina. Cont. Shelf Res. 164, 45–57. https://doi.org/10.1016/j.csr.2018.06.003

D’Agostino, V.C., Degrati, M., Sastre, V., Santinelli, N., Krock, B., Krohn, T., Dans, S.L., Hoffmeyer, M.S., 2017. Domoic acid in a marine pelagic food web: Exposure of southern right whales Eubalaena australis to domoic acid on the Península Valdés calving ground, Argentina. Harmful Algae 68, 248–257. https://doi.org/10.1016/j.hal.2017.09.001

D’Agostino, V.C., Hoffmeyer, M.S., Degrati, M., 2016. Faecal analysis of southern right whales (Eubalaena australis) in Península Valdés calving ground, Argentina: Calanus australis, a key prey species. J. Mar. Biol. Assoc. United Kingdom 96, 859–868. https://doi.org/10.1017/S0025315415001897

Dickens, M.J., Romero, L.M., 2013. A consensus endocrine profile for chronically stressed wild animals does not exist. Gen. Comp. Endocrinol. 191, 177–189. https://doi.org/10.1016/j.ygcen.2013.06.014

Erdner DL, Dyble J, Parsons ML, Stevens RC, Hubbard KA, Wrabel ML, Moore SK, Lefebvre KA, Anderson DM, Bienfang P, Bidi-gare RR, Parker MS, Moeller P, Brand LE, Trainer VL (2008) Centers for Oceans and Human Health: a unified approach to the challenge of harmful algal blooms. Environ Health 7:S2. https://doi. org/ 10. 1186/ 1476- 069X-7- S2- S2.

Fernández Ajó, A., Hunt, K.E., Dillon, D., Uhart, M., Sironi, M., Rowntree, V., Buck, C.L., 2021. Optimizing hormone extraction protocols for whale baleen: tackling questions of solvent:sample ratio and variation. Gen. Comp. Endocrinol. 113828. https://doi.org/10.1016/j.ygcen.2021.113828

Fernández Ajó, A.A., Hunt, K.E., Giese, A.C., Sironi, M., Uhart, M., Rowntree, V.J., Marón, C.F., Dillon, D., DiMartino, M., Buck, C.L., 2020. Retrospective analysis of the lifetime endocrine response of southern right whale calves to gull wounding and harassment: A baleen hormone approach. Gen. Comp. Endocrinol. 296, 113536. https://doi.org/10.1016/j.ygcen.2020.113536

Fernández Ajó, A.A., Hunt, K.E., Uhart, M., Rowntree, V., Sironi, M., Marón, C.F., Di Martino, M., Buck, C.L., 2018. Lifetime glucocorticoid profiles in baleen of right whale calves: potential relationships to chronic stress of repeated wounding by Kelp Gulls. Conserv. Physiol. 6, 1–12. https://doi.org/10.1093/conphys/coy045

Fire SE, Bogomolni A, DiGiovanni RA Jr, Early G, Leighfield TA, Matassa K, Miller GA, Moore KM, Moore M, Niemeyer M, Pugliares K (2021) An assessment of temporal, spatial and taxonomic trends in harmful algal toxin exposure in stranded marine mammals from the US New England coast. PLoS ONE 16(1):e0243570. https:// doi. org/ 10. 1371/ journ al. pone. 02435 70

Fire SE, Wang Z, Berman M, Langlois GW, Morton SL, Sekula-Wood E, Benitez-Nelson CR (2010) Trophic transfer of the harmful algal toxin domoic acid as a cause of death in a minke whale (Balaenoptera acutorostrata) stranding in southern California. Aquat Mamm 36(4):342–350. https:// doi. org/ 10. 1578/ AM. 36.4.2010. 342.

Gulland F.M., 1999. Domoic acid toxicity in California sea lions stranded along the central California Coast, May-October 1998. NOAA Tech. Memo. NMFS-OPR-8. USA National Marine Fisheries Service, US Department of Commerce.

Gulland FMD, Hall AJ, Greig DJ, Fram ER, Colegrove KM, Booth RKN, Wasser SK, S.-M.C., 2009. Gulland, Hall – 2012 – Evaluation of circulating eosinophil count and adrenal gland function in California sea lions naturally exposed t. J. Am. Vet. Med. Assoc. 241, 943–949.

Gulland, F., Pérez-Cortés, H., Urbán, J.R., Rojas-Bracho, L., Ylitalo, G., Weir, J., Norman, S., Muto, M., Rugh, D., Kreuder, C., Rowles, T., 2005. Eastern North Pacific gray whale (Eschrichtius robustus) unusual mortality event, 1999-2000. U.S. Dep. Commer. NOAA Tech. Memo. NMFS-AFSC-150. 33 pp.

Hunt, K.E., Robbins, J., Buck, C.L., Bérubé, M., Rolland, R.M., 2019. Evaluation of fecal hormones for noninvasive research on reproduction and stress in humpback whales (Megaptera novaeangliae). Gen. Comp. Endocrinol. 280, 24–34. https://doi.org/10.1016/j.ygcen.2019.04.004

Hunt, K.E., Rolland, R.M., Kraus, S.D., Wasser, S.K., 2006. Analysis of fecal glucocorticoids in the North Atlantic right whale (Eubalaena glacialis). Gen. Comp. Endocrinol. 148, 260–272. https://doi.org/10.1016/j.ygcen.2006.03.012

Hunt, K.E., Stimmelmayr, R., George, C., Hanns, C., Suydam, R., Brower, H., Rolland, R.M., 2014. Baleen hormones: a novel tool for retrospective assessment of stress and reproduction in bowhead whales (Balaena mysticetus). Conserv. Physiol. 2, cou030–cou030. https://doi.org/10.1093/conphys/cou030

Johnson MP, Kelly G, Chamberlain M (2001) Changes in rat serum corticosterone after treatment with metabotropic glutamate receptor agonists or antagonists. J Neuroendocrinol 13:670–677. https:// doi. org/ 10. 1046/j. 1365- 2826. 2001. 00678.x.

Lefebvre KA, Powell CL, Busman M, Doucette GJ, Moeller PDR, Sliver JB, Miller PE, Hughes MP, Singaram S, Silver MW, Tjeer-dema RS (1999) Detection of domoic acid in northern anchovies and California sea lions associated with an unusual mortality event. Nat Toxins 7(3):85–92. https:// doi. org/ 10. 1002/ (SICI) 1522-7189(199905/ 06)7: 3% 3C85:: AID- NT39% 3E3.0. CO;2-Q.

Lefebvre, K.A., Kendrick, P.S., Ladiges, W., Hiolski, E.M., Ferriss, B.E., Smith, D.R., Marcinek, D.J., 2017. Chronic low-level exposure to the common seafood toxin domoic acid causes cognitive deficits in mice. Harmful Algae 64, 20–29. https://doi.org/10.1016/j.hal.2017.03.003

Lemos, L.S., Olsen, A., Smith, A., Burnett, J.D., Chandler, T.E., Larson, S., Hunt, K.E., Torres, L.G., 2021. Stressed and slim or relaxed and chubby? A simultaneous assessment of gray whale body condition and hormone variability. Mar. Mammal Sci. 1–11. https://doi.org/10.1111/mms.12877

Lemos, L.S., Olsen, A., Smith, A., Chandler, T.E., Larson, S., Hunt, K., Torres, L.G., 2020. Assessment of fecal steroid and thyroid hormone metabolites in eastern North Pacific gray whales. Conserv. Physiol. 8. https://doi.org/10.1093/conphys/coaa110

Masó M, Garcés E., 2006. Harmful microalgae blooms (HAB); prob-lematic and conditions that induce them. Mar Pollut Bull 53:620–630. https:// doi. org/ 10. 1016/j. marpo lbul. 2006. 08. 006.

Pulido O.M., 2008. Domoic acid toxicologic pathology: a review. Mar Drugs 6(2):180–219. https:// doi. org/ 10. 3390/ md602 0180.

Rolland, R., McLellan, W., Moore, M., Harms, C., Burgess, E., Hunt, K., 2017. Fecal glucocorticoids and anthropogenic injury and mortality in North Atlantic right whales Eubalaena glacialis. Endanger. Species Res. 34, 417–429. https://doi.org/10.3354/esr00866

Rolland, R.M., Hunt, K.E., Kraus, S.D., Wasser, S.K., 2005. Assessing reproductive status of right whales (Eubalaena glacialis) using fecal hormone metabolites. Gen. Comp. Endocrinol. 142, 308–317. https://doi.org/10.1016/j.ygcen.2005.02.002

Romero, M.L., Wingfield, J.C., 2016. Oxford series in behavioral neuroendocrinology. Tempests, poxes, predators, and people: stress in wild animals and how they cope 1–2.

Sapolsky RM, Romero LM, Munck AU, 2000. How do glucocorti-coids influence stress response? Intergrating permissive, suppres-sive, stimulatory, and preparative actions. Endocr Rev 21:55–89. https:// doi. org/ 10. 1210/ edrv. 21.1. 0389.

Sastre V, Santinelli N, Marino G, Solís M, Pujato L, Ferrario M., 2007. First detection of domoic acid produced by Pseudo-nitzschia spe-cies, Chubut coastal waters, Patagonia, Argentina. Harmful Algae News 34:12–14.

Van Dolah FM., 2000. Marine algal toxins: origins, health effects, and their increased occurrence. Environ Health Perspect 108:133–141. https:// doi. org/ 10. 1289/ ehp. 00108 s1133

Memoirs from above: drone observations of blue, humpback, Antarctic minke, and gray whales

By KC Bierlich, Postdoctoral Scholar, OSU Department of Fisheries, Wildlife, & Conservation Sciences, Geospatial Ecology of Marine Megafauna Lab

With the GRANITE field season officially over, we are now processing all of the data we collected this summer. For me, I am starting to go through all the drone videos to take snapshots of each whale to measure their body condition. As I go through these videos, I am reflecting on the different experiences I am fortunate enough to have with flying different drones, in different environments, over different species of baleen whales: blue, humpback, Antarctic minke, and now gray whales. Each of these species have a different morphological design and body shape (Woodward et al., 2006), which leads to different behaviors that are noticeable from the drone. Drones create immense opportunity to learn how whales thrive in their natural environments [see previous blog for a quick history], and below are some of my memories from above. 

I first learned how drones could be used to study the morphology and behavior of large marine mammals during my master’s degree at Duke University, and was inspired by the early works of John Durban (Durban et al., 2015, 2016) Fredrick Christiansen (Christiansen et al., 2016) and Leigh Torres (Torres et al., 2018). I immediately recognized the value and utility of this technology as a new tool to better monitor the health of marine mammals. This revelation led me to pursue a PhD with the Duke University Marine Robotics and Remote Sensing (MaRRS) Lab led by Dr. Dave Johnston where I helped further develop tools and methods for collecting drone-based imagery on a range of species in different habitats. 

When flying drones over whales, there are a lot of moving parts; you’re on a boat that is moving, flying something that is moving, following something that is moving. These moving elements are a lot to think about, so I trained hard, so I did not have to think about each step and flying felt intuitive and natural. I did not grow up playing video games, so reaching this level of comfort with the controls took a lot of practice. I practiced for hours over the course of months before my first field excursion and received some excellent mentorship and training from Julian Dale, the lead engineer in the MaRRS Lab. Working with Julian and the many hours of training helped me establish a solid foundation in my piloting skills and feel confident working in various environments on different species. 

Blue whales offshore of Monterey, California. 

In 2017 and 2018 I was involved in collaborative project with the MaRRS Lab and Goldbogen Lab at Stanford University, where we tagged and flew drones over blue whales offshore of Monterey, California. We traveled about an hour offshore and reliably found groups of blue whales actively feeding. Working offshore typically brought a large swell, which can often make landing the drone back into your field partner’s hands tricky as everything is bobbing up and down with the oscillations of the swell. Fortunately, we worked from a larger research vessel (~56 ft) and quickly learned that landing the drone in the stern helped dampen the effects of bobbing up and down. The blue whales we encountered often dove to a depth of around 200 m for about 20-minute intervals, then come to the surface for only a few minutes. This short surface period provided only a brief window to locate the whale once it surfaced and quickly fly over it to collect the imagery needed before it repeated its dive cycle. We learned to be patient and get a sense of the animal’s dive cycle before launch in order to time our flights so the drone would be in the air a couple of minutes before the whale surfaced. 

Once over the whales, the streamlined body of the blue whales was noticeable, with their small, high aspect ratio flippers and fluke that make them so well adapted for fast swimming in the open ocean (Fig. 1) (Woodward et al., 2006). I also noticed that because these whales are so large (often 21 – 24 m), I often flew at higher altitudes to be able fit them within the field of view of the camera. It was also always shocking to see how small the tagging boat (~8 m) looked when next to Earth’s largest creatures. 

Figure 1. Two blue whales surface after a deep dive offshore of Monterey, Ca. (Image credit: Duke University Marine Robotics and Remote Sensing under NOAA permit 14809-03)

Antarctic minke whales and humpback whales along the Western Antarctic PeninsulaA lot of the data included in my dissertation came from work along the Western Antarctic Peninsula (WAP), which had a huge range of weather conditions, from warm and sunny days to cold and snowy/foggy/rainy/windy/icy days. A big focus was often trying to keep my hands warm, as it was often easier to fly without gloves in order to better feel the controls. One of the coldest days I remember was late in the season in mid-June (almost winter!) in Wilhemina Bay where ice completely covered the bay in just a couple hours, pushing the whales out into the Gerlache Strait; I suspect this was the last ice-free day of the season. Surprisingly though, the WAP also brought some of the best conditions I have ever flown in. Humpback and Antarctic minke whales are often found deep within the bays along the peninsula, which provided protection from the wind. So, there were times where it would be blowing 40 mph in the Gerlache Strait, but calm and still in the bays, such as Andvord Bay, which allowed for some incredible conditions for flying. Working from small zodiacs (~7 m) allowed us more maneuverability for navigating around or through the ice deep in the bays (Fig. 2) 

Figure 2. Navigating through ice-flows along the Western Antarctic Peninsula. (Image credit: Duke University Marine Robotics and Remote Sensing under NOAA permit 14809-03 and ACA permits 2015-011 and 2020-016.)

Flying over Antarctic minke whale was always rewarding, as they are very sneaky and can quickly disappear under ice flows or in the deep, dark water. Flying over them often felt like a high-speed chase, as their small streamlined bodies makes them incredibly quick and maneuverable, doing barrel rolls, quick banked turns, and swimming under and around ice flows (Fig. 3). There would often be a group between 3-7 individuals and it felt like they were playing tag with each other – or perhaps with me!  

Figure 3. Two Antarctic minke whales swimming together along the Western Antarctic Peninsula. (Image credit: Duke University Marine Robotics and Remote Sensing under NOAA permit 14809-03 and ACA permits 2015-011 and 2020-016.)

Humpbacks displayed a wide range of behaviors along the WAP. Early in the season they continuously fed throughout the entire day, often bubble net feeding in groups typically of 2-5 animals (Fig. 4). For as large as they are, it was truly amazing to see how they use their pectoral fins to perform quick accelerations and high-speed maneuvering for tight synchronized turns to form bubble nets, which corral and trap their krill, their main food source (Fig. 4) (Woodward et al., 2006). Later in the season, humpbacks switched to more resting behavior in the day and mostly fed at night, taking advantage of the diel vertical migration of krill. This behavior meant we often found humpbacks snoozing at the surface after a short dive, as if they were in a food coma. They also seemed to be more curious and playful with each other and with us later in the season (Fig. 5).

We also encountered a lot of mom and calf pairs along the WAP. Moms were noticeably skinny compared to their plump calf in the beginning of the season due to the high energetic cost of lactation (Fig. 6). It is important for moms to regain this lost energy throughout the feeding season and begin to wean their calves. I often saw moms refusing to give milk to their nudging calf and instead led teaching lessons for feeding on their own.

Figure 4. Two humpback whales bubble-net feeding early in the feeding season (December) along the Western Antarctic Peninsula. (Image credit: Duke University Marine Robotics and Remote Sensing under NOAA permit 14809-03 and ACA permits 2015-011 and 2020-016.)
Figure 5. A curious humpback whale dives behind our Zodiac along the Western Antarctic Peninsula. (Image credit: Duke University Marine Robotics and Remote Sensing under NOAA permit 14809-03 and ACA permits 2015-011 and 2020-016.)
Figure 6. A mom and her calf rest at the surface along the Western Antarctic Peninsula. Note how the mom looks skinnier compared to her plump calf, as lactation is the most energetically costly phase of the reproductive cycle. (Image credit: Duke University Marine Robotics and Remote Sensing under NOAA permit 14809-03 and ACA permits 2015-011 and 2020-016.)

Gray whales off Newport, Oregon

All of these past experiences helped me quickly get up to speed and jump into action with the GRANITE field team when I officially joined the GEMM Lab this year in June. I had never flown a DJI Inspire quadcopter before (the drone used by the GEMM Lab), but with my foundation piloting different drones, some excellent guidance from Todd and Clara, and several hours of practice to get comfortable with the new setup, I was flying over my first gray whale by day three of the job. 

The Oregon coast brings all sorts of weather, and some days I strangely found myself wearing a similar number of layers as I did in Antarctica. Fog, wind, and swell could all change within the hour, so I learned to make the most of weather breaks when they came. I was most surprised by how noticeably different gray whales behave compared to the blue, Antarctic minke, and humpback whales I had grown familiar with watching from above. For one, it is absolutely incredible to see how these huge whales use their low-aspect ratio flippers and flukes (Woodward et al., 2006) to perform low-speed, highly dynamic maneuvers to swim in very shallow water (5-10 m) so close to shore (<1m sometimes!) and through kelp forest or surf zones close to the beach. They have amazing proprioception, or the body’s ability to sense its movement, action, and position, as gray whales often use their pectoral fins and fluke to stay in a head standing position (see Clara Bird’s blog) to feed in the bottom sediment layer, all while staying in the same position and resisting the surge of waves that could smash them against the rocks (Video 1) . It is also remarkable how the GEMM Lab knows each individual whale based on natural skin marks, and I started to get a better sense of each whale’s behavior, including where certain individuals typically like to feed, or what their dive cycle might be depending on their feeding behavior. 

Video 1. Two Pacific Coast Feeding Group (PCFG) gray whales “head-standing” in shallow waters off the coast of Newport, Oregon. NOAA/NMFS permit #21678

I feel very fortunate to be a part of the GRANITE field team and to contribute to data collection efforts. I look forward to the data analysis phase to see what we learn about how the morphology and behavior of these gray whales to help them thrive in their environment. 

References: 

Christiansen, F., Dujon, A. M., Sprogis, K. R., Arnould, J. P. Y., and Bejder, L. (2016).Noninvasive unmanned aerial vehicle provides estimates of the energetic cost of reproduction in humpback whales. Ecosphere 7, e01468–18.

Durban, J. W., Fearnbach, H., Barrett-Lennard, L. G., Perryman, W. L., & Leroi, D. J. (2015). Photogrammetry of killer whales using a small hexacopter launched at sea. Journal of Unmanned Vehicle Systems3(3), 131-135.

Durban, J. W., Moore, M. J., Chiang, G., Hickmott, L. S., Bocconcelli, A., Howes, G., et al.(2016). Photogrammetry of blue whales with an unmanned hexacopter. Mar. Mammal Sci. 32, 1510–1515.

Torres, L. G., Nieukirk, S. L., Lemos, L., & Chandler, T. E. (2018). Drone up! Quantifying whale behavior from a new perspective improves observational capacity. Frontiers in Marine Science5, 319.

Woodward, B. L., Winn, J. P., and Fish, F. E. (2006). Morphological specializations of baleen whales associated with hydrodynamic performance and ecological niche. J. Morphol. 267, 1284–1294.

How much energy does that mouthful cost?

By Lisa Hildebrand, PhD student, OSU Department of Fisheries, Wildlife, & Conservation Sciences, Geospatial Ecology of Marine Megafauna Lab

Tagging a whale is no easy feat, nor is it without some impact to the whale – no matter how minimized through the use of non-penetrating suction cup tags. Yet, in August 2021 the GEMM Lab initiated a new phase in our research on gray whales, aimed at obtaining a better understanding of the underwater lives and energetics of a gray whale (Figure 1, top image). We captured some amazing data through these specialized, non-invasive tags that provide a brief window into their world and physiology. The video recordings from the tags showed us whales digging their heads into the benthos generating billowing clouds of sediment, likely exploiting desirable prey patches (Figure 1, middle images). We also saw foraging whales undertake dizzying spins and headstands for hours, demonstrating the fascinating maneuverability and flexibility of gray whales (Figure 1, bottom image). But what is motivating us to capture this information?

The GEMM Lab has researched the ecology and physiology of Pacific Coast Feeding Group (PCFG) gray whales since 2015. Our efforts have filled crucial knowledge gaps to better understand this sub-group of the Eastern North Pacific (ENP) gray whale population. We now know that gray whale body condition increases throughout a foraging season and can fluctuate considerably between years (Soledade Lemos et al. 2020). Additionally, body condition varies significantly by reproductive state, with calves and pregnant females displaying higher body conditions (Soledade Lemos et al. 2020). We have also validated and quantified fecal steroid and thyroid hormone metabolite concentrations, providing us with thresholds to identify a stressed vs. a not stressed whale based on its hormone levels (Lemos et al. 2020). These validations have allowed us to make correlations between poor body condition and the steroid hormone cortisol which confirm that slim whales are stressed, while chubby whales are relaxed (Lemos et al. 2021). These physiological results are particularly salient in the light of our recent findings that PCFG gray whales select prey quality over prey quantity when foraging (Hildebrand et al. in review) and that the caloric content of available prey species in the PCFG range vary significantly (Hildebrand et al. 2021).

While we have addressed several fundamental questions about the PCFG in the last 7 years, answering one question has led to asking 10 more questions – a common pattern in science. Given that we know (1) PCFG whales improve their body condition over the course of the foraging season (Soledade Lemos et al. 2020), (2) PCFG females are able to successfully give birth to and wean calves (Calambokidis & Perez 2017), and (3) certain prey in the PCFG region are of higher caloric value than prey in the ENP Arctic foraging grounds (Hildebrand et al. 2021), a big question that we continue to scratch our heads about is why does the PCFG sub-group have such a small abundance (~250 individuals; Calambokidis et al. 2017) in comparison to the much larger ENP population (~21,000 individuals; Stewart & Weller 2021). Several hypotheses have been suggested including that the energetic costs of feeding may differ between ENP and PCFG whales, with the latter having to expend more energy to obtain prey due to the different foraging behaviors employed (Torres et al. 2018) to obtain diverse prey types, thus justifying the larger abundance of the ENP (Hildebrand et al. 2021). 

Quantifying the energetic cost of baleen whale behaviors is not simple. However, the development of animal-borne tags has allowed scientists to make big strides regarding behavioral cost quantification. The majority of this work has focused on rorqual whales (i.e., blue, humpback, fin whales; e.g., Goldbogen et al. 2013; Cade et al. 2016) as their characteristic lunge-feeding strategy produces a distinct signal in the accelerometer sensors integrated within the tags, making feeding events easier to identify. Gray whales, unlike rorquals, do not lunge-feed. ENP gray whales predominantly feed benthically; diving down to the benthos where they turn onto their side and suction mouthfuls of soft sediment (mud) that contains amphipods that they filter out of the mud (Nerini & Oliver 1983). PCFG whales feed benthically as well, but they also use a number of other feeding behaviors to obtain a variety of prey in a variety of benthic habitats, including headstands, bubble blasts, and sharking (Torres et al. 2018). The above-mentioned gray whale feeding behaviors involve much subtler movements than the powerful, distinctive lunges displayed by rorquals, yet they undoubtedly still incur some energetic cost to the whales. However, exactly how energetically costly the various gray whale feeding behaviors are remains unknown.

One of the three suction cup tags we deployed on gray whales. Dr. Cade printed special “kelp shields” (blue part of the tag) to prevent kelp from potentially getting caught underneath the tag since PCFG whales often forage on reefs with a lot of kelp. This tag includes a video camera (the lens can be seen in the center of the tag) to record video of the whale’s underwater behavior. Source: L. Torres.

This knowledge gap is one of the reasons why the GEMM Lab initiated a new project in close collaboration with Dr. Dave Cade from Stanford University and John Calambokidis from Cascadia Research Collective to quantify and understand the energetics and underwater behavior of gray whales using suction-cup tags. The project was kick-started with a very successful pilot effort the week of August 16th this year. Tags were placed on the backs of three different PCFG gray whales with a long carbon fiber pole and attached to the whales with four suction cups. The tags recorded video, position, accelerometry, and magnetometry data, which we will use to recreate the animal’s movements (pitch, roll), heading, trackline, and environment. Although the weather forecast did not look promising for most of the week, we lucked out with perfect conditions for one day during which we managed to deploy three tags on three different gray whales that are well-known, long-term study animals of the GEMM Lab. The tags stayed on the whales for 1-6 hours and were all recovered (including an adventurous trip up the Alsea River which involved a kayak deployment!). 

Dr. Cade spent the rest of the week teaching GEMM Lab PI Leigh Torres, University of British Columbia Master’s student Kate Colson (who is co-advised by Leigh and Dr. Andrew Trites), and myself the intricacies of data download, processing, and preliminary analysis of the tag data. For her Master’s research, Kate will develop a bioenergetics model for the PCFG sub-group that includes data on foraging energetics (estimated from the tag data) and prey availability in the PCFG foraging range. I plan on using the tag data to assess behavior patterns of PCFG whales relative to habitat as part of my PhD research. All together analysis of the data from these short-term tag deployments will help us get closer to understanding the behavioral choices, habitat needs, and energetic trade-offs of whales living in a rapidly changing ocean. With the success of this pilot effort, we plan to conduct another suction-cup tagging effort next summer to hopefully capture and explore more mysterious underwater behaviors of the PCFG.

An ecstatic team at the end of a very long yet successful day of suction cup tagging. Bottom (from left): Leigh Torres, Lisa Hildebrand, Clara Bird, Dave Cade, KC Bierlich. Top: John Calambokidis.

This project was funded by sales and renewals of the special Oregon whale license plate, which benefits MMI. We gratefully thank all the gray whale license plate holders, who made this research effort possible.

Literature cited

Cade, D. E., Friedlaender, A. S., Calambokidis, J., & Goldbogen, J. A. 2016. Kinematic diversity in rorqual whale feeding mechanisms. Current Biology 26(19):2617-2624. doi:10.1016/j.cub.2016.07.037.

Calambokidis, J., & Perez, A. 2017. Sightings and follow-up of mothers and calves in the PCFG and implications for internal recruitment. IWC Report SC/A17/GW/04 for the Workshop on the Status of North Pacific Gray Whales (La Jolla: IWC). 

Calambokidis, J., Laake, J., & Perez, A. 2017. Updated analysis of abundance and population structure of seasonal gray whales in the Pacific Northwest, 1996-2015. IWC Report SC/A17/GW/05 for the Workshop on the Status of North Pacific Gray Whales (La Jolla: IWC).

Goldbogen, J. A., Friedlaender, A. S., Calambokidis, J., McKenna, M. F., Simon, M., & Nowacek, D. P. 2013. Integrative approaches to the study of baleen whale diving behavior, feeding performance, and foraging ecology. BioScience 63(2):90-100. doi:10.1525/bio.2013.63.2.5.

Hildebrand, L., Bernard, K. S., & Torres, L. G. 2021. Do gray whales count calories? Comparing energetic values of gray whale prey across two different feeding grounds in the eastern North Pacific. Frontiers in Marine Science 1008. doi:10.3389/fmars.2021.683634.

Lemos, L. S., Olsen, A., Smith, A., Burnett, J. D., Chandler, T. E., Larson, S., Hunt, K. E., & Torres, L. G. 2021. Stressed and slim or relaxed and chubby? A simultaneous assessment of gray whale body condition and hormone variability. Marine Mammal Science. doi:10.111/mms.12877.

Lemos, L.S., Olsen, A., Smith, A., Chandler, T.E., Larson, S., Hunt, K., and L.G. Torres. 2020. Assessment of fecal steroid and thyroid hormone metabolites in eastern North Pacific gray whales. Conservation Physiology 8:coaa110.

Nerini, M. K., & Oliver, J. S. 1983. Gray whales and the structure of the Bering Sea benthos. Oecologia 59:224-225. doi:10.1007/bf00378840.

Soledade Lemos, L., Burnett, J. D., Chandler, T. E., Sumich, J. L., & Torres, L. G. 2020. Intra- and inter-annual variation in gray whale body condition on a foraging ground. Ecosphere 11(4):e03094.

Stewart, J. D., & Weller, D. W. 2021. Abundance of eastern North Pacific gray whales 2019/2020. Department of Commerce, NOAA Technical Memorandum NMFS-SWFSC-639. United States: NOAA. doi:10.25923/bmam-pe91.

Torres, L.G., Nieukirk, S.L., Lemos, L., and T.E. Chandler. 2018. Drone Up! Quantifying Whale Behavior From a New Perspective Improves Observational Capacity. Frontiers in Marine Science: https://doi.org/10.3389/fmars.2018.00319.


Supporting marine life conservation as an outsider: Blue whales and earthquakes

By Mateo Estrada Jorge, Oregon State University undergraduate student, GEMM Lab REU Intern

Introduction

My name is Mateo Estrada and this past summer I had the pleasure of working with Dawn Barlow and Dr. Leigh Torres as a National Science Foundation (NSF) Research Experience for Undergraduates (REU) intern. I had the chance to proactively learn about the scientific method in the marine sciences by studying the acoustic behaviors of pygmy blue whales (Balaenoptera musculus brevicauda) that are documented residents of the South Taranaki Bight region in New Zealand (Torres 2013, Barlow et al. 2018). I’ve been interested in conducting scientific research since I began my undergraduate education at Oregon State University in 2015. Having the opportunity to apply the skills I gained through my education in this REU has been a blessing. I’m a physics and computer science major, but more than anything I’m a scientist and my passion has taken me in new, unexpected directions that I’m going to share in this blog post. My message for any students who feel like they haven’t found their path yet is: hang in there, sometimes it takes time for things to take shape. That has been my experience and I’m sure it’s been the experience of many people interested in the sciences. I’m a Physics and Computer Science student, so why am I studying blue whales, and more specifically, how can I be doing marine science research having only taken intro to biology 101?

My background

I decided to apply for the REU in the Spring 2021 because it was a chance to use my programming skills in the marine sciences. I’m also passionate about conservation and protecting the environment in a pragmatic way, so I decided to find a niche where I could put my technical skills to good use. Finally, I wanted to explore a scientific field outside of my area of expertise to grow as a student and to learn from other researchers. I was mostly inspired by anecdotal tales of Physicist Richard Feynman who would venture out of the physics department at Caltech and into other departments to learn about what other scientists were investigating to inspire his own work. This summer, I ventured into the world of marine science, and what I found in my project was fascinating.

Whale watching tour

Figure 1. Me standing on a boat on the Pacific Ocean off Long Beach, CA.

To get into the research mode, I decided to go on a whale watching tour with the Aquarium of the Pacific. The tour was two hours long and the sunburn was worth it because we got to see four blue whales off the Long Beach coast in California. I got to see the famous blue whale blow and their splashes. It was the first time I was on a big boat in the ocean, so naturally I got seasick (Fig 1). But it was exciting to get a chance to see blue whales in action (luckily, I didn’t actually hurl). The marine biologist onboard also gave a quick lecture on the relative size of blue whales and some of their behaviors. She also pointed out that they don’t use Sonar to locate whales as this has been shown to disturb their calling behaviors. Instead, we looked for a blow and splashing. The tour was a wonderful experience and I’m glad I got to see some whales out in nature. This experience also served as a reminder of the beauty of marine life and the responsibility I feel for trying to understand and help conserving it.

Context of blue whale calling

Sound plays a significant role in the marine environment and is a critical mode of communication for many marine animals including baleen whales. Blue whales produce different vocalizations, otherwise known as calls.  Blue whale song is theorized to be produced by males of the species as a form of reproductive behavior, similar to how male peacocks engage females by displaying their elongated upper tail covert feathers in iridescent colors as a courtship mechanism. Then there are “D calls” that are associated with social mechanisms while foraging, and these calls are made by both female and male blue whales (Lewis et al. 2018) (Fig. 2).

Figure 2. Spectrogram of Pygmy blue whale D calls manually (and automatically) selected, frequency 0-150 Hz.

Understanding research on blue whales

The most difficult part about coming into a project as an outsider is catching up. I learned how anthropogenetic (human made) noise affects blue whale communication. For example, it has been showing that Mid Frequency Active Sonar signals employed by the U.S. Navy affect blue whale D calling patterns (Melcón 2012). Furthermore, noise from seismic airguns used for oil and gas exploration has also impact blue whale calling behavior (Di Lorio, 2010). Understanding the environmental context in which the pygmy blue whales live and the anthropogenic pressures they face is essential in marine conservation. Protecting the areas in which they live is important so they can feed, reproduce and thrive effectively. What began as a slowly falling snowflake at the start of a snowstorm turned into a cascading avalanche of knowledge pouring into my mind in just two weeks.

Figure 3. The white stars show the hydrophone locations (n = 5). A bathymetric scale of the depth is also given.

The research question I set out to tackle in my internship was: do blue whales change their calling behavior in response to natural noise events from earthquake activity? To do this, I used acoustic recordings from five hydrophones deployed in the South Taranaki Bight (Fig. 3), paired with an existing dataset of all recorded earthquakes in New Zealand (GeoNet). I identified known earthquakes in our acoustic recordings, and then examined the blue whale D calls during 4 hours before and after each earthquake event to look for any change in the number of calls, call energy, entropy, or bandwidth.

A great mentor and lab team

The days kept passing and blending into each other, as they often do with remote work. I began to feel isolated from the people I was working with and the blue whales I was studying. The zoom calls, group chats, and working alongside other remote interns kept me afloat as I adapted to a work world fully online. Nevertheless, I was happy to continue working on this project because I felt like I was slowly becoming part of the GEMM Lab. I would meet with my mentor Dawn Barlow at least once a week and we would spend time talking about the project and sorting out the difficult details of data processing. She always encouraged my curiosity to ask questions. Even if they were silly questions, she was happy to ponder them because she is a curious scientist like myself.

What we learned

Pygmy blue whales from the South Taranaki Bight region do not change their acoustic behavior in response to earthquake activity. The energy of the earthquake, magnitude, depth, and distance to the origin all had no influence on the number of blue whale D calls, the energy of their calling, the entropy, and the bandwidth. A likely reason for why the blue whales would have no acoustic response to earthquakes (magnitude < 5) is that the STB region is a seismically active region due to the nearby interface of the Australian and Pacific plates. Because of the plate tectonics, the region averages about 20,000 recorded earthquakes per year (GeoNet: Earthquake Statistics). Given that pygmy blue whales are present in the STB region year-round (Barlow et al. 2018), the blue whales may have adapted to tolerate the earthquake activity (Fig 4).

Figure 4. Earthquake signal from MARU (1, 2, 3, 4, 5) and blue whale D calls, Frequency 0-150 Hz.

Looking at the future

I presented my work at the end of my REU internship program, which was a difficult challenge for me because I am often intimidated by public speaking (who isn’t?). Communicating science has always been a big interest of me. I love reading news articles about new breakthroughs and being a small part of that is a huge privilege for me. Finding my own voice and having new insights to contribute to the scientific world has always been my main objective. Now I will get to deliver a poster presentation of my REU work at the Association for the Sciences of Limnology and Oceanography (ASLO) Conference in March 2022. I am both excited and nervous to take on this new adventure of meeting seasoned professionals, communicating my results, and learning about the ocean sciences. I hope to gain new inspirations for my future academic and professional work.

References:

About Earthquake Drums – GeoNet. geonet.Org. Retrieved June 23, 2021, from https://www.geonet.org.nz/about/earthquake/drums

Barlow, D. R., Torres, L. G., Hodge, K. B., Steel, D., Scott Baker, C., Chandler, T. E., Bott, N., Constantine, R., Double, M. C., Gill, P., Glasgow, D., Hamner, R. M., Lilley, C., Ogle, M., Olson, P. A., Peters, C., Stockin, K. A., Tessaglia-Hymes, C. T., & Klinck, H. (2018). Documentation of a New Zealand blue whale population based on multiple lines of evidence. Endangered Species Research, 36, 27–40. https://doi.org/10.3354/esr00891

Di Iorio, L., & Clark, C. W. (2010). Exposure to seismic survey alters blue whale acoustic communication. Biology Letters, 6(3), 334–335. https://doi.org/10.1098/rsbl.2009.0967

Lewis, L. A., Calambokidis, J., Stimpert, A. K., Fahlbusch, J., Friedlaender, A. S., McKenna, M. F., Mesnick, S. L., Oleson, E. M., Southall, B. L., Szesciorka, A. R., & Sirović, A. (2018). Context-dependent variability in blue whale acoustic behaviour. Royal Society Open Science, 5(8). https://doi.org/10.1098/rsos.180241

Melcón, M. L., Cummins, A. J., Kerosky, S. M., Roche, L. K., Wiggins, S. M., & Hildebrand, J. A. (2012). Blue whales respond to anthropogenic noise. PLoS ONE, 7(2), 1–6. https://doi.org/10.1371/journal.pone.0032681

Torres LG. 2013 Evidence for an unrecognised blue whale foraging ground in New Zealand. NZ J. Mar. Freshwater Res. 47, 235–248. (doi:10. 1080/00288330.2013.773919)

Where are all the whales: Thoughts from the first half of the Port Orford project 2021

By Damian Amerman-Smith, Pacific High School senior, GEMM Lab summer intern

Left to right: Damian, Nadia, Jasen. The group scans the ocean looking for whales, while Damian puts on sunscreen. Source: A. Dawn. 

Growing up in Port Orford, a short ten-minute walk from the Pacific Ocean, has certainly shaped my life a lot. It has given me a great regard for the ocean, the diversity of life within it, and how life seems to bypass human derived borders in order to go wherever it can. I often marvel at all the beautiful, intricate ecosystems that are able to exist inside of our planet’s vast oceanic expanses. Along with my love of the ocean has come a great regard for marine mammals and the novelties of these animals that allow them to live entirely in the ocean despite not having gills. Every new discovery of these beautiful ocean creatures brings me such simple and pure joy, such as my very recent discovery that baleen whales have two blow holes. These blow holes look so peculiar on the top of their bodies, like a short upside-down nose. 

Photo of a gray whale’s blow hole. Source: NOAA.

My interest in the ocean and its inhabitants was a large part of what made me so enthused to take a part in the gray whale foraging ecology (GWFE) project in Port Orford this summer. When Elizabeth Kelly, my friend and a previous intern for the GWFE project mentioned her experiences from the previous summer, I was very happy when she put me in contact with Lisa Hildebrand and Leigh Torres so that I could apply to be an intern. Since then, I have been very ecstatically awaiting the beginning of the project and could hardly believe it when it finally began, and I was able to meet my fellow team members: Lisa Hildebrand, the PhD student who has been leading the GWFE project for the last four years; Allison Dawn, a Master’s student who is going to take over the project in Lisa’s stead; Nadia Leal, an OSU undergrad hoping to further pursue the field of marine biology; and Jasen White, an OSU undergrad whose time in the Navy has made him a very steeling presence while out on the water. 

The three weeks that we have spent together learning the procedures that make up the project have been well spent, teaching all of us a lot of new things, such as what a theodolite is, how to operate a dissolved oxygen sensor, and (for me) how to use Excel. The first two weeks were largely spent just learning about how we collect data and improving our field skills, but as we have become more comfortable with our skills, we have also begun looking beyond the procedures, towards the data itself and what it can mean. Primarily, we started to notice the distinct lack of gray whales and almost complete lack of zooplankton prey for any gray whales in the area to eat. 

A calm & beautiful, yet whale-less, view from the cliff site. Source: L. Hildebrand.

As we pass the halfway point in the project, we have only witnessed two whales inside our study area. While in the beginning it was not surprising that there were no whales, it has started to become concerning to me. We have a strong working hypothesis about why there have not been many whale sightings in our monitored sites of Mill Rocks and Tichenor’s Cove: there is not nearly enough zooplankton prey to attract them. Monday, August 9th is a good example to support this hypothesis. On that day, when we pulled up our sample net at Tichenor Cove station #1, we collected fifty-three individual Neomysis mysid shrimp, which are a tasty treat for gray whales. However, all the other prey samples from the remaining eleven kayak sampling stations had perhaps a maximum of five assorted zooplankton each, which is certainly not enough to attract the attention of such a large predator as Eschrichtius robustus (a gray whale). Unfortunately, we have yet to see much change in zooplankton prey availability in our sampling nets over the season so far, but we are hopeful that swarms of zooplankton in the area will resurge and the gray whales will begin using the area around the port as their August feeding grounds.

Our hopes aside, it is intriguing to think about why there has been so few zooplankton at our sampling sites. A main factor is likely the decrease of Port Orford’s kelp forests over the past few years. Kelp is very important to zooplankton, particularly mysids, as it allows them to seek shelter from predators. Declines in kelp forests have been documented all along the southern Oregon coast, and are believed to be fueled by many factors (ORKA, 2021). A combination of warming waters with decreasing amount of nutrients available to the kelp (Richardson 2008), and the increasing abundances of purple sea urchins that eat the kelp has vastly impacted the amount of kelp in the area. The decline in local kelp forests may be the reason that we are seeing fewer mysid swarms than in previous years. This reduced kelp and mysid availability could, in turn, be making Port Orford waters an unappetizing area for hungry whales to visit this year. While this trophic cascade is still just an educated hypothesis, it is important for us and others to keep watch on the situation, and to see how it changes. There are organizations such as the Oregon Kelp Alliance (ORKA) that are working hard to study why the kelp populations are hurting and how we can help. We will power through the season with the hopes that the gray whales will come. It is still very possible that the zooplankton will resurge and the whales will return with plenty to feed on.

References

Richardson, Anthony J. 2008. In hot water: zooplankton and climate change, ICES Journal of Marine Science, Volume 65, Issue 3, Pages 279–295, https://doi.org/10.1093/icesjms/fsn028

ORKA, 2021. “Kelp.” Oregon Kelp Alliancewww.oregonkelp.com/.