Hundreds and hundreds and hundreds of models: An ecologist’s love for programming

By Dawn Barlow, PhD student, Department of Fisheries & Wildlife, Geospatial Ecology of Marine Megafauna Lab

When people hear that I study blue whales, they often ask me questions about what it’s like to be close to the largest animal on the planet, where we do fieldwork, and what data we are interested in collecting. While I love time at sea, my view on a daily basis is rarely like this:

Our small research vessel at sunset in New Zealand’s South Taranaki Bight at the end of a day of blue whale survey. Photo by D. Barlow.

More often than not, it looks something like this:

In my application letter to Dr. Leigh Torres, I wrote something along the lines of “while I relish remote fieldwork, I also find great satisfaction in the analysis process.” This statement is increasingly true for me as I grow more proficient in statistical modeling and computer programming. When excitedly telling my family about how I am trying to model relationships between oceanography, krill, whales, and satellite imagery, I was asked what I meant by “model”. Put simply, a model is a formula or equation that we can use to describe a pattern. I have been told, “all models are wrong, but some models work.” What does this mean? While we may never know exactly every pattern of whale feeding behavior, we can use the data we have to describe some of the important relationships. If our model performance is very good, then we have likely described most of what drives the patterns we see. If model performance is poor, then there is more to the pattern that we have not yet captured in either our data collection or in our analytical methods. Another common saying about models is, “A model is only ever as good as the data you put into it.” While we worked hard during field seasons to collect a myriad of data about what could be influencing blue whale distribution patterns, we inevitably could not capture everything, nor do we know everything that should be measured.

So, how do you go about finding the ‘best’ model? This question is what I’ve been grappling with over the last several weeks. My goal is to describe the patterns in the krill that drive patterns in whale distribution, the patterns in oceanography that drive patterns in the krill, and the patterns in the oceanography that drive patterns in whale distribution. The thing is, we have many metrics to describe oceanographic patterns (surface temperature, mixed layer depth, strength of the thermocline, integral of fluorescence, to name just a few), as well as several metrics to describe the krill (number of aggregations, aggregation density, depth, and thickness). When I multiplied out how many possible combinations of predictor variables and parameters we’re interested in modeling, I realized this meant running nearly 300 models in order to settle on the best ten. This is where programming comes in, I told myself, and caught my breath.

I’ve always loved languages. When I was much younger, I thought I might want to study linguistics. As a graduate student in wildlife science, the language I’ve spent the most time learning, and come to love, is the statistical programming language R. Just like any other language, R has syntax and structure. Like any other language, there are many ways in which to articulate something, to make a particular point or reach a particular end goal. Well-written code is sometimes described as “elegant”, much like a well-articulated piece of writing. While I certainly do not consider myself “fluent” in R, it is a language I love learning. I like to think that the R scripts I write are an attempt to eloquently uncover and describe ecological patterns.

Rather than running 300 models one by one, I wrote an R script to run many models at a time, and then sort the outputs by model performance. I may look at the five best models of 32 options in order to select one. But this is where Leigh reminds me to step back from the programming for a minute and put my ecologist hat back on. Insight on the part of the modeler is needed in order to discern between what are real ecological relationships and what are spurious correlations in the data. It may not be quite as simple as choosing the model with the highest explanatory power when my goal is to make ecological inferences.

So, where does this leave me? Hundreds of models later, I am still not entirely sure which ones are best, although I’ve narrowed it down considerably. My programming proficiency and confidence continue to grow, but that only goes so far in ecology. Knowledge of my study system is equally important. So my workflow lately goes something like this: write code, try to interpret model outputs, consider what I know about the oceanography of my study region, re-write code, re-interpret the revised results, and so on. Hopefully this iterative process is bringing us gradually closer to an understanding of the ecology of blue whales on a foraging ground… stay tuned.

A blue whale lunges on an aggregation of krill in New Zealand’s South Taranaki Bight. Drone piloted by Todd Chandler.

Why Feeling Stupid is Great: How stupidity fuels scientific progress and discovery

By Alexa Kownacki, Ph.D. Student, OSU Department of Fisheries and Wildlife, Geospatial Ecology of Marine Megafauna Lab

It all started with a paper. On Halloween, I sat at my desk, searching for papers that could answer my questions about bottlenose dolphin metabolism and realized I had forgotten to check my email earlier. In my inbox, there was a new message with an attachment from Dr. Leigh Torres to the GEMM Lab members, saying this was a “must-read” article. The suggested paper was Martin A. Schwartz’s 2008 essay, “The importance of stupidity in scientific research”, published in the Journal of Cell Science, highlighted universal themes across science. In a single, powerful page, Schwartz captured my feelings—and those of many scientists: the feeling of being stupid.

For the next few minutes, I stood at the printer and absorbed the article, while commenting out loud, “YES!”, “So true!”, and “This person can see into my soul”. Meanwhile, colleagues entered my office to see me, dressed in my Halloween costume—as “Amazon’s Alexa”, talking aloud to myself. Coincidently, I was feeling pretty stupid at that moment after just returning from a weekly meeting, where everyone asked me questions that I clearly did not have the answers to (all because of my costume). This paper seemed too relevant; the timing was uncanny. In the past few weeks, I have been writing my PhD research proposal —a requirement for our department— and my goodness, have I felt stupid. The proposal outlines my dissertation objectives, puts my work into context, and provides background research on common bottlenose dolphin health. There is so much to know that I don’t know!

Alexa dressed as “Amazon Alexa” on Halloween at her office in San Diego, CA.

When I read Schwartz’s 2008 paper, there were a few takeaway messages that stood out:

  1. People take different paths. One path is not necessarily right nor wrong. Simply, different. I compared that to how I split my time between OSU and San Diego, CA. Spending half of the year away from my lab and my department is incredibly challenging; I constantly feel behind and I miss the support that physically being with other students provides. However, I recognize the opportunities I have in San Diego where I work directly with collaborators who teach and challenge me in new ways that bring new skills and perspective.

    Image result for different ways
    (Image source: St. Albert’s Place)
  2. Feeling stupid is not bad. It can be a good feeling—or at least we should treat it as being a positive thing. It shows we have more to learn. It means that we have not reached our maximum potential for learning (who ever does?). While writing my proposal I realized just how little I know about ecotoxicology, chemistry, and statistics. I re-read papers that are critical to understanding my own research, like “Nontargeted biomonitoring of halogenated organic compounds in two ecotypes of bottlenose dolphins (Tursiops truncatus) from the Southern California bight” (2014) by Shaul et al. and “Bottlenose dolphins as indicators of persistent organic pollutants in the western north Atlantic ocean and northern gulf of Mexico” (2011) by Kucklick et al. These articles took me down what I thought were wormholes that ended up being important rivers of information. Because I recognized my knowledge gap, I can now articulate the purpose and methods of analysis for specific compounds that I will conduct using blubber samples of common bottlenose dolphins

    Image result
    Image source: memegenerator.net
  3. Drawing upon experts—albeit intimidating—is beneficial for scientific consulting as well as for our mental health; no one person knows everything. That statement can bring us together because when people work together, everyone benefits. I am also reminded that we are our own harshest critics; sometimes our colleagues are the best champions of our own successes. It is also why historical articles are foundational. In the hunt for the newest technology and the latest and greatest in research, it is important to acknowledge the basis for discoveries. My data begins in 1981, when the first of many researchers began surveying the California coastline for common bottlenose dolphins. Geographic information systems (GIS) were different back then. The data requires conversions and investigative work. I had to learn how the data were collected and how to interpret that information. Therefore, it should be no surprise that I cite literature from the 1970s, such as “Results of attempts to tag Atlantic Bottlenose dolphins, (Tursiops truncatus)” by Irvine and Wells. Although published in 1972, the questions the authors tried to answer are very similar to what I am looking at now: how are site fidelity and home ranges impacted by natural and anthropogenic processes. While Irvine and Wells used large bolt tags to identify individuals, my project utilizes much less invasive techniques (photo-identification and blubber biopsies) to track animals, their health, and their exposures to contaminants.

    Image result for that is why you fail yoda
    (Image source: imgflip.com)
  4. Struggling is part of the solution. Science is about discovery and without the feeling of stupidity, discovery would not be possible. Feeling stupid is the first step in the discovery process: the spark that fuels wanting to explore the unknown. Feeling stupid can lead to the feeling of accomplishment when we find answers to those very questions that made us feel stupid. Part of being a student and a scientist is identifying those weaknesses and not letting them stop me. Pausing, reflecting, course correcting, and researching are all productive in the end, but stopping is not. Coursework is the easy part of a PhD. The hard part is constantly diving deeper into the great unknown that is research. The great unknown is simultaneously alluring and frightening. Still, it must be faced head on. Schwartz describes “productive stupidity [as] being ignorant by choice.” I picture this as essentially blindly walking into the future with confidence. Although a bit of an oxymoron, it resonates the importance of perseverance and conviction in the midst of uncertainty.

    Image result for funny t rex
    (Image source: Redbubble)

Now I think back to my childhood when stupid was one of the forbidden “s-words” and I question whether society had it all wrong. Maybe we should teach children to acknowledge ignorance and pursue the unknown. Stupid is a feeling, not a character flaw. Stupidity is important in science and in life. Fascination and emotional desires to discover new things are healthy. Next time you feel stupid, try running with it, because more often than not, you will learn something.

Image may contain: 1 person, sitting, table, child and outdoor
Alexa teaching about marine mammals to students ages 2-6 and learning from educators about new ways to engage young students. San Diego, CA in 2016. (Photo source: Lori Lowder)

Oregon Sea Otter Status of Knowledge Symposium

By Dominique Kone, Masters Student in Marine Resource Management

Over the past year, the GEMM Lab has been investigating the ecological factors associated with a potential sea otter reintroduction to Oregon. A potential reintroduction is not only of great interest to our lab, but also to several other researchers, managers, tribes, and organizations in the state. With growing interest, this idea is really starting to gain momentum. However, the best path forward to making this idea a reality is somewhat unknown, and will no doubt take a lot of time and effort from multiple groups.

In an effort to catalyze this process, the Elakha Alliance – led by Bob Bailey – organized the Oregon Sea Otter Status of Knowledge Symposium earlier this month in Newport, OR. The purpose of this symposium was to share information, research, and lessons learned about sea otters in other regions. Speakers – primarily scientists, managers, and graduate students – flew in from all over the U.S. and the Canadian west coast to share their expertise and discuss various factors that must be considered before any reintroduction efforts begin. Here, I review some of the key takeaways from those discussions.

Source: The Elakha Alliance

To start the meeting, Dr. Anne Salomon – an associate professor from Simon Fraser University – and Kii’iljuus Barbara Wilson – a Haida Elder – gave an overview of the role of sea otters in nearshore ecosystems and their significance to First Nations in British Columbia. Hearing these perspectives not only demonstrated the various ecological effects – both direct and indirect – of sea otters, but it also illustrated their cultural connection to indigenous people and the role tribes can play (and currently do play in British Columbia) in co-managing sea otters. In Oregon, we need to be aware of all the possible effects sea otters may have on our ecosystems and acknowledge the opportunity we have to restore these cultural connections to Oregon’s indigenous people, such as the Confederated Tribes of Siletz Indians.

Source: The Elakha Alliance and the Confederated Tribes of Siletz Indians.

The symposium also involved several talks on the recovery of sea otter populations in other regions, as well as current limitations to their population growth. Dr. Lilian Carswell and Dr. Deanna Lynch – sea otter and marine conservation coordinators with the U.S. Fish & Wildlife Service – and Dr. Jim Bodkin – a sea otter ecologist – provided these perspectives. Interestingly, not all stocks are recovering at the same rate and each population faces slightly different threats. In California, otter recovery is slowed by lack of available food and mortality due to investigative shark bites, which prevents range expansion. In other regions, such as Washington, the population appears to be growing rapidly and lack of prey and shark bite-related mortality appear to be less important. However, this population does suffer from parasitic-related mortality. The major takeaway from these recovery talks is that threats can be localized and site-specific. In considering a reintroduction to Oregon, it may be prudent to investigate if any of these threats and population growth limitations exist along our coastline as they could decrease the potential for sea otters to reestablish.

Source: The Seattle Aquarium and U.S. Fish & Wildlife Service.

Dr. Shawn Larson – a geneticist and ecologist from the Seattle Aquarium – gave a great overview of the genetic research that has been conducted for historical (pre-fur trade) Oregon sea otter populations. She explained that historical Oregon populations were genetically-similar to both southern and northern populations, but there appeared to be a “genetic gradient” where sea otters near the northern Oregon coast were more similar to northern populations – ranging to Alaska – and otters from the southern Oregon coast were more similar to southern populations – ranging to California. Given this historic genetic gradient, reintroducing a mixture of sea otters – subsets from contemporary northern and southern stocks – should be considered in a future Oregon reintroduction effort. Source-mixing could increase genetic diversity and may more-closely resemble genetic diversity levels found in the original Oregon population.

At the end of the meeting, an expert panel – including Dr. Larson, Dr. Bodkins, Dr. Lynch, and Dr. Carswell – provided their recommendations on ways to better inform this process. To keep this brief, I’ll discuss the top three recommendations I found most intriguing and important.

  1. Gain a better understanding of sea otter social behavior. Sea otters have strong social bonds, and previous reintroductions have failed because relocated individuals returned to their capture sites to rejoin their source populations. While this site fidelity behavior is relatively understood, we know less about the driving mechanisms – such as age or sex – of those behaviors. Having a sound understanding of these behaviors and their mechanisms could help to identify those which may hinder reestablishment following a reintroduction.
  2. When anticipating the impacts of sea otters on ecosystems, investigate the benefits too. When we think of impacts, we typically think of costs. However, there are documented benefits of sea otters, such as increasing species diversity (Estes & Duggins 1995, Lee et al. 2016). Identifying these benefits – as well as to people – would more completely demonstrate their importance.
  3. Investigate the human social factors and culture in Oregon relative to sea otters, such as perceptions of marine predators. Having a clear understanding of people’s attitudes toward marine predators – particularly marine mammals – could help managers better anticipate and mitigate potential conflicts and foster co-existence between otters and people.
Source: Paul Malcolm

While much of the symposium was focused on learning from experts in other regions, I would be remiss if I didn’t recognize the great talks given by a few researchers in Oregon – including Sara Hamilton (OSU doctoral student), Dr. Roberta Hall (OSU emeritus professor), Hannah Wellman (University of Oregon doctoral student), and myself. Individually, we spoke about the work that has already been done and is currently being done on this issue – including understanding bull kelp ecology, studying sea otter archaeological artifacts, and a synthesis of the first Oregon translocation attempt. Collectively, our talks provided some important context for everyone else in the room and demonstrated that we are working to make this process as informed as possible for managers. Oregon has yet to determine if they will move forward with a sea otter reintroduction and what that path forward will look like. However, given this early interest – as demonstrated by the symposium – we, as researchers, have a great opportunity to help guide this process and provide informative science.

References:

Estes, J. A. and D. O. Duggins. 1995. Sea otters and kelp forests in Alaska: generality and variation in a community ecological paradigm. Ecological Monographs. 65: 75-100.

Lee, L. C., Watson, J. C., Trebilco, R., and A. K. Salomon. 2016. Indirect effects and prey behavior mediate interactions between an endangered prey and recovering predator. Ecosphere. 7(12).

The Beauty of Scientific Conferences

By Lisa Hildebrand, MSc student, OSU Department of Fisheries and Wildlife, Geospatial Ecology of Marine Megafauna Lab

Science is truly meaningful because it is shared amongst colleagues and propagated to the wider public. There are many mediums through which information dissemination can occur. A common and most rigorous form is the peer-review scientific publication of papers. The paper approval process is vigorous, can last a long time – sometimes on the scale of several years – and is therefore an excellent way of vetting science that is occurring all over the world in many different disciplines. New studies build upon the results and downfalls of others, and therefore the process of research and communication of knowledge is continuous.

However, scientific journals and the publications within them can be quite exclusive; they are often only accessible to certain members of the scientific community or of an educational institution. For a budding scientist who is not affiliated with an institution, it can be very hard to get your hands on current research. Having said that, this issue is slowly becoming inconsequential since open access and free journals, such as PeerJ, are becoming more prevalent.

How some students feel after reading scientific publications. Source: Know Your Meme.

Something that is perhaps more restrictive is the amount of topic-specific jargon used in publications. While a certain degree of jargon is to be expected, it can sometimes overwhelm a reader to the point where the main findings of the research become lost. This typically tends to be the case for those just at the beginning of their scientific journeys, however I have also known professors to comment on confusing sections of publications due to the heavy use of specific jargon.

Conferences on the other hand offer an opportunity to disseminate meaningful science in a more open and (sometimes) more laid-back setting (this may not always be true depending on the field of science and the calibre of the conference). Researchers of a particular field congregate for a few days to learn about current research efforts, ponder potential collaborations, peruse posters of new studies, and argue over which soccer team is going to win the next World Cup. That is the beauty of conferences – it is very possible to get to know each other on a personal level. These face-to-face opportunities are especially beneficial to students as this relaxed atmosphere lends itself to asking questions and engaging with scientists that are leaders in their fields.

Logo for the Marine Technology Summit. Source: MTS.

Just over a week ago, the GEMM Lab had the opportunity to do all of the above-mentioned things. PI Dr Leigh Torres and I participated in the Marine Technology Summit (MTS) in Newport, OR, a “mini-conference” at which shiny, new technologies for use in marine applications were introduced by leading, and many local, tech companies. While Leigh and I are not technologists, we are ecologists that have greatly benefitted from recent, rapid advances in technology. Both of our gray whale (Eschrichtius robustus) research projects use different technologies to unveil hitherto unknown ecological aspects of these marine mammals.

Leigh presented her research that involves flying drones over gray whales that grace the Oregon coastal waters in the spring and summer. Through these flights, many previously undocumented gray whale behaviours have been captured and quantified1, such as headstands, nursing and jaw snapping (check out the video below). Furthermore, still images from the videos have been used to perform photogrammetry to assess health and body condition of the whales2. These drone flights have added a wealth of valuable data to the life histories of individual whales that previously were assessed mainly through photo-identification and genetics. This still fairly new approach to assess health by using drones can be relatively cost-effective, which has always been one of Leigh’s key aims throughout her research so that methods are accessible to many scientists. These productive drones used by the GEMM Lab are commercially available (yup, just like the ones you see on the shelves at your local Best Buy!).

The use of cost-effective technologies is a common theme in the GEMM Lab and is also central to my research. The estimation of zooplankton density is vital to my project to determine whether gray whales in Port Orford select areas of high prey density over areas with less dense prey. However, the traditional technology used to quantify prey densities in the water column are often bulky or expensive. Instead, we developed a relatively cheap method of measuring relative zooplankton density using a GoPro camera that we reel down through the water column from a downrigger attached to our research kayak. While we are unable to exactly quantify the mass of zooplankton in the water column, we have been successful in assessing changes in relative prey density by scoring screenshots of the footage.

Screenshot of a GoPro video from this summer’s field season in Port Orford, OR revealing a thick layer of zooplankton. Source: GEMM Lab.

While our drones and GoPro technology is not without error, technology rarely is. In truth, we lost our GoPro for several days after it became stuck in a rock crevice and Leigh’s team regrettably lost a drone to the depths of the ocean this summer. This technology reality was part of the reason I presented at the MTS as I wanted to involve technologists to find solutions to some of the problems I have experienced. Needless to say, I got a lot of excellent input from many different people, for which I am very grateful. In addition to developing new opportunities to collaborate, I was very content to sit in the audience and hear about the ground-breaking new marine technologies that are in development. Below are short descriptions of two new technologies I learned about that are revolutionising the marine world.

ASV Unmanned Marine Systems develop autonomous surface vehicles that are powered by renewable energies (solar panels and wind turbines). These vessels are particularly useful for oceanographic monitoring as they are more capable than weather buoys and much more cost effective than manned weather ships or research vessels. Additionally, they can be used for a lot of different marine science applications including active acoustic fisheries monitoring, water quality monitoring, and cetacean tracking. Some models even have integrated drones that are launched and retrieved autonomously.

The Ocean Cleanup is a company that develops technologies to clean garbage out of our oceans. There is presently a large mission underway by The Ocean Cleanup to combat the Great Pacific Garbage Patch (GPGP). The GPGP is essentially a large island in the middle of the North Pacific Ocean comprised of diverse plastic particles – wrappers, polystyrene, fishing line, plastic bags, the list is endless3. A recent study estimates the amount of plastic in the GPGP to be at least 79 thousand tonnes of ocean plastic4. Unfortunately, the GPGP is not the only one of its kind. The Ocean Cleanup hopes to reduce this massive plastic accumulation with the development of a system made up of a 600-m long floater that sits on the ocean’s surface with a 3-m deep skirt attached below it. The skirt will collect debris while the float will prevent plastic from flowing over it, as well as keep the whole system afloat. The system arrived at the GPGP last Wednesday and the team of over 80 engineers, researchers, scientists and computational modellers have successfully installed the system. The team posts frequent updates on their Twitter and I would highly recommend you follow this possibly revolutionary technology.

While attending the MTS, it felt like there are no bounds for the types of marine technology that will be developed in the future. I am excited to see what ecologists working with technicians can develop to keep applying technology to address challenging questions and conservation issues.


References

  1. Torres, L., et al., Drone up! Quantifying whale behaviour from a new perspective improves observational capacity.Frontiers in Marine Science, 2018. 5, DOI:10.3389/fmars.2018.00319.
  2. Burnett, J.D., et al., Estimating morphometric attributes on baleen whales using small UAS photogrammetry: A case study with blue and gray whales, 2018.Marine Mammal Science. DOI:10.1111/mms.12527.
  3. Kaiser, J., The dirt on the ocean garbage patches. Science, 2018. 328(5985): p. 1506.
  4. Lebreton, L., et al., Evidence that the Great Pacific Garbage Patch is rapidly accumulating plastic. Scientific Reports, 2018. 8(4666).

Looking through the scope: A world of small marine bugs

By Robyn Norman, GEMM Lab summer 2018 intern, OSU undergraduate

Although the average human may think all zooplankton are the same, to a whale, not all zooplankton are created equal. Just like us, different whales tend to favor different types of food over others. Thus, creating a meal perfect for each individual preference. Using a plankton net off the side of our kayak, each day we take different samples, hoping to figure out more about prey and what species the whales, we see, like best. These samples are then transported back to the lab for analysis and identification. After almost a year of identifying zooplankton and countless hours of looking through the microscope you would think I would have seen everything these tiny organisms have to offer.  Identifying mysid shrimp and other zooplankton to species level can be extremely difficult and time consuming, but equally rewarding. Many zooplankton studies often stop counting at 300 or 400 organisms, however in one very long day in July, I counted over 2,000 individuals. Zooplankton tend to be more difficult to work with due to their small size, fragility, and large quantity.

Figure 1. A sample fresh off the kayak in the beginning stages of identification. Photo by Robyn Norman.

A sample that looks quick and easy can turn into a never-ending search for the smallest of mysids. Most of the mysids that I have sorted can be as small as 5 mm in length. Being difficult to identify is an understatement. Figure 1 shows a sample in the beginning stages of analysis, with a wide range of mysids and other zooplankton. Different species of mysid shrimp generally have the same body shape, structure, size, eyes and everything else you can think of. The only way to easily tell them apart is by their telson, which is a unique structure of their tail. Their telsons cannot be seen with the naked eye and it can also be hard to find with a microscope if you do not know exactly what you are looking for.


Throughout my time identifying these tiny creatures I have found 9 different species of mysid from this gray whale foraging ecology project in Port Orford from the 2017 summer. But in 2018 three mysid species have been particularly abundant, Holmesimysis sculpta, Neomysis rayii, and Neomysis mercedis.

Figure 2. Picture taken with microscope of a Holmesimysis sculpta telson. Photo by Robyn Norman.

H. sculpta has a unique telson with about 18 lateral spines that stop as they reach the end of the telson (Figure 2). The end of the telson has 4 large spines that slightly curve to make a fork or scoop-like shape. From my own observations I have also noticed that H. sculpta has darker coloring throughout their bodies and are often heavily pregnant (or at least during the month of August). Neomysis rayii and Neomysis mercedis have been extremely difficult to identify and work with. While N. rayii can grow up to 65 mm, they can also often be the same small size as N. mercedis. The telsons of these two species are very similar, making them too similar to compare and differentiate. However, N. rayii can grow substantially bigger than N. mercedis, making the bigger shrimp easier to identify. Unfortunately, the small N. rayii still give birth to even smaller mysid babies, which can be confused as large N. mercedis. Identifying them in a timely manner is almost impossible. After a long discussion, we decided it would be easier to group these two species of Neomysis together and then sub-group by size. Our three categories were 1-10 mm, 11-15 mm, 16+ mm. According to the literature, N. mercedis are typically 11-15 mm meaning that anything over this size should be a N. rayii (McLaughlin 1980).

Figure 3. Microscopic photo of a gammarid. Photo source: WikiMedia.
Figure 4. Caprellidae found in sample with unique coloration. Photo by Robyn Norman.

While mysids comprise the majority of our samples, they are not the only zooplankton that I see. Amphipods are often caught along with the shrimp. Gammarids look like the terrestrial potato bug and can grow larger than some species of mysid (Fig. 3).

As well as, Caprellidae (Fig. 4) that remind me of little tiny aliens as they have large claws compared to their body size, making it hard to get them out of our plankton net. These impressive creatures are surprisingly hardy and can withstand long times in the freezer or being poked with tweezers under a microscope without dying.

In 2017, there was a high abundance of amphipods found in both of our study sites, Mill Rocks and Tichenor Cove. Mill Rocks surprisingly had 4 times the number of amphipods than Tichenor Cove. This result could be one of the possible reasons gray whales were observed more in Mill Rocks last year. Mill Rocks also has a substantial amount of kelp, a popular place for mysid swarms and amphipods. The occurrence of mysids at each of these sites was almost equal, whereas amphipods were almost exclusively found at Mill Rocks. Mill Rocks also had a higher average number of organisms than Tichenor Cove per samples, potentially creating better feeding grounds for gray whales here in Port Orford.

Analyzing the 2018 data I can already see some differences between the two years. In 2018 the main species of mysid that we are finding in both sites are Neomysis sp. and Holmesimysis sculpta, whereas in 2017 Alienacanthomysis macropsis, a species of mysid identified by their long eye stalks and blunt telson, made up the majority of samples from Tichenor Cove. There has also been a large decrease in amphipods from both locations compared to last year. Two samples from Mill Rocks in 2017 had over 300 amphipods, however this year less than 100 have been counted in total. All these differences in zooplankton prey availability may influence whale behavior and movement patterns. Further data analysis aims to uncover this possibility.

Figure 5. 2017 zooplankton community analysis from Tichenor Cove. There was a higher percentage and abundance of Neomysis rayii (yellow) and Alienacanthomysis macropsis (orange) than in Mill Rocks.
Figure 6. 2017 zooplankton community analysis from Mill Rocks. There was a higher abundance and percentage of amphipods (blue) and Holmesimysis sculpta (brown) than in Tichenor cove. Caprellidae (red) increased during the middle of the season, and decreased substantially towards the end.

The past 6 weeks working as part of the 2018 gray whale foraging ecology research team in Port Orford have been nothing short of amazing. We have seen over 50 whales, identified hundreds of zooplankton, and have spent almost every morning on the water in the kayak. An experience like this is a once in a lifetime opportunity that we were fortunate to be a part of. For the past few years, I have been creating videos to document important and exciting times in my life. I have put together a short video that highlights the amazing things we did every day in Port Orford, as well as the creatures that live just below the surface. I hope you enjoy our Gray Whale Foraging Ecology 2018 video with music by Myd – The Sun. 

Collaboration – it’s where it’s at.

By Dominique Kone, Masters Student in Marine Resource Management

As I finish my first year of graduate school, I’ve been reflecting on what has helped me develop as a young scientist over the past year. Some of these lessons are somewhat expected: making time for myself outside of academia, reading the literature, and effectively managing my time. Yet, I’ve also learned that working with my peers, other scientists, and experts outside my scientific field can be extremely rewarding.

For my thesis, I will be looking at the potential to reintroduce sea otters to the Oregon coast by identifying suitable habitat and investigating their potential ecological impacts. During this first year, I’ve spent much time getting to know various stakeholder groups, their experiences with this issue, and any advice they may have to inform my work. Through these interactions, I’ve benefitted in ways that would not have been possible if I tried tackling this project on my own.

Source: Seapoint Center for Collaborative Leadership.

When I first started my graduate studies, I was eager to jump head first into my research. However, as someone who had never lived in Oregon before, I didn’t yet have a full grasp of the complexities and context behind my project and was completely unfamiliar with the history of sea otters in Oregon. By engaging with managers, scientists, and advocates, I quickly realized that there was a wealth of knowledge that wasn’t covered in the literature. Information from people who were involved in the initial reintroduction; theories behind the cause of the first failed reintroduction; and most importantly, the various political, social, and culture implications of a potential reintroduction. This information was crucial in developing and honing my research questions, which I would have missed if I had solely relied on the literature.

As my first year in graduate school progressed, I also quickly realized that most people familiar with this issue also had strong opinions and views about how I should conduct my study, whether and how managers should bring sea otters back, and if such an effort will succeed. This input was incredibly helpful in getting to know the issue, and also fostered my development as a scientist as I had to quickly improve my listening and critically-thinking skills to consider my research from different perspectives. One of the benefits of collaboration – particularly with experts outside the marine ecology or sea otter community – is that everyone looks at an issue in a different way. Through my graduate program, I’ve worked with students and faculty in the earth, oceanic, and atmospheric sciences, whom have challenged me to consider other sources of data, other analyses, or different ways of placing my research within various contexts.

Most graduate students when they first start graduate school. Source: Know Your Meme.

One of the major advantages of being a graduate student is that most researchers – including professors, faculty, managers, and fellow graduate students – are more than happy to analyze and discuss my research approach. I’ve obtained advice on statistical analyses, availability and access to data, as well as contacts to other experts. As a graduate student, it’s important for me to consult with more-experienced researchers who can not only explain complex theories or concepts, but who can also validate the appropriateness of my research design and methods. Collaborating with senior researchers is a great way to become established and recognized within the scientific community. Because of this project, I’ve started to become adopted into the marine mammal and sea otter research communities, which is obviously beneficial for my thesis work, but also allows me to start building strong relationships for a career in marine conservation.

Source: Oregon State University.

Looking ahead to my second year of graduate school, I’m eager to make a big push toward completing my thesis, writing manuscripts for journal submission, and communicating my research to various audiences. Throughout this process, it’s still important for me to continue to reach out and collaborate with others within and outside my field as they may help me reach my personal goals. In my opinion, this is exactly what graduate students should be doing. While graduate students may have the ability and some experience to work independently, we are still students, and we are here to learn from and make lasting connections with other researchers and fellow graduate students through these collaborations.

If there’s any advice I would give to an incoming graduate student, it’s this: Collaborate, and collaborate often. Don’t be afraid to work with others because you never know whether you’ll come away with a new perspective, learn something new, come across new research or professional opportunities, or even help others with their research.

Oregon sea otter reintroduction: opinions, perspectives, and theories

By Dominique Kone, Masters Student in Marine Resource Management

Species reintroductions can be hotly contested issues because they can negatively impact other species, ecosystems, and society, as well as failing, altogether. The uncertainty of their outcomes forces stakeholder groups to form their own opinions on whether it’s a good idea to proceed with a reintroduction. When you have several groups with conflicting values and views, managers need to focus on the information most important for them to make a well-informed decision on whether to pursue a reintroduction.

As researchers, we can play an important role by carefully considering and addressing these views through our research, if the appropriate data is available. Despite being in the early days of our study on the potential sea otter reintroduction to Oregon, we have already heard several perspectives regarding its potential success, the type of research we should do, and if sea otters should be brought back to Oregon. Here, I present some of the most interesting and relevant opinions, perspectives, and theories I’ve heard regarding this reintroduction idea.

Source: Suzi Eszterhas

The first reintroduction failed because of X, Y, and Z.

From 1970-1971, managers translocated 93 sea otters to Oregon in a reintroduction effort (Jameson et al. 1982). However, in a matter of 5-6 years, all sea otters disappeared, and the effort was considered a failure. Researchers have theorized that sea otters left Oregon due to a lack of suitable habitat and prey, or to return home to sites from which they were captured. Others have reasoned that managers should have introduced southern sea otters instead of northern sea otters, suggesting one subspecies’ genetic pre-disposition may improve their chance for survival.

Knowing the reasons for this failure may help managers avoid these causes in a future reintroduction attempt and increase its chance of success. We, as scientists, can also gain insight from knowing these causes because this may help us better tailor our research to potentially investigate whether those causes still pose a threat to sea otters during a second attempt. Unfortunately, we lack concrete evidence on what exactly caused this failure, but we can still work to test some these theories.

Source: Mike Baird.

An otter is an otter, no matter where you put it.

There is evidence that northern and southern sea otters are genetically distinct, to a certain degree (Valentine et al. 2008, Larson et al. 2012), and hypotheses have been put forward that the two subspecies may be behaviorally- and ecologically-distinct, too. Studies have shown that northern and southern sea otters have different sized and shaped skulls and teeth, which researchers hypothesize may be a specialized foraging adaptation for consuming different prey species (Campbell & Santana 2017, Timm-Davis et al. 2015). This view suggests that each subspecies has developed unique traits to adapt to the environmental conditions specific to their current ranges. Therefore, when considering which subspecies to bring to Oregon, managers should reintroduce the subspecies with traits better-suited to cope with the types of habitat, prey assemblages, and oceanographic conditions specific to Oregon.

However, other scientists hold the opposite view, and argue that “an otter is an otter” no matter where you put it. This perspective suggests that both subspecies have an equal chance at surviving in any type of suitable habitat because all otters behave in similar ways. Therefore, ecologically, it may not matter which subspecies managers bring to Oregon.

Source: Trover

Oregon doesn’t have enough sea otter habitat.

Kelp is considered important sea otter habitat. In areas with high sea otter densities, such as central and southern California, kelp forests are persistent throughout the year. However, in Oregon, our kelp primarily consists of bull kelp – a slightly more fragile species compared to the durable giant kelp in California. In winter, this bull kelp gets dislodged during intense storms, resulting in seasonal changes in kelp availability. Managers worry that this seasonality could reduce the amount of suitable habitat, to the point where Oregon may not be able to support sea otters.

Yet, we know sea otters used to exist here; therefore, we can assume there must have been some suitable habitat that may persist today. Furthermore, sea otters use a range of habitats, including estuaries, bays, and reefs (Laidre et al. 2009, Lafferty & Tinker 2014, Kvitek et al. 1988). Therefore, even during times when kelp is less abundant, sea otters could use these other forms of habitat along the Oregon coast. Luckily, we have the spatial tools and data to assess how much, where, and when we have suitable habitat, and I will specifically address this in my thesis.

They’ll eat everything!

Sea otters are famous for their voracious appetites for benthic invertebrates, some of which are of commercial and recreational importance to nearshore fisheries. In some cases, sea otters have significantly reduced prey densities, such as sea urchins and Dungeness crab (Garshelis & Garshelis 1984, Estes & Palmisano 1974). However, without a formal analysis, it’s difficult to know if sea otters will have similar impacts on Oregon’s nearshore species, as well as at spatial scale these impacts will occur and whether our fisheries will be affected. We can predict where sea otters are likely to occur based on the presence of suitable habitat, but foraging impacts could be more localized or widespread across sea otter’s entire potential range. To better anticipate these impacts, managers will need an understanding of how much sea otters eat, where foraging could occur based on the availability of prey, and where sea otters and fisheries are likely to interact. I will also address this concern in my thesis.

Source: Suzi Eszterhas

To reintroduce or not to reintroduce? That is the question.

I have found that many scientists and managers have strong opinions on whether it’s appropriate to bring sea otters back to Oregon. Those who argue against a reintroduction often highlight many of the theories already mentioned here – lack of habitat, potential impacts to fisheries, and genetics. While other opponents provided more logistical and practical justifications, such as confounding politics, as well as difficulties in getting public support and regulatory permission to move a federally-listed species.

In contrast, proponents of this idea argue that a reintroduction could augment the recovery of the species by providing additional habitat for the species to rebound to pre-exploitation levels, as well as allowing for increased gene flow between southern and northern sea otter populations. Other proponents have brought up potential benefits to humans, such restoring ecosystem services, providing an economic boost through tourism, or preserving tribal and cultural connections. Such benefits may be worth attempting another reintroduction effort.

As you can see, there are several opinions and perspectives related to a potential sea otter reintroduction to Oregon. While it’s important to consider all opinions, managers still need facts to make key decisions. Scientists can play an important role in providing this information, so managers can make a well-informed decision. Oregon managers have not yet decided whether to proceed with a sea otter reintroduction, but our lab is working to provide them with reliable and accurate science, so they may form their own opinions and arrive at their own decision.

References:

Estes, J. A. and J. F. Palmisano. 1974. Sea otters: the role in structuring nearshore communities. Science. 185: 1058-1060.

Garshelis, D. L. and J. A. Garshelis. 1984. Movements and management of sea otters in Alaska. The Journal of Wildlife Management. 48: 665-678.

Jameson, R. J, Kenyon, K. W., Johnson, A. M., and H. M. Wight. 1982. History and status of translocated sea otter populations in North America. Wildlife Society Bulletin. 10: 100-107.

Lafferty, K. D., and M. T. Tinker. 2014. Sea otters are recolonizing southern California in fits and starts. Ecosphere. 5(5).

Laidre, K. L., Jameson, R. J., Gurarie, E., Jeffries, S. J., and H. Allen. 2009. Spatial habitat use patterns of sea otters in coastal Washington. Journal of Mammalogy. 90(4): 906-917.

Kvitek, R. G. ,Fukayama, A. K., Anderson, B. S., and B. K. Grimm. 1988. Sea otter foraging on deep-burrowing bivalves in a California coastal lagoon. Marine Biology. 98: 157-167.

Larson, S., Jameson, R., Etnier, M., Jones, T., and R. Hall. 2012. Genetic diversity and population parameters of sea otters, Enhydra lutris, before fur trade extirpation from 1741-1911. PLoS ONE. 7(3).

Timm-Davis, L. L, DeWitt, T. J., and C. D. Marshall. 2015. Divergent skull morphology supports two trophic specializations in otters (Lutrinae). PLoS ONE. 10(12).

Valentine et al. 2008. Ancient DNA reveals genotypic relationships among Oregon populations of the sea otter (Enhydra lutris). Conservation Genetics. 9:933-938.


The Recipe for a “Perfect” Marine Mammal and Seabird Cruise

By Alexa Kownacki, Ph.D. Student, OSU Department of Fisheries and Wildlife, Geospatial Ecology of Marine Megafauna Lab

Science—and fieldwork in particular—is known for its failures. There are websites, blogs, and Twitter pages dedicated to them. This is why, when things go according to plan, I rejoice. When they go even better than expected, I practically tear up from amazement. There is no perfect recipe for a great marine mammal and seabird research cruise, but I would suggest that one would look like this:

 A Great Marine Mammal and Seabird Research Cruise Recipe:

  • A heavy pour of fantastic weather
    • Light on the wind and seas
    • Light on the glare
  • Equal parts amazing crew and good communication
  • A splash of positivity
  • A dash of luck
  • A pinch of delicious food
  • Heaps of marine mammal and seabird sightings
  • Heat to approximately 55-80 degrees F and transit for 10 days along transects at 10-12 knots
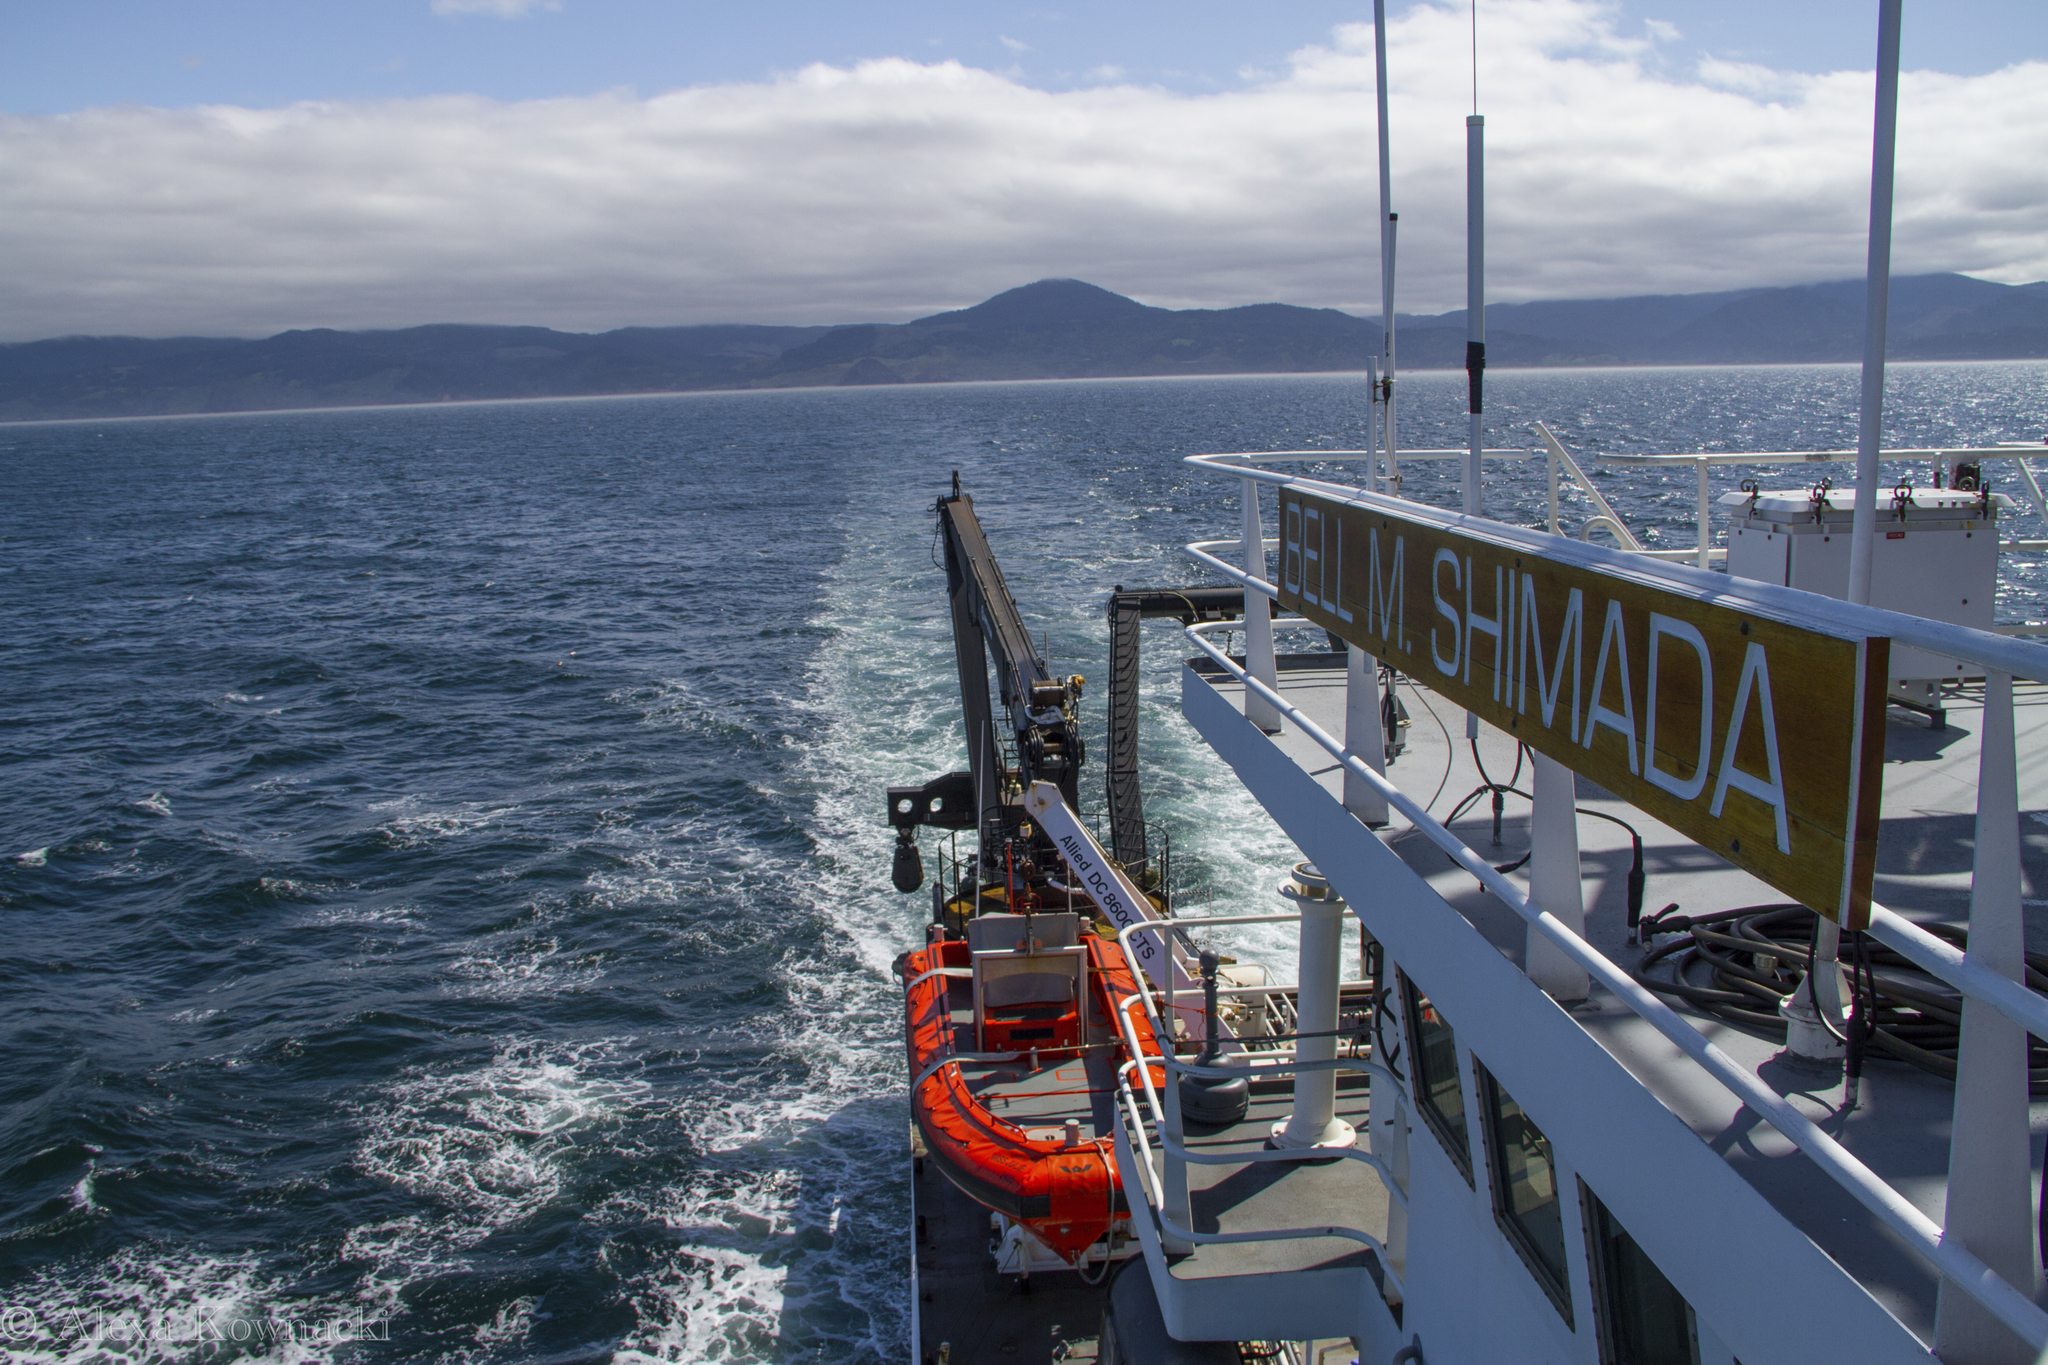
The end of another beautiful day at sea on the R/V Shimada. Image source: Alexa K.

The Northern California Current Ecosystem (NCCE) is a highly productive area that is home to a wide variety of cetacean species. Many cetaceans are indicator species of ecosystem health as they consume large quantities of prey from different levels in trophic webs and inhabit diverse areas—from deep-diving beaked whales to gray whales traveling thousands of miles along the eastern north Pacific Ocean. Because cetacean surveys are a predominant survey method in large bodies of water, they can be extremely costly. One alternative to dedicated cetacean surveys is using other research vessels as research platforms and effort becomes transect-based and opportunistic—with less flexibility to deviate from predetermined transects. This decreases expenses, creates collaborative research opportunities, and reduces interference in animal behavior as they are never pursued. Observing animals from large, motorized, research vessels (>100ft) at a steady, significant speed (>10kts/hour), provides a baseline for future, joint research efforts. The NCCE is regularly surveyed by government agencies and institutions on transects that have been repeated nearly every season for decades. This historical data provides critical context for environmental and oceanographic dynamics that impact large ecosystems with commercial and recreational implications.

My research cruise took place aboard the 208.5-foot R/V Bell M. Shimada in the first two weeks of May. The cruise was designated for monitoring the NCCE with the additional position of a marine mammal observer. The established guidelines did not allow for deviation from the predetermined transects. Therefore, mammals were surveyed along preset transects. The ship left port in San Francisco, CA and traveled as far north as Cape Meares, OR. The transects ranged from one nautical mile from shore and two hundred miles offshore. Observations occurred during “on effort” which was defined as when the ship was in transit and moving at a speed above 8 knots per hour dependent upon sea state and visibility. All observations took place on the flybridge during conducive weather conditions and in the bridge (one deck below the flybridge) when excessive precipitation was present. The starboard forward quarter: zero to ninety degrees was surveyed—based on the ship’s direction (with the bow at zero degrees). Both naked eye and 7×50 binoculars were used with at least 30 percent of time binoculars in use. To decrease observer fatigue, which could result in fewer detected sightings, the observer (me) rotated on a 40 minutes “on effort”, 20 minutes “off effort” cycle during long transits (>90 minutes).

Alexa on-effort using binoculars to estimate the distance and bearing of a marine mammal sighted off the starboard bow. Image source: Alexa K.

Data was collected using modifications to the SEEbird Wincruz computer program on a ruggedized laptop and a GPS unit was attached. At the beginning of each day and upon changes in conditions, the ship’s heading, weather conditions, visibility, cloud cover, swell height, swell direction, and Beaufort sea state (BSS) were recorded. Once the BSS or visibility was worse than a “5” (1 is “perfect” and 5 is “very poor”) observations ceased until there was improvement in weather. When a marine mammal was sighted the latitude and longitude were recorded with the exact time stamp. Then, I noted how the animal was sighted—either with binoculars or naked eye—and what action was originally noticed—blow, splash, bird, etc. The bearing and distance were noted using binoculars. The animal was given three generalized behavior categories: traveling, feeding, or milling. A sighting was defined as any marine mammal or group of animals. Therefore, a single sighting would have the species and the best, high, and low estimates for group size.

By my definitions, I had the research cruise of my dreams. There were moments when I imagined people joining this trip as a vacation. I *almost* felt guilty. Then, I remember that after watching water for almost 14 hours (thanks to the amazing weather conditions), I worked on data and reports and class work until midnight. That’s the part that no one talks about: the data. Fieldwork is about collecting data. It’s both what I live for and what makes me nervous. The amount of time, effort, and money that is poured into fieldwork is enormous. The acquisition of the data is not as simple as it seems. When I briefly described my position on this research cruise to friends, they interpret it to be something akin to whale-watching. To some extent, this is true. But largely, it’s grueling hours that leave you fatigued. The differences between fieldwork and what I’ll refer to as “everything else” AKA data analysis, proposal writing, manuscript writing, literature reviewing, lab work, and classwork, are the unbroken smile, the vaguely tanned skin, the hours of laughter, the sea spray, and the magical moments that reassure me that I’ve chosen the correct career path.

Alexa photographing a gray whale at sunset near Newport, OR. Image source: Alexa K.

This cruise was the second leg of the Northern California Current Ecosystem (NCCE) survey, I was the sole Marine Mammal and Seabird Observer—a coveted position. Every morning, I would wake up at 0530hrs, grab some breakfast, and climb to the highest deck: the fly-bridge. Akin to being on the top of the world, the fly-bridge has the best views for the widest span. From 0600hrs to 2000hrs I sat, stood, or danced in a one-meter by one-meter corner of the fly-bridge and surveyed. This visual is why people think I’m whale watching. In reality, I am constantly busy. Nonetheless, I had weather and seas that scientists dream about—and for 10 days! To contrast my luck, you can read Florence’s blog about her cruise. On these same transects, in February, Florence experienced 20-foot seas with heavy rain with very few marine mammal sightings—and of those, the only cetaceans she observed were gray whales close to shore. That starkly contrasts my 10 cetacean species with upwards of 45 sightings and my 20-minute hammock power naps on the fly-bridge under the warm sun.

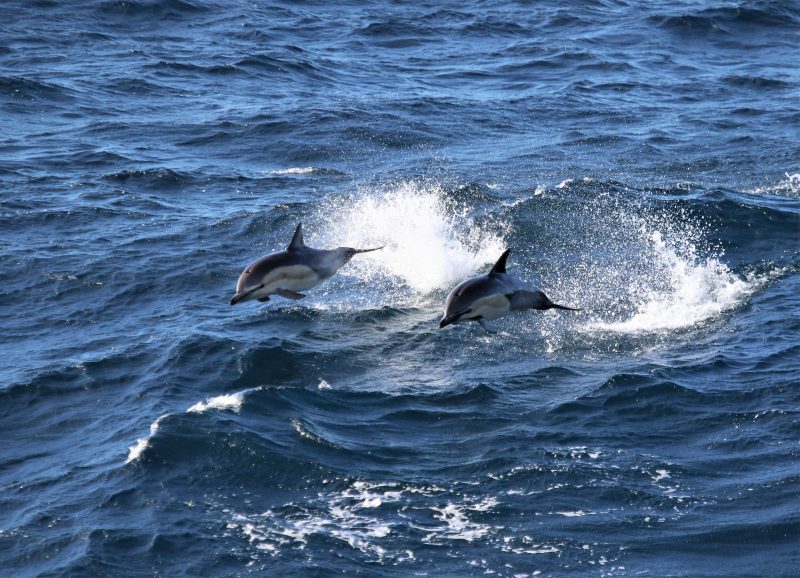
Pacific white-sided dolphins traveling nearby. Image source: Alexa K.

Marine mammal sightings from this cruise included 10 cetacean species: Pacific white-sided dolphin, Dall’s porpoise, unidentified beaked whale, Cuvier’s beaked whale, gray whale, Minke whale, fin whale, Northern right whale dolphin, blue whale, humpback whale, and transient killer whale and one pinniped species: northern fur seal. What better way to illustrate these sightings than with a map? We are a geospatial lab after all.

Cetacean Sightings on the NCCE Cruise in May 2018. Image source: Alexa K.

This map is the result of data collection. However, it does not capture everything that was observed: sea state, weather, ocean conditions, bathymetry, nutrient levels, etc. There are many variables that can be added to maps–like this one (thanks to my GIS classes I can start adding layers!)–that can provide a better understanding of the ecosystem, predator-prey dynamics, animal behavior, and population health.

The catch from a bottom trawl at a station with some fish and a lot of pyrosomes (pink tube-like creatures). Image source: Alexa K.

Being a Ph.D. student can be physically and mentally demanding. So, when I was offered the opportunity to hone my data collection skills, I leapt for it. I’m happiest in the field: the wind in my face, the sunshine on my back, surrounded by cetaceans, and filled with the knowledge that I’m following my passion—and that this data is contributing to the greater scientific community.

Humpback whale photographed traveling southbound. Image source: Alexa K.

“The joy of paper acceptance” or “The GEMM Lab’s recent scientific contributions”

Dr. Leigh Torres, Geospatial Ecology of Marine Megafauna Lab, Marine Mammal Institute, Oregon State University

The GEMM Lab is always active – running field projects, leading outreach events, giving seminars, hosting conferences, analyzing data, mentoring young scientists, oh the list goes on! (Yes, I am a proud lab PI). And, recently we have had a flurry of scientific papers either published or accepted for publication that I want to highlight. These are all great pieces of work that demonstrate our quality work, poignant and applied science, and strong collaborations. For each paper listed below I provide a short explanation of the study and implications. (Those names underlined are GEMM Lab members, and I provided a weblink where available.)


Sullivan, F.A. & Torres, L.G. Assessment of vessel disturbance to gray whales to inform sustainable ecotourism. The Journal of Wildlife Management, doi:10.1002/jwmg.21462.

This project integrated research and outreach regarding gray whale behavioral response to vessels. We simultaneously tracked whales and vessels, and data analysis showed significant differences in gray whale activity budgets when vessels were nearby. Working with stakeholders, we translated these results into community-developed vessel operation guidelines and an informational brochure to help mitigate impacts on whales.


Hann, C., Stelle, L., Szabo, A. & Torres, L. (2018) Obstacles and Opportunities of Using a Mobile App for Marine Mammal Research. ISPRS International Journal of Geo-Information, 7, 169. http://www.mdpi.com/2220-9964/7/5/169

This study demonstrates the strengths (fast and cheap data collection) and weaknesses (spatially biased data) of marine mammal data collected using the mobile app Whale mAPP. We emphasize the need for increased citizen science participation to overcome obstacles, which will enable this data collection method to achieve its great potential.


Barlow, D.R., Torres, L.G., Hodge, K., Steel, D., Baker, C.S., Chandler, T.E., Bott, N., Constantine, R., Double, M.C., Gill, P.C., Glasgow, D., Hamner, R.M., Lilley, C., Ogle, M., Olson, P.A., Peters, C., Stockin, K.A., Tessaglia-Hymes, C.T. & Klinck, H. (in press) Documentation of a New Zealand blue whale population based on multiple lines of evidence. Endangered Species Research. https://doi.org/10.3354/esr00891.

This study used genetics, acoustics, and photo-id to document a new population of blue whales around New Zealand that is genetically isolated, has high year-round residence, and shows limited connectivity to other blue whale populations. This discovery has important implication for population management, especially in the South Taranaki Bight region of New Zealand where the whales forage among industrial activity.


Burnett, J.D., Lemos, L., Barlow, D.R., Wing, M.G., Chandler, T.E. & Torres, L.G. (in press) Estimating morphometric attributes of baleen whales with photogrammetry from small UAS: A case study with blue and gray whales. Marine Mammal Science.

Here we developed methods to measure whale body morphometrics using images captured via Unmanned Aerial Systems (UAS; ‘drones’). The paper presents three freely available analysis programs and a protocol to help the community standardize methods, assess and minimize error, and compare data between studies.


Holdman, A.K., Haxel, J.H., Klinck, H. & Torres, L.G. (in press) Acoustic monitoring reveals the times and tides of harbor porpoise distribution off central Oregon, USA. Marine Mammal Science.

Right off the Newport, Oregon harbor entrance we listened for harbor porpoises at two locations using hydrophones. We found that porpoise presence at the shallow rocky reef site corresponds with the ebb tidal phase, while harbor porpoise presence at the deeper site with sandy bottom was associated with night-time foraging. It appears that harbor porpoise change their spatial and temporal patterns of habitat use to increase their foraging efficiency.


Derville, S., Torres, L.G., Iovan, C. & Garrigue, C. (in press) Finding the right fit: Comparative cetacean distribution models using multiple data sources. Diversity and Distributions.

Species distribution models (SDM) are used widely to understand the drivers of cetacean distribution patterns, and to predict their space-use patterns too. Using humpback whale sighting datasets in New Caledonia, this study explores the performance of different SDM algorithms (GAM, BRT, MAXENT,  GLM, SVM) and methods of modeling presence-only data. We highlight the importance of controlling for model overfitting and thorough model validation.


Bishop, A.M., Brown, C., Rehberg, M., Torres, L.G. & Horning, M. (in press) Juvenile Steller sea lion (Eumetopias jubatus) utilization distributions in the Gulf of Alaska. Movement Ecology.

This study examines the distribution patterns of juvenile Steller sea lions in the Gulf of Alaska to gain a better understanding of the habitat needs of this vulnerable demographic group within a threatened population. Utilization distributions were derived for 84 tagged sea lions, which showed sex, seasonal and spatial differences. This information will support the development of a species recovery plan.

This comic seemed appropriate here. Thanks for everyone’s hard work!

Some advice on how to navigate the scientific publication maze

Dr. Leigh Torres, Geospatial Ecology of Marine Megafauna Lab, Marine Mammal Institute, Oregon State University

Publication of our science in peer-reviewed journals is an extremely important part of our lives as scientists. It’s how we communicate our work, check each other’s work, and improve, develop and grow our scientific fields. So when our manuscript is finally written with great content, we could use some instructions for how to get it through the publication process.  Who gets authorship? How do I respond to reviewers? Who pays for publication costs?

There is some good advice online about manuscript preparation and selecting the right journal. But there is no blueprint for manuscript preparation. That’s because it’s a complicated and variable process to navigate, even when you’ve done it many times. Every paper is different. Every journal has different content and format requirements. And every authorship list is different, with different expectations. As an academic supervisor of many graduate students, and as author on many peer-reviewed papers, I have seen or been a part of more than a few publication blunders, hiccups, road-blocks, and challenges.

Recently I’ve had students puzzle over the nuances of the publication process: “I had no idea that was my role as lead author!”, “How do I tell a reviewer he’s wrong?”, “Who should I recommend as reviewers?” So, I have put together some advice about how to navigate through a few of the more common pitfalls and questions of the scientific publication process. I’m not going to focus on manuscript content, structure, or journal choice – that advice is elsewhere and for authors to evaluate. My intent here is to discuss some of the ‘unwritten’ topics and expectations of the publication process. This guidance and musings are based my 20 years of experience as a scientist trying to navigate the peer-review publication maze myself. I encourage others to add their advice and comments below based on their experiences so that we can engage as a community in an open dialog about these topics, and add transparency to an already difficult and grueling, albeit necessary, process.

Image Credit: Nick at http://www.lab-initio.com/


Authorship: Deciding who should – and shouldn’t be – be a co-author on a paper is often a challenging, sensitive, and angst-filled experience. Broad collaboration is so common and often necessary today that we often see very long author lists on papers. It’s best to be inclusive and recognize contribution where it is deserved, but we also don’t want to be handing out co-authorship as a token of appreciation or just to pad someone’s CV or boost their H-index. Indeed, journals don’t want that, and we don’t want to promote that trend. Sometimes it is more appropriate to recognize someone’s contribution in the acknowledgements section.

The best advice I can give about how to determine authorship is advice that was given to me by my graduate advisor, Dr. Andy Read at Duke University: To deserve authorship the person must have contributed to at least three of these five areas: concept development, acquisition of funding, data collection, data analysis, manuscript writing. Of course, this rule is not hard and fast, and thoughtful judgement and discussions are needed. Often someone has contributed to only one or two of these areas, but in such a significant manner that authorship is warranted.

I have also seen situations where someone has contributed only a small, but important, piece of data. What happens then? My gut feeling is this should be an acknowledgment, especially if it’s been published previously, but sometimes the person is recognized as a co-author to ensure inclusion of the data. Is this right? That’s up to you and your supervisor(s), and is often case-specific. But I do think we need to limit authorship-inflation. Some scientists in this situation will gracefully turn down co-authorship and ask only for acknowledgement, while others will demand co-authorship when it’s not fully deserved. This is the authorship jungle we all must navigate, which does not get easier with time or experience. So, it’s best to just accept the complexity and make the best decisions we can based on the science, not necessarily the scientists.

Next, there is the decision of author order, which can be another challenging decision. A student with the largest role in data collection/analysis and writing, will often be the lead author, especially if the paper is also forming a chapter of his/her thesis. But, if lead authorship is not clear (maybe the student’s work focuses on a small part of a much larger project) then its best to discuss authorship order with co-authors sooner rather than later. The lead author should be the person with the largest role in making the study happen, but often a senior scientist, like an academic supervisor, will have established the project and gained the funding support independent of a student’s involvement. This ‘senior scientist’ role is frequently recognized by being listed last in the authorship list – a trend that has developed in the last ~15 years. Or the senior scientists will be the corresponding author. The order of authors in between the first and last author is often grey, muddled and confusing. To sort this order out, I often think about who else had a major role in the project, and list them near the front end, after the lead author. And then after that, it is usually just based on alphabetical order; you can often see this trend when you look at long author lists.

Responsibility as lead author:  The role of a lead author is to ‘herd the cats’. Unless otherwise specified by co-authors/supervisor, this process includes formatting the manuscript as per journal specifications, correspondence with journal editors (letters to editors and response to reviewer comments), correspondence with co-authors, consideration and integration of all co-author comments and edits into the manuscript, manuscript revisions, staying on time with re-submissions to the journal, finding funding for publication costs, and review of final proofs before publication. Phew! Lots to do. To help you through this process, here are some tips:

How to get edits back from co-authors: When you send out the manuscript for edits/comments, give your co-authors a deadline. This deadline should be at least 2 weeks out, but best to give more time if you can. Schedules are so packed these days. And, say in the email something like, ‘If I don’t hear back from you by such and such a date I’ll assume you are happy with the manuscript as is.” This statement often spurs authors to respond.

How to respond to reviewer comments: Always be polite and grateful, even when you completely disagree with the comment or feel the reviewer has not understood your work. Phrases like “we appreciate the feedback”, “we have considered the comment”, and “the reviewers provided thoughtful criticism” are good ways to show appreciation for reviewer comments, even when it’s followed by a ‘but’ statement. When revising a manuscript, you do not need to incorporate all reviewer comments, but you do need to go through each comment one-by-one and say “yes, thanks for this point. We have now done that,” or thoughtfully explain why you have not accepted the reviewer advice.

While receiving negative criticism about your work is hard, I have found that the advice is often right and helpful in the long run. When I first receive reviewer comments back on a manuscript, especially if it is a rejection – yes, this happens, and it sucks – I usually read through it all. Fume a bit. And then put it aside for a week or so. This gives me time to process and think about the feedback. By the time I come back to it, my emotional response has subsided and I can appreciate the critical comments with objectivity.

Journal formatting can be a nightmare: Some editor may read this post and hate me, but my advice is don’t worry too much about formatting a manuscript perfectly to journal specs. During the initial manuscript submission, reviewers will be assessing content, not how well you match the journal’s formatting. So don’t kill yourself at this stage to get everything perfect, although you should be close. Once your paper gets through the first round of reviews, then you should worry about formatting perfectly in the revision.

Who should I recommend as a reviewer? Editors like it when you make their lives easier by recommending appropriate reviewers for your manuscript. Obviously you should not recommend close friends or colleagues. Giving useful, appropriate reviewer suggestions can be challenging. My best advice for this step is to look at the authors you have referenced in the manuscript. Those authors referenced multiple times may have interest in your work, and be related to the subject matter.

Who pays or how to pay for publication? Discuss this issue with your co-authors/supervisor and plan ahead. Most journals have publication fees that often range between $1000 and $2000. Sometimes color figures cost more. And, if you want your paper to be open access, plan on paying > $3000. So, when deciding on a journal, keep these costs in mind if you are on a limited budget. These days I add at least $2000 to almost every project budget to pay for publication costs. Publication is expensive, which is ridiculous considering we as scientists provide the content, review the content for free, and then often have to pay for the papers once published. But that’s the frustrating, unbalanced racket of scientific publication today – a topic for another time, but this article is definitely worth a read, if interested.

So that’s it from me. Please add your advice, feedback, and thoughts below in the comments section.