How we craft our messages

By: Erin Pickett, MSc

Communicating science has become more important than ever as major social and political issues, such as climate change, require increasing input from scientists. In a recent article published by the Proceedings of the National Academy of Science, a research group from the University of Cologne in Cologne, Germany, explores how social cognition influences our ability to market science.

This article, titled “Past-focused environmental comparisons promote pro-environmental outcomes for conservatives” focuses specifically on understanding why there is a political divide in the United States regarding the issue of climate change (Baldwin & Lammers 2016). While our research in the GEMM lab focuses on spatial ecology (rather than social science) I thought this article was worth sharing because of its insights about “framing science”. The conservation science that we conduct in the GEMM lab will not be effective if we cannot properly communicate our objectives and our findings to funders and stakeholders.

“Framing” is a term in psychology that describes how you craft a message based on your intended audience. It is important to note that use of the term framing (or marketing) science doesn’t imply misrepresentation of facts (Nisbet & Mooney 2007). Rather,“Frames organize central ideas, defining a controversy to resonate with core values and assumptions” (Nisbet & Mooney 2007). Baldwin & Lammers (2016) demonstrated that subtle differences in framing significantly affect how environmental messages are perceived. These authors investigated the effect of framing with regards to temporal comparisons, environmental attitudes and behavior.

The specific problem these authors address is the failure of climate change advocates to bridge the political divide between liberals and conservatives in the United States. The authors hypothesize that the temporal comparisons used in arguments for action on climate change explain the dichotomy between liberal and conservative views on this issue (which garners less support from conservatives).

The primary hypothesis guiding this study is that conservatives are more likely to favor a “past-focused” message rather than a “future-focused” message about climate change. The authors surmise that this framing bias is rooted in a conservative ideology that favors past traditions over a progressive future, which is more favored by liberals. Many pro-environmental arguments and appeals to address climate change are future focused, e.g. Balwin & Lemmers (2016) quote UN Secretary-General Ban-Ki Moon, speaking about climate change:

“…We need to find a new, sustainable path to the future we want”.

If temporal comparisons do elicit framing bias, then our framing of the issue of climate change, and possibly other environmental issues, could be more effective if presented to conservatives as past-focused messages.

The authors tested these hypotheses on participants in a series of online studies. You can find more details on methods in the papers supporting information found here. In the first three studies, the authors investigated the effect of temporal comparisons on pro-environmental beliefs. Study participants were asked to read messages, or view images, that addressed the issue of climate change by comparing the present to the past, or the present to the future. Following these comparisons, participants ranked their pro-environmental attitudes. Examples of these comparisons were statements such as, “Looking forward to our Nation’s future… there is increasing traffic on the road” (future-focused), and, “Looking back to our Nation’s past…there was less traffic on the road” (past-focused).

You can see examples of past and future-focused images below.

Images of past, present and future conditions (Baldwin & Leemers 2016-Supporting information Fig. S1)

The authors found significant evidence to support their hypothesis that presenting conservatives with past-focused messages is more effective in terms of promoting pro-environmental messages than presenting future-focused messages. Temporal comparisons did not affect the pro-environmental attitudes of liberals.

Liberals pro-environmental attitudes remain similar between conditions, while conservatives pro-environmental attitude is higher given a past-focused condition (Baldwin & Lammers 2016, Fig. 2)

The authors also investigated the temporal focus of environmental organizations and found that overall, environmental charities promote future-focused messages. Study participants were allotted small amounts of cash to donate to these charities, and conservatives gave more to past-focused charities than to future-focused charities. You can see examples of charities with differing temporal focuses below.

Examples of future and past-focused environmental charities (Balwin & Lammers 2016-supporting information Fig. S3)

In a final meta-analysis, these authors found that employing past-focused comparisons nearly made up for the difference between liberals and conservatives in terms of their pro-environmental attitudes. The implication of these findings is that we can improve the way we communicate about controversial issues such as climate change by subtly altering our arguments. For example, in one study that was cited by Baldwin & Lammers (2016), conservatives favored the words ‘purity’ and ‘sanctity’ over ‘harm’ and ‘care’ (Fienberg & Willer 2012). Based on these studies, an example of an effective message for a conservative audience would be, “It is important that we restore the Earth because it has become contaminated”.

These findings could be true for other environmental issues as well, and so it is worth thinking critically about how to craft messages about our scientific findings for our intended audiences. We need to carefully frame our messages whether we are writing grant proposals, peer-reviewed manuscripts, press releases, or posts intended for social media.

I originally discovered this paper after listening to a short radio interview that was conducted by CBC Radio, and if you are interested in this research I encourage you to check it out! You can following this link: how to convince a climate change skeptic.

References:

Baldwin, M., & Lammers, J. (2016). Past-focused environmental comparisons promote proenvironmental outcomes for conservatives. Proceedings of the National Academy of Sciences113(52), 14953-14957.

Feinberg, M., & Willer, R. (2013). The moral roots of environmental attitudes. Psychological Science24(1), 56-62.

Nisbet, M. C., & Mooney, C. (2009). Framing science. Science316.

Good news: You are Brilliant, the Earth is Hiring

By: Erin Pickett, M.S. Student, Oregon State University

GEMM lab UPDATE: Amanda Holdman successfully defended her master’s thesis this week!

Amanda wisely planned her defense date for November 7th, 2016, the day before Election Day. As I anxiously watched the New York Times election forecast needle bounce back and forth, from left to right on Election night, I thought to myself, why didn’t I think of that? If you are unfamiliar with what I am talking about, this “forecast needle” was an animated graphic on the NYT website that bounced constantly all night between the two Presidential candidates. It caused a great deal of unease for those of us that found it difficult to look away. The animation sparked some debate online among bloggers and tweeters, my favorite comment being, “it borders on irresponsible data visualization”. I came to the realization pretty quickly on Tuesday night that despite the outcome of the election, I would still need to turn in my thesis the following week.

Personally, I did not feel motivated to get out of bed on Wednesday. I wasn’t feeling inspired, or overcome with positive thoughts about what my day of thesis writing would bring. Thankfully, here at OSU, we graduate students have good leaders to keep us on track. Wednesday afternoon, we received an encouraging email from our Department Head, Dr. Selina Heppell. I took away two important points from this email. The first: stay positive, and remember that we do great work with great people and that our work matters. Secondly, think about the lessons that we have learned from this election. For those of us that were shocked about who our country has chosen as the next President of the United States, one important lesson is that we need to focus more on engaging people who exist outside of the echo chambers of our scientific communities.

The recent election has left many scientists and environmentalists concerned about what the future political climate will bring in terms of research funding, job opportunities, and environmental protection. More so now than ever it is important to remain positive and hopeful, and to reconsider the way we communicate our research and engage outside communities whose views are unlike our own. Both of these tasks are particularly challenging due to the long list of environmental problems we face. As it turns out, having a hopeful outlook is important for tackling seemingly insurmountable conservation issues, and empowering others to want to do the same (Swaisgood & Sheppard 2010, Garnett & Lindenmayer 2011).

The title of this blog comes from an eloquent commencement speech by Paul Hawken about the importance of remaining optimistic when the data tells us otherwise. While the address was given to the University of Portland class of 2009, I think it is worth reading because it is a relevant and moving reminder of why hope is important.

But, before you read that, take a look at what has been done recently to protect biodiversity around the world-

Photo credit: Mark Sullivan NMFS Permit 10137-07/NOAA

President Obama quadrupled the size of a marine national monument in Hawaii. You can read more about the significance of this monument, called Papahānaumokuākea, in a previous blog of mine.

Photo credit: Northeast U.S. canyons expedition science team and NOAA Okeanos Explorer Program (2013)

Soon after announcing the expansion of Papahānaumokuākea, President Obama established the first marine national monument in the Atlantic. You can read more about the aptly named Northeast Canyons and Seamounts Marine National Monument here.

Photo credit:  Ari Friedlaender

And finally, to top it off, an international body comprised of 24 countries, called the Commission for the Conservation of Antarctic Marine Living Resources, recently came to a consensus to designate a vast portion of the Antarctic’s remote Ross Sea as the world’s largest marine reserve.


References

  • Garnett, S. T., & Lindenmayer, D. B. (2011). Conservation science must engender hope to succeed. Trends in Ecology & Evolution, 26(2), 59-60.
  • Swaisgood, R. R., & Sheppard, J. K. (2010). The culture of conservation biologists: Show me the hope!. BioScience, 60(8), 626-630.


Understanding How Nature Works

By: Erin Pickett, MS student, Oregon State University

They were climbing on their hands and knees along a high, narrow ridge that was in places only two inches wide. The path, if you could call it that, was layered with sand and loose stones that shifted whenever touched. Down to the left was a steep cliff encrusted with ice that glinted when the sun broke down through the thick clouds. The view to the right, with a 1,000ft drop, wasn’t much better.

The Invention of Nature by Andrea Wulf

This is a description of Alexander von Humboldt and the two men that accompanied him when attempting to summit Chimborazo, which in 1802 was believed to be the highest mountain in the world. The trio was thwarted about 1,000 ft from the top of the peak by an impassable crevice but set a record for the highest any European had ever climbed. This was a scientific expedition. With them the men brought handfuls of scientific instruments and Humboldt identified and recorded every plant and animal species along the way. Humboldt was an explorer, a naturalist, and an observer of everything. He possessed a memory that allowed him to recount details of nature that he had observed on a mountain in Asia, and find patterns and connections between that mountain and another in South America. His perspective of nature as being interconnected, and theories as to why and how this was so, led to him being called the father of Ecology. In less grandeur terms, Humboldt was a biodiversity explainer.

Humboldt sketched detailed images like this one of Chimborazo, which allowed him to map vegetation and climate zones and identify how these and other patterns and processes were related. Source: http://www.mappingthenation.com/blog/alexander-von-humboldt-master-of-infographics/

In a recent guest post on Carbon Brief, University of Connecticut Professor Mark Urban summarized one of his latest publications in the journal Science, and called on scientists to progress from biodiversity explainers to biodiversity forecasters.  Today, as global biodiversity is threatened by climate change, one of our greatest scientific problems has become accurately forecasting the responses of species and ecosystems to climate change. Earlier this month, Urban and his colleagues published a review paper in Science titled “Improving the forecast for biodiversity under climate change”. Many of our current models aimed at predicting species responses to climate change, the authors noted, are missing crucial data that hamper the accuracy and thus the predictive capabilities of these models. What does this mean exactly?

Say we are interested in determining whether current protected areas will continue to benefit the species that exist inside their boundaries over the next century. To do this, we gather basic information about these species: what habitat do they live in, and where will this habitat be located in 100 years? We tally up the number of species currently inhabiting these protected areas, figure out the number of species that will relocate as their preferred habitat shifts (e.g. poleward, or higher in elevation) and then we subtract those species from our count of those who currently exist within the boundaries of this protected area. Voilà, we can now predict that we will lose up to 20% of the species within these protected areas over the next 100 years*.  Now we report our findings to the land managers and environmental groups tasked with conserving these species and we conclude that these protected areas will not be sufficient and they must do more to protect these species. Simple right? It never is.

This predication, like many others, was based on a correlation between these species ranges and climate. So what are we missing? In their review, Urban et al. outline six key factors that are commonly left out of predictive models, and these are: species interactions, dispersal, demography, physiology, evolution and environment (specifically, environment at appropriate spatiotemporal scales) (Figure 1). In fact, they found that more than 75% of models aimed at predicting biological responses to climate change left out these important biological mechanisms. Since my master’s project is centered on species interactions, I will now provide you with a little more information about why this specific mechanism is important, and what we might have overlooked by not including species interactions in the protected area example above.

Figure 1: Six critical biological mechanisms missing from current biodiversity forecasts. Source: Urban et al. 2016

I study Adelie and gentoo penguins, two congeneric penguin species whose breeding ranges overlap in a few locations along the Western Antarctic Peninsula. You can read more about my research in previous blog posts like this one. Similar to many other species around the world, both of these penguins are experiencing poleward range shifts due to atmospheric warming. The range of the gentoo penguin is expanding farther south than ever before, while the number of Adelie penguins in these areas is declining rapidly (Figure 2). A correlative model might predict that Adelie penguin populations will continue to decline due to rising temperatures, while gentoo populations will increase. This model doesn’t exactly inform us of the underlying mechanisms behind what we are observing. Are these trends due to habitat shifts? Declines in key prey species? Interspecific competition? If Adelie populations are declining due to increased competition with other krill predators (e.g. gentoo penguins), then any modelling we do to predict future Adelie population trends will certainly need to include this aspect of species interaction.

Figure 2. A subset of the overall range of Adelie and gentoo penguins and their population trends at my study site at Palmer Station 1975-2014. Source: https://www.allaboutbirds.org/on-the-antarctic-peninsula-scientists-witness-a-penguin-revolution/

Range expansion can result in novel or altered species interactions, which ultimately can affect entire ecosystems. Our prediction above that 20% of species within protected areas will be lost due to habitat shifts does not take species interactions into account. While some species may move out of these areas, others may move in. These new species may potentially outcompete those who remain, resulting in a net loss of species larger than originally predicted. Urban et al. outline the type of data needed to improve the accuracy of predictive models. They openly recognize the difficulties of such a task but liken it to the successful, collective effort of climate scientists over the past four decades to improve the predictive capabilities of climate forecasts.

As a passionate naturalist and philosopher, there is no doubt Humboldt would agree with Urban et al.’s conclusion that “ultimately, understanding how nature works will provide innumerable benefits for long-term sustainability and human well-being”. I encourage you to read the review article yourself if you’re interested in more details on Urban et al.’s views of a ‘practical way forward’ in the field of biodiversity forecasting. For a historical and perhaps more romantic account of the study of biodiversity, check out Andrea Wulf’s biography of Alexander von Humboldt, called The Invention of Nature.

 *This is an oversimplified example based off of a study on biodiversity and climate change in U.S. National parks (Burns et al. 2003)

References:

Burns, C. E., Johnston, K. M., & Schmitz, O. J. (2003). Global climate change and mammalian species diversity in US national parks. Proceedings of the National Academy of Sciences100(20), 11474-11477.

Urban, M. 14 September 2016. Carbon Brief. Guest post: How data is key to conserving wildlife in a challenging environment. From: https://www.carbonbrief.org/guest-post-data-key-conserving-wildlife-changing-climate (Accessed: 22 September 2016)

Urban, M. C., Bocedi, G., Hendry, A. P., Mihoub, J. B., Pe’er, G., Singer, A., … & Gonzalez, A. (2016). Improving the forecast for biodiversity under climate change. Science353(6304), aad8466.

Wulf, A. (2015). The Invention of Nature: Alexander Von Humboldt’s New World. Knopf Publishing Group.

Papahānaumokuākea: soon to be the world’s largest marine protected area?

By Erin Pickett, MS student, Oregon State University

On January 29, 2016, a group of native Hawaiian community leaders and conservation practitioners wrote a letter of request to President Barack Obama asking him to expand Papahānaumokuākea Marine National Monument1

Papahānaumokuākea is a UNESCO World Heritage Site and at the time of its creation in 2006, it became the world’s largest fully protected marine area2. The monument encompasses 140,000 square miles and surrounds the Northwestern Hawaiian Island (NWHI) chain, which extends about 2000 km northwest from the main Hawaiian Islands to Kure atoll (see map below). This monument was originally created through use of the Antiquity Act of 1906, which grants the President of the United States the authority to protect valuable public land through the establishment of a national monument3. The initial letter of request sent to President Obama in January called on the President to use his executive power to expand Papahānaumokuākea marine national monument.

This letter of request was put simply. The letter writers believed that as an island boy himself, President Barack Obama understands the importance of the ocean to the people of Hawai’i, especially future generations. This letter and the discussions that have since followed it, emphasize not only the biological value of conserving this large swath of marine habitat, but also the cultural significance of preserving such a place. In the field of marine biology we don’t traditionally think of marine protected areas (MPAs) as “…cultural seascapes that have meaning and significance in the formation and perpetuation of oceanic identity4,” however in the case of the expansion of Papahānaumokuākea, cultural justification is aptly interwoven with biological conservation. The proposed expansion of this marine protected area is especially significant to me for this reason.

While I am not native Hawaiian, much of my life is tied to the ocean. My personal life and my current career as a master’s student of marine science are driven by aloha and malama ‘āina. These two concepts are core tenets of Hawaiian culture and they describe a profound love (aloha) and deep respect and sense of caring (malama) for the āina, or land. I have never felt more aloha or such a strong sense of caring for a place than for Papahānaumokuākea.

Papahānaumokuākea is a sacred place; a place where the Hawaiian people believe life began. Today, the islands, atolls and the surrounding ocean within the monument continue to create and sustain vast quantities of life, in the form of marine species. The use of the monument is limited to cultural, scientific and educational activities, while activities such as commercial fishing and deep-sea mining are prohibited4,5. One primary benefit of large MPAs is that they improve the state of an ecosystem by supporting sufficient numbers of large and far-ranging predators6. The waters surrounding the NWHI support high numbers of large fish, sharks, marine mammals and seabirds. A total of 7,000 known species exist here, 25% of which are endemic7. The expansion of this monument would mean greater protection for these species, and for important pelagic habitats such as seamounts. Underwater seamounts are biodiversity hot spots and a vast number of them exist outside of the current boundaries but within the limits of the proposed expansion of the monument. Far ranging top predators such as seabirds would benefit greatly from an expanded protected area that would reduce the chance of interactions with longline fishing vessels. The foraging ranges of many of the 14 million seabirds that exist in the monument extend beyond its current boundaries4,8. The Hawaiian longline fishery is especially dangerous for Laysan and black-footed albatross, and hooks an estimated 1,000-2,000 of each species per year9.

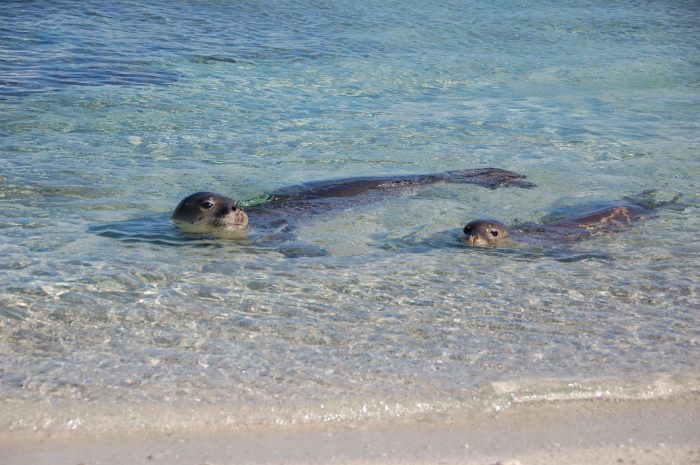
The Laysan albatross, or mōlī, as it is known in Hawaiian, is the species that captured my attention the most during my time in Papahānaumokuākea. In 2010, I worked for the NOAA/NMFS Hawaiian monk seal research program on Laysan Island. While our work on Laysan was focused on the Hawaiian monk seal, it was hard to miss the energy of the presence of the mōlī. We had the opportunity to observe these birds come to the island to make nests, lay eggs and raise their chicks. The incessant sound of hundreds of thousands of albatross whistling and clicking their beaks at their mates and with their chicks is one I will never forget. You can hear these sounds for yourself in a video that Rachael included in a previous blog post about her time on Midway atoll. On Laysan, I had the opportunity to connect deeply with a natural place and this connection reinforced the feeling of aloha ‘aina.

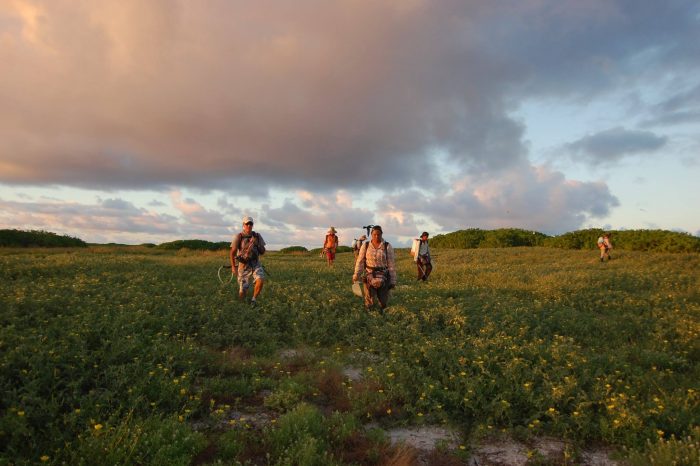
While in the NWHI, we occupied much of our daily life with not only observing and connecting with the wildlife, but also with carrying out conservation activities, such as monitoring the local monk seal population and removing marine debris from beaches. While Laysan is remote, it has not escaped the far reaches of marine plastic pollution (see Rachael’s blog for more on this). Additionally, many of the NWHI are in a perpetual state of restoration and invasive species removal projects. After Laysan, I spent time working on Lisianski Island and then Kure atoll, where we worked tirelessly to eradicate an invasive weed, Verbesina encelioides, and replace it with native plants that we had cultivated. Throughout all of these activities, there was always a feeling that it was our duty to malama ‘aina, to care for and protect these fragile islands and the species that depend on them.

A significant amount of momentum has been gained since January, with one important development being a formal proposal that outlines the main points of this request to the President. These include a request to expand the perimeter of the monument to the limits of the U.S. exclusive economic zone, which lies an additional 150 nm beyond its current boundaries. This expansion would more than quadruple the monument’s current size and make it the world’s largest contiguously protected area. The Obama administration has sent delegates to Hawaii to learn more and has intentions to develop an official federal proposal10. While the timeline of this is unclear, a local coalition of community leaders are actively garnering public support to encourage the Obama administration to sign this expansion into law.

There was a meeting held last night on Kauai to hear public input regarding the proposed expansion of Papahānaumokuākea and because I was not able to attend I was inspired to write this blog to share my thoughts about why I believe further protection of this monument is a pono (moral, just, righteous) decision. The place-based connection I have with Hawai’i and its surrounding waters are what have guided my career in the fields of marine science and conservation. For me, this connection is with Hawai’i, but for you it may your own hometown, island, backyard or nearby mountain peak.

Our love of these places is significant because it facilitates a greater understanding of why they are important to protect. In the field of conservation today, it is especially critical that we foster these types of connections. Preserving wild places, whether they be remote island ecosystems or more easily accessible nature parks, is one way we can ensure that more people have the opportunity to make these connections.


References

1 Eagle, N. (2016). Honolulu Civil Beat. Hawaiians Press Obama to Expand NW Islands Marine Monument. Retrieved from http://www.civilbeat.org/2016/02/should-obama-expand-papahanaumokuakea/

2 Pew Charitable Trust. Global Ocean Legacy-Hawaii (2016). Fact sheet.Papahānaumokuākea Marine National Monument: Expanding protections to conserve Hawaiian culture and biodiversity Retrieved from: http://www.pewtrusts.org/en/research-and-analysis/fact-sheets/2016/05/papahanaumokuakea-marine-national-monument

3 “Antiquities Act” Wikipedia: The Free Encyclopedia. Wikimedia Foundation, Inc. 4 March 2016. Web. 2 August 2016.

4 Kerr, J., et al. 2016. PUʻUHONUA: A PLACE OF SANCTUARY. The Cultural and Biological Significance of the proposed expansion for the Papahānaumokuākea Marine National Monument.

5 Papahānaumokuākea Marine National Monument: Resource Protection. Retrieved from: http://www.papahanaumokuakea.gov/resource/

6 Edgar, Graham J., et al. “Global conservation outcomes depend on marine protected areas with five key features.” Nature 506.7487 (2014): 216-220.

7 National Marine Sanctuaries (2016), National Oceanic and Atmospheric Administration. Accessed on 01 February 2016: http://sanctuaries.noaa.gov/#PM

8 Papahanaumokuakea Marine National Monument Management Plan 2008; KE Keller, AD Anders, SA Shaffer, MA Kappes, B Flint, and A Friedlander, 2009. Seabirds: A Marine Biogeographic Assessment of the Northwestern Hawaiian Islands.

9 Cousins, K.L., et al. Managing pelagic longline-albatross interactions in the North Pacific Ocean. Retrieved from: http://www.wpcouncil.org/documents/managebird.pdf

10 Eagle, N. (2016). Hawaii Lawmakers To Obama: Don’t Grow Marine Monument. Honolulu Civil Beat. Retrieved from: http://www.civilbeat.org/2016/05/hawaii-lawmakers-to-obama-dont-grow-marine-monument/


On niche partitioning and the Ohio State Buckeyes

By: Erin Pickett, MS student, Biotelemetry and Behavioral Ecology Laboratory & GEMM Lab, MMI

Buckeye anecdote

I recently found myself sitting at a Sunday brunch at the Westin in Washington, D.C., talking to my uncle about my research on the foraging ecology of penguins. Our entire extended family had gathered for a cousin’s wedding, and it was the first family gathering in a long time that I had been able to attend due to always being “out on some island”, as my cousin puts it. In fact, I got a shout-out during one of the dinner reception speeches for coming all the way from Antarctica for the wedding.

My uncle asked me about my research while our surrounding family members sipped their coffee and OJ and recounted the highlights of the previous night’s wedding reception. This conversation with my uncle was the first I’d had with a family member all weekend that had progressed past my ‘elevator speech’ of what I was studying in school. After I described my research questions about resource partitioning between Adelie and gentoo penguins, my uncle glanced around the room full of family members and said to me, “You know what….”? And then he went on to describe his thoughts about how our aunts, uncles, cousins and in-laws all occupied distinct niches within our family.

The definition of the word niche is broad, and for this reason it can be used to describe the roles of younger siblings, matriarchs, sisters, and Ohio State Buckeye fans within their families or communities. Take for example my entire family on the dance floor chanting O-H-I-O during the bands requisite rendition of “Hang on Sloopy” at the wedding reception. As Buckeyes, we were occupying a role distinct from that of the bride’s family, who are Notre Dame Fans. Within our immediate families, the roles of every sibling and parent are further differentiated. My uncle and I looked around the room and saw a family who despite a wide range of personalities and football allegiances, was managing to enjoy a pretty good time together!

Ecological niche theory and sympatric penguins

In ecology, the term niche is used to describe the ecological role that a species occupies within an ecosystem (Hutchinson 1957). The concept of an ecological niche is typically used in ecology to describe how similar species coexist within the same space. This coexistence is made possible through segregation mechanisms that facilitate resource partitioning, such as spatial or temporal differences in foraging location, or dietary segregation (Pianka 1974). With this in mind, the main objective of my master’s research is to quantify the ecological niches of Adelie and gentoo penguins in terms of space, time and diet, in order to investigate whether foraging competition is occurring between these two species. You’ll find more background on this project here.

The first step in my investigation of resource partitioning was to assess the extent and consistency of dietary overlap between these two species. The diets of Adelie and gentoo penguins vary regionally, but along the Antarctic Peninsula the prey of both species is typically dominated by Antarctic krill. This was the case when I studied the diets of these two species at Palmer Station in Antarctica. I also found that both species consume the same size classes of krill and that this was consistent across both low and high prey availability years (Figure 1).

Size class frequency distribution of Antarctic krill found in penguin diet samples (2010-2015). Krill size class bins shown on x-axis and proportions depicted on y-axis
Figure 1. Length-frequency distribution of Antarctic krill found in penguin diet samples (2010-2015). Krill size class bins shown on x-axis with the proportion of those size classes depicted on the y-axis. Palmer LTER unpublished data.

The next step of my project is to assess the foraging habits and space-use patterns of these two species. They share food, but do they forage in the same areas? I am in the process of analyzing spatial data obtained from satellite and TDR (time depth recording) tags temporarily attached to Adelie and gentoo penguins during the breeding season to determine the core foraging areas. I am using kernel density estimate (KDE) techniques to visually and quantitatively determine the size and extent of spatial overlap between both species foraging areas (Figure 2).

Figure 2.
Figure 2. An example plot of 3D kernel density estimates outlining 95% and 50% volume contours of foraging penguins during the 2010 breeding season. Orange and green depict the core foraging areas of gentoo and Adelies, respectively. Horizontal axes show northing and easting values and depth is shown in meters on the vertical axis.

The KDE method allows me to turn hundreds of satellite tag derived location points into a probability density surface which depicts where an animal is most likely to be found (Kie et al. 2010).  2D KDEs are sufficient to describe the ranges of many terrestrial animals, however, 3D KDEs are a more appropriate description of the space-use patterns of diving seabirds. By failing to incorporate the depth at which these two species are foraging, 2D KDEs might overestimate the extent of spatial overlap between two species who are foraging in the same location but at different depths. Similar to other studies (Cimino et al. 2016 & Wilson 2010), I am finding that Adelie and gentoo penguins may be partitioning resources by foraging at different depths, with gentoo penguins diving deeper than Adelies. By foraging at different depths, these two species are limiting foraging competition.

While I am working on these analyses, I am also thinking about my next step, which will be to determine whether foraging niche overlap between Adelie and gentoo penguins is a function of prey availability. Resource availability is a critical component of niche segregation. When resources are abundant, there is typically a higher tolerance for niche overlap (Pianka 1974, Torres 2009). Conversely, niches may become more distinct as resources decrease and successfully partitioning these resources will become more important to minimize competition. In order to address the effect of resource availability on niche partitioning between Adelie and gentoo penguins, I will be comparing their foraging niches during years of both low and high prey availability. This will allow me to truly evaluate the potential occurrence of foraging competition between these two species.

Conclusion

I’ll keep you updated on my progress with data analysis in future blogs, but before I go I’ll share one last piece of wisdom about niche theory that I’ve learned from my family. There is a niche for everyone unless you are a Michigan fan, then no amount of spatial or dietary partitioning in a room full of Ohio State Buckeyes will save you.

References 

Cimino, Megan A., et al. “Climate-driven sympatry may not lead to foraging competition between congeneric top-predators.” Scientific reports 6 (2016).

Hutchinson, G.E. “Concluding remarks. Population Studies: Animal Ecology and Demography.” Cold Spring Harbor Symposia on Quantitative Biology 22 (1957): 415-427.

Kie, John G., et al. “The home-range concept: are traditional estimators still relevant with modern telemetry technology?” Philosophical Transactions of the Royal Society of London B: Biological Sciences 365.1550 (2010): 2221-2231.

Pianka, Eric R. “Niche overlap and diffuse competition.” Proceedings of the National Academy of Sciences 71.5 (1974): 2141-2145.

Torres, Leigh G. “A kaleidoscope of mammal, bird and fish: habitat use patterns of top predators and their prey in Florida Bay.” Marine Ecology Progress Series 375 (2009): 289-304.

Wildlife of the Western Antarctic Peninsula

Erin Pickett, MS Student, Fisheries and Wildlife Department, OSU

This time last week, I was on a research vessel crossing the Drake Passage. The Drake extends from the tip of the Western Antarctic Peninsula to South America’s Cape Horn, and was part of the route I was taking home from Antarctica. Over the past three months I have been working on a long-term ecological research (LTER) project based out of Palmer Station, a U.S. based research facility located on Anvers Island.

Image: http://www.tetonat.com/2009/11/06/bon-voyage-off-to-antarctica-with-iceaxe-expeditions/

While in Antarctica, I was working on the cetacean component of the Palmer LTER project, which I’ve described in previous blog posts. In lieu of writing more about what it is like to work and live on the Antarctic Peninsula, I thought I’d share some photos with you. Working on the water everyday while searching for whales provided me with many opportunities to photograph the local wildlife. I hope you’ll enjoy a few of my favorite shots.

An update from the Antarctic Peninsula

By: Erin Pickett

Yesterday someone said to me, “I don’t know if it was sunrise or sunset, but it was beautiful”. So it goes on the R/V Lawrence M. Gould (LMG), the surrounding scenery is incredible but the work schedule on this research ship makes it difficult to remember what time of day it is.

Here on the Antarctic Peninsula, the sun never really sets and our daily schedules are dependent on things like the diel vertical migration of krill, the current wind speed and the amount of sea ice in between us and our study species, the humpback whale. For these reasons, we sometimes find ourselves starting our workday at odd hours, like 11:45 pm (or 4:00 am). As a reminder, I am currently working on research vessel on a project called the Palmer long term ecological research (LTER) project.  You can read my first blog post about that here. We are about one week into our journey and so far, so good!

Our journey began in Punta Arenas, Chile, where we spent two days loading our research supplies onto the LMG and getting outfitted with cold weather gear. From Punta Arenas we headed south through the straights of Magellan and then across the Drake Passage. Along the way we spotted a variety of cetaceans including minke, fin, sei and humpback whales, and Commerson’s and Peale’s dolphins. I spent as much of our time in transit as I could looking for seabirds, the most numerous being white-chinned and cape petrels, southern giant petrels, and black-browed albatrosses. Spotting either a royal or a wandering albatross was always exciting. An eleven foot wingspan allows these albatross to glide effortlessly above the water and this makes for a beautiful sight!

We have spent the last four days transiting between various sampling stations around Palmer deep, which is an underwater canyon just south of our home base at Palmer station. When conditions allowed, we loaded up our tagging and biopsy gear into a small boat and went to look for humpback whales. We’ve been incredibly successful with the limited amount of time we’ve had on the water and this morning we finished deploying our sixth tag.

We brought a few different types of satellite tags with us to deploy on humpback whales. One type is an implantable satellite tag that transmits location data over a long period of time. These data allow us to gain a better understanding of the large-scale movement and distribution patterns of these animals. The other tag we deploy is a suction cup tag, so called because four small suction cups attach the tag to the whale. These suction cup tags are multi-sensor tags that measure location as well as fine scale underwater movement (e.g. pitch, roll, and heading). They are also equipped with forward and backward facing cameras and most importantly, radio transmitters! This allows us to recover the tags once they fall off the animal and float to the surface (after about 24 hours). The data we get from these tags will allow us to quantify fine-scale foraging behavior in terms of underwater maneuverability, prey type and the frequency, depth and time of day that feeding occurs.

When we deployed each of these tags we also obtained a biopsy sample and fluke photos. Fluke photos and biopsy samples allow us to distinguish between individual animals, and the biopsy samples will also be used to study the demographics of this population through genetic analysis.

Now that we’ve deployed all of our satellite tags and have recovered the suction cup tag just in the nick of time (!), we are starting our first major transect line toward the continental shelf. We will be continuing south along these grid lines for the next week.

My lab mate Logan Pallin and I will be continuing to write about our trip over the next couple of months on another blog we created especially for this project. You can find it here: blogs.oregonstate.edu/LTERcetaceans

I’ll leave you with a few of my favorite photos of the trip so far!

“[We] have only one month to survey an inhospitable Antarctic wilderness, the size of Oklahoma, moving at the speed of a bicycle”

– Oscar Schofield, Professor Bio-Optical Oceanography

By: Erin Pickett

There is nothing like a feature film about an upcoming field research project to get you pumped. I’m talking about Antarctic Edge: 70˚ South (now available on DVD, iTunes and Netflix!). In two months a few of us from the Biotelemetry and Behavioral Ecology Laboratory (BTBEL) will be headed down south to participate in the research project that is documented in this film.

The project is called the Palmer Station Antarctica LTER. LTER stands for long term ecological research. The Palmer site is located along the Western Antarctic Peninsula (WAP) and is part of a network of LTER sites around the world that have been established over the last three decades or so for the purpose of long term ecological monitoring. The WAP is a particularly unique place to monitor the effects of climate change because it is one of the most rapidly warming areas in the world. Temperature increases in this region are six times greater than the global average. As a result of increasing temperatures, the peninsula has experience a decline in the extent, concentration and duration of winter sea ice.

After my first viewing of Antarctic Edge with its graphic scenes of calving glaciers I thought, well, that’s a little dramatic. If you watch the preview you’ll get a taste of what I’m talking about. However, in an ecosystem dependent on sea ice, the loss of three months-worth of ice a year is dramatic! The scientists leading the Palmer LTER project have watched the marine ecosystem at Palmer Station transform radically over the course of their careers. Coastal areas along the peninsula more closely resemble the warmer and moister sub-Antarctic rather than a traditionally cold and arid Antarctic climate. The most visible effect of this southward climate shift has been an expansion of sub-Antarctic, or ice-intolerant species, into areas where ice-dependent species are disappearing. Antarctic Edge attempts to convey the urgency and importance of understanding ecological changes like these.

In January, a team of researchers from all over the country will board the R/V Lawrence M. Gould (LMG) and depart Punta Arenas, Chile. From Chile we’ll cross the Drake Passage and continue south to Anvers Island, where our research station is located. Personnel and research gear will be exchanged and then the LMG will transit south along a pre-established sampling grid. This grid covers the entire Western Antarctic Peninsula, an area the size of Oklahoma (69, 498 square miles). Over the course of a month we will collect samples and data on nearly every possible component of the marine ecosystem, including everything from microbes and zooplankton to cetaceans.

I will be working with folks from OSU’s BTBEL lab and collaborators at Duke University to study the region’s whale populations. We will be focusing our efforts on humpback whales and we will be using methods such as photo identification, tagging and biopsy sampling to understand more about this species in this area and to learn more about the ecological roles that these large baleen whales play in this fragile marine ecosystem.  We are especially interested in learning more about the foraging ecology of this species and how their behavior is influenced by their primary prey, Antarctic krill. Many of the region’s top predators share this prey resource, which is declining as a result of sea ice loss. A central objective of our research is to understand how climate induced changes in this polar marine environment are affecting these top predators.

Over the next few months I’ll be keeping you updated on our preparations and journey south. Until then, I encourage you to watch Antarctic Edge: 70˚ South and get pumped!


Outreach and education: sharing the stoke

By Erin Pickett

My friend Matt and I chased after a butterfly waving our nets through the air, jumping and swatting at the trees. For a brief moment I considered how ridiculous I probably looked running around in circles, looking up at the sky and not at my feet or where I was going. I was just about to step on a wasp nest before I came to my senses. The butterfly got away as I looked up to see our group of middle school students walking back to us after finishing their snack break.

It was day three of “Ecosystem sleuths” summer camp, and while Matt and I were helping lead this camp, we were certainly not going to let that stop us from having some good old fashioned fun catching bugs.

Last week my fellow fisheries and wildlife grad students and I walked away from our computers and experiments and took a break from thesis writing and summer field work to spend the week with a group of local middle and high school students. We ran a weeklong ecology-themed summer camp sponsored by Oregon State’s STEM Academy and inspired by our desire to share what we love with young students who are interested in science. This is what I call “sharing the stoke”.

We hoped to teach our students about a few broad and important ecological concepts while introducing them to field methods and sampling techniques. Neither the Corvallis city limits nor IACUC could hold us back and we managed to bring a menagerie of animals into the classroom including polar bears, elk and sharks. We have OSU’s extensive research and teaching collections to thank for giving our students a chance to handle some cool skulls, pelts and other preserved specimens.

One afternoon I led the students in crafting homemade humpback whale flukes, so that we could practice re-sighting them and estimating population sizes using the mark-recapture method. In between lectures and lab activities, with the help of YouTube, we watched two male elephant seals fight for dominance on a northern California beach and got a birds-eye view of a bald eagle soaring through a canyon. One student couldn’t help but jump up and down while watching this video. At the end of the week took the students to Hesthavn Nature Center and spent two afternoons outside collecting terrestrial and aquatic invertebrates, identifying birds, and learning how to pin insects.

After our students left each afternoon we’d all sit down to discuss the next day’s plan. Exhausted, we’d finish the last of the juice boxes and granola bars and wonder how teachers do what they do. Hats off to you, teachers!


Seabirds eat weird things

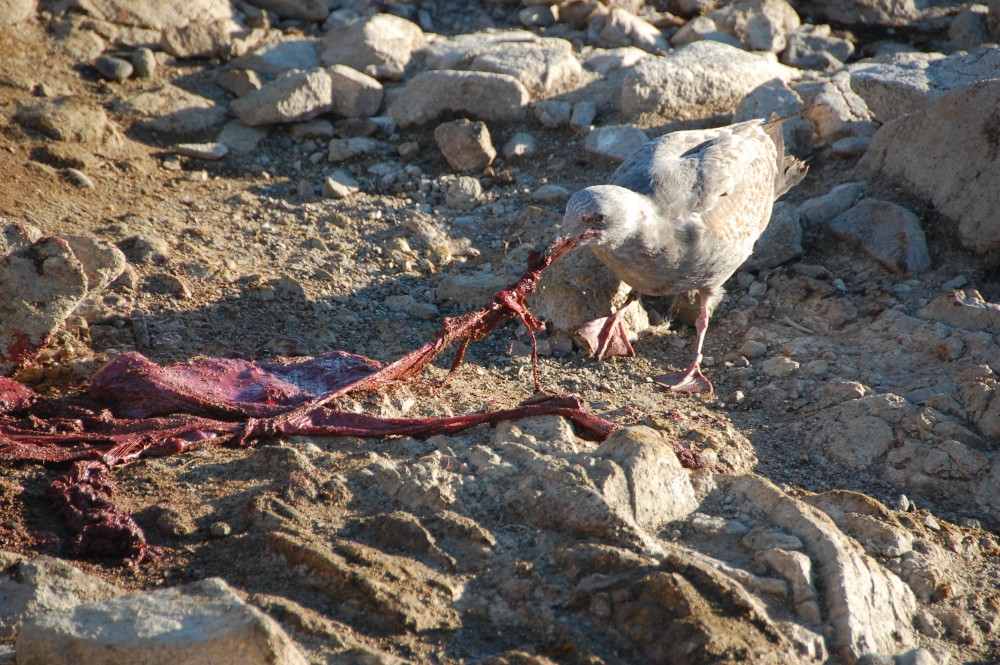
Chicken wings, toy dinosaurs, Easter eggs, driver’s licenses, ham, broccoli, and toy cars, to name a few things. I’ve even seen a gull try to eat a live, 2 ton elephant seal (and have got the pictures to prove it!).

Recently researchers from the GEMM lab, and the Seabird Oceanography lab (SOL) at Hatfield Marine Science Center, have been collaborating with Dr. Scott Shaffer’s Avian Physiology and Ecology laboratory at San Jose State University to investigate the causes and implications of these strange eating habits.

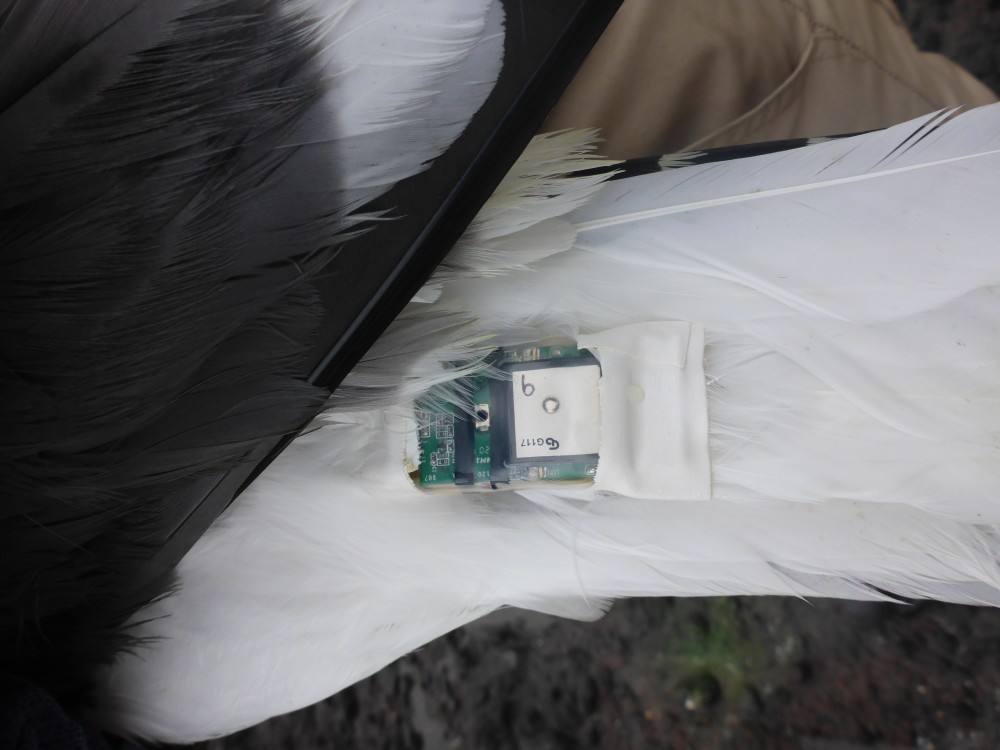
When they aren’t scavenging off of your plate of French fries, Western gulls (Larus occidentalis) are either foraging for fish and invertebrates out at sea, or visiting the local dump to pick up dinner for the little ones. Unfortunately, during the breeding season dinner at the dump comes with the risk of bringing harmful contaminants and pathogenic microbes back to the colony. In addition to littering colonies with refuse, gulls can serve as potential vectors of disease that may affect other nearby wildlife. Seabird ecologists at OSU and SJSU are using GPS tags in order to better understand how different colonies of Western gulls along the West coast are affected by access to landfills. Over the past month, a handful of gulls at colonies in California and Oregon have been outfitted with these light weight tracking devices. The data gained from these tags will allow researchers to study the foraging ecology and habitat use patterns of these individuals. When the tags are recovered, biological samples such as blood and feathers will be collected to determine how these habitat-use patterns (and potentially, trips to the local landfill) are affecting these birds in terms of microflora and contaminant loads.

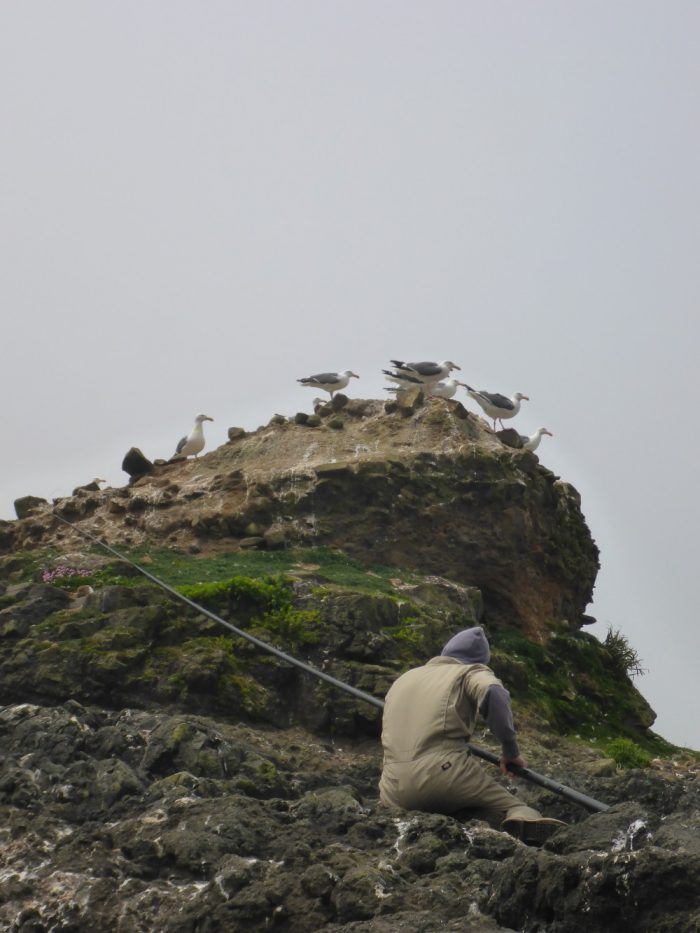
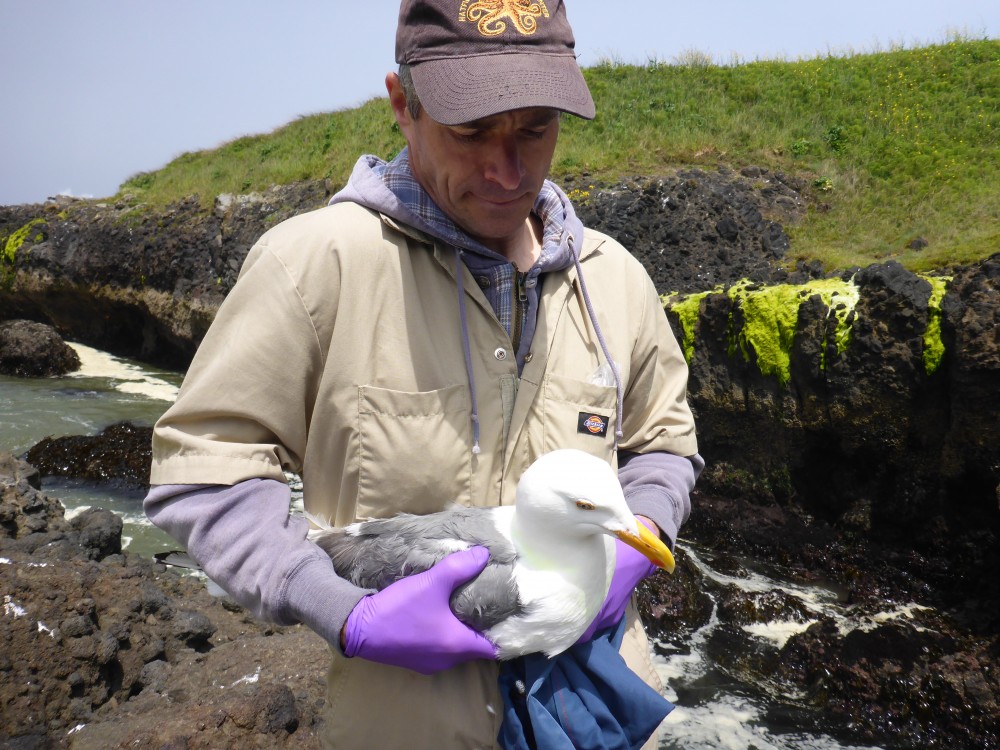
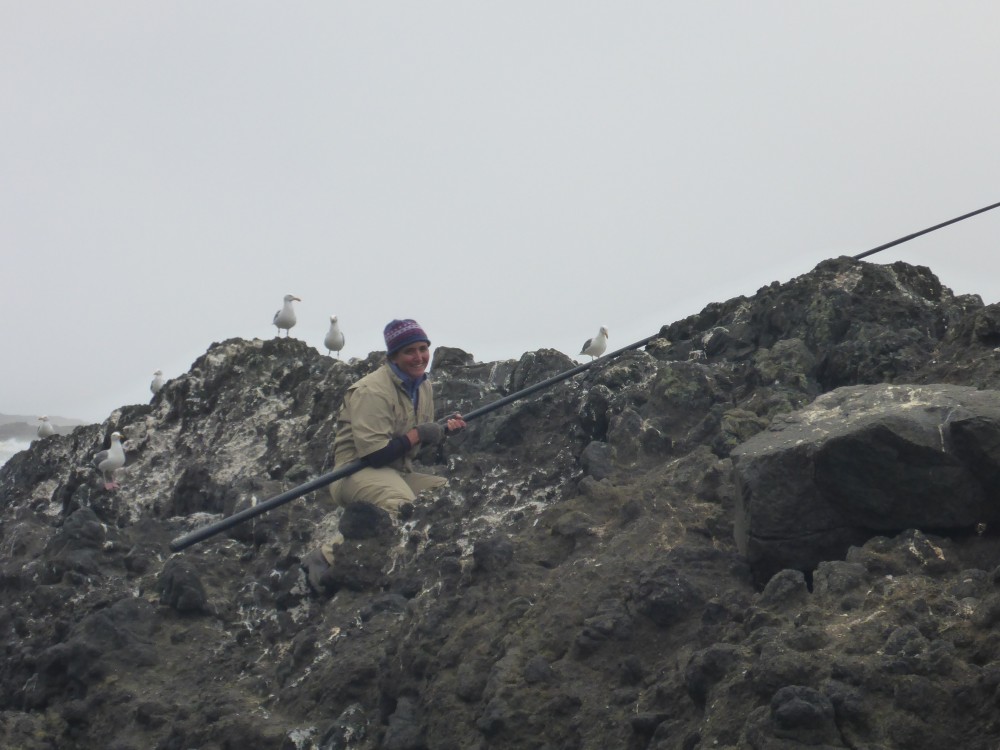
Last week I (Erin Pickett) assisted the GEMM and SOL labs in capturing a few of these birds in order to outfit them with tags. The local field site is just south of Yachats on a guano-covered rock that a small colony of Western gulls call home. Like all great fieldwork and adventures, our day began at 4:00 am (and it was raining!). About an hour later we arrived at our field site, where we assessed the ocean conditions and determined that the treacherous crossing from the mainland to the colony was passable (it was low tide). There is some great GoPro footage of a crossing the week before that consisted mostly of a current rushing over rocks and the occasional flash of a wetsuit or a yellow dry bag while two hands reached out for something stable to hold onto. When I heard about this I became even more excited about the opportunity to join in on the fun.

We spent our morning focused on two tasks. The first was to recapture the two birds who we had put tags on the previous week. Since the tags have to be small and light-weight, they can only collect data for as long as their battery lasts. However, this is long enough to log a few foraging trips and get a good idea of where the gulls are concentrating their foraging effort. Our second goal was to put tags on eight more birds. We used a combination of capture techniques, including a very long pole with a small noose on the end of it, to recapture one of our birds from last week, along with seven new birds who we deployed new tags on. By the end of the second morning the weather was nice enough to enjoy changing into a wetsuit and jumping into the water for the crossing back to shore. Now we just need to get the rest of our tags back. Wish us luck!

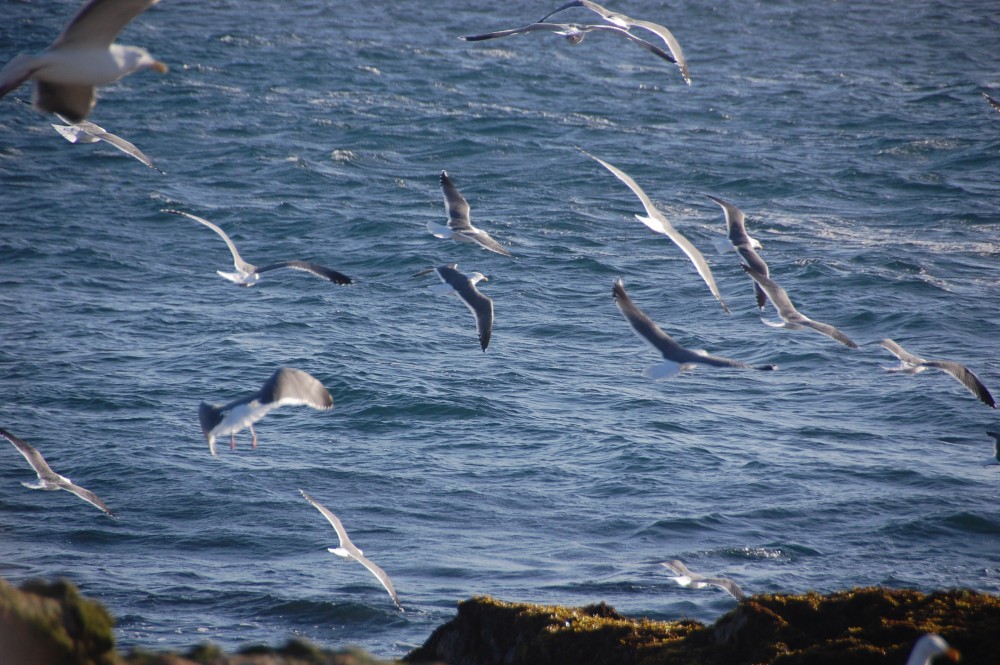
P.S. It’s not often that you purposely put photos of gulls in photo galleries, so I’ve taken this opportunity to find my best shots. These are a couple more of the field sites where our collaborators are working- on Southeast Farallon Island, and Ano Nuevo Island, California