By Rachael Orben, Assistant Professor (Senior Research), Seabird Oceanography Lab
This February I had the opportunity to spend two weeks at Midway Atoll National Wildlife Refuge in the Papahānaumokuākea Marine National Monument. I was there to GPS track black-footed and Laysan albatross during their short chick-brooding foraging trips. Two weeks is just enough time since the albatross are taking short trips (3-5 days) to feed their rapidly growing chicks.
My first visit to Midway (2016 blog post) occurred right as the black-footed albatross chicks were hatching (quickly followed by the Laysan albatross chicks). This time, we arrived almost exactly when I had left off. The oldest chicks were just about two weeks old. This shift in phenology meant that, though subtle, each day offered new insights for me as I watched chicks transform into large aware and semi-mobile birds. By the time we left, unattended chicks were rapidly multiplying as the adults shifted to the chick-rearing stage. During chick rearing, both parents leave the chick unattended and take longer foraging trips.
Our research goal was to collect tracking data from both species that can be used to address a couple of research questions. First of all, winds can aid, or hinder albatross foraging and flight efficiency (particularly during the short brooding trips). In the North Pacific, the strength and direction of the winds are influenced by the ENSO (El Niño Southern Oscillation) cycles. The day after we left Midway, NOAA issued an El Niño advisory indicating weak El Nino conditions. We know from previous work at Tern Island (farther east and farther south at 23.87 N, -166.28 W) that El Niño improves foraging for Laysan albatrosses during chick brooding, while during La Niña reproductive success is lower (Thorne et al., 2016). However, since Midway is farther north, and farther west the scenario might be different there. Multiple years of GPS tracking data are needed to address this question and we hope to return to collect more data next year (especially if La Niña follows the El Niño as is often the case).
We will also overlap the tracking data with fishing boat locations from the Global Fishing Watch database to assess the potential for birds from Midway to interact with high seas fisheries during this time of year (project description, associated blog post). Finally, many of the tags we deployed incorporated a barometric pressure sensor and the data can be used to estimate flight heights relative to environmental conditions such as wind strength. This type of data is key to assessing the impact of offshore wind energy (Kelsey et al., 2018).
How to track an albatross
To track an albatross we use small GPS tags that we tape to the back feathers. After the bird returns from a foraging trip, we remove the tape from the feathers and take the datalogger off. Then we recharge the battery and download the data!
Catching a tagged albatross that just returned from its foraging trip. Photo V. Ternisien
Recording data. Photo V. Ternisien
Getting ready to remove the GPS datalogger. Photo V. Ternisien
The GPS datalogger was taped to the back feathers of the bird. To remove the tag we simply peel off the tape. Photo V. Ternisien
My previous visit to Midway occurred just after house mice were discovered attacking incubating adult albatrosses. Since then, a lot of thought and effort had gone into developing a plan to eradicate mice from Midway. You can find out more via Island Conservation’s Midway blogs and the USFWS.
Dancing.
There is always something happening in a seabird colony.
Red-tailed tropicbird
From left to right: A Laysan albatross, a hybrid, and a black-footed albatross.
The colony was never quiet. Even at night.
A GPS tagged Laysan albatross.
Habitat restoration.
A short-tailed albatross sitting next to his chick (the large black chick the his right).
References
Kelsey, E. C., Felis, J. J., Czapanskiy, M., Pereksta, D. M., & Adams, J. (2018). Collision and displacement vulnerability to offshore wind energy infrastructure among marine birds of the Pacific Outer Continental Shelf. Journal of Environmental Management, 227, 229–247. http://doi.org/10.1016/j.jenvman.2018.08.051
Thorne, L. H., Conners, M. G., Hazen, E. L., Bograd, S. J., Antolos, M., Costa, D. P., & Shaffer, S. A. (2016). Effects of El Niño-driven changes in wind patterns on North Pacific albatrosses. Journal of the Royal Society Interface, 13(119), 20160196. http://doi.org/10.1098/rsif.2016.0196
By Leila Lemos, PhD Candidate, Fisheries and Wildlife Department, Oregon State University
After three years of fieldwork and analyzing a large dataset, it is time to finally start compiling the results, create plots and see what the trends are. The first dataset I am analyzing is the photogrammetry data (more on our photogrammetry method here), which so far has been full of unexpected results.
Our first big expectation was to find a noticeable intra-year variation. Gray whales spend their winter in the warm waters of Baja California, Mexico, period while they are fasting. In the spring, they perform a big migration to higher latitudes. Only when they reach their summer feeding grounds, that extends from Northern California to the Bering and Chukchi seas, Alaska, do they start feeding and gaining enough calories to support their migration back to Mexico and subsequent fasting period.
Northeastern gray whale migration route along the NE Pacific Ocean. Source: https://journeynorth.org/tm/gwhale/annual/map.html
Thus, we expected to see whales arriving along the Oregon coast with a skinny body condition that would gradually improve over the months, during the feeding season. Some exceptions are reasonable, such as a lactating mother or a debilitated individual. However, datasets can be more complex than we expect most of the times, and many variables can influence the results. Our photogrammetry dataset is no different!
In addition, I need to decide what are the best plots to display the results and how to make them. For years now I’ve been hearing about the wonders of R, but I’ve been skeptical about learning a whole new programming/coding language “just to make plots”, as I first thought. I have always used statistical programs such as SPSS or Prism to do my plots and they were so easy to work with. However, there is a lot more we can do in R than “just plots”. Also, it is not just because something seems hard that you won’t even try. We need to expose ourselves sometimes. So, I decided to give it a try (and I am proud of myself I did), and here are some of the results:
Plot 1: Body Area Index (BAI) vs Day of the Year (DOY)
In this plot, we wanted to assess the annual Body Area Index (BAI) trends that describe how skinny (low number) or fat (higher number) a whale is. BAI is a simplified version of the BMI (Body Mass Index) used for humans. If you are interested about this method we have developed at our lab in collaboration with the Aerial Information Systems Laboratory/OSU, you can read more about it in our publication.
The plots above are three versions of the same data displayed in different ways. The first plot on the left shows all the data points by year, with polynomial best fit lines, and the confidence intervals (in gray). There are many overlapping observation points, so for the middle plot I tried to “clean up the plot” by reducing the size of the points and taking out the gray confidence interval range around the lines. In the last plot on the right, I used a linear regression best fit line, instead of polynomial.
We can see a general trend that the BAI was considerably higher in 2016 (red line), when compared to the following years, which makes us question the accuracy of the dataset for that year. In 2016, we also didn’t sample in the month of July, which is causing the 2016 polynomial line to show a sharp decrease in this month (DOY: ~200-230). But it is also interesting to note that the increasing slope of the linear regression line in all three years is very similar, indicating that the whales gained weight at about the same rate in all years.
Plot 2: Body Area Index (BAI) vs Body Condition Score (BCS)
In addition to the photogrammetry method of assessing whale body condition, we have also performed a body condition scoring method for all the photos we have taken in the field (based on the method described by Bradford et al. 2012). Thus, with this second set of plots, we wanted to compare both methods of assessing whale body condition in order to evaluate when the methods agree or not, and which method would be best and in which situation. Our hypothesis was that whales with a ‘fair’ body condition would have a lower BAI than whales with a ‘good’ body condition.
The plots above illustrate two versions of the same data, with data in the left plot grouped by year, and the data in the right plot grouped by month. In general, we see that no whales were observed with a poor body condition in the last analysis months (August to October), with both methods agreeing to this fact. Additionally, there were many whales that still had a fair body condition in August and September, but less whales in the month of October, indicating that most whales gained weight over the foraging seasons and were ready to start their Southbound migration and another fasting period. This result is important information regarding monitoring and conservation issues.
However, the 2016 dataset is still a concern, since the whales appear to have considerable higher body condition (BAI) when compared to other years.
Plot 3:Temporal Body Area Index (BAI) for individual whales
In this last group of plots, we wanted to visualize BAI trends over the season (using day of year – DOY) on the x-axis) for individuals we measured more than once. Here we can see the temporal patterns for the whales “Bit”, “Clouds”, “Pearl”, “Scarback, “Pointy”, and “White Hole”.
We expected to see an overall gradual increase in body condition (BAI) over the seasons, such as what we can observe for Pointy in 2018. However, some whales decreased their condition, such as Bit in 2018. Could this trend be accurate? Furthermore, what about BAI measurements that are different from the trend, such as Scarback in 2017, where the last observation point shows a lower BAI than past observation points? In addition, we still observe a high BAI in 2016 at this individual level, when compared to the other years.
My next step will be to check the whole dataset again and search for inconsistencies. There is something causing these 2016 values to possibly be wrong and I need to find out what it is. The overall quality of the measured photogrammetry images was good and in focus, but other variables could be influencing the quality and accuracy of the measurements.
For instance, when measuring images, I often struggled with glare, water splash, water turbidity, ocean swell, and shadows, as you can see in the photos below. All of these variables caused the borders of the whale body to not be clearly visible/identifiable, which may have caused measurements to be wrong.
Examples of bad conditions for performing photogrammetry: (1) glare and water splash, (2) water turbidity, (3) ocean swell, and (4) a shadow created in one of the sides of the whale body. Source: GEMM Lab. Taken under NMFS permit 16111 issued to John Calambokidis.
Thus, I will need to check all of these variables to identify the causes for bad measurements and “clean the dataset”. Only after this process will I be able to make these plots again to look at the trends (which will be easy since I already have my R code written!). Then I’ll move on to my next hypothesis that the BAI of individual whales varied by demographics including sex, age and reproductive state.
To carry out robust science that produces results we can trust, we can’t simply collect data, perform a basic analysis, create plots and believe everything we see. Data is often messy, especially when developing new methods like we have done here with drone based photogrammetry and the BAI. So, I need to spend some important time checking my data for accuracy and examining confounding variables that might affect the dataset. Science can be challenging, both when interpreting data or learning a new command language, but it is all worth it in the end when we produce results we know we can trust.
Paul Lask teaches writing at Oregon Coast Community College, and is a faculty fellow with Portland State University’s Institute for Sustainable Solutions. His writing can be found at prlask.com.
I pulled my kayak down to the beach, where a woman stood pointing toward the ocean. A fin rose from the water about a hundred yards offshore.
“It’s an orca,” she said.
“Naw,” the man beside her said. “That’s a gray.”
I recalled a documentary scene of a group of orcas spy-hopping near a seal marooned on an ice chunk. After their pogoing taunts, they left it alone. Another clip showed the orcas band together and charge forward, pushing a big wave over the ice and knocking the seal in.
I brought myself back to the beach. I wanted it to be a gray. It was one of my first solo ocean paddles, and I stood in my dry suit, PFD and helmet, having checked my weather and swell apps, having spent many hours in pools and bays learning rolls and rescues, and many dollars on courses, gear and guidebooks, now arguing a dubious fin into goodness.
It had to be a gray.
I dragged my boat to the water. Small dumping waves sucked back dark gravelly sand. The fin flopped over.
Aspiring rough water sea kayakers are trained in safety and rescue. We learn about dealing with battering surf, longshore currents, T-rescues and re-entry rolls. We don’t learn about sea life. I grew up in northern Illinois, where the nearest sea animal was a river dragon fashioned out of a downed tree that got painted annually, and TV specials on Loch Ness.
Paddling around rock near Cape Meares, Oregon.
I stuffed myself into my boat, suddenly remembering the shark story an instructor told me: They were out near Pacific City when the bad fin emerged. My instructor had a Go Pro on his helmet. His buddy dared him to roll to get a shot of their follower. My instructor declined.
Sealing my spray skirt over the cockpit, I focused on launch prep. I checked my radio. Made sure my extra paddle was secure. Confirmed I hadn’t sealed the skirt over my skeg rope. Here at North Fogarty Creek beach there was a gap between where the fin had been and a rock the size of a two story house. I waited for a set of waves to pass, then pushed off.
I saw the gray whale’s back split the water, heard the great sigh. A misty rainbow evaporated. I darted past the whale into the open sea. Other puffs dotted the horizon.
In time I would learn the kelp forest I had just paddled through hosted galaxies of tiny shrimp-like zooplankton. The gray was “sharking,” a foraging behavior in shallow water wherein it lays on its side with half its tail sticking out. Of the 20,000 gray whales that annually migrate from Mexico to Alaska, about 200 mysteriously break away and feed nearshore in Oregon. Scientists don’t know[i] for sure why this occurs, but the abundance of those shrimp-like animals is one theory.
Gray whale landing after a breach off Newport, Oregon. Taken under NMFS permit 16111 by Leigh Torres.
The mavericks are good for the tourism industry. From late spring through summer Depoe Bay is a frenzy of camera clicks and selfie sticks. A gauntlet of vehicles cram both sides of Hwy 101. Whale watching boats enter and exit the “world’s smallest harbor” through a bottleneck I’ve heard can be sketchy for kayakers.
As I paddled I toyed with wishful thinking—because I was a non-motorized vessel, the whales might better appreciate my presence. I was not there to photograph them. I just liked being in the sway of the water. “No cradle is so comfortable,” Rudyard Kipling wrote, “as the long, rocking swell of the Pacific.”[ii] Especially on an uncharacteristically calm day like this.
I have met paddlers who are indifferent to our resident grays. One referred to them as squirrels. Another claimed he got too near a spout, and was covered in the slime geyser, which he’d found disgusting. Others want to get close. A friend is interested in bringing snorkeling gear out next season, and a non-paddling acquaintance wants to get a kayak so he can sneak up and swim with one.
Dr. Roger Payne, the biologist famous for discovering that humpbacks sing, discusses Baja’s “‘friendly gray whale phenomenon’, wherein gray whales come so close to whale-watching boats that the tourists can reach out and pat them.”[iii] Grays weren’t always treated like housecats. When whaling was in full swing, Dr. Payne continues, they were referred to as “devil fish” by whalers in Scammon’s Lagoon in Baja. The whales were being routinely harpooned, so they fought back, earning a fierce reputation. Their numbers plummeted. Federal protections helped them recover, and in 1994 eastern Pacific gray whales were removed from the U.S. Endangered Species List.
Paddling under arch at Three Arch Rocks.
U.S. federal law requires people keep a hundred yards away from whales. Natural law supports this precaution. Once paddling through my shark and orca anxiety, I developed an ambivalence about my proximity to the grays. It was not fear of aggression, but indifference. I was sneaking around the living room of 35-ton animals. Despite their boxcar bulk, they moved with quick snaky grace; regardless of my attempts at putting a football field between us, what was to keep one from accidentally rolling over me or smashing me with its tail?
With shipwrecks in mind, Herman Melville pondered the power of a whale fluke: “But as if this vast local power in the tendinous tail were not enough, the whole bulk of the leviathan is knit over with a warp and woof of muscular fibers and filaments, which passing on either side of the loins and running down into the flukes, insensibly blend with them, and largely contribute to their might; so that in the tail the confluent measureless force of the whole whale seems concentrated to a point. Could annihilation occur to matter, this were the thing to do it.”[iv]
Whale-caused shipwrecks didn’t end in the nineteenth century. Contemplating how his sloop went down, Steven Callahan, a sailor lost at sea for 76 days, recalls how his nineteen-ton, forty-three-foot schooner and a heavy cruiser were both sunk by whales in the 1970s.[v] Dr. Payne also has boat breaching stories. “There’s a woman who works in my laboratory who had a whale breach directly on top of her boat. Not a glancing blow, but a direct hit across the bow. The boat was totaled…”
In 2015, a 33-ton humpback breached onto a tandem kayak in Monterey Bay, California. Reanalyzing video footage, Tom Mustill, one of the struck kayakers, believes he can see the whale “sticking its eyes out and taking a look at us while he’s in the air.” He speculates that the whale may have calculated its landing so as to avoid full body impact. Mustill is currently making a BBC2 documentary about the incident titled “Humpback Whales: A Detective Story.”
How whales behave around vessels is still an open scientific question. OSU whale mammologist Dr. Leigh Torres asks: “Are there behavior differences based on boat traffic and composition? Whales might react to some boats, but perhaps not others based on speed, approach, motor type, etc.”[vi] The ocean is also getting noisier. One study shows that over the last sixty years ambient noise in the ocean has increased about three to five decibels per decade.[vii] To what extent is this noise stressing out whales, and what kind of reactions will we begin to see?
***
Dr. Torres told me whales were like a gateway drug for getting people hooked on marine ecology. Since that tricky fin at Fogarty Creek I’ve given them a good amount of thought. It’s partially their size that inspires awe and reflection. Writer Julia Whitty gets at their enormity by thinking about their deaths, comparing whales to old growth trees. She describes whalefall beautifully:
“…the downward journey takes place in the slow motion of the underwater world, as the processes of decomposition produce buoyant gases that duel with the force of gravity in such a way that the carcass rides a gentle elevator up and down on its way down” (178). Once the body hits the ocean floor it provides a “nutritional bonanza of a magnitude that might otherwise take thousands of years to accumulate from the background flow of small detritus from the surface.” A gray takes a year and a half to be “stripped to the bone by the scalpels and stomachs of the deep.” A blue whale can take as long as eleven years. [viii]
But I don’t think it’s just their size that hooks us. They’re mammals, nurse their young, sing to one another. “Flowing like breathing planets,” Gary Snyder writes,[ix] we can only wonder what a whale might know.
As I continue exploring our coast by kayak, I occasionally talk to whales. It no longer seems strange to want to hug one. I attempt to maintain the lawful distance, though now and then one rises close enough to see the individual barnacles studded among old scratches and scribbles. This wordless poetry is like a map into deep time. I realize I want to keep being humbled and a little afraid. I realize I’m hooked.
Author paddling near Three Arch Rocks. Photo by Bruce Moreira.
References
[i] Oregon State University. (2015, August 4). Researchers studying Oregon’s “resident population” of gray whales. Retrieved from https://today.oregonstate.edu/archives/2015/aug/researchers-studying-oregon’s-“resident-population”-gray-whales
[ii] Kipling, R. (1914). The Jungle Book (p. 145). New York, NY: Double Day. Retrieved from https://play.google.com/store/books/details?id=LO88AQAAIAAJ&rdid=book-LO88AQAAIAAJ&rdot=1
[iii] White, J. (2016). Talking on the Water (pp. 25-26). San Antonio, TX: Trinity University Press.
[iv] Friends of the Earth. (1970). Wake of the Whale (p. 71). San Francisco, CA: Friends of the Earth, Inc.
[v] Steven, C. (2002). Adrift (p. 37). New York, NY: First Mariner Books.
[vi]Oregon State University. (2015, August 4). Researchers studying Oregon’s “resident population” of gray whales. Retrieved from
[vii] Lemos, L. (2016, April 6). Does ocean noise stress-out whales?. In Geospatial Ecology of Marine Megafauna Laboratory. Retrieved from http://blogs.oregonstate.edu/gemmlab/2016/04/06/does-ocean-noise-stress-out-whales/
[viii] Whitty, J. (2010). Deep Blue Home (pp. 178-181). New York, NY: Houghton Mifflin Harcourt.
[ix] Snyder, G. (1974). Turtle Island. New York, NY: New Directions Publishing Group. Retrieved from https://www.poets.org/poetsorg/poem/mother-earth-her-whales-0
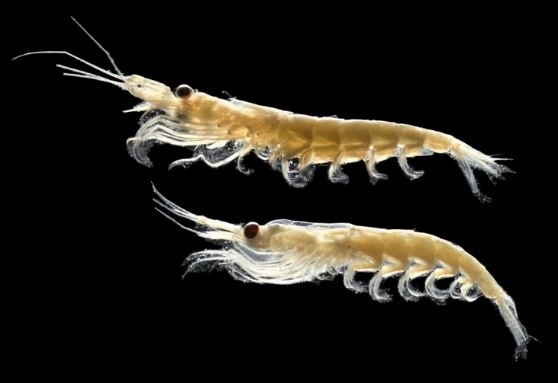
I have the privilege of studying the largest animals on the planet: blue whales (Balaenoptera musculus). However, in order to understand the ecology, distribution, and habitat use patterns of these ocean giants, I have dedicated the past several months to studying something much smaller: krill (Nyctiphanes australis). New Zealand’s South Taranaki Bight region (“STB”, Figure 1) is an important foraging ground for a unique population of blue whales [1,2]. A wind-driven upwelling system off of Kahurangi Point (the “X” in Figure 1) generates productivity in the region [3], leading to an abundance of krill [4], the desired blue whale prey [5].
Figure 1. A map of New Zealand, with the South Taranaki Bight (STB) region delineated by the black box. Cape Farewell is denoted by a star, and Kahurangi point is denoted by an X.
Figure 4. A blue whale lunges on an aggregation of krill. UAS piloted by Todd Chandler.
Krill (Nyctiphanes australis), blue whale prey in New Zealand’s South Taranaki Bight region. Image: Te Papa.
Our blue whale research team collected a multitude of datastreams in three different years, including hydroacoustic data to map krill distribution throughout our study region. The summers of 2014 and 2017 were characterized by what could be considered “typical” conditions: A plume of cold, upwelled water curving its way around Cape Farewell (marked with the star in Figure 1) and entering the South Taranaki Bight, spurring a cascade of productivity in the region. The 2016 season, however, was different. The surface water temperatures were hot, and the whales were not where we expected to find them.
Figure 2. Sea surface temperature maps of the South Taranaki Bight region in each of our three study years. The white circles indicate where most blue whale sightings were made in each year. Note the very warm temperatures in 2016, and more westerly location of blue whale sightings.
What happened to the blue whales’ food source under these different conditions in 2016? Before I share some preliminary findings from my recent analyses, it is important to note that there are many possible ways to measure krill availability. For example, the number of krill aggregations, as well as how deep, thick, and dense those aggregations are in an area will all factor into how “desirable” krill patches are to a blue whale. While there may not be “more” or “less” krill from one year to the next, it may be more or less accessible to a blue whale due to energetic costs of capturing it. Here is a taste of what I’ve found so far:
In 2016, when surface waters were warm, the krill aggregations were significantly deeper than in the “typical” years (ANOVA, F=7.94, p <0.001):
Figute 3. Boxplots comparing the median krill aggregation depth in each of our three survey years.
The number of aggregations was not significantly different between years, but as you can see in the plot below (Figure 4) the krill were distributed differently in space:
Figure 4. Map of the South Taranaki Bight region with the number of aggregations per 4 km^2, standardized by vessel survey effort. The darker colors represent areas with a higher density of krill aggregations.
While the bulk of the krill aggregations were located north of Cape Farewell under typical conditions (2014 and 2017), in the warm year (2016) the krill were not in this area. Rather, the area with the most aggregations was offshore, in the western portion of our study region. Now, take a look at the same figure, overlaid with our blue whale sighting locations:
Figure 5. Map of standardized number of krill aggregations, overlaid with blue whale sighting locations in red stars.
Where did we find the whales? In each year, most whale encounters were in the locations where the most krill aggregations were found! Not only that, but in 2016 the whales responded to the difference in krill distribution by shifting their distribution patterns so that they were virtually absent north of Cape Farewell, where most sightings were made in the typical years.
The above figures demonstrate the importance of studying an ecosystem. We could puzzle and speculate over why the blue whales were further west in the warm year, but the story that is emerging in the krill data may be a key link in our understanding of how the ecosystem responds to warm conditions. While the focus of my dissertation research is blue whales, they do not live in isolation. It is through understanding the ecosystem-scale story that we can better understand blue whale ecology in the STB. As I continue modeling the relationships between oceanography, krill, and blue whales in warm and typical years, we are beginning to scratch the surface of how blue whales may be responding to their environment.
Torres LG. 2013 Evidence for an unrecognised blue whale foraging ground in New Zealand. New Zeal. J. Mar. Freshw. Res.47, 235–248. (doi:10.1080/00288330.2013.773919)
Barlow DR et al. 2018 Documentation of a New Zealand blue whale population based on multiple lines of evidence. Endanger. Species Res.36, 27–40. (doi:https://doi.org/10.3354/esr00891)
Shirtcliffe TGL, Moore MI, Cole AG, Viner AB, Baldwin R, Chapman B. 1990 Dynamics of the Cape Farewell upwelling plume, New Zealand. New Zeal. J. Mar. Freshw. Res.24, 555–568. (doi:10.1080/00288330.1990.9516446)
Bradford-Grieve JM, Murdoch RC, Chapman BE. 1993 Composition of macrozooplankton assemblages associated with the formation and decay of pulses within an upwelling plume in greater cook strait, New Zealand. New Zeal. J. Mar. Freshw. Res.27, 1–22. (doi:10.1080/00288330.1993.9516541)
Gill P. 2002 A blue whale (Balaenoptera musculus) feeding ground in a southern Australian coastal upwelling zone. J. Cetacean Res. Manag.4, 179–184.
By Dominique Kone, Masters Student in Marine Resource Management
Species reintroductions are a management strategy to augment the reestablishment or recovery of a locally-extinct or extirpated species into once native habitat. The potential for reestablishment success often depends on the species’ ecological characteristics, habitat requirements, and relationship and effects to other species in the environment[1]. While the science behind species reintroductions is continuously evolving and improving, reintroductions are still inherently risky and uncertain in nature. Therefore, every effort should be made to fully assess ecological factors before a reintroduction takes place. As Oregon considers a potential sea otter reintroduction, understanding these ecological factors is an important piece of my own graduate research.
Sea otters are oftentimes referred to as keystone species because they can have wide-reaching effects on the community structure and function of nearshore marine environments. Furthermore, relative to other marine mammals or top predators, several papers have documented these effects – partially due to the ease in observing their foraging and social behaviors, which typically take place close to shore. In many of these studies, a classic paradigm repeatedly appears: when sea otters are present, prey densities (e.g., sea urchins) are significantly reduced, while macroalgae (e.g., kelp, seagrass) densities are high.
Source: Belleza.
While this paradigm is widely-accepted amongst researchers, a few key studies have also demonstrated that the effects of sea otters may be more variable than we once thought. The paradigm does not necessarily hold true everywhere sea otters exist, or at least not to the same degree. For example, after observing benthic communities along islands with varying sea otter densities in the Aleutian archipelago, Alaska, researchers found that islands with abundant otter populations consistently supported low sea urchin densities and high, yet variable, kelp densities. In contrast, islands without otters consistently had low kelp densities and high, yet variable, urchin densities[2]. This study demonstrates that while the classic paradigm generally held true, the degree to which the ecosystem belonged to one of two dominant states (sea otters, low urchins, and high kelp or no sea otters, high urchins, and low kelp) was less obvious.
This example demonstrates the danger in applying this one-size-fits-all paradigm to sea otter effects. Hence, we want to achieve a better understanding of potential sea otter effects so that managers may anticipate how Oregon’s nearshore environments may be affected if sea otters were to be reintroduced. Yet, how can we accurately anticipate these effects given these potential variations and deviations from the paradigm? Interestingly, if we look to other fields outside ecology, we find a possible solution and tool for tackling these uncertainties: a systematic review of available literature.
Two ecosystem states as predicted by the classic paradigm (left: kelp-dominated; right: urchin-dominated). Source: SeaOtters.com.
For decades, medical researchers have been conducting systematic reviews to assess the efficacy of treatments and drugs by combining several studies to find common findings[3]. These findings can then be used to determine any potential variation between studies (i.e. instances where the results may conflict or differ from one another) and even test the influence and importance of key factors that may be driving that variation[4]. While systematic reviews are quite popular within the medical research field, they have not been applied regularly in ecology, but recognition of their application to ecological questions is growing[5]. In our case of achieving a better understanding of the drivers of ecological impacts of sea otter, a systematic literature review is an ideal tool to assess variable effects. This review will be the focus of my second thesis chapter.
In conducting my review, there will be three distinct phases: (1) review design and study collection, (2) meta-analysis, and (3) factor testing. In the first phase (review design and study collection), I will search the existing literature to collect studies that explicitly compare the availability of key ecosystem components (i.e. prey species, non-prey species, and macroalgae species) when sea otters are absent and present in the environment. By only including studies that make this comparison, I will define effects as the proportional change in each species’ or organism group’s availability (e.g. abundance, biomass, density, etc.) with and without sea otters. In determining these effects, it’s important to recognize that sea otters alter ecosystems via both direct and indirect pathways. Direct effects can be thought of as any change to prey availability via sea otter predation directly, while indirect effects can be thought of an any alteration to the broader ecosystem (i.e. non-prey species, macroalgae, habitat features) as an indirect result from sea otter predation on prey species. I will record both types of effects.
General schematic of a meta-analysis in a systematic review. A meta-analysis is the process of taking multiple datasets (i.e. Data 1, Data 2 etc.) from literature sources, calculating summary statistics or effects (i.e. Summary 1, Summary 2, etc.) for each dataset, running statistical procedures (e.g. SMA = sequential meta-analysis) to relate summary effects and investigate between study variation, and identifying important features driving variation. Source: MediCeption.
In phase two, I will use meta-analytical procedures (i.e. statistical analyses specific to systematic reviews) to calculate one standardized metric to represent sea otter effects. These effects will be calculated and averaged across all collected studies. As previously discussed, there may be key factors – such as sea otter density – that influence these effects. Therefore, in phase three (factor testing), effects will also be calculated separately for each a priori factor to test their influence on the effects. Such factors may include habitat type (i.e. hard or soft sediment), prey species (i.e. sea urchins, crabs, clams, etc.), otter density, depth, or time after otter recolonization.
In statistical terms, the goal of testing factors is to see if the variation between studies is impacted by calculating sea otter effects separately for each factor versus across all studies. In other words, if we find high variation in effects between studies, there may be important factors driving that variation. Therefore, in systematic reviews, we recalculate effects separately for each factor to try to explain that variation. If, however, after testing these factors, variation remains high, there may be other factors that we didn’t test that could be driving that remaining variation. Yet, without a priori knowledge on what those factors could be, such variation should be reported as a major source of uncertainty.
Source: Giancarlo Thomae.
Predicting or anticipating the effects of reintroduced species is no easy feat. In instances where the ecological role of a species is well known – and there is adequate data – researchers can develop and use ecosystem models to predict with some certainty what these effects may be. Yet, in other cases where the species’ role is less studied, has less data, or is more variable, researchers must look to other tools – such as systematic reviews – to gain a better understanding of these potential effects. In this case, a systematic review on sea otter effects may prove particularly useful in helping managers understand what types of ecological effects of sea otters in Oregon are most likely, what the important factors are, and, after such review, what we still don’t know about these effects.
References:
[1] Seddon, P. J., Armstrong, D. P., and R. F. Maloney. 2007. Developing the science of reintroduction biology. Conservation Biology. 21(2): 303-312.
[2] Estes, J. A., Tinker, M. T., and J. L. Bodkin. 2009. Using ecological function to develop recovery criteria for depleted species: sea otters and kelp forests in the Aleutian Archipelago. Conservation Biology. 24(3): 852-860.
[3] Sutton, A. J., and J. P. T. Higgins. 2008. Recent developments in meta-analysis. Statistics in Medicine. 27: 625-650.
[4] Arnqvist, G., and D. Wooster. 1995. Meta-analysis: synthesizing research findings in ecology and evolution. TREE. 10(6): 236-240.
[5] Vetter, D., Rucker, G., and I. Storch. 2013. Meta-analysis: a need for well-defined usage in ecology and conservation biology. Ecosphere. 4(6): 1-13.
By Lisa Hildebrand, MSc student, OSU Department of Fisheries and Wildlife, Geospatial Ecology of Marine Megafauna Lab
As I enter my second term at OSU as a Master’s student, the ideas and structure of my thesis are slowly coming together. As of right now, my plan is to have two data chapters: The first chapter will assess the quality of zooplankton prey gray whales have access to along the Oregon coast, by looking at energetic value and microplastic content. I will contemplate about how my results potentially affect gray whale health. The second chapter will investigate fine-scale foraging and space use of gray whales in the Port Orford area to determine whether individual specialisation exists.
Fig 1. What it feels like when you start a literature review. Source: Harvard Blogs.
When I first started digging into the scientific literature to prepare for writing my thesis proposal (which is still underway but I’m getting close to the end of a first draft…), one sentence that I seemed to stumble across more often than not was “Marine plastics are ubiquitous” or “Plastics have become ubiquitous in the marine environment” or some other, very similar, iteration of that statement (e.g. Machovsky-Capuska et al. 2019; Eriksen et al. 2014; Fendall & Sewell 2009).
Many of the papers I first read were review papers on microplastics that mostly discussed general concepts like dispersal mechanisms, trophic transfer, or how microplastics become degraded. While I often think of review papers as treasure chests, since they neatly and succinctly summarise an often complicated and busy area of research into just a few pages, sometimes the fine-scale detail can go missing. Therefore, when reading these review papers, I wasn’t learning the in depth details about specific studies where microplastics had been detected in a group of individuals, population or species. So I felt the statement “Plastics are ubiquitous” was just a good (and pretty dramatic) opening line for a paper. However, once I delved into the studies on single species, I was overwhelmed by the amount of results that GoogleScholar spit out at me. If you type “microplastics marine” into the search bar, you’ll get about 7,650 results. This amount might not sound like a lot, especially if you compare it to say “gray whale”, which generates 96,600 results. Yet, the microplastic extraction method typically used was only developed in 2004 (Thompson et al. 2004). Hence, in a span of just 15 years, over 7,000 studies have detected microplastics in over 660 marine organisms (Secretariat of the Convention on Biological Diversity 2012) – a fact I find extremely troubling.
Fig 2. Graphic explaining how plastics don’t go away. Source: Biotecnika.
Microplastics are most commonly viewed as particles <5 mm in size (though there is some contention on this size classification, e.g. Claessens et al. 2013). Microplastics arise from several sources, including fragmentation of larger plastics by UV photo-degradation, wave action and physical abrasion, loss of pre-production pellets (nurdles) and polystyrene beads from shipping vessels, waste water discharge containing microbeads used in cosmetics and microfibers released during the washing of textiles and run-off from land (Nelms et al. 2018). Their small size makes these persistent particles bioavailable to ingestion by a variety of marine taxa, ranging from small prey organisms such as zooplankton, to large megafauna such as whales.
Zooplankton are at the base of marine food webs and are therefore consumed in large quantities by a large number of consumers. The propensity of zooplankton to feed in surface waters makes them highly susceptible to encountering and ingesting microplastics as this is where these synthetic particles are highly abundant (Botterell et al. 2018). Microplastics have been detected in zooplankton from the Northeast Pacific Ocean (Desforges et al. 2015), northern South China Sea (Sun et al. 2017), and Portuguese coast (Frias et al. 2014). Additionally, there is documented overlap between microplastic and zooplankton occurrence at many more locations (e.g. North Western Mediterranean Sea, Collignon et al. 2012; Baltic Sea, Gorokhova 2015; Arctic Ocean, Lusher et al. 2015a). As microplastics research is still in its relative infancy, the extent to which microplastics are ingested by zooplankton and the consequences of this behaviour are uncertain. Nevertheless, exposure to microplastics could lead to entanglement of particles within feeding appendages and/or block internal organs, which may result in reduced feeding, poor overall health, injury and death (Desforges et al. 2015). Though a lab study has found that microplastics are expelled by zooplankton after ingestion, the gut-retention times varied between species, and there is the potential risk of exposure to toxins that leech off of particles while in the body (Cole et al. 2013; the below video is from the afore-mentioned study showing how plankton eat plastics, which are illuminated in fluorescent green).
The large knowledge gap regarding the health implications indicates a strong need for more laboratory studies that investigate the long-term effects of persistent exposure to microplastics on lower trophic organisms, as well as continued short-term experiments that examine whether different zooplankton species are affected differently, since morphologies and life-histories vary widely.
Let’s take a step back and re-focus our lens onto a marine taxa that is much, much bigger in size than a zooplankton: cetaceans. Plastic debris has been documented in the stomachs of stranded individuals of several cetacean species (See Baulch & Perry 2014 for a review), however findings of microplastics in cetaceans are less common. Since cetaceans consume large amounts of prey a day, up to several tons daily for some baleen whales, the likelihood that they are ingesting microplastics through their prey is relatively high (Nelms et al. 2018). Therefore the low number of reported cases is again likely due to the relative novelty of microplastic detection methods. Despite the paucity of studies, microplastics have been found in a True’s beaked whale (Mesoplodon mirus, Lusher et al. 2015b), a humpback whale (Megaptera novaeangliae, Besseling et al. 2015) and an Indo-Pacific humpback dolphin (Sousa chinensis, Zhu et al. 2018), showing that microplastic ingestion by cetaceans does occur. Whether these individuals actively (i.e. active feeding) or passively (i.e. uptake through prey consumption) consumed the microplastics, or inhaled them at the water-air interface, is unknown. As with zooplankton, the short- and long-term impacts of ingesting microplastics by marine mammals is also unknown, though impacts on survival, feeding and uptake of toxins are all possibilities.
Fig 3. Example of a light trap sample collected off the Newport coast. Source: L. Torres.
The data collection and analysis I am doing for my thesis will hopefully fill small pockets in these large knowledge gaps. I hope to be able to quantify the extent of microplastic pollution among zooplankton species in nearshore Oregon waters. By comparing samples from several years, months and locations, I will determine whether microplastic loads vary spatially and temporally. Since their abundance and presence have been described as being patchy due to the influence of oceanographic and weather conditions (GESAMP 2016), it would seem reasonable to assume that there will be variation. But, results are a ways away as we have not even started our microplastic extraction techniques, which involves digesting samples in potassium hydroxide solution, incubating them at 50ºC for 48-72 hours, sorting through the dissolved material to identify potential plastics and sending them away for analysis. We first have to work our way through jars upon jars of unopened zooplankton light trap samplesthat need to be sorted by species. I am thankfully joined by undergraduate Robyn Norman who has already assisted this project immensely over the last two years with her zooplankton sorting prowess. So in case anyone wants to come looking for us over the next few weeks, you’ll find both Robyn and me sitting in front of a laminar flow hood in the lab of ecotoxicologist Dr. Susanne Brander, with whom we are collaborating on the microplastics portion of my thesis.
References
Baulch, S., & Perry, C., Evaluating the impacts of marine debris on cetaceans. Marine Pollution Bulletin, 2014. 80(1-2): 210-221.
Besseling, E., et al., Microplastic in a macro filter feeder: humpback whale Megaptera novaeangliae. Marine Pollution Bulletin, 2015. 95: 248-252.
Botterell, Z.L.R., et al., Bioavailability and effects of microplastics on marine zooplankton: a review. Environmental Pollution, 2018. 245: 98-110.
Claessens, M., et al., New techniques for the detection of microplastics in sediments and field collected organisms. Marine Pollution Bulletin, 2013. 70(1-2): 227-233.
Cole, M., et al., Microplastic ingestion by zooplankton. Environmental Science & Technology, 2013. 47(12): 6646-6655.
Collignon, A., et al., Neustonic microplastic and zooplankton in the North Western Mediterranean Sea. Marine Pollution Bulletin, 2012. 64(4): 861-864.
Desforges, JP.W., et al., Ingestion of microplastics by zooplankton in the Northeast Pacific Ocean. Archives of Environmental Contamination and Toxicology, 2015. 69(3): 320-330.
Eriksen, M., et al., Plastic pollution in the world’s oceans: more than 5 trillion plastic pieces weighing over 250,000 tons afloat at sea. PLoS ONE, 2014. doi.org/10.1371/journal.pone.0111913.
Fendall, L.S., & Sewell, M.A., Contributing to marine pollution by washing your face: microplastics in facial cleansers. Marine Pollution Bulletin, 2009. 58(8): 1225-1228.
Frias, J.P.G.L., et al., Evidence of microplastics in samples of zooplankton from Portuguese coastal waters. Marine Environmental Research, 2014. 95: 89-95.
Gorokhova, E., Screening for microplastic particles in plankton samples: how to integrate marine litter assessment into existing monitoring programs? Marine Pollution Bulletin, 2015. 99(1-2): 271-275.
Lusher, A.L., et al., Microplastics in Arctic polar waters: the first reported values of particles in surface and sub-surface samples. Scientific Reports, 2015a. 5: 14947.
Lusher, A.L., et al., Microplastic and macroplastic ingestion by a deep diving, oceanic cetacean: the True’s beaked whales Mesoplodon mirus. Environmental Pollution, 2015b. 199: 185-191.
Machovsky-Capuska, G.E., et al., A nutritional perspective on plastic ingestion in wildlife. Science of the Total Environment, 2019. 656: 789-796.
Nelms, S.E., et al., Investigating microplastic trophic transfer in marine top predators. Environmental Pollution, 2018. 238: 999-1007.
Secretariat of the Convention on Biological Diversity and the Scientific and Technical Advisory Panel – GEF (2012), Impacts of marine debris on biodiversity: current status and potential solutions. Montreal, Technical Series. 67: 1-61.
Sun, X., et al., Ingestion of microplastics by natural zooplankton groups in the northern South China Sea. Marine Pollution Bulletin, 2017. 115(1-2): 217-224.
Thompson, R.C., et al., Lost at sea: where is all the plastic? Science, 2004. 304(5672): 838.
Zhu, J., et al., Cetaceans and microplastics: First report of microplastic ingestion by a coastal delphinid, Sousa chinensis. Science of the Total Environment, 2018. 659: 649-654.
By Alexa Kownacki, Ph.D. Student, OSU Department of Fisheries and Wildlife, Geospatial Ecology of Marine Megafauna Lab
In what is the longest government shutdown in the history of the United States, many people are impacted. Speaking from a scientist’s point of view, I acknowledge the scientific community is one of many groups that is being majorly obstructed. Here at the GEMM Laboratory, all of us are feeling the frustrations of the federal government grinding to a halt in different ways. Although our research spans great distances—from Dawn’s work on New Zealand blue whales that utilizes environmental data managed by our federal government, to new projects that cannot get federal permit approvals to state data collection, to many of Leigh’s projects on the Oregon coast of the USA that are funded and collaborate with federal agencies—we all recognize that our science is affected by the shutdown. My research on common bottlenose dolphins is no exception; my academic funding is through the US Department of Defense, my collaborators are NOAA employees who contribute NOAA data; I use publicly-available data for additional variables that are government-maintained; and I am part of a federally-funded public university. Ironically, my previous blog post about the intersection of science and politics seems to have become even more relevant in the past few weeks.
Many graduate students like me are feeling the crunch as federal agencies close their doors and operations. Most people have seen the headlines that allude to such funding-related issues. However, it’s important to understand what the funding in question is actually doing. Whether we see it or not, the daily operations of the United States Federal government helps science progress on a multitude of levels.
Federal research in the United States is critical. Most governmental branches support research with the most well-known agencies for doing so being the National Science Foundation (NSF), the US Department of Agriculture (USDA), the National Oceanic and Atmospheric Administration (NOAA), and the National Aeronautics and Space Administration. There are 137 executive agencies in the USA (cei.org). On a finer scale, NSF alone receives approximately 40,000 scientific proposals each year (nsf.gov).
If I play a word association game and I am given the word “science”, my response would be “data”. Data—even absence data—informs science. The largest aggregate of metadata with open resources lives in the centralized website, data.gov, which is maintained by the federal government and is no longer accessible and directs you to this message:Here are a few more examples of science that has stopped in its track from lesser-known research entities operated by the federal government:
Currently, the National Weather Service (NWS) is unable to maintain or improve its advanced weather models. Therefore, in addition to those of us who include weather or climate aspects into our research, forecasters are having less and less information on which to base their weather predictions. Prior to the shutdown, scientists were changing the data format of the Global Forecast System (GFS)—the most advanced mathematical, computer-based weather modeling prediction system in the USA. Unfortunately, the GFS currently does not recognize much of the input data it is receiving. A model is only as good as its input data (as I am sure Dawn can tell you), and currently that means the GFS is very limited. Many NWS models are upgraded January-June to prepare for storm season later in the year. Therefore, there are long-term ramifications for the lack of weather research advancement in terms of global health and safety. (https://www.washingtonpost.com/weather/2019/01/07/national-weather-service-is-open-your-forecast-is-worse-because-shutdown/?noredirect=on&utm_term=.5d4c4c3c1f59)
An example of one output from the GFS model. (Source: weather.gov)
A map of the sampling sites that have been monitored since the 1980s for the Shenandoah Watershed Study and Virginia Trout Stream Sensitivity Study that cannot be accessed because of the shutdown. (Source: swas.evsc.virginia.edu)
NASA’s Stratospheric Observatory for Infrared Astronomy (SOFIA) flies over the snowy Sierra Nevada mountains while the telescope gathers information. (Source: NASA/ Jim Ross).
It is important to remember that science happens outside of laboratories and field sites; it happens at meetings and conferences where collaborations with other great minds brainstorm and discover the best solutions to challenging questions. The shutdown has stopped most federal travel. The annual American Meteorological Society Meeting and American Astronomical Society meeting were two of the scientific conferences in the USA that attract federal employees and took place during the shutdown. Conferences like these are crucial opportunities with lasting impacts on science. Think of all the impressive science that could have sparked at those meetings. Instead, many sessions were cancelled, and most major agencies had zero representation (https://spacenews.com/ams-2019-overview/). Topics like lidar data applications—which are used in geospatial research, such as what the GEMM Laboratory uses in some its projects, could not be discussed. The cascade effects of the shutdown prove that science is interconnected and without advancement, everyone’s research suffers.
It should be noted, that early-career scientists are thought to be the most negatively impacted by this shutdown because of financial instability and job security—as well as casting a dark cloud on their futures in science: largely unknown if they can support themselves, their families, and their research. (https://eos.org/articles/federal-government-shutdown-stings-scientists-and-science). Graduate students, young professors, and new professionals are all in feeling the pressure. Our lives are based on our research. When the funds that cover our basic research requirements and human needs do not come through as promised, we naturally become stressed.
An adult and a juvenile common bottlenose dolphin, forage along the San Diego coastline in November 2018. (Source: Alexa Kownacki)
So, yes, funding—or the lack thereof—is hurting many of us. Federally-funded individuals are selling possessions to pay for rent, research projects are at a standstill, and people are at greater health and safety risks. But, also, science, with the hope for bettering the world and answering questions and using higher thinking, is going backwards. Every day without progress puts us two days behind. At first glance, you may not think that my research on bottlenose dolphins is imperative to you or that the implications of the shutdown on this project are important. But, consider this: my study aims to quantify contaminants in common bottlenose dolphins that either live in nearshore or offshore waters. Furthermore, I study the short-term and long-term impacts of contaminants and other health markers on dolphin hormone levels. The nearshore common bottlenose dolphin stocks inhabit the highly-populated coastlines that many of us utilize for fishing and recreation. Dolphins are mammals, that respond to stress and environmental hazards, in similar ways to humans. So, those blubber hormone levels and contamination results, might be more connected to your health and livelihood than at first glance. The fact that I cannot download data from ERDDAP, reach my collaborators, or even access my data (that starts in the early 1980s), does impact you. Nearly everyone’s research is connected to each other’s at some level, and that, in turn has lasting impacts on all people—scientists or not. As the shutdown persists, I continue to question how to work through these research hurdles. If anything, it has been a learning experience that I hope will end soon for many reasons—one being: for science.
a captive marine mammal in an unknown location Source: Snopes, 2018.
By Leila Lemos
PhD candidate, Fisheries and Wildlife Department, OSU
This past November, headlines were made when a drone captured images of over 100 dolphins confined in Srednyaya Bay, Russia, for commercial reasons.
Figure 01: Location of the “whale jail” in Srednyaya Bay, near Nakhodka, Russia. Source: Big Think, 2018.
This “whale jail” was installed in Srednyaya Bay to receive “prisoners” last July. The Russian newspaper Novaya Gazeta originally reported the story on 30 October 2018 and stated that 11 killer whales and 90 beluga whales [both actually dolphin species] were being held in captivity. These prisoners represent a record catch for the four companies believed to be responsiblefor the captures: LLC Oceanarium DV, LLC Afalina, LLC Bely Kit and LLC Sochi Dolphinarium.
These 101 black-market dolphins are jammed into tiny offshore pensmade ofnetting and are believed to be illegally up for sale to one of China’s 60 marine parks and aquariums, as told by the British journal The Telegraph. With this entertainment business booming in China and a dozen more venues reportedly under construction, there is a demand for these intelligent, social, wild animals.
Figure 02: Twitter post by the Russian government-controlled news outlet RT showing the tiny pens where the cetaceans are being held in captivity in Srednyaya Bay, Russia. Source: Snopes, 2018.
The prosecutor investigating the case is assessing all documents in order to find out if the animals were captured for scientific or educational purposes, or if they were actually detained with an illegal purpose. Greenpeace Russia and other activists are also closely following the case.
The Novaya Gazetta has also reported that the four companies (LLC Oceanarium DV, LLC Afalina, LLC Bely Kit and LLC Sochi Dolphinarium) that own these containers previously exported 13 killer whales to China between 2013 and 2016. These companies were supposedly granted permission to capture ten killer whales in the wild for educational purposes. However, seven of those killer whales were exported to China. Russian authorities are now investigating this case as a possible fraud.
It is important to remember that in 1982, the International Whaling Commission (IWC) adopted a moratorium on commercial whaling, prohibiting participant countries of this international agreement to capture wild whales, except for a specific set of scientific, educational, and cultural purposes. Currently, the quota for capturing whales varies with purpose, country and species, in accordance with the method adopted by the IWC to avoid negative impact on cetacean populations. However, commercial whaling quota is currently zero (IWC 2019a) and there are now 101 individuals being held in captivity in Srednyaya Bay.
Unfortunately, not all countries participate and engage in this agreement. The map below shows the IWC member countries and when they joined the IWC. Surprisingly, both Russia and China are both IWC members despite their purported activities capturing, holding and selling cetaceans for profit.
Figure 03: IWC member countries and when they joined the IWC. Source: IWC, 2019b.
Also, members can withdraw from the IWC. This past December there was another shocking news regarding Japan’s decision to withdraw from the IWC to recommence commercial whaling for the first time in 30 years (Japan Times 2018). This news has led to concerns that this whale market will further diminish the already declining dolphin populations in the region but may also improve whale populations in the Southern Oceans where Japan has whaled illegally previously (Nature 2019).
Japan Times 2018. Available at: https://www.japantimes.co.jp/news/2018/12/20/national/japan-withdraw-international-whaling-commission-bid-resume-commercial-whaling-sources/#.XDT3di3MyfU
Nature 2019. Nature565, 133 (2019). Available at: https://www.nature.com/articles/d41586-019-00076-2
By Dawn Barlow, PhD student, Department of Fisheries & Wildlife, Geospatial Ecology of Marine Megafauna Lab
As 2018 draws to a close, it is gratifying to step back and appreciate the accomplishments of the past year. For all members of the GEMM Lab, 2018 has certainly been one for the books! Here are some of our highlights for your holiday enjoyment.
We conducted fieldwork to collect new data in multiple seasons, multiple hemispheres, and across oceans. For the first time, GEMM Lab members joined the Northern California Current Ecosystem cruises aboard NOAA ship Bell M. Shimada as marine mammal observers—Florence in February, Alexa in May, and me in September.
Dawn Barlow scans for marine mammals from the flying bridge of NOAA ship Bell M. Shimada. Photo: Jess O’Loughlin.
Alexa on-effort using binoculars to estimate the distance and bearing of a marine mammal sighted off the starboard bow. Image source: Alexa K.
An image of the NOAA ship Bell M. Shimada transiting between stations. Multiple members of the GEMM Lab conducted surveys from this NOAA vessel in 2018. (Image source: Alexa Kownacki)
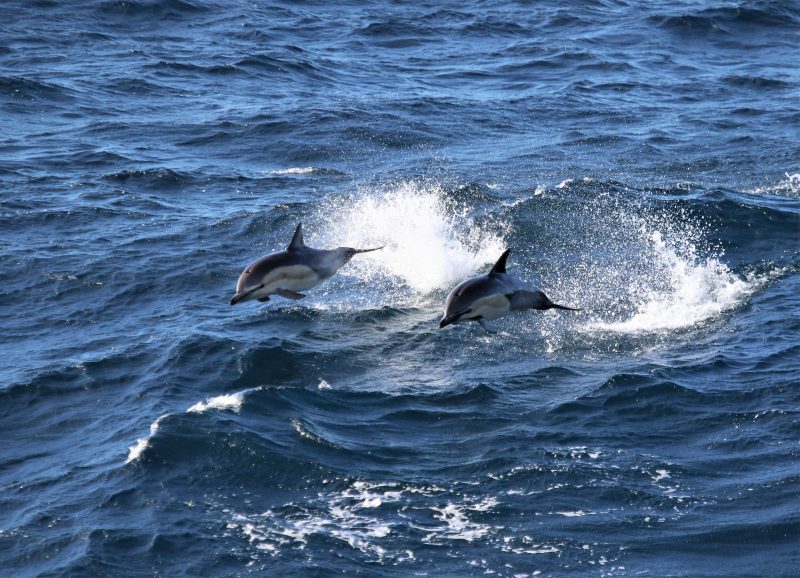
Common dolphins (Delphinus delphis). Photo: Dawn Barlow.
Summertime in the Pacific Northwest brings the gray whales to the Oregon Coast. The drone-flying, poop-scooping, plankton-trapping team of Leigh, Todd, Leila, Joe, and Sharon took to the water for the third year to investigate the health of this gray whale population. It was a successful field season, ending with 72 fecal samples collected! Visiting students joined our experienced members to shadow the gray whale fieldwork—Julia Stepanuk and Alejandro Fernandez Ajo came from across the country to hop on board with us for a bit. Friendship and collaboration were built quickly in a little boat chasing after whale poop, bonding over peanut butter and jelly sandwiches.
Launching the drone. Photo by Alejandro Fernandez Ajo.
The gray whale team aboard R/V Ruby. Photo by Alejandro Fernandez Ajo.
Gray whale photo-identification. Photo by Dawn Barlow.
The summer 2018 gray whale foraging ecology team, affectionately known as “team whale storm”, at the Port Orford Field Station.
Rachael observed seabirds from Yaquina Head in May and June, where the colony of common murres had the highest reproductive success in 10 years! Then she left the summertime in July to travel to the other end of the world, braving winter in the remote South Atlantic to study South American fur seals in the Falkland Islands.
Dr. Rachael Orben and Dr. Alistair Bayliss looking out towards the fur seals. Photo: Kayleigh Jones
In New Caledonia, Solene and a research team ventured to Antigonia Seamount and Orne Bank to study the use of these offshore areas by breeding humpback whales. They collected numerous biopsy samples and successfully deployed satellite tags. Solene was also selected to receive the Louis Herman research scholarship to continue studying humpback whale movement and diving behavior around seamounts.
Sorting biopsy samples during a successful expedition to study humpback whales around remote seamounts in the South Pacific.
Beyond fieldwork, our members have been busily disseminating our findings. In July, Leigh and I traveled to Wellington to present our latest findings on New Zealand blue whales to scientists, managers, politicians, industry representatives, and advocacy groups. Because of our documentation of a unique New Zealand blue whale population, which was published earlier this year, the New Zealand government has proposed to create a Marine Mammal Sanctuary for the protection of blue whales. This is quite a feat, considering blue whales were classified as only “migrant” in New Zealand waters prior to our work. Fueled by flat whites in wintery Wellington, we navigated government buildings, discussing blue whale distribution patterns, overlap with the oil and gas industry, what we now know based on our latest analyses, and what we consider to be the most pressing gaps in our knowledge.
Dr. Leigh Torres and Dawn Barlow in front of Parliament in Wellington, New Zealand following the presentation of their recent findings.
Alexa spent the summer and fall in San Diego, where she collaborated with researchers at NOAA Southwest Fisheries Science Center on her study of about the health of bottlenose dolphins off the California coast. Her time down south has been productive and we look forward to having her back in Oregon with us to round out the second year of her PhD program.
In the fall, Dom and Leigh participated in the first ever Oregon Sea Otter Status of Knowledge Symposium. With growing interest in a potential sea otter reintroduction, the symposium brought together a range of experts – including scientists, managers, and tribes – to discuss what we currently know about sea otters in other regions and how this knowledge could be applied to an Oregon reintroduction effort. Dom was one of many speakers at this event, and gave a well-received talk on Oregon’s previous sea otter reintroduction attempt and brief discussion on his thesis research. Over the next year, Dom not only plans to finish his thesis, but also to join an interdisciplinary research team to further investigate other social, genetic, and ecological implications of a potential sea otter reintroduction.
Sea otter mom and pup. Source: Hakai Magazine.2018-19 OSU NRT Cohort. Source: Oregon State University.
Several GEMM Lab members reached academic milestones this year. Rachael was promoted to Assistant Professor in the spring! She now leads the Seabird Oceanography Lab, and remains involved in multiple projects studying seabirds and pinnipeds all over the world. Leila passed her PhD qualifying exams and advanced to candidacy in the spring, a major accomplishment toward completing her doctoral degree. I successfully defended my MS degree in June, and my photo was added to our wall gallery of GEMM Lab graduates. I won’t be leaving the GEMM Lab anytime soon, however, as I will be continuing my research on New Zealand blue whales as a PhD student. The GEMM Lab welcomed a new MS student in the summer—Lisa Hildebrand will be studying gray whale foraging ecology on the Oregon Coast. Welcome, Lisa! In early December, Solene successfully defended her PhD, officially becoming Dr. Derville. Congratulations to all on these milestones, and congratulations to Leigh for continuing to grow such a successful lab and guiding us all toward these accomplishments.
Dawn Barlow answers questions during her M.Sc. defense seminar.Dr. Solene Derville and co-supervisors Dr. Claire Garrigue and Dr. Leigh Torres after a successful PhD Defense!
Perhaps you’re looking to do some reading over the holidays? The GEMM Lab has been publishing up a storm this year! The bulletin board outside our lab is overflowing with new papers. Summarizing our work and sharing our findings with the scientific community is a critical piece of what we do. The 21 new publications this year in 14 scientific journals include contributions from Leigh (13), Rachael (3), Solene (3), Leila (6), Florence (1), Amanda (1), Erin (1), Courtney (1), Theresa (1), and myself (3). Scroll down to the end of this post to see the complete list!
If you are reading this, thank you for your support of our lab, our members, and our work. Our successes come not only from our individual determination, but more importantly from our support of one another and the support of our communities. We look forward to what’s ahead in 2019. Happy holidays from the GEMM Lab!
The whole GEMM Lab (lab dogs included) gathered for an evening playing “Evolution” at Leigh’s house.
Barlow, D. R., Torres, L. G., Hodge, K. B., Steel, D., Baker, C. S., Chandler, T. E., Bott, N., Constantine, R., Double, M. C., Gill, P., Glasgow, D., Hamner, R. M., Lilley, C., Ogle, M., Olson, P. A., Peters, C., Stockin, K. A., Tessaglia-Hymes, C. T., & Klinck, H. (2018). Documentation of a New Zealand blue whale population based on multiple lines of evidence. Endangered Species Research, 36, 27-40.
Barlow, D. R., Fournet, M., & Sharpe, F. (2018). Incorporating tides into the acoustic ecology of humpback whales. Marine Mammal Science.
Baylis, A. M., Tierney, M., Orben, R. A., Staniland, I. J., & Brickle, P. (2018). Geographic variation in the foraging behaviour of South American fur seals. Marine Ecology Progress Series, 596, 233-245.
Bishop, A., Brown, C., Rehberg, M., Torres, L., & Horning, M. (2018). Juvenile Steller sea lion (Eumetopias jubatus) utilization distributions in the Gulf of Alaska. Movement ecology, 6(1), 6.
Burnett, J. D., Lemos, L., Barlow, D., Wing, M. G., Chandler, T., & Torres, L. G. (2018). Estimating morphometric attributes of baleen whales with photogrammetry from small UASs: A case study with blue and gray whales. Marine Mammal Science.
Cardoso, M. D., Lemos, L. S., Roges, E. M., de Moura, J. F., Tavares, D. C., Matias, C. A. R., … & Siciliano, S. (2018). A comprehensive survey of Aeromonas sp. and Vibrio sp. in seabirds from southeastern Brazil: outcomes for public health. Journal of applied microbiology, 124(5), 1283-1293.
Derville, S., Torres, L. G., Iovan, C., & Garrigue, C. (2018). Finding the right fit: Comparative cetacean distribution models using multiple data sources and statistical approaches. Diversity and Distributions, 24(11), 1657-1673.
Derville, S., Torres, L. G., & Garrigue, C. (2018). Social segregation of humpback whales in contrasted coastal and oceanic breeding habitats. Journal of Mammalogy, 99(1), 41-54.
Hann, C. H., Stelle, L. L., Szabo, A., & Torres, L. G. (2018). Obstacles and Opportunities of Using a Mobile App for Marine Mammal Research. ISPRS International Journal of Geo-Information, 7(5), 169.
Holdman, A. K., Haxel, J. H., Klinck, H., & Torres, L. G. (2018). Acoustic monitoring reveals the times and tides of harbor porpoise (Phocoena phocoena) distribution off central Oregon, USA. Marine Mammal Science.
Kirchner, T., Wiley, D. N., Hazen, E. L., Parks, S. E., Torres, L. G., & Friedlaender, A. S. (2018). Hierarchical foraging movement of humpback whales relative to the structure of their prey. Marine Ecology Progress Series, 607, 237-250.
Moura, J. F., Tavares, D. C., Lemos, L. S., Acevedo-Trejos, E., Saint’Pierre, T. D., Siciliano, S., & Merico, A. (2018). Interspecific variation of essential and non-essential trace elements in sympatric seabirds. Environmental pollution, 242, 470-479.
Moura, J. F., Tavares, D. C., Lemos, L. S., Silveira, V. V. B., Siciliano, S., & Hauser-Davis, R. A. (2018). Variation in mercury concentration in juvenile Magellanic penguins during their migration path along the Southwest Atlantic Ocean. Environmental Pollution, 238, 397-403.
Orben, R. A., Kokubun, N., Fleishman, A. B., Will, A. P., Yamamoto, T., Shaffer, S. A., Takahashi, A., & Kitaysky, A. S. (2018). Persistent annual migration patterns of a specialist seabird. Marine Ecology Progress Series, 593, 231-245.
Orben, R. A., Connor, A. J., Suryan, R. M., Ozaki, K., Sato, F., & Deguchi, T. (2018). Ontogenetic changes in at-sea distributions of immature short-tailed albatrosses Phoebastria albatrus. Endangered Species Research, 35, 23-37.
Pickett, E. P., Fraser, W. R., Patterson‐Fraser, D. L., Cimino, M. A., Torres, L. G., & Friedlaender, A. S. (2018). Spatial niche partitioning may promote coexistence of Pygoscelis penguins as climate‐induced sympatry occurs. Ecology and Evolution, 8(19), 9764-9778.
Siciliano, S., Moura, J. F., Tavares, D. C., Kehrig, H. A., Hauser-Davis, R. A., Moreira, I., Lavandier, R., Lemos, L. S., & Quinete, N. S. (2018). Legacy Contamination in Estuarine Dolphin Species From the South American Coast. In Marine Mammal Ecotoxicology (pp. 95-116). Academic Press.
Sullivan, F. A., & Torres, L. G. (2018). Assessment of vessel disturbance to gray whales to inform sustainable ecotourism. The Journal of Wildlife Management, 82(5), 896-905.
Sztukowski, L. A., Cotton, P. A., Weimerskirch, H., Thompson, D. R., Torres, L. G., Sagar, P. M., Knights, A. M., Fayet, A. L., & Votier, S. C. (2018). Sex differences in individual foraging site fidelity of Campbell albatross. Marine Ecology Progress Series, 601, 227-238.
Torres, L. G., Nieukirk, S. L., Lemos, L., & Chandler, T. E. (2018). Drone up! Quantifying whale behavior from a new perspective improves observational capacity. Frontiers in Marine Science, 5.
Yates, K. L., Bouchet, P. J., Caley, M. J., Mengersen, K., Randin, C. F., Parnell, S., … & Sequeira, A. M. M. (2018). Outstanding challenges in the transferability of ecological models. Trends in ecology & evolution.
By Dominique Kone, Masters Student, Marine Resource Management
As the human population continues to grow, so does our impact on marine environments. In many cases, these problems – such as microplastics, vessel noise, or depleted fisheries – are far too grand for any one person to tackle on their own and it takes a team effort to find adequate solutions. Experts within a single field (e.g. ecology, economics, genetics) have been collaborating to tackle these issues for decades, but there is an increasing interest and recognition of the importance in working with others outside one’s own discipline.
It’s not surprising that most collaborative efforts are between experts from the same field. It’s easier to converse with those with similar vocabulary, we often enjoy learning from our peers, and our thought-processes and problem-solving skills are typically very similar. However, as issues become more complex and stretch across disciplines, the need for interdisciplinary collaboration becomes more and more imperative. As a graduate student studying marine resource management, I’ve learned the great value in conducting interdisciplinary work. Yet, I still have much to learn if I want to continue to help find solutions to the many complex marine issues. Therefore, over the next year, I’ve committed to joining a interdisciplinary team of graduate students, as part of an NSF-funded fellowship program at Oregon State University (OSU), to further investigate a potential sea otter reintroduction to Oregon. Here, I provide a brief overview of the program and my team’s goals for the coming year.
Source: Hakai Magazine.
The fellowship program emphasizes both interdisciplinary and transdisciplinary approaches, so before I explain the program, it’s important to first understand these terms. In short, interdisciplinarity typically relates to experts from different fields analyzing, synthesizing, and coordinating their work as a whole (Choi & Pak 2006). Another way to think about this, in more practical terms, is if two or more experts share information and learn from one another; each expert can then individually apply that information or lessons-learned to their own line of work. In contrast, transdisciplinary work is slightly more collaborative, where experts work more hand-in-hand to develop a product or solution that transcends their disciplines’ traditional boundaries. The experts essentially create a product that would not have been possible working in isolation. In practice, the product(s) that stems from inter- and transdisciplinary work – if they truly are inter- or transdisciplinary by definition – is potentially very different.
Source: Dr. Shoshanah Jacobs.
With an increasing interest in interdisciplinary work, the National Science Foundation (NSF) developed the National Research Traineeship (NRT) program to encourage select universities to develop and implement innovative and transformative models for training graduate students in STEM disciplines. After soliciting proposals, the NSF awarded OSU one of these NRT projects to support OSU’s Risk and Uncertainty Quantification in Marine Science NRT Program. OSU’s NRT program was born out of the recognition that much of the complexity of marine issues is largely due to the uncertainty of natural and human systems. Therefore, the primary purpose of this program is to train the next generation of natural resource scientists and managers to be better equipped to study and manage complex marine systems, especially under extreme uncertainty and potential risk.
Source: Oregon State University.
This NRT program trains graduate students in three core concept areas: coupled natural human systems, big data, and risk and uncertainty analyses and communications. To learn these core concepts, students fulfil a minor that includes coursework in statistical inference, uncertainty quantification, risk analyses, earth system science, and social systems. In addition to the minor, students also conduct collaborative research in small (3-5 students) cross-disciplinary teams to address specific issues in marine resource management. Within each team, students come from different disciplines and fields, and must learn to work together to produce a transdisciplinary research product. Throughout the year, each team will develop a set of research questions to address their issue at hand, conduct research which links all their fields, and produce a transdisciplinary report summarizing the process they undertook and the end product. Most students who are accepted into the NRT program are awarded one-year fellowships, funded by the NSF.
At the start of this academic year, I was awarded one of these NRT fellowships to address the many issues and implications of a potential sea otter reintroduction to Oregon. Over the next year, I will be working with two other OSU graduate students with backgrounds in genetics and social sciences. Our task is to not only investigate the ecological implications – which I am currently doing for my own thesis – but we are to expand this investigation to also address many of the genetic, political, and social factors, as well. While each of us is capable of addressing one of these factors individually, the real test will be in finding linkages between each of our disciplines to make this project truly transdisciplinary.
Structure and vision of OSU’s NRT program. Source: Oregon State University.
Since our project started, we have worked to better understand each another’s expertise, interests, and the general need for a transdisciplinary project of this sort. After acquiring this base understanding, we spent a considerable amount of time developing research questions and potential methods for addressing our issue. Throughout this process, it’s already become apparent that each of us is starting to learn important teamwork and collaboration skills, including effective communication and explanation of complicated concepts, active listening, critical thinking, and constructive feedback. While these skills are imperative for our research over the next year, they are also life-long skills that we’ll continue to use in our careers beyond graduate school.
As I’ve stated previously, learning to be an effective collaborator is extremely important to me. Getting the opportunity to work interdisciplinarily is what attracted me to my thesis, the marine resource management program, and the NRT program. By choosing to take my graduate education down this path, I’ve been fortunate to obtain important skills in collaboration, as well as work on a project that allows me to tackle real-world issues and creatively develop scientifically-based solutions. I have high hopes for this NRT project, and I’m excited to continue to conduct meaningful and targeted research over the next year with my new team.
2018-19 OSU NRT Cohort. Source: Oregon State University.
References:
Choi, B. C., and A. W. Pak. Multidisciplinarity, interdisciplinarity and transdisciplinarity in health research, service, education and policy: 1. Definitions, objectives, and evidence of effectiveness. Clinical and Investigative Medicine. 29(6): 351-64.