Remembering Alexa

The GEMM Lab

Alexa Kownacki first contacted me in October 2016 to enquire about being my PhD student and joining the GEMM Lab. She spoke with passion, intellect, curiosity and honesty, to which I was immediately drawn. Over the next four years, we were privileged to have her brilliance, kindness, wit and effervescence in our world. I am devastated to communicate here – on the GEMM Lab blog that Alexa frequently contributed to with enthusiasm and talent – that Alexa Kownacki passed away on Tuesday, November 17, 2020. The GEMM Lab has been shocked and deeply saddened by losing Alexa from our lives. She embodied joy, and recognized and relished beauty everywhere, and in each of us. Her ability to give support, love, and understanding was limitless, as was her passion for marine conservation and education. Our sorrow is profound, but we want to remember Alexa’s life with the brightness, color and laughter it deserves, for that’s how she lived. Below are memories of Alexa from each of us in the GEMM Lab who knew and loved Alexa, followed by a video montage of Alexa in life. Please visit this memorial website to contribute your stories of Alexa, as well as read other tributes and post photos.

Leigh

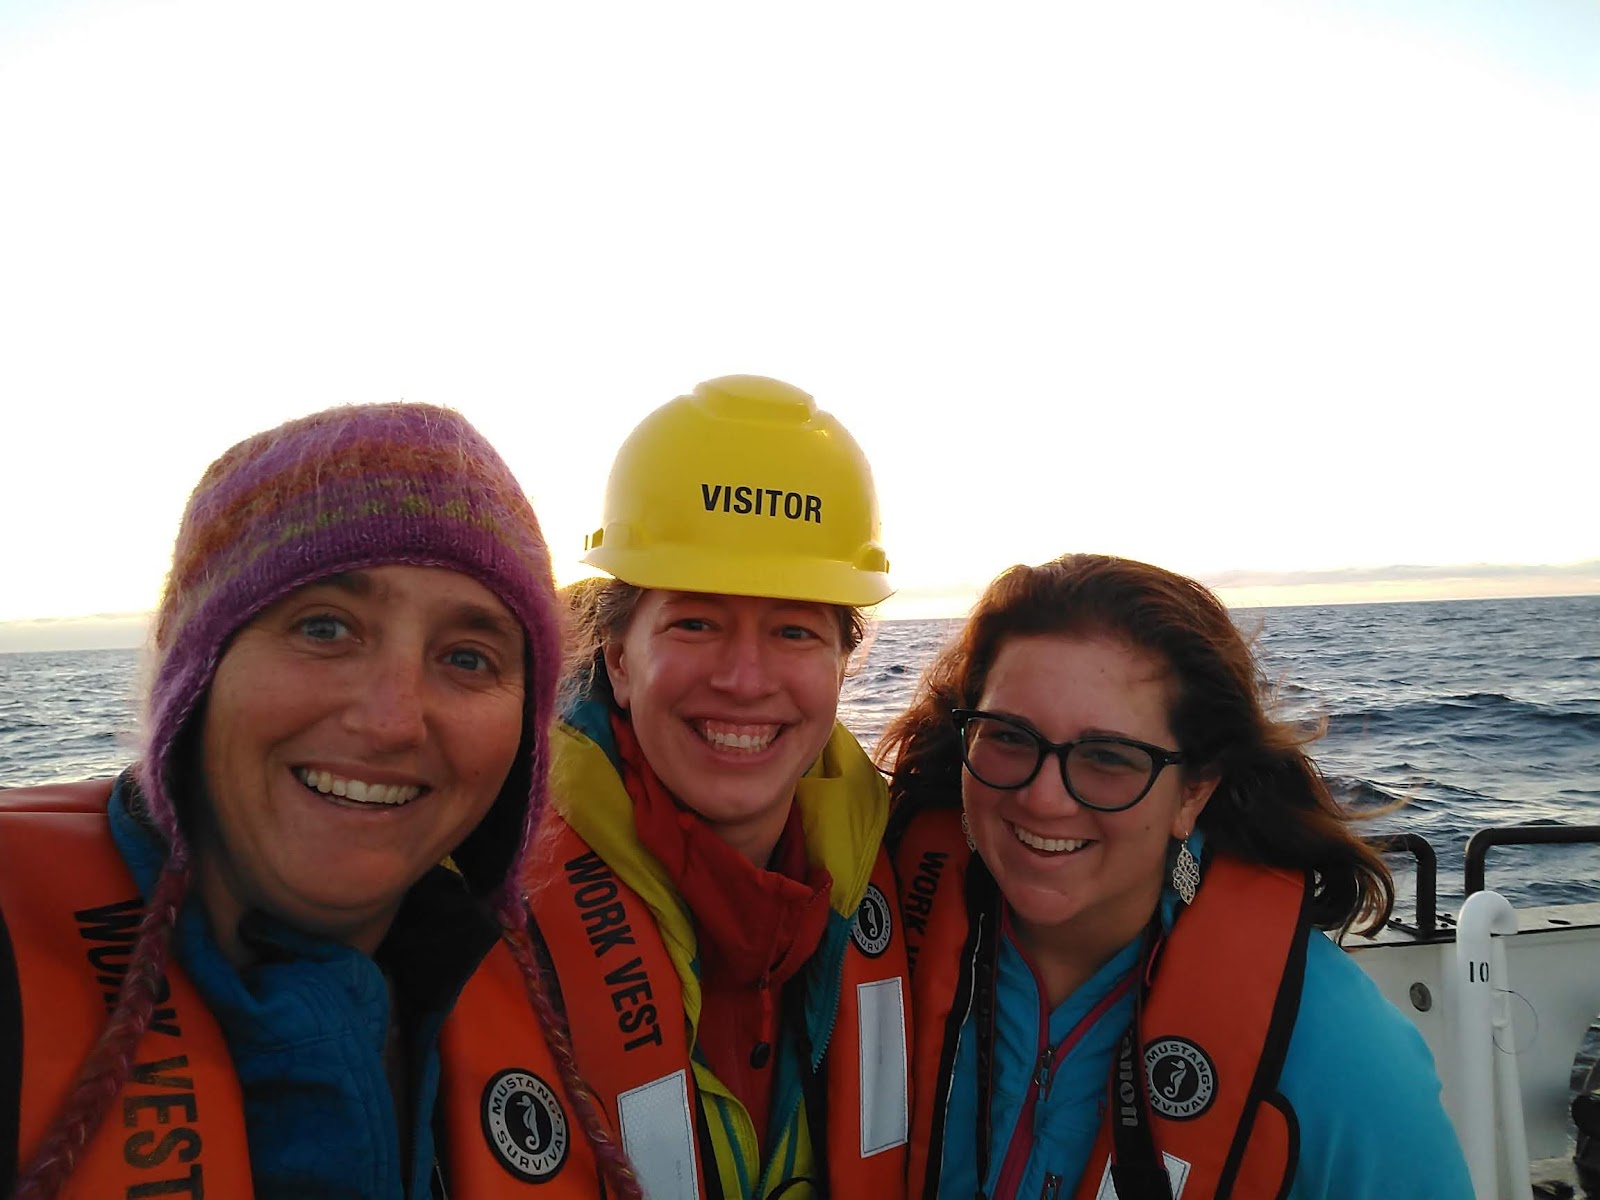
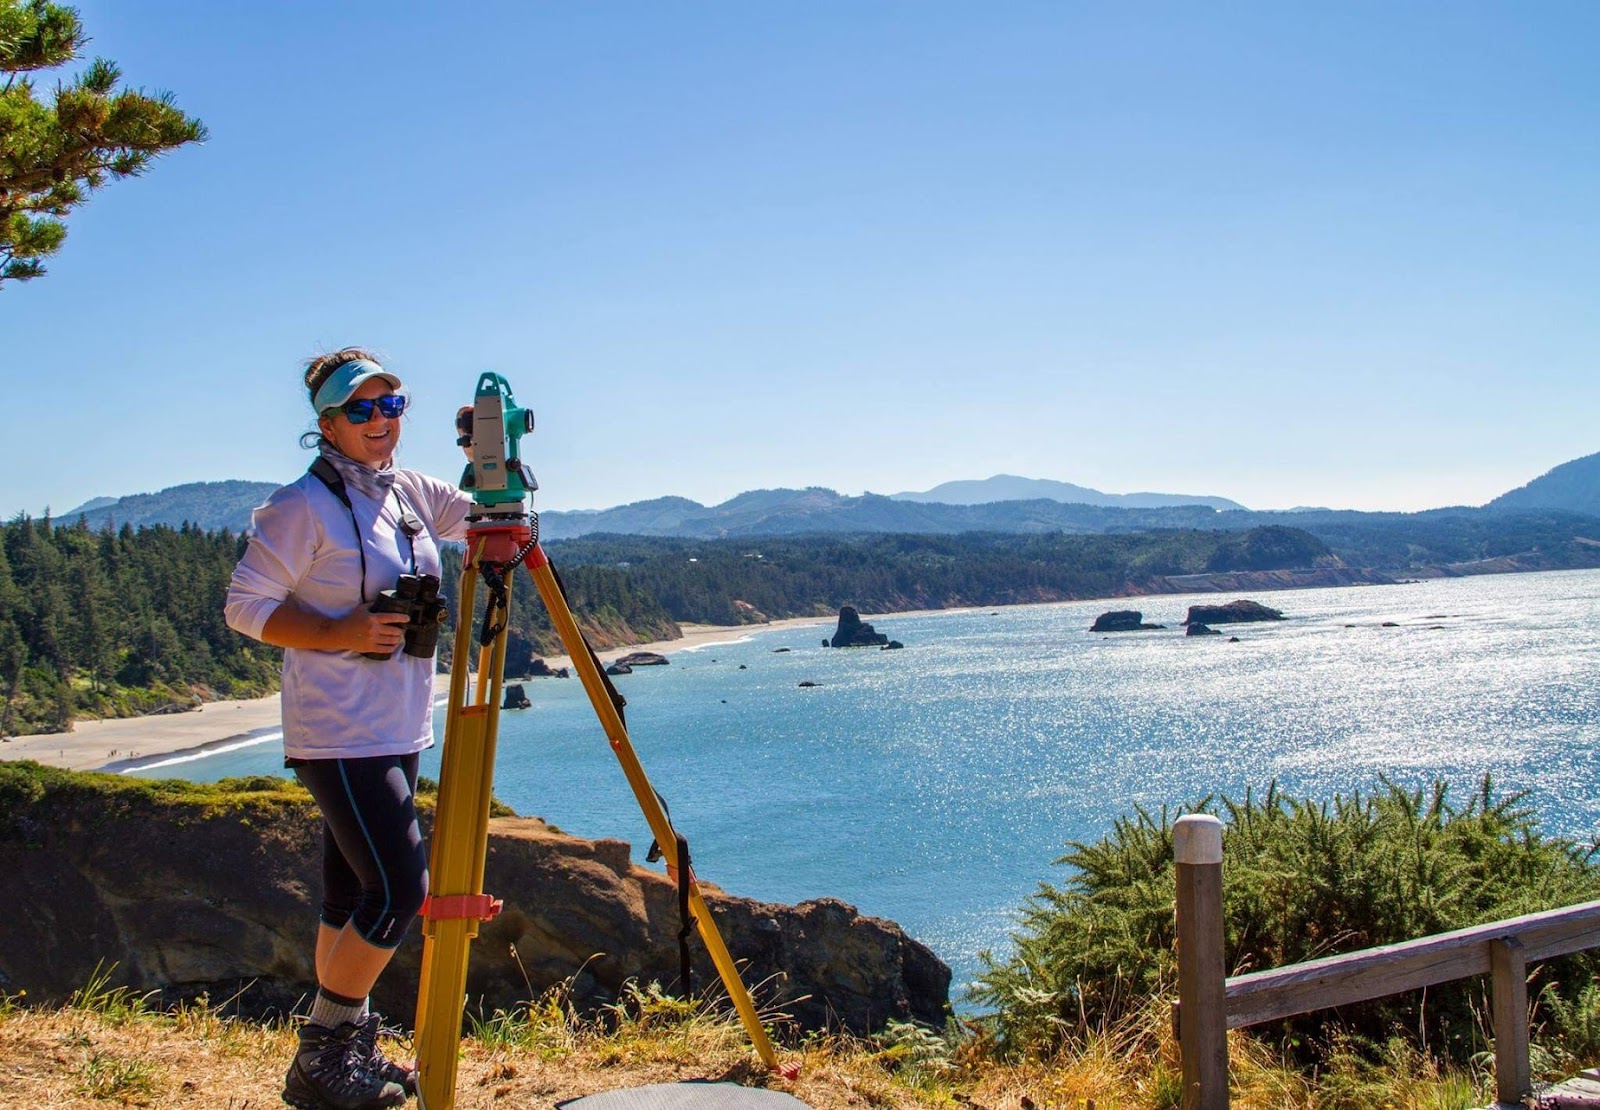
Alexa loved the ocean and seemed more at-home while at-sea than almost anyone I know. I asked Alexa to join me aboard the RV Oceanus for a STEM research cruise in September 2018 where we took high school students and teachers to sea to teach them how we collect marine mammal and oceanographic data. (Alexa wrote a lovely blog about this cruise.) I was not surprised by her enthusiasm – that was her nature – but I was utterly amazed at how easily Alexa mentored the students, communicated with the crew, balanced teaching with humor and humility, created learning moments everywhere, and supported everyone on-board so they felt welcomed and comfortable. During this cruise, Alexa was my partner, my teammate. We were both in our element and shared so much joy with the privilege to be at-sea, laughter at the excitement and adventure, inspiration at watching the next generation of marine scientists learn, and awe for the beauty that the ocean holds. This is how I will remember you, Alexa. Your free, beautiful, kind, joyous spirit will always be with me.

Dom

For anyone who knew Alexa, you knew she had an uncanny ability to connect with others on such a personal level that made you feel truly valued and loved. No matter the circumstances, she made it a point to always show up for those she cared about, which makes it extremely difficult to choose just one memory to remember her by. Instead, I’m choosing to remember her by the way she made me feel, as a human and a friend. Even during the most challenging of times, Alexa always wanted to know how I was doing and what I was doing outside of school to take care of myself. I can’t count the number of times she pulled me away from my work to go out dancing at the Peacock or drag shows, hiking on our weekends, or even making short donut runs to Benny’s Donuts. She understood that even scientists have basic needs for personal connection, fun and enjoyment, and love. If there’s anything Alexa’s passing has taught me, it is this: always show up for your fellow scientists and colleagues as people and friends first, because our support for one another will no doubt leave a longer-standing and greater impact on this world than our achievements and discoveries. Her passing will be my constant reminder that we all deserve to be treated and valued with love and dignity. Alexa, thank you for teaching me this valuable lesson, and I hope I get the chance to impact someone else’s life, as much as you have mine. I love you, and I promise I’ll visit San Diego soon.

Lisa

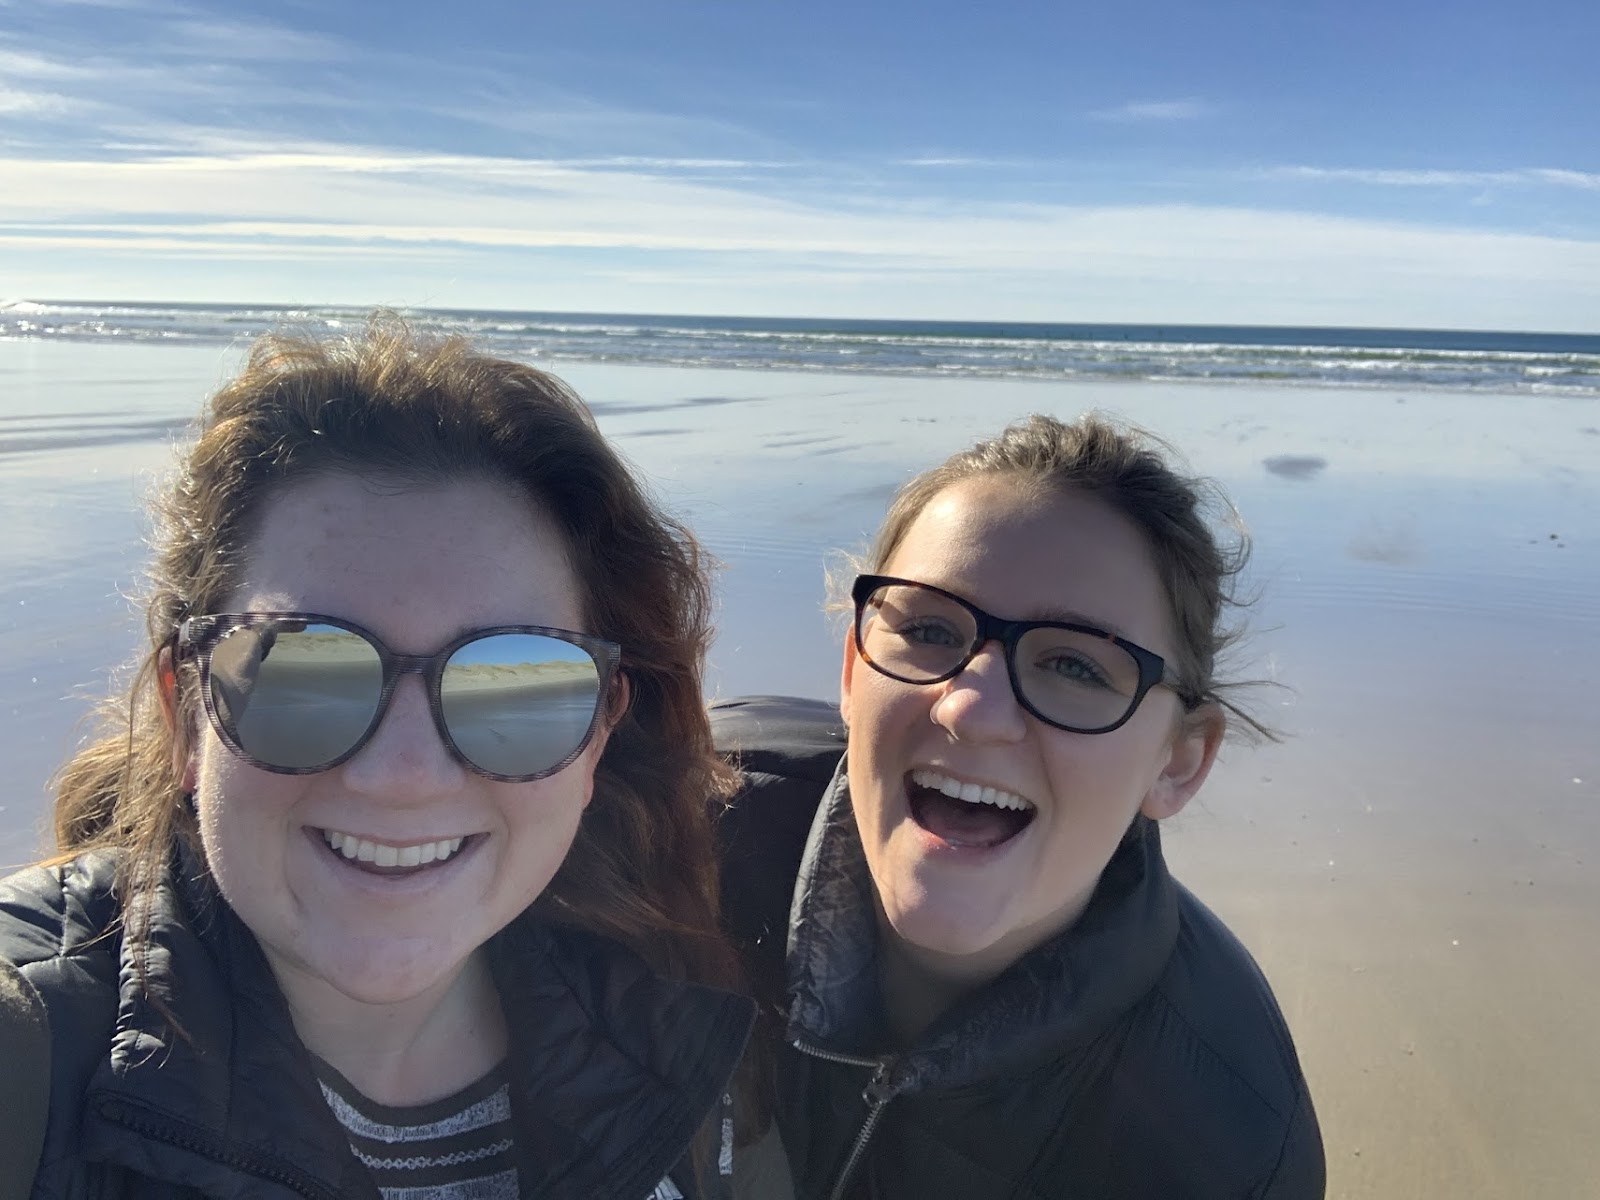
Alexa, there are so many memories, experiences, and moments we had together that I will never forget, least of all the very first day I met you (fasten your seatbelts everyone, this story is a wildly unbelievable, yet very true, roller coaster ride). Summers were always extremely busy for you in San Diego. Yet, despite that, you didn’t hesitate when Leigh asked you to come up to Oregon in July 2018 to teach me, the newest GEMM Lab member, all there was to know about the Port Orford gray whale project. You had never met me before and you had only participated in the Port Orford project for a week the previous summer, but none of that stopped you. You flew to Portland from San Diego and made your way to Newport. We loaded up the MMI truck with all the gear and headed south towards Port Orford. So far, so good. Great, even! You pulled off the highway any chance we got so I could marvel at the beauty of the Oregon coast. But that all changed when we got to Coos Bay where we planned to stock up on groceries. You, ever so organized & thoughtful, had already compiled a grocery list but as we were going up and down the aisle, adding things to our cart, you suddenly realized that your phone was missing. We retraced our steps. Nothing. As always, you were quick on your feet, and connected to the Safeway wifi on your tablet to use the ‘Find My iPhone’ app to help solve the mystery. Lo-and-behold, your phone was no longer in the store…We drove to the location and arrived at what we always describe as a “creepy-looking motel” (although under any other circumstance the motel would have probably looked totally normal). We surveyed our surroundings and made notes (I still have that note on my phone) about all the people and vehicles we saw. One person in particular drew our attention because out of the back of his car he pulled out several…Safeway grocery bags!!! Feeling giddy about our amateur-sleuthing but also nervous because we were sitting in a pretty conspicuous white government truck in a motel parking lot, you decided that it was probably time to call the police. Two officers arrived and it soon was revealed that the man we had seen with Safeway bags had indeed just been at Safeway with his daughter. Apparently, his daughter had a habit of stealing and he told the officers he was confident that his daughter had stolen the phone and that he would call them as soon as he found it. There wasn’t much for us to do so you decided it would be best to drive to Port Orford, get settled in and once we heard from the police, we could drive back to Coos Bay. We did eventually hear from the police and drove all the way back to Coos Bay in the dark, only to find that your phone was completely destroyed. The night involved more adventures (including sleeping on the floor but that’s a whole other story), yet, the next day (the 4th of July), you let none of these events stop us from making s’mores (my first ones ever!) and watching the dinghy race & fireworks from the field station. You blazed on, with your unparalleled optimism and determination, to ensure that I not only learned everything that I needed to know to be able to run the project, but that we also had a great time while learning. Alexa, I will cherish the time we had together forever and I miss you so incredibly much.

Dawn

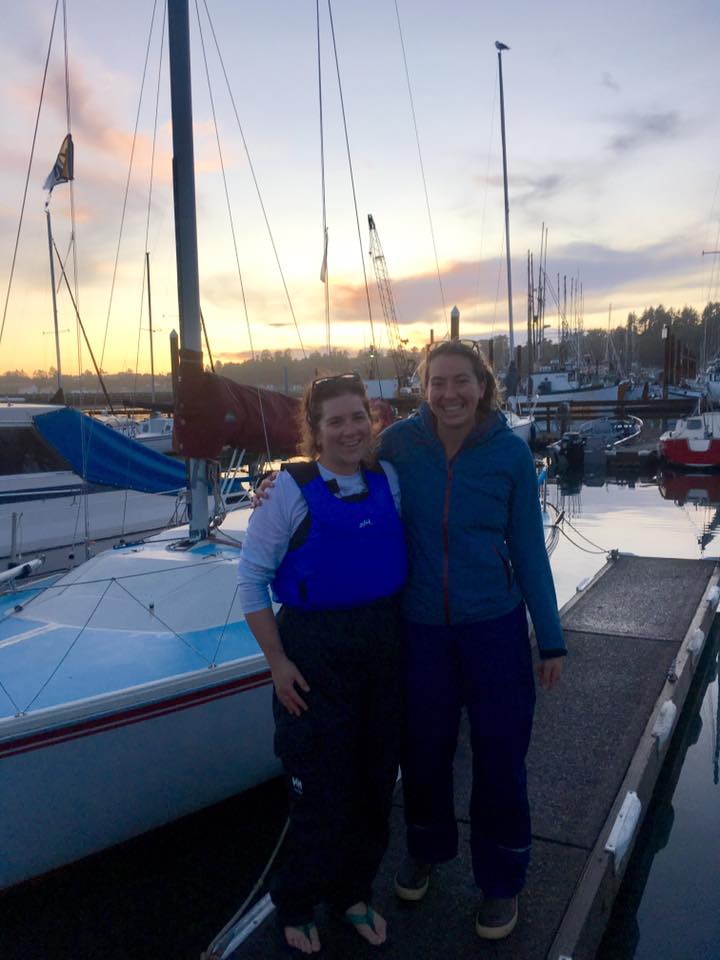
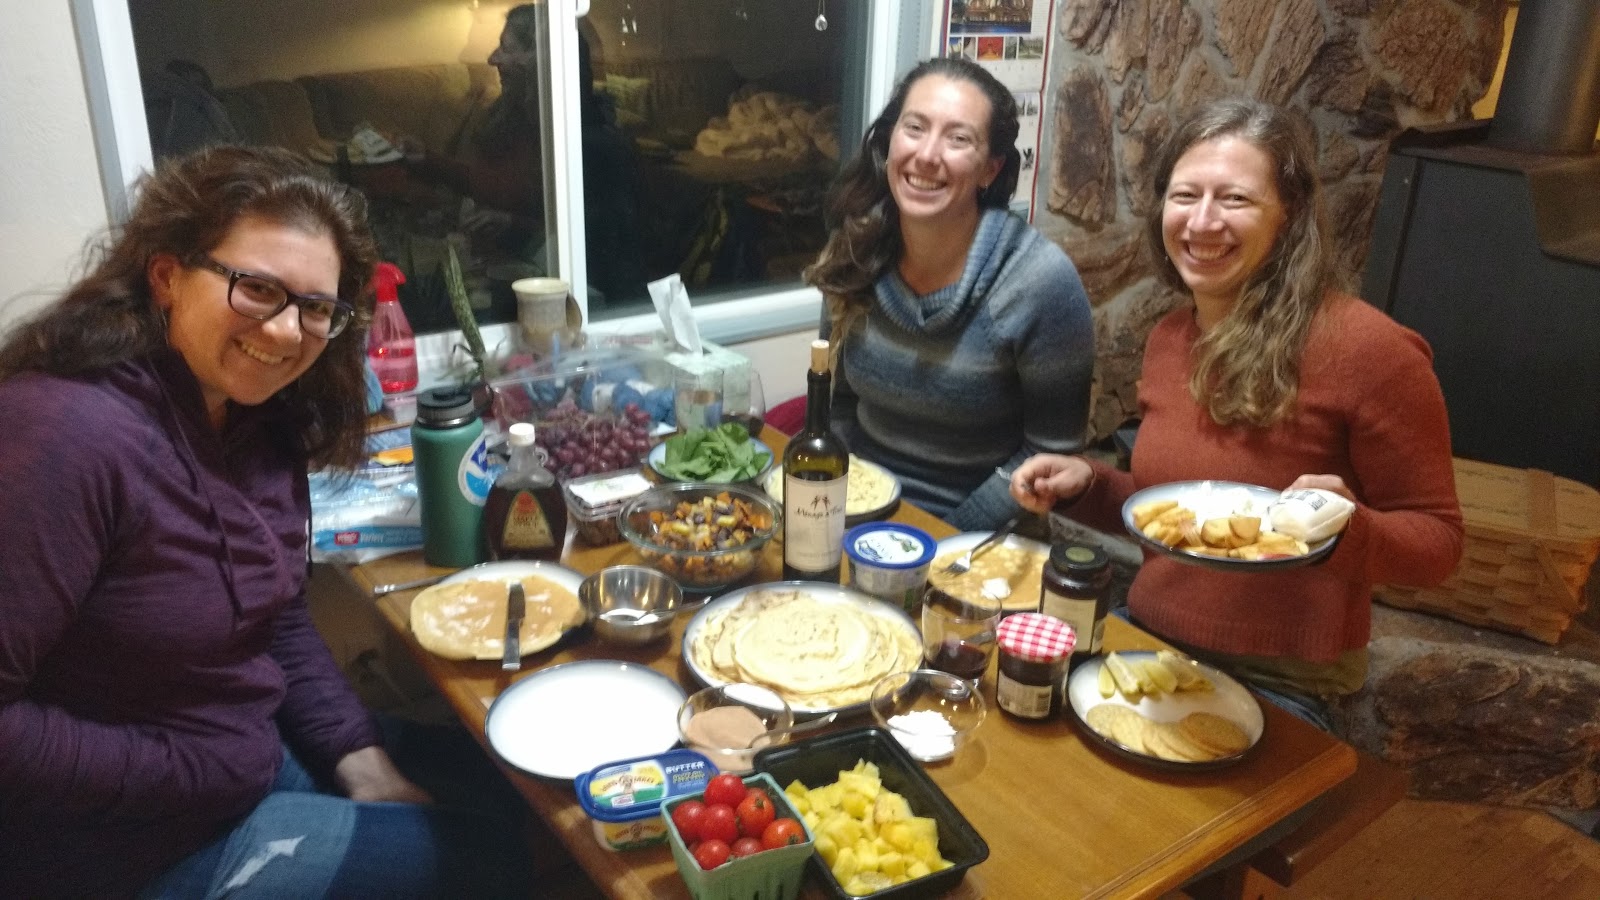
The day Alexa moved to Oregon to start graduate school, she learned that we were sailing here in Newport as part of Yaquina Bay Yacht Club’s Wednesday night race series. She had yet to move into her apartment, but she hopped on a sailboat that very evening. Alexa was in her element, with wind in her hair and salt spray on her face. She smiled through it all as her signature laughter rang out across the bay, and by the end of the evening she had easily become friends with the entire community. This was Alexa’s way of life. She leapt at opportunities, she poured her whole self into everything she did, and she connected with everyone immediately, deeply, and genuinely. Her optimism was unending. After long, stormy weather days at sea she would enthusiastically send a sunset photo with the caption “Red sky at night, sailors delight!” She lived every moment to the fullest, and she helped all of us see beauty, humor, and joy through her eyes. “Let’s document this, I’m taking a picture!” she’d say. Oftentimes, I’d roll my eyes. “Hey, Dawn you’re not in the picture. Lean in!” she’d insist. Now I have so many photos and memories to cherish. What a constant joy it was, dear Alexa, to be your labmate and your friend. What a heartbreaking reminder your sudden departure is to take nothing for granted, to live life to the absolute fullest, to dance often and sing loudly, and to hold nothing back. Fair winds and following seas, you beautiful, bright spirit. We love and miss you dearly. Thank you for sharing your time on earth with all of us.

Leila

Alexa was a light in my life since I met her in Oregon. I first met Alexa while living in the dorms in Newport and got to be her roommate for that summer. She would always wake up in the morning and head to the basketball court with her laptop to do some exercises, always so energetic and enthusiastic! I also shared rooms with her on multiple other occasions, including my house when she needed a place and at all of the conferences we went to together. While I was pretty much dead after an entire day of talks and was ready to go to bed, she was getting ready to go dancing. She was always SO full of energy and life. Alexa indeed knew how to enjoy life, and did it graciously. 

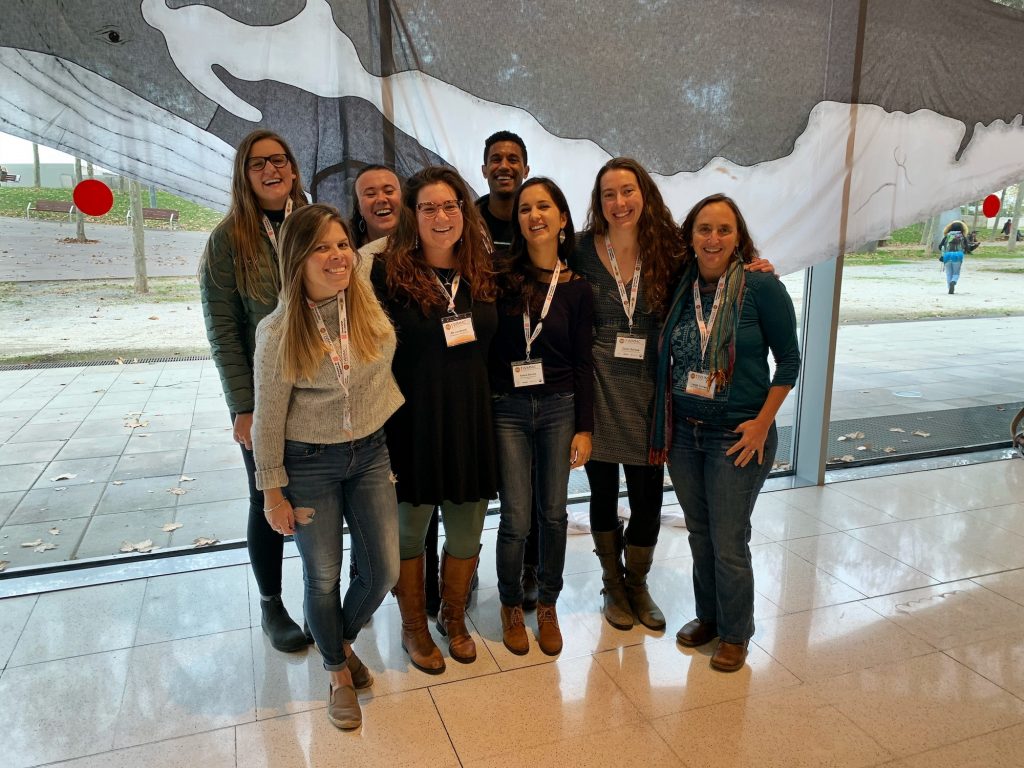
She easily became one of my greatest friends in Oregon. She was my confidant during the struggles of grad life and was always supportive no matter what happened. Last year we were in Barcelona for a conference and my passport got lost in the mail system. She saw how nervous I was and made sure to accompany me to the other side of the city to go check if my passport had arrived, even if she already had plans for that night. Also, when I was about to defend my Ph.D. she would go do groceries for me to make sure I had enough ice cream while struggling with my presentation practice. Alexa had problems, many problems, but still went above and beyond to make sure all of her friends were taken care of. 

We both loved dancing and were taking dance classes in grad school. We tried to find a dance style that we both liked so we could go to dance together, but I was already taking hip hop classes and loved it. Alexa would not accept going to hip hop as she thought it was not an inclusive and diverse space and she wanted to spend her time meeting and cherishing diverse people. She was always so thoughtful and probably one of the most inclusive people I have ever met. 

Alexa’s contagious laugh, caring and optimism left me a deep mark that I am going to carry close to my heart throughout my life. She is such a great inspiration for how we should live our lives. I love you Alexa and miss you dearly. Thank you for everything. Rest in peace and keep shining wherever you are. I am sure this is just a “see you later”.

Alejandro

I had the joy to meet Alexa when I first visited the GEMM Lab in 2018, I will always remember her for her vibrant smile, her friendly kind, and for making me feel so welcomed when I arrived in Newport, she instantly made me feel among friends. I meet her so briefly because she was heading to San Diego for the summer to work on her research, she let me borrow her desk for me to work on while she was away and she left me a note written in Spanish, my native language, which meant a lot to me, and speaks about the kind of person she was, someone who would make you feel welcomed and would try finding things in common to engage and connect. We kept connected ever since, exchanging emails about work, whales, dolphins, or just to know about how we were doing, hoping to reunite again but, unfortunately, last summer due to COVID we could not meet again. The news about her leaving us just left me shocked, although I met her briefly she really impacted me, I want to be a bit like her, and be able to share the things I love in the way she did, with passion and vibrant enthusiasm. She will be missed.
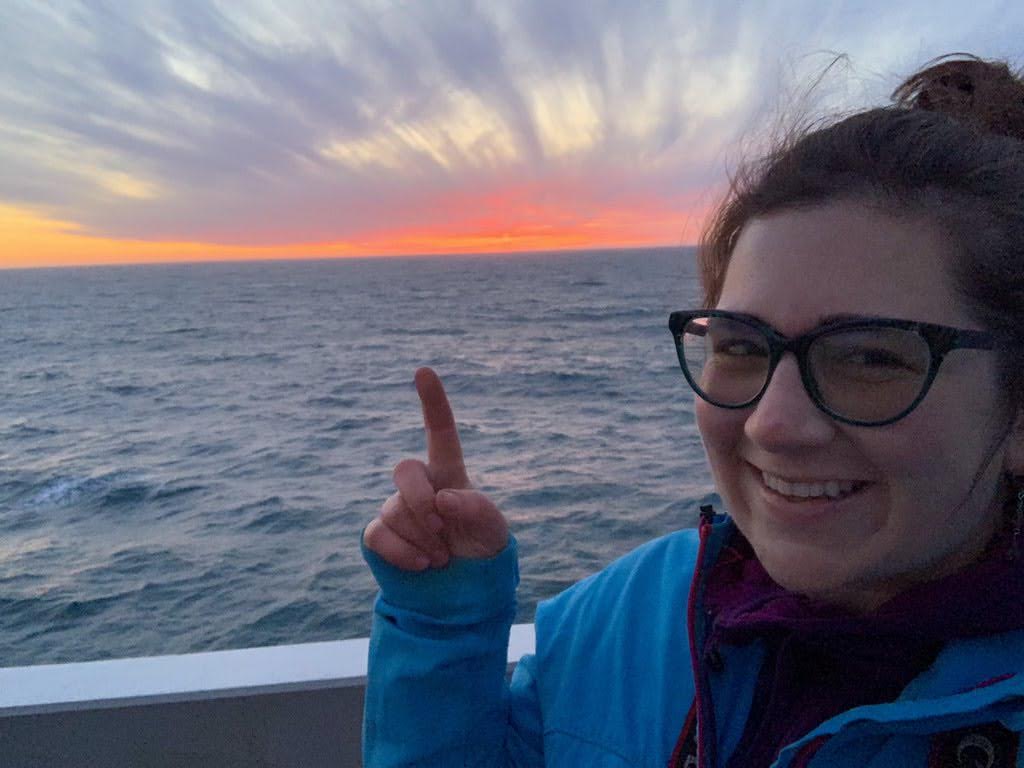
Rachael

Alexa and I haven’t been in the same place at the same time for a while. On the top of my list for next time we crossed paths was to catch-up with her about her trip through the Northwest Passage and quiz her about the seabirds, the islands, and the polar bears. In September 2018, I agreed to join the R/V Oceanus on a STEM outreach cruise as a seabird observer. It was my first time as a seabird observer as I typically do better on land. I spent most of the first day in my bunk (I have queasy memories of making it up to the flying bridge, seeing the ocean, and quickly retreating). Luckily the cruise was long enough for me to gain my sea legs. I didn’t take any photos, but Alexa did and I can look back on those days through her eyes and remember the wonderful calm beautiful evening we spent on the back deck, her excitement and skill when we encountered whales, and her kind laughter when we spotted an albatross through the portal (and I wasn’t quite ready to go up to the flying bridge). I admired her outgoing confidence and enthusiasm and I will miss her presence in the GEMM lab family. In our field, people have the habit of coming round full circle and I also miss the future: reuniting with Alexa 10 years from now on a research cruise somewhere. Alexa – thank you for those moments we shared, your vision of life, and your efforts to make the ‘world a better place for all living creatures’.

Karen

Alexa threw kindness around like it was confetti and life was one big dance party. She freely gave of her time and energy and sought to raise those near her to her own level of excellence. Through her own example, she constantly reminded me, and many others, that being a kind, welcoming, and goodhearted person was just as important as academic or scientific success. Alexa always made me feel welcome in the GEMM lab (even though I’m adopted) for which I will always be grateful. What I admire most about Alexa is her strength and perseverance, and stubborn refusal to let anything life threw at her knock her off the course she chose for herself. Knowing Alexa was truly a gift. After receiving such a gift in my life, more than anything I want to say thank you to her. And so, to Alexa:Thank you for the beach breaks and the lunch dates and the ‘oh look, the sun’s out we gotta run out’ breaks. Thank you for the light and laughter you brought with you everywhere. Thank you for continually reminding me to find the joy in hard times and sitting with me in difficult moments until I could. Thank you for being goofy enough to stomp on seaweed or play on the swings with me. Thank you for keeping me entertained with silly jokes in Zoom meetings gone on too long. Thank you for being a cheerleader when I needed it, and for being so willing to share your positivity in the many pep talks you gave me. And most of all, thank you for the epic dance parties. I know you’re dancing wherever you are.

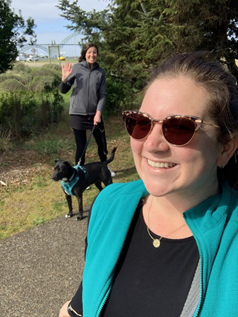
One example of Alexa’s endless determination – continuing to insist on taking selfies to document her friendships even in the age of social distancing.

Clara

I first met Alexa in Barcelona when I arrived at the apartment the GEMM lab was sharing for the conference. My first memory is that she greeted me like an old friend and made me feel instantaneously welcome. There was no awkward initial phase, we met and were friends. I adored every time we got a chance to catch up and chat. This past spring I had regular “zoom GIS dates” with Alexa to help her with GIS, but I have to admit these were 50% catch up time, and I’ve never been happier to be unproductive. She was never bothered by GIS crashing for the tenth time, something that would have most people banging their head on a desk, instead she would just say “ah well, ok so back to [whatever we were talking about]”. We bonded over field work and travel stories (she had the best travel stories). Whenever we spoke she was always supportive and kind, she truly believed in you and made sure you knew it. 

Alexa, your welcoming, enthusiastic, and encouraging spirit has been an inspiration that I will carry with me always. Thank you for everything, your warm, vibrant, and brilliant presence is deeply missed.

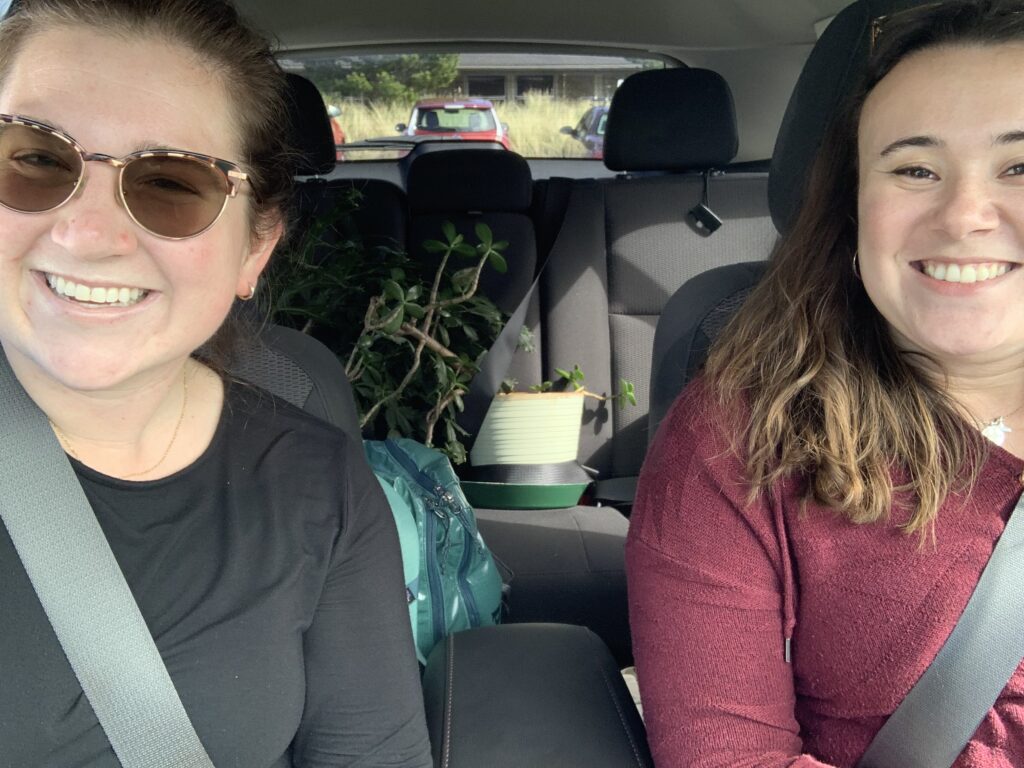
Alexa offered to take care of some of the library plants when it was preparing to close in March. We had to buckle the plants into the backseat of my car to transport them back to Corvallis, we both found this highly amusing and naturally, Alexa wanted to document it, I am so glad she did.

Florence

Alexa was one of those rare people who is genuinely, unapologetically excited about the universe and everything in it.  Like others have mentioned, if you weren’t her friend, it was only because you hadn’t met her yet. When you met her, she would quickly dig past traditional I-have-just-met-you small talk until she found a common passion or something to connect about. Our self evident enthusiasm for marine mammals and baking provided ample opportunities for geeking out together, but the ‘oh-wow-small-world’ moment that still makes me laugh is when we realised that her great uncle is the priest who celebrated my wedding!  

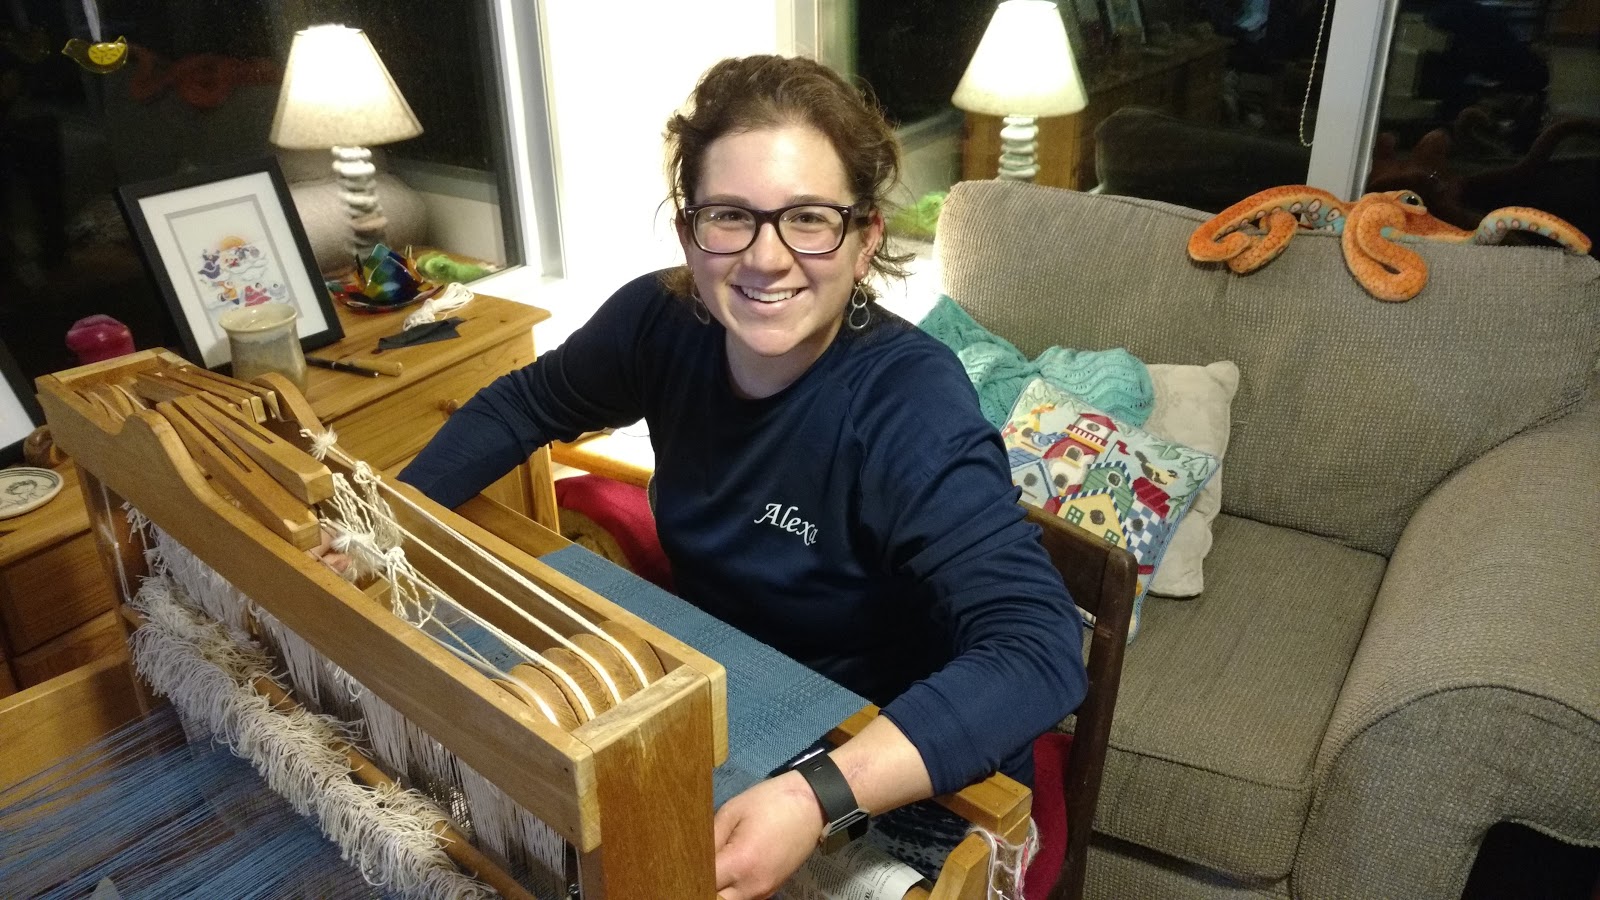
I will remember the dedication she had to maintaining the bonds of our GEMM Lab family, regularly driving across the coastal mountains for potlucks and boardgame nights (a 2 hr round trip most folks were reluctant to make!). I will remember her laughter whether she won or lost those games, and the way she insisted we make time to set aside our work and just exist as friends. I will remember her delight when I asked her to participate in a group weaving project, and the joy in her smile at learning a new skill. Alexa is inextricably woven into the tapestry of so many lives. The fabric of the community she helped build will hold her memory, and keep us warm with the blessing of her laughter.

–Like a Sailboat–

I am standing at the edge of the shore

A ship sails in the morning breeze

And heads for the open ocean

She is beauty, She is life.

I watch her ’til she disappears over the horizon.

Someone near me says << She is Gone >>

Gone where? Gone from my sight, that’s all.

Her mast is still as tall,

Her hull still holds the strength to carry

Her cargo of humanity

Her diminishment and loss from sight is in me, not in her.

And in the moment when someone near me say:

<< She is Gone >>

There are others who, seeing a sail on the horizon,

coming towards them,

exclaim with joy: << There She Is >>

This is death.

There are no dead,

Only people on both shores.

-Author unknown

To view a video montage put together by the GEMM lab click here.

Thank you for everything Alexa, we love and miss you, may your memory be a blessing.

Learning from teaching

Clara Bird, PhD Student, OSU Department of Fisheries and Wildlife, Geospatial Ecology of Marine Megafauna Lab

Based on my undergrad experience I assumed that most teaching in grad school would be as a teaching assistant, and this would consist of teaching labs, grading, leading office hours, etc. However, now that I’m in graduate school, I realize that there are many different forms of teaching as a graduate student. This summer I worked as an instructor for an e-campus course, which mainly involved grading and mentoring students as they developed their own projects. Yet, this past week I was a guest teacher for Physiology and Behavior of Marine Megafauna, which was a bit more involved.

I taught a whale photogrammetry lab that I originally developed as a workshop with a friend and former lab mate, KC Bierlich, at the Duke University Marine Robotics and Remote Sensing (MaRRS) lab when I worked there. Similar to Leila’s work, we were using photogrammetry to measure whales and assess their body condition. Measuring a whale is a deceivingly simple task that gets complicated when taking into account all the sources of error that might affect measurement accuracy. It is important to understand the different sources of error so that we are sure that our results are due to actual differences between whales instead of differences in errors.

Error can come from distortion due to the camera lens, inaccurate altitude measurements from the altimeter, the whale being arched, or from the measurement process. When we draw a line on the image to make a measurement (Image 1), measurement process errors come from the line being drawn incorrectly. This potential human error can effect results, especially if the measurer is inexperienced or rushing. The quality of the image also has an effect here. If there is glare, wake, blow or refraction covering or distorting the measurer’s view of the full body of the whale then the measurer has to estimate where to begin and end the line. This estimation is subjective and, therefore, a source of error. We used the workshop as an opportunity to study these measurement process errors because we could provide a dataset including images of varying qualities and collect data from different measurers.

Image 1. Screenshot of measuring the widths along a minke whale in MorphoMetriX. Source: https://github.com/wingtorres/morphometrix/blob/master/images/Picture4.png

This workshop started as a one-day lecture and lab that we designed for the summer drone course at the Duke Marine Lab. The idea was to simultaneously teach the students about photogrammetry and the methods we use, while also using all the students’ measurements to study the effect of human error and image quality on measurement accuracy. Given this one-day format, we ambitiously decided to teach and measure in the morning, compile and analyze the students’ measurements over lunch, and then present the results of our error analysis in the afternoon. To accomplish this, we prepared as much as we could and set up all the code for the analysis ahead of time. This preparation meant several days of non-stop working, discussing, and testing, all to anticipate any issues that might come up on the day of the class.  We used the measuring software MorphoMetriX (Torres & Bierlich, 2020) that was developed by KC and a fellow Duke Marine Lab grad student Walter Torres. MorphoMetriX was brand new at the time, and this newness of the software meant that we didn’t yet know all the issues that might come up and we did not have time to troubleshoot. We knew this meant that helping the students install the software might be a bit tricky and sure enough, all I remember from the beginning of that first lab is running around the room helping multiple people troubleshoot at the same time, using use all the programming knowledge I had to discover new solutions on the fly.

While troubleshooting on the fly can be stressful and overwhelming, I’ve come to appreciate it as good practice. Not only did we learn how to develop and teach a workshop, we also used what we had learned from all the troubleshooting to improve the software. I also used the code we developed for the analysis as the starting blocks for a software package I then wrote, CollatriX (Bird & Bierlich, 2020), as a follow up software to MorphoMetriX. Aside from the initial troubleshooting stress, the workshop was a success, and we were excited to have a dataset to study measurement process errors. Given that we already had all the materials for the workshop prepared, we decided to run a few more workshops to collect more data.

That brings me to my time at here at OSU. I left the Duke MaRRS lab to start graduate school shortly after we taught the workshop. Interested in running the workshop here, I reached out to a few different people. I first ran the workshop here as an event organized by the undergraduate club Ocean11 (Image 2). It was fun running the workshop a second time, as I used what I learned from the first round; I felt more confident, and I knew what the common issues would likely be and how to solve them. Sure enough, while there were still some troubleshooting issues, the process was smoother and I enjoyed teaching, getting to know OSU undergraduate students, and collecting more data for the project.

Image 2. Ocean11 students measuring during the workshop (Feb 7, 2020).
Image credit: Clara Bird

The next opportunity to run the lab came through Renee Albertson’s physiology and behavior of marine megafauna class, but during the COVID era this class had other challenges. While it’s easier to teach in person, this workshop was well suited to be converted to a remote activity because it only requires a computer, the data can be easily sent to the students, and screen sharing is an effective way to demonstrate how to measure. So, this photogrammetry module was a good fit for the marine megafauna class this term that has been fully remote due to COVID-19.  My first challenge was converting the workshop into a lab assignment with learning outcomes and analysis questions. The process also involved writing R code for the students to use and writing step-by-step instructions in a way that was clear and easy to understand. While stressful, I appreciated the process of developing the lab and these accompanying materials because, as you’ve probably heard from a teacher, a good test of your understanding of a concept is being able to teach it. I was also challenged to think of the best way to communicate and explain these concepts. I tried to think of a few different explanations, so that if a student did not understand it one way, I could offer an alternative that might work better. Similar to the preparation for the first workshop, I also prepared for troubleshooting the students’ issues with the software. However, unlike my previous experiences, this time I had to troubleshoot remotely.

After teaching this photogrammetry lab last week my respect for teachers who are teaching remotely has only increased. Helping students without being able to sit next to them and walk them through things on their computer is not easy. Not only that, in addition to the few virtual office hours I hosted, I was primarily troubleshooting over email, using screen shots from the students to try and figure out what was going on. It felt like the ultimate test of my programming knowledge and experience, having to draw from memories of past errors and solutions, and thinking of alternative solutions if the first one didn’t work. It was also an exercise in communication because programming can be daunting to many students; so, I worked to be encouraging and clearly communicate the instructions. All in all, I ended this week feeling exhausted but accomplished, proud of the students, and grateful for the reminder of how much you learn when you teach.

References

Bird, C. N., & Bierlich, K. (2020). CollatriX: A GUI to collate MorphoMetriX outputs. Journal of Open Source Software, 5(51), 2328. https://doi.org/10.21105/joss.02328

Torres, W., & Bierlich, K. (2020). MorphoMetriX: a photogrammetric measurement GUI for morphometric analysis of megafauna. Journal of Open Source Software, 5(45), 1825. https://doi.org/10.21105/joss.01825

Boundaries in the dynamic ocean

By Dawn Barlow, PhD student, OSU Department of Fisheries and Wildlife, Geospatial Ecology of Marine Megafauna Lab

The ocean is vast, ever-changing, and at first glance, seemingly featureless. Yet, we know that the warm, blue tropics differ from icy polar waters, and that temperate kelp forests are different from coral reefs. In the connected fluid environment of the global oceans, how do such different habitats exist, and what separates them? On a smaller scale, you may observe a current mixing line at the ocean surface, or dive down from the surface and feel the temperature drop sharply. In a featureless ocean, what boundaries exist, and how can we delineate between different environments?

These questions have been on my mind recently as I study for my PhD Qualifying Exams, an academic milestone that involves written and oral exams prepared by each committee member for the student. The subject matter spans many different areas, including ecological theory, underwater acoustics, oceanography, zooplankton dynamics, climate change and marine heatwaves, and protected area design. Yet, in my recent studying, I was struck by a realization: since when did my PhD involve so much physics? Atmospheric pressure differences generate wind, which drive global ocean circulation patterns. Density properties of seawater create structure in the ocean, and these physical features influence productivity and aggregate prey for predators such as whales. Sound propagates through the fluid ocean as a pressure wave, and its transmission is influenced by physical characteristics of the sound and the medium it moves through. Many of these examples can be distilled and described with equations rooted in physics. Physics doesn’t behave, it simply… is. In considering the vast and dynamic ocean, there is something quite satisfying in that simple notion. 

Circling back to boundaries in the ocean, there are changes in physical properties of the oceans that create boundaries, some stark and some nuanced. These physical features structure and partition the marine environment through differences in properties such as temperature, salinity, density, and pressure. Geographic partitions can occur in both horizontal and vertical dimensions of the water column, and on scales ranging from less than a kilometer to thousands of kilometers [1,2].

In the horizontal dimension, currents, fronts, and eddies mark transition zones between environments. In the time of industrial whaling, observations of temperature and salinity were made at the surface from factory whaling ships and examined to understand where the most whales were available for hunting. These early measurements identified temperature contour lines, or isotherms, and led to observations that whales were found in areas of stark temperature change and places where isotherms bent into “tongues” of interacting water masses [3,4] (Fig. 1). These areas where water masses of different properties meet are often areas of high productivity. Today, we understand that shelf break fronts, river plumes, tidal fronts, and eddies are important horizontal structures that drive elevated nutrient availability, phytoplankton production, and prey availability for mobile marine predators, including whales.

Figure 1. Surface temperature and salinity contour lines from measurements taken aboard a factory whaling ship in the Antarctic, reproduced from Nasu (1959).

In the vertical dimension, the water column is also structured into distinct layers. Surface waters are warmed by the sunlight and are often lower in salinity due to freshwater input from rain and runoff. Below this distinct surface portion of the water column, the temperature drops sharply in a layer known as the thermocline, and below which pressure and density increase with depth. The surface layer is subject to mixing from wind input, which can draw nutrients from below up into the photic zone and spur productivity. The alternation between stratification—a water column with distinctive layers—and mixing drives optimal conditions for entire food webs to thrive [1,2].

While I began this blog post by writing about boundaries that partition different ocean environments, I have continued to learn that those boundary zones are often critically important in their own right. I started by thinking about boundaries in terms of their importance for separation, but now understand that the leaky points between them actually spur ocean productivity. Features such as fronts, currents, mixed layers, and eddies separate water masses of different properties. However, they are not truly complete and rigid boundaries, and precisely for that reason they are uniquely important in promoting productive marine ecosystems.

Figure 2. Left: Some of the materials I am studying for my qualifying exams. Right: A blue whale surfaces in New Zealand’s South Taranaki Bight, the subject of my PhD and the lens through which I consider the concepts I am reading about (photo by L. Torres).

Many thanks to my PhD Committee members who continue to guide me through this degree and who I am lucky to learn from. In particular, the contents of this blog post were inspired by materials recommended by, and discussions with, Dr. Daniel Palacios.

References:

1.          Mann, K.H., and Lazier, J.R.N. (2006). Dynamics of Marine Ecosystems 3rd ed. (Blackwell Publishing).

2.          Longhurst, A.R. (2007). Ecological Geography of the Sea 2nd ed. (Academic Press).

3.          Nasu, K. (1959). Surface water conditions in the Antarctic whaling pacific area in 1956-57.

4.          Machida, S. (1974). Surface temperature fields in the Crozet and Kerguelen whaling grounds. Sci. Reports Whales Res. Inst. 26, 271–287.

Pretty science

By Solène Derville, Postdoc, OSU Department of Fisheries and Wildlife, Geospatial Ecology of Marine Megafauna Lab

Ever since I was a teenager, I have been drawn to both arts and sciences. When I decided to go down the path of marine biology and research, I never thought I would one day be led to exploit my artistic skills as well as my scientific interests.

Processing data, coding, analyzing, modeling… these tasks form the core of my everyday work and are what generates my excitement and passion for research. But once a new result has come up, or a new hypothesis has been formed, how boring would it be to keep it for myself? Science is all about communication, exchanges with our peers, with stakeholders, and with the general public. Graphical representations have always been supported in research throughout the history of sciences, and particularly the life sciences (Figure 1).

I have come to realize how much I enjoy this aspect of my work, and also how much I wish I was better prepared for it! In this blogpost I will talk about visual communication in science, and tackle the question of how to make our plots, diagrams, powerpoints, figures, maps, etc. convey information that goes beyond any spoken language? I have compiled a few tips from the design and infographics fields that I think could be reinvested in our scientific communication material.

Figure 1. Illustration from anonymous biology book (credit: Katie Garrett)

Plan, order, design

This suggestion may appear like a rather simplistic piece of advice, but any form of communication should start with a plan. What is the name of my project, the goal, and the audience? A scientific conference poster will not be created with the same design as a flyer aimed at the general public, nor will the same tools be used. Libre office powerpoint, canva, inkscape, scribus, R, plotly, GIMP… these are the open-source software I use on a regular basis but there so many more possibilities!

For whatever the type of visual you want to create, there are two major rules that need to be considered. First, embrace the empty space! You may think that you are wasting space that could be filled by all sorts of extremely valuable pieces of information… but this empty space has a purpose all by itself. The empty space brings forward the central elements of your design and will help focus the attention of the viewer toward them (top panel of Figure 2). Second, keep it neat and aligned. Whether you choose to anchor elements to each other or to an invisible grid, pay attention to details so that all images and text in the design from a harmonious whole (bottom panel in Figure 2).

Figure 2. Empty spaces and alignment principles of design – examples presented by Kingcom (http://kingkom.net/12-criteres-hierarchie-visuelle/)

Alignment is also an essential aspect to consider when editing images. More than any text, images will provide the first impression to the viewer and may subjectively communicate ideas in an instant. To make them most effective, images may follow the ‘rule of thirds’. Imagine breaking the image down into thirds, hence creating four directive lines over it (Figure 3). Placing the points of interest of the image at the intersections or along the lines will provide balance and attract the viewer’s attention. In marine mammal science where we often use pictures of animals with the ocean as a background, aligning the horizon along one of these horizontal lines may be a good technique (which I have not followed in Figure 3 though!).

Figure 3. Rule of thirds example applied to a photo of a humpback whale calf (South Lagoon New Caledonia, credit: Opération Cétacés – Solène Derville). Notice how the tip of the calf’s jaw is at the intersection of two lines.

When adding text to images, it is important to not overwhelm illustrations with text by trying to use extensive written material (which happens much too often). I try to keep the text to the strict minimum and let the visuals speak for themselves. When including text over or next to an image, I place the text in the empty spaces, where the eye is drawn to (Figure 4). When using dark or contrasted images, I add a semi-transparent layer in between the text and the image to make my text pop out.

Figure 4. Text embedding example applied to a photo of a humpback whale calf (South Lagoon New Caledonia, credit: Opération Cétacés – Solène Derville). Notice how I placed the text in the empty space so that the nose of the calf would point to it.

Fonts

Tired of using Arial, Times and Calibri but don’t know which other font to pick? One good piece of advice I found online was to choose a font that complements the purpose of the design. To do so, it is necessary to choose the message before picking the font. There are three categories of fonts (show in Image 1):

– Serif (classic style designed for books as the little feet at the extremities of the letters guide the eye along the lines of text)

– Sans serif (designed to look clean on digital screen)

– Display (more personality, but to be used in small doses!)

Image 1. Examples of each font category

I have also learned that pairing fonts together is often about using opposites (Figure 5). Contrasting fonts are complementary. For instance, it is visually appealing to combine a very bold font with a very light font, or a round font with something tall. And if you need more font choices than the ones provided by your usual software, here is a web repository to freely download thousands of different fonts: https://www.dafont.com

Figure 5. Paired fonts example applied to a photo of a humpback whale calf (South Lagoon New Caledonia, credit: Opération Cétacés – Solène Derville). Notice how I combined a rounded  font with  a smaller  sans serif font.

Colors

Colors have inherent meaning that depends on individual cultures. Whether we want it or not, any plot, photo, or diagram that we present to an audience will carry a subliminal message depending on its color palette. So better make it fit with the message!

Let us go passed the boring blue shades we have used for all of our marine science presentations so far, and instead open ourselves up to an infinite choice of colors! Color nuances are defined by three things: hue (the color itself), saturation (intensity, whether the color looks more subtle or more vibrant), and value (how dark or light a color is, ranging from white to black). The color wheel helps us visualize the relationships between hues and pick the best associations (Figure 6).

Figure 6. The color wheel helps us visualize the relationships between hues and pick the best associations. Any of the principles above should work, from the simple monochromatic schemes to the more complex triad or tetradic schemes.

First, pick the main color, the hero color for your design. Choose a cool color (blues and greens) if you want to provide a calming impression or a warm color (reds and yellows) for something more energizing. This basic principle of color theory made me think back on the black/blue dark shaded presentations that I might have attended in the past and had trouble staying awake!

Now, create your color palette, which are the three to four colors that will compose your design, ideally combining some vibrant and some more neutral colors for contrast. For instance, in a publication, a color palette may be used consistently in all plots or figures to represent a set of variables, study areas, or species . Now how do you pick the right complementary colors? The color wheel provides you with a few basic principles that should help you choose a palette (Figure 6). From monochromatic to tetradic schemes, the choice is up to you:

– monochromatic colors: varying values or saturation of a given color picked in the wheel

– analogous colors: colors sitting next to each other in the wheel

– complementary color: colors sitting opposite to each other

If you are an R user, there are a myriad of color palettes available to produce your visuals. One of the most comprehensive list I have found was compiled by Emil Hvitfeldt in github (https://github.com/EmilHvitfeldt/r-color-palettes). For discrete color palettes, I enjoy using the Canva palettes, which are available both in the Canva designs and in R using the ‘canva’ library in combination with the ‘ggplot2’ library (https://www.canva.com/learn/100-color-combinations/).

In practice, this means I can produce R plots or maps with color codes that match those I use in my canva presentations or posters. And finally, thumbs up to Dawn and Clara for creating our very own GEMM lab color palette based on whale photos collected in the field (Figure 7: https://github.com/dawnbarlow/musculusColors)!

Figure 7: Example of a R plot colored with the musculusColors package using the blue whale “Bmlunge” palette (credit: Dawn Barlow & Clara Bird)

I hope these few tips help you make your science as look as pretty as it is in your mind!

Sources:

A lot of the material in this blog post was inspired by the free tutorials provided by Canva: https://designschool.canva.com/courses/graphic-design-basics/?lesson=design-to-communicate

About the rule of thirds: https://digital-photography-school.com/rule-of-thirds/

About alignment: https://blog.thepapermillstore.com/design-principles-alignment/

Never a Straight Path

By Florence Sullivan, MSc, GEMM Lab Graduate

It’s rather amazing how, in a span of five years, the journey of your life can take twists and turns that you never expected. Long time blog readers may remember me as the graduate student who began this blog way back in February of 2015 with a recitation of our lab’s very first science outreach event. Since then, I completed my master’s thesis investigating gray whale foraging ecology (a project that just finished its 6th field season thanks to the excellent leadership of Lisa Hildebrand), fulfilled a dream of working as a marine mammal observer, and survived the existential crisis of graduation and job searching.

None of the species we study in this lab forage in straight lines.  If we consider a job (and salary) as the mechanism by which most of us put food on the table (i.e. foraging) why should our path be any less complex than theirs? By April 2018, I had moved back in with my parents in Seattle and was thoroughly heartsick about how long my job search was taking, so I jumped on the first field opportunity that came my way.  The project was billed as an attempt to pair discrete killer whale behaviors to specific call sequences, with collaborators from a variety of countries and backgrounds. In my enthusiasm, I ignored some red flags, and paid for it with a field season where I (1) experienced my first person-overboard situation, (2) witnessed steady verbal harassment, (3) was injured when our live-aboard trimaran was run aground on a clearly marked reef, and (4) ended up committing mutiny and leaving the project early.  There have been encouraging discussions in the marine science community recently about the barriers that women & early career scientists face while in the field, particularly with regard to accessibility, equity, and unpaid/underpaid internships. I will add some learned lessons to the list of things one should consider before embarking on a new research endeavor:

  • If someone says they are affiliated with a university, but will not give you a project or lab website because ‘the project is quite delicate, we don’t want other folks stealing our work’, check that they actually do have university affiliations and aren’t misrepresenting their connections. Do some homework.
  • Don’t cross a border without a contract, and when repeated attempts to secure a description of your responsibilities and payment are put off until later, consider that this might be a pattern of behavior.
  • If you were told that you would work under a senior bioacoustician, and you show up to find that your new colleague had been told the same thing, but neither of you has more than a MSc degree or much experience with acoustics, add this to your tally of red flags.
  • If basic safety standards (like wearing a life jacket on deck) are being ignored, hold yourself to a higher standard, and lead by example.
  • If sustained verbal and emotional abuse is occurring, you still have not been paid, and you’ve been asked to keep working after being injured in an accident caused by negligence, it is ok to break faith and leave a project.

Entering this project, I was very keen to learn new skills in acoustics, study a new species, and build partnerships with international researchers. Instead, I learned about interpersonal conflict and resolution strategies.  So, time for a new plan & another bend in my path. Thankfully, I have the immense privilege of a capable, employed husband who was able to support me while I recovered and began a new job search.

A pod of northern resident orcas resting during the rain, British Columbia. Photo credit: F. Sullivan
As salmon migrate upriver, their bodies undergo drastic changes in coloration, and once they spawn, they die. Their decomposing carcasses provide a critical influx of nutrients to the river and forest ecosystems of the Pacific Northwest. Photo credit: F. Sullivan

In the year that followed, I joined the team at the Environmental Science Center and taught 3rd -10th graders how to be “Salmon Heroes”. I explained salmon ecology, taking them on field experiences where we dissected salmon, measured oxygen and nitrogen levels in salmon streams, assessed habitat quality, observed migration and spawning behaviors (when fish cooperated), and brainstormed ways to protect these special (and delicious) fish. 

When salmon season came to an end, we transitioned to the “Beach Hero” program, targeted at K-3rd grade, where I became part of the classroom team, teaching intertidal ecology before bringing the kids to the beach where many of them experienced low tide for the first time.  In keeping with the education theme, I also worked with South Sound Nature School to provide kids with a forest-based after school program and was a summer camp counselor at Camp Long for several weeks. Still, I continued to try to find my way back to research and a data-driven career.

This is a sea star, it turns its stomach inside out to eat mussels! (we had awesome puppets for demonstration). Photo credit: Kharli Rose

Another bend in my ‘foraging’ job search happened when I stumbled across a short term data contract at my local election office while searching the state and county job boards. Washington State is a vote-by-mail state, and with a record turn-out in the 2018 mid-term elections they needed help updating everyone’s contact information & verifying signatures.  Let me tell you, staring at a computer screen, deciphering people’s handwriting to add emails and phone numbers to their voter registration for 8 hours a day for 6 weeks was not particularly fun. Yet, it gave me a little more experience in government databases, and gave me a lot of confidence in my election office for how transparent they are about every step of the voting process. I can’t speak for anywhere else, but in King County (Washington), you can go visit the election office & give yourself a self-guided walking tour of the whole ballot counting process from arrival to sorting to signature verification and opening to tallying. (There’s a hallway with massive windows surrounding the giant open concept floor space where everything happens, so you can observe without interfering). I’d never thought about what happens to my ballot after I mail it before, and its rather fascinating. Speaking of which, Please Vote!

Frustrated by a job search that failed to yield anything with health benefits or more than part-time hours, my Dad suggested that I apply to the University of Washington Continuing Education program, and enroll in a professional certificate to add another explicit skill to my resume. When enough pressure is applied to the system, something has to give eventually. The month where I was accepted to the UW Certificate in Statistical Analysis with R Programming was also the month I started interviewing for the Research Analyst Position at the Pacific Whale Foundation.  Partially because I could prove my data management experience, and that I was serious about continuing to hone my skiIls, I was offered, and accepted the position! Hilariously or stressfully, however you want to look at it, I moved to Maui, began my new position, and started my statistics with R programming coursework all in the same week – the learning curve was STEEP.

Amazingly, Leila (another GEMM Lab alumn) was visiting Maui the week I moved, and we were able to have dinner together my first night on-island! Photo credit: Leila Lemos

I completed my certificate in June, and hit my one-year work anniversary last month! I’m responsible for a good portion of our database management, and use R coding on a daily basis to pull data requests, tidy historical data, and add new information.  I’d never been to Maui before moving here, but now I’ve experienced the glory of Humpback whale breeding & calving season and heard whale song underwater. I’ve helped collect important life history data for false killer whales, spotted, spinner & bottlenose dolphins, and I’m looking forward to encountering more new-to-me odontocete species. It took months before I felt like I was past the ‘onboarding’ information stage, but now I’m collaborating with my colleagues on my first data analysis project (rather than simple data management) and loving my team despite the wrenches that the pandemic has thrown in our work. My job search = cetacean foraging analogy breaks down a little at this point, but my story still stands. I acknowledge my privilege of a good education and supportive husband, but I have this suggestion for job seekers: Don’t be afraid to get creative while you search for the right position, because you never know what you might stumble across and learn along the way. In the process, do your best to catch red flags, and keep yourself out of dangerous positions.  My job search hasn’t been a straight path, but that doesn’t mean it wasn’t full of small victories, and it did ultimately lead to a successful “prey patch”.

A pod of northern resident orcas traveling along the outer coast of British Columbia.

Marine mammals of the Northern California Current, 2020 edition

By Dawn Barlow, PhD student, OSU Department of Fisheries and Wildlife, Geospatial Ecology of Marine Megafauna Lab

Clara and I have just returned from ten fruitful days at sea aboard NOAA Ship Bell M. Shimada as part of the Northern California Current (NCC) ecosystem survey. We surveyed between Crescent City, California and La Push, Washington, collecting data on oceanography, phytoplankton, zooplankton, and marine mammals (Fig. 1). This year represents the third year I have participated in these NCC cruises, which I have come to cherish. I have become increasingly confident in my marine mammal observation and species identification skills, and I have become more accepting of the things out of my control – the weather, the sea state, the many sightings of “unidentified whale species”. Careful planning and preparation are critical, and yet out at sea we are ultimately at the whim of the powerful Pacific Ocean. Another aspect of the NCC cruises that I treasure is the time spent with members of the science team from other disciplines. The chatter about water column features, musings about plankton species composition, and discussions about what drives marine mammal distribution present lively learning opportunities throughout the cruise. Our concurrent data collection efforts and ongoing conversations allow us to piece together a comprehensive picture of this dynamic NCC ecosystem, and foster a collaborative research environment.  

Figure 1. Data collection effort for the NCC September 2020 cruise, between Crescent City, CA, and La Push, WA. Red points represent oceanographic sampling stations, and black lines show the track of the research vessel during marine mammal survey effort.

Every time I head to sea, I am reminded of the patchy distribution of resources in the vast and dynamic marine environment. On this recent cruise we documented a stark contrast between  expansive stretches of warm, blue, stratified, and seemingly empty ocean and areas that were plankton-rich and supported multi-species feeding frenzies that had marine mammal observers like me scrambling to keep track of everything. This year, we were greeted by dozens of blue and humpback whales in the productive waters off Newport, Oregon. Off Crescent City, California, the water was very warm, the plankton community was dominated by gelatinous species like pyrosomes, salps, and other jellies, and the marine mammals were virtually absent except for a few groups of common dolphins. To the north, the plume of water flowing from the Columbia River created a front between water masses, where we found ourselves in the midst of pacific white-sided dolphins, northern right whale dolphins, and humpback whales. These observations highlight the strength of ecosystem-scale and multi-disciplinary data collection efforts such as the NCC surveys. By drawing together information on physical oceanography, primary productivity, zooplankton community composition and abundance, and marine predator distribution, we can gain a nearly comprehensive picture of the dynamics within the NCC over a broad spatial scale.

This year, the marine mammals delivered and kept us observers busy. We lucked out with good survey conditions and observed many different species throughout the NCC (Table 1, Fig. 2).

Table 1. Summary of all marine mammal sightings from the NCC September 2020 cruise.

Figure 2. Maps showing kernel densities of four frequently observed and widely distributed species seen during the cruise. Black lines show the track of the research vessel during marine mammal survey effort, white points represent sighting locations, and colors show kernel density estimates weighted by group size at each sighting.

This year’s NCC cruise was unique. We went to sea as a global pandemic, wildfires, and political tensions continue to strain this country and our communities. This cruise was the first NOAA Fisheries cruise to set sail since the start of the pandemic. Our team of scientists and the ship’s crew went to great lengths to make it possible, including a seven-day shelter-in-place period and COVID-19 tests prior to cruise departure. As a result of these extra challenges and preparations, I think we were all especially grateful to be on the water, collecting data. At-sea fieldwork is always challenging, but morale was up, spirits were high, and laughs were frequent despite smiles being concealed by our masks. I am grateful for the opportunity to participate in this ongoing valuable data collection effort, and to be part of this team. Thanks to all who made it such a memorable cruise.

Figure 3. The NCC September 2020 science team at the end of a successful research cruise! Fieldwork in the time of COVID-19 presents many logistical challenges, but this team rose to the occasion and completed a safe and fruitful survey despite the circumstances.

Stories from a whale’s life: how whale photo-identification is an essential part of the whale physiology toolkit

By Alejandro Fernandez Ajo, PhD student at the Department of Biology, Northern Arizona University, Visiting scientist in the GEMM Lab working on the gray whale physiology and ecology project  

Two years ago, in August 2018, I came to Newport and visited the Hatfield Marine Science Center for the first time with an NSF/RCN-founded laboratory exchange with the GEMM Lab and met Dr. Leigh Torres. My goals during this exchange where to learn about non-invasive fieldwork techniques for studying free-range whales while interacting, exchanging ideas, and networking with the GEMM Lab members; also, to discuss some projects and thoughts for future collaborations with Dr. Torres. During those two weeks in Newport, I had the opportunity to help with field work on the project “Evaluation of gray whale ecology and physiology in response to variable ambient ocean noise conditions”, which aims to evaluate the hormonal variability and health of the gray whales that forage along the Oregon coast in the context of multiple stressors. I would return during the summers of 2019 and 2020 as a visiting scientist and research assistant to work on this project. This year the experience has been a bit different in terms of interactions with the HMSC community due to COVID-19; however, we were able to successfully start the field season in time and now we are wrapping up our second month of surveys with many new and interesting data gathered, and many new, unforgettable memories to be treasured. Working with these animals is incredibly fascinating because there are so many things we don´t know about them, and the questions can become both overwhelming and exciting.

An essential part of this project, and arguably any research project done with cetaceans, is the identification of individuals. Hence, considerable effort is expended each year attempting to photograph every gray whale possible within our study region and to identify each whale we encounter. The GEMM Lab maintains a catalog of the gray whales that visit the Oregon coast, a sub-population known as the Pacific Coast Feeding Group (PCFG). This catalog currently consists of 173 individuals. which we frequently compare with a larger catalog of gray whales that includes 2060 individuals observed since 1977 (Cascadia Research Collective). These methods allow us to know who is who among the whales we encounter each day at sea.

The different species of cetaceans can be individually identified by markings on their bodies, very much like fingerprints in humans. Some features on these animals are unique and conserved through life. For example, Southern and Northern right whales are identified by the callosity patters in their heads (Picture 1), while humpback whales are mostly identified individually by the shape and the patterns of black and white pigmentation on the underside of their fluke (Picture 2). Gray whales have very mottled skin coloration, so we use a combination of markings and features to identify individuals: pigmentation patterns, scars, shape and pigmentation of their fluke, and sometimes the shape of their knuckles, which are a series of “humps” that gray whales have instead of a dorsal fin on their back. It might sound very difficult to do, and it can be a tedious task, however as you train your eye it becomes easier, and features that at first seemed undistinguishable become recognizable and unique (Picture 3). As a reward, it is such a joy to find a match and recognize old friends when they arrive from their long journeys in the vast ocean each year to the Oregon coast.

The callosity pattern of a southern right whale. Photo by Alejandro Fernández Ajó – Instituto de Conservación de Ballenas.
Three different humpback whales with notably different pigmentation patterns on their flukes. Photographs captured under NOAA/NMFS permit #21678.
The gray whale “Knife” we have observed frequently this summer off the Oregon coast. Can you see how the right pigmentation pattern identified looks like a knife? Photograph captured under NOAA/NMFS permit #21678.

As a result of our photo-identification efforts and the high site-fidelity of the whales we study, the large majority of the gray whales we observe here in Oregon are known individually. For many whales, we also have detailed sightings records that can span years and decades, that document calving history, lactation, appearance of scars indicative of injury or entanglement, minimum age, sex, habitat-use patterns, behaviors, etc. Holding such detailed information of individual whales provides incredible contributions to our understanding of the basic patterns in life history of whales, such as reproduction rates, calving intervals, age of first reproduction, etc. Moreover, when these life history events are linked with physiological sample collection large steps can be made in the development and validation of physiological methods. Many endocrine assays currently in use for whales are based on non-traditional sample types including feces, respiratory vapor, and baleen, which have been validated using the catalogs of well-known individuals to verify that measured hormones reflect patterns expected for various physiological states. For example, we can compare endocrine data of confirmed pregnant females, known mature males, and known-injured whales to learn how whale physiological responses are different during different life history events (e.g., Burgess et al. 2017, 2018, Corkeron et al. 2017, Hunt et al. 2006, 2016, 2018, Lysiak et al. 2018, Rolland et al. 2005).

Here in Oregon we are learning from the lives of the gray whales we study, and here I want to share with you two of their stories, one happy and one not-so-happy.

Let´s start with the not-so-happy story so we can end with some brighter news. On June 24 this year, we encountered a whale near Cape Foulweather, which is a very tricky area to work as there are many rocks and shallow water that make the sea conditions very choppy even with low swell. We started documenting the sighting as usual, taking pictures of the left side, the right side and ideally also the fluke of the whale. As we approached this whale, we started noting that something was wrong with its fluke. With the challenging sea conditions, it was not easy to approach the whale and the whale was not exposing its fluke when diving. When we put our drone up to collect photogrammetry and behavior data we gained a much better perspective. This whale has a bad injury on it fluke (Picture 4.C). On the boat we started making conjectures about the cause of this terrible injury that had basically amputate most of its left fluke lobe. Once back on shore, we sorted out the photos and compared the field images captured during the day with the photo-ID catalog and we made a match. This whale is known in our catalog as “ROLLER SKATE”, is a female, and was first sighted in 2015, so she is at least 5 years old today.

The story unfolded when we reviewed Roller Skate’s sighting history. Interestingly we observed this same whale in the same location last September 2019. Unfortunately, it was a very brief encounter but enough for photo documentation of the whale and an interesting observation. Here I quote the field notes that Dr. Torres wrote from this sighting: “September 6th, 2019. Sighting 9: Scattered whales feeding and/or traveling across area to north of Cape Foulweather. One whale had recently chopped fluke; tried to re-find to get better photos but could not (looking at photos now, this whale is clearly entangled in line!). Ceiling too low for UAS [drone flight].” (Picture 4.B).

Progressive photos of Roller Skate’s fluke. In 2017, her fluke was healthy (A). In 2019, we observed her fluke with a line entanglement and “chewed up” (B). In 2020, we have observed the resulting wound and healing process (C). Photographs captured under NOAA/NMFS permit #21678.

Roller skate’s story is an example of how essential is to keep an ID catalog. After a close-up examination of the 2019 picture, we can clearly see a rope entanglement (Picture 4.B). Photos from previous years show how beautiful and healthy her fluke was before this event (Picture 4.A). This event is heart breaking to witness, but this whale could be considered lucky because she was able to shed the gear and survive this entanglement, at least in the short term. Additionally, we can learn from Roller Skate’s misfortune to help us understand what the consequences of such an injury (stressor) may be on the physiology of a whale. We have been eager to collect a fecal sample from Roller Skate to analyze how her hormone levels compare to non-injured whales. Fortunately, we got lucky a couple weeks ago and collected this sample, so now we need to get in the lab and analyze the samples. But more questions remain: Will this injury impact her ability to reproduce? If so, for how long? And at a larger scale, what are the population consequences of such events? If we can understand the magnitude of lethal and sublethal human caused impacts on individual whales and their populations from events such as entanglements, we can develop better methods to mitigate and limit such hazards for whales in their environments.

As I promised, there is also some good news to share. A very well-known PCFG whale, almost a celebrity I dear to say, is “Scarback”, or as we like to call her “Scarlett”. Scarlett is a female known since 1996, making her at least 24 years old, and she also has a very bad injury of unknown origin. Scarlett has a terrible scar on her back that is theorized to have been caused by an explosive harpoon, or maybe a bad ship-strike (Picture 5), but we really do not know. However, we do know she survived this injury and this year she brought a new calf into the population (Picture 6). This is the second calf we have documented from Scarlett, with her previous calf sighted during the 2016 field season and we call it “Brown”. Scarlett is an example of how resilient these amazing giants can be; however, it is likely that while she was recovering from this injury, she was unable to reproduce. How many calves from Scarlett did the PCFG population “lose” due to such a tragedy? We can´t know, but we are learning, and her story will also help us understand whale physiology as we will analyze her fecal hormones and body condition during pregnancy, lactation, and resting phases.

The scar on Scarlett’s back. This significant wound has an unknown origin. Photograph captured under NOAA/NMFS permit #21678.

Scarlett is a survivor. We need to recognize that we are sharing the ocean with different forms of life. We need to acknowledge their existence and understand how our use of the oceans is affecting them, and, more importantly, work toward improving their conditions. I hope that with our research we highlight and communicate how amazing are these animals, and how important are they for marine ecosystems. And ultimately, I hope our work helps minimize the impacts that affect other forms of ocean life that coexist with us, both above and below the surface.

The well-known gray whale “Scarlett” surfaces under her calf while it checks out the GEMM Lab field team. Photo by Alejandro Fernandez Ajo taken under NOAA/NMFS permit #21678.

References:

Burgess, E., Hunt, K. E., Kraus, S. D. and Rolland, R. M. (2016). Get the most out of blow hormones: validation of sampling materials, field storage and extraction techniques for whale respiratory vapor samples. Conservation Physiology, 4, cow024.

Burgess, E. A., Hunt, K. E., Kraus, S. D. and Rolland, R. M. (2018). Quantifying hormones in exhaled breath for physiological assessment of large whales at sea. Scientific Reports, 8, 10031.

Corkeron, P. J., Rolland, R. M., Hunt, K. E. and Kraus, S. D. (2017). A right whale PooTree: Fecal hormones and classification trees identify reproductive states in North Atlantic right whales (Eubalaena glacialis). Conservation Physiology, 5, cox006. DOI: 10.1093/conphys/cox006.

Hunt, K., Lysiak, N., Moore, M. and Rolland, R. (2017). Multi-year longitudinal profiles of cortisol and corticosterone recovered from baleen of North Atlantic right whales (Eubalaena glacialis). General and Comparative Endocrinology, 254, 50-59. DOI: 10.1016/j.ygcen.2017.09.009.

Hunt, K., Lysiak, N. S. J., Matthews, C. J. D., et al. (2018). Multi-year patterns in testosterone, cortisol and corticosterone in baleen from adult males of three whale species. Conservation Physiology, 6, coy049. DOI: 10.1093/conphys/coy049.

Hunt, K. E., Rolland, R. M., Kraus, S. D. and Wasser, S. K. (2006). Analysis of fecal glucocorticoids in the North Atlantic Right Whale (Eubalaena glacialis). General and Comparative Endocrinology, 148, 260-272.

Lysiak, N., Trumble, S., Knowlton, A. and Moore, M. (2018). Characterizing the duration and severity of fishing gear entanglement on a North Atlantic right whale (Eubalaena glacialis) using stable isotopes, steroid and thyroid hormones in baleen. Frontiers in Marine Science. DOI: 10.3389/fmars.2018.00168.

Rolland, R. M., Hunt, K. E., Kraus, S. D. and Wasser, S. K. (2005). Assessing reproductive status of right whales (Eubalaena glacialis) using fecal hormone metabolites. General and Comparative Endocrinology, 142, 308-317.

Inference, and the intersection of ecology and statistics

By Dawn Barlow, PhD student, OSU Department of Fisheries and Wildlife, Geospatial Ecology of Marine Megafauna Lab

Recently, I had the opportunity to attend the International Statistical Ecology Conference (ISEC), a biennial meeting of researchers at the interface of ecology and statistics. I am a marine ecologist, fascinated by the interactions between animals and the dynamic ocean environment they inhabit. If you had asked me five years ago whether I thought I would ever consider myself a statistician or a computer programmer, my answer would certainly have been “no”. Now, I find myself studying the ecology of blue whales in New Zealand using a variety of data streams and methodologies, but a central theme for my dissertation is species distribution modeling. Species distribution models (SDMs) are mathematical algorithms that correlate observations of a species with environmental conditions at their observed locations to gain ecological insight and predict spatial distributions of the species (Fig. 1; Elith and Leathwick 2009). I still can’t say I would identify as a statistician, but I have a growing appreciation for the role of statistics to gain inference in ecology.

Figure 1. A schematic of a species distribution model (SDM) illustrating how the relationship between mapped species and environmental data (left) is compared to describe “environmental space” (center), and then map predictions from a model using only environmental predictors (right). Note that inter-site distances in geographic space might be quite different from those in environmental space—a and c are close geographically, but not environmentally. The patterning in the predictions reflects the spatial autocorrelation of the environmental predictors. Figure reproduced from Elith and Leathwick (2009).

Before I continue, let’s take a look at just a few definitions from Merriam-Webster’s dictionary:

Statistics: a branch of mathematics dealing with the collection, analysis, interpretation, and presentation of masses of numerical data

Ecology: a branch of science concerned with the interrelationship of organisms and their environments

Inference: a conclusion or opinion that is formed because of known facts or evidence

Ecological data are notoriously noisy, messy, and complex. Statistical tests are meant to help us understand whether a pattern in the data is different from what we would expect through random chance. When we study how organisms interact with one another and their environment, it is impossible to completely capture all elements of the ecosystem. Therefore, ecology is a field ripe with challenges for statisticians. How do we quantify a meaningful biological signal amidst all the noise? How can we gain inference from ecological data to enhance knowledge, and how can we use that knowledge to make informed predictions? Marine mammals are notoriously difficult to study. They inhabit an environment that is relatively inaccessible and inhospitable to humans, they occur in low numbers, they are highly mobile, and they are rarely visible. All ecological data are difficult and noisy and riddled with small sample sizes, but counting trees presents fewer logistical challenges than counting moving whales in an ever-changing open-ocean setting. Therefore, new methodologies in areas like species distribution modeling are often developed using large, terrestrial datasets and eventually migrate to applications in the marine environment (Robinson et al. 2011).

Many presentations I attended at the conference were geared toward moving beyond correlative SDMs. SDMs were developed to correlate species occurrence patterns with features of the environment they inhabit (e.g. temperature, precipitation, terrain, etc.). However, those relationships do not actually explain the underlying mechanism of why a species is more likely to occur in one environment compared to another. Therefore, ecological statisticians are now using additional information and modeling approaches within SDMs to incorporate information such as species co-occurrence patterns, population demographic information, and physiological constraints. Building SDMs to include such process-explicit information allows us to make steps toward understanding not just when and where a species occurs, but why.

Machine learning is an area that continues to advance and open doors to new applications in ecology. Machine learning approaches differ fundamentally from classical statistics. In statistics, we formulate a hypothesis, select the appropriate model to test that hypothesis (for example, linear regression), then test how well the data fit the model (“Is the relationship linear?”), and test the strength of that inference (“Is the linear pattern different from what we would expect due to random chance?”). Machine learning, on the other hand, does not use a predetermined notion of relationships between variables. Rather, it tries to create an algorithm that fits the patterns in the data. Statistics asks how well the data fit a model, and machine learning asks how well a model fits the data.

Machine learning approaches allow for very complex relationships to be included in models and can be excellent for making predictions. However, sometimes the relationships fitted by a machine learning algorithm are so complex that it is not possible to infer any ecological meaning from them. As one ISEC presenter put it, in machine learning “the computer learns but the scientist does not”. The most important thing when selecting your methodology is to remember your question and your goal. Do you want to understand the mechanism of why an animal is where it is? Or do you not need to understand the driver, but rather want to make the best predictions of where an animal will be? In my case, the answer to that question differs from one of my PhD chapters to the next. We want to understand the functional relationships between oceanography, krill availability, and blue whale distribution (Barlow et al. 2020), and subsequently we want to develop forecasting models that can reliably predict blue whale distribution to inform conservation efforts (Fig. 2).

Figure 2. An example predictive map of where we expect blue whales to be distributed based on environmental conditions. Warmer colors represent areas with a higher probability of blue whale occurrence, and the blue crosses represent locations where blue whales were observed.

ISEC was an excellent opportunity for me to break out of my usual marine mammal-centered bubble and get a taste of what is happening on the leading edge of statistical ecology. I learned about the latest approaches and innovations in species distribution modeling, and in the process I also learned about trees, koalas, birds, and many other organisms from around the world. A fun bonus of attending a methods-focused conference is learning about completely new study species and systems. There are many ways of approaching an ecological question, gaining inference, and making predictions. I look forward to incorporating the knowledge I gained through ISEC into my own research, both in my doctoral work and in applications of new methods to future research projects.

Figure 3. The virtual conference photo of all who attended the biennial International Statistical Ecology Conference. Thank you to the organizers, who made it a truly excellent and engaging conference experience!

References

Barlow, D.R., Bernard, K.S., Escobar-Flores, P., Palacios, D.M., and Torres, L.G. 2020. Links in the trophic chain: Modeling functional relationships between in situ oceanography, krill, and blue whale distribution under different oceanographic regimes. Mar. Ecol. Prog. Ser. doi:https://doi.org/10.3354/meps13339.

Elith, J., and Leathwick, J.R. 2009. Species Distribution Models: Ecological Explanation and Prediction Across Space and Time. Annu. Rev. Ecol. Evol. Syst. 40(1): 677–697. doi:10.1146/annurev.ecolsys.110308.120159.

Robinson, L.M., Elith, J., Hobday, A.J., Pearson, R.G., Kendall, B.E., Possingham, H.P., and Richardson, A.J. 2011. Pushing the limits in marine species distribution modelling: Lessons from the land present challenges and opportunities. doi:10.1111/j.1466-8238.2010.00636.x.

Whales are amazing, and also provide amazing benefits to our oceans and human society

By Alejandro Fernandez Ajo, PhD student at the Department of Biology, Northern Arizona University, Visiting scientist in the GEMM Lab working on the gray whale physiology and ecology project  

Whales are among the most amazing and enigmatic animals in the world. Whales are not only fascinating, they are also biologically special. Due to their key ecological role and unique biological traits (i.e., their large body size, long lifespans, and sizable home ranges), whales are extremely important in helping sustain the entire marine ecosystem.

Working towards the conservation of marine megafauna, and large charismatic animals in general, is often seen as a mere benevolent effort that conservationist groups, individuals, and governments do on behalf of the individual species. However, mounting evidence demonstrates that restoring populations of marine megafauna, including large whales, can help buffer marine ecosystems from destabilizing stresses like human driven CO2 emissions and global change due to their ability to sequester carbon in their bodies (Pershing et al. 2010). Furthermore, whales can enhance primary production in the ocean through their high consumption and defecation rates, which ultimately provides nutrients to the ecosystem and improves fishery yields (Roman-McCarthy, 2010; Morissette et al. 2012).

Relationships between humans and whales have a long history, however, these relationships have changed. For centuries, whales were valued in terms of the number of oil barrels they could yield, and the quality of their baleen and meat. In the North Atlantic, whaling started as early as 1000 AD with “shore whaling” of North Atlantic right whales by Basque whalers. This whaling was initially limited to the mother and calve pairs that were easy to target due to their coastal habits and the fact that calves are more vulnerable and slower (Reeves-Smith, 2006). Once the calving populations of near-shore waters off Europe were depleted, offshore whaling began developing. Whalers of multiple nations (including USA, British, French, Norwegian, Portuguese, and Dutch, among others), targeted whales around the world, mainly impacting the gray whale populations, and all three right whale species along with the related bowhead whale. Later, throughout the phase of modern whaling using industrialized methods, the main target species consisted of the blue, fin, humpback, minke, sei and sperm whale (Schneider- Pearce, 2004).

By the early twentieth century, many of the world´s whale populations where reduced to a small fraction of their historical numbers, and although pre-whaling abundance of whale stocks is a subject of debate, recent studies estimate that at least the 66%, and perhaps as high as 90% for some whale species and populations (Branch-Williams 2006; Christensen, 2006), where taken during this period. This systematic and serial depletion of whale papulations reduced the biomass and abundance of great whales around the world, which has likely altered the structure and function of the oceans (Balance et al. 2006; Roman et al. 2014; Croll, et al. 2006).

After centuries of unregulated whale hunting, commercial whaling was banned in the mid-twentieth century. This ban was the result of multiple factors including reduced whale stocks below the point where commercial whaling would be profitable, and a fortunate shift in public perception of whales and the emergence of conservation initiatives (Schneider- Pearce, 2004). Since this moratorium on whaling, several whale populations have recovered around the world, and some populations that were listed as endangered have been delisted (i.e., the Eastern North Pacific gray whale) and some populations are estimated to have re-bounced to their pre-whaling abundance.

Although, the recovery of some populations has motivate some communities or nations to obtain or extend their whaling quotas (see Blog Post by Lisa Hildebrand), it is important to acknowledge that the management of whale populations is arguably one of the most complicated tasks, and is distinguished from management of normal fisheries due to various biological aspects. Whales are long living mammals with slow reproduction rates, and on average a whale can only produce a calf every two or three years. Hence, the gross addition to the stock rarely would exceed 25% of the number of adults (Schneider- Pearce, 2004), which is a much lower recovery rate that any fish stock. Also, whales usually reach their age of sexual maturity at 6-10 years old, and for many species there are several uncertainties about their biology and natural history that make estimations of population abundance and growth rate even harder to estimate.

Fig 1: Human relationship with whales has changed through history. Once valued for their meat and oil, now they are a natural attraction that amaze and attract crowds to whale watching destinations all over the globe. Photo: Stephen Johnson, Península Valdés-Argentina.

Moreover, while today´s whales are generally not killed directly by hunting, they are exposed to a variety of other increasing human stressors (e.g., entanglement in fishing gear, vessel strikes, shipping noise, and climate change). Thus, scientists must develop novel tools to overcome the challenges of studying whales and distinguish the relative importance of the different impacts to help guide conservation actions that improve the recovery and restoration of whale stocks (Hunt et al. in press). With the restoration of great whale populations, we can expect positive changes in the structure and function of the world’s oceans (Chami et al. 2019; Roman et al. 2010).

So, why it is worth keeping whales healthy?

Whales facilitate the transfer of nutrients by (1) releasing nutrient-rich fecal plumes near the surface after they have feed at depth and (2) by moving nutrients from highly productive, polar and subpolar latitude feeding areas to the low latitude calving areas (Roman et al. 2010). In this way, whales help increase the productivity of phytoplankton that in turn support zooplankton production, and thus have a bottom up effect on the productivity of many species including fish, birds, and marine mammals, including whales. These fertilization events can also facilitate mitigation of the negative impacts of climate change. The amount of iron contained in the whales’ feces can be 10 million times greater than the level of iron in the marine environment, triggering important phytoplankton blooms, which in turn sequester thousands of tons of carbon from, and release oxygen to, the atmosphere annually (Roman et al. 2016; Smith et al. 2013; Willis, 2007). Furthermore, when whales die, their massive bodies fall to the seafloor, making them the largest and most nutritious source of food waste, which is capable of sustaining a succession of macro-fauna assemblages for several decades, including some invertebrate species that are endemic to whale carcasses (Smith et al. 2015).

Figure 2. The figure shows a conceptual model of the “whale pump”. From Roman-McCarthy, 2010.

Despite the several environmental services that whales provide, and the positive impact on local economies that depend on whale watching tourism, which has been valued in millions of dollars per year (Hoyt E., 2001), the return of whales and other marine mammals has often been implicated in declines in fish populations, resulting in conflicts with human fisheries (Lavigne, D.M. 2003). Yet there is insufficient direct evidence for such competition (Morissette et al. 2010). Indeed, there is evidence of the contrary: In ecosystem models where whale abundances are reduced, fish stocks show significant decreases, and in some cases the presence of whales in these models result in improved fishery yields. Consistent with these findings, several models have shown that alterations in marine ecosystems resulting from the removal of whales and other marine mammals do not lead to increases in human fishery yields (Morissette et al. 2010; 2012). Although the environmental services and benefits provided by great whales, which potentially includes the enhancement of fisheries yields, and enhancement on ocean oxygen production and capturing carbon, are evident and make a strong argument for improved whale conservation, it is overwhelming how little we know about many aspects of their lives, their biology, and particularly their physiology.

Figure 3: Whales are the most fascinating animals in the world, but they are not only amazing animals. They are also extremely important in sustaining the entire marine ecosystem. Photo: Alejandro Fernández Ajó -Instituto de Conservación de ballenas.

This lack of knowledge is because whales are really hard to study. For many years research was limited to the observation of the brief surfacing of the whales, yet most of their lives occurs beneath the surface and were completely unknown. Fortunately, new technologies and the creativity of whale researchers are helping us to better understand many aspects of their lives that were cryptic to us even a decade ago. I am committed to filling some of these knowledge gaps. My research examines how different environmental and anthropogenic impacts affect whale health, and particularly how these impacts may relate to cases of large whale mortalities and declines in whale populations. I am applying novel methods in conservation physiology for measuring hormone levels that promise to improve our understanding of the relationship between different (extrinsic and intrinsic) stressors and the physiological response of whales. Ultimately, this research will help address important conservation questions, such as the causes of unusual whale mortality events and declines in whale populations.

References:

Ballance LT, Pitman RL, Hewitt R, et al. 2006. The removal of large whales from the Southern Ocean: evidence for long-term ecosystem effects. In: Estes JA, DeMaster DP, Doak DF, et al. (Eds). Whales, whaling and ocean ecosystems. Berkeley, CA: University of California Press.

Branch TA and Williams TM. 2006. Legacy of industrial whaling. In: Estes JA, DeMaster DP, Doak DF, et al. (Eds). Whales, whaling and ocean ecosystems. Berkeley, CA: University of California Press.

Chami, R. Cosimano, T. Fullenkamp, C. & Oztosun, S. (2019). Nature’s solution to climate change. Finance & Development, 56(4).

Christensen LB. 2006. Marine mammal populations: reconstructing historical abundances at the global scale. Vancouver, Canada: University of British Columbia.

Croll DA, Kudela R, Tershy BR (2006) Ecosystem impact of the decline of large whales in the North Pacific. In: Estes JA, DeMaster DP, Doak DF, Williams TM, BrownellJr RL, editors. Whales, Whaling, and Ocean Ecosystems. Berkeley: University of California Press. pp. 202–214.

Hoyt, E. 2001. Whale Watching 2001: Worldwide Tourism Numbers, Expenditures and Expanding Socioeconomic Benefits

Hunt, K.E., Fernández Ajó, A. Lowe, C. Burgess, E.A. Buck, C.L. In press. A tale of two whales: putting physiological tools to work for North Atlantic and southern right whales. In: “Conservation Physiology: Integrating Physiology Into Animal Conservation And Management”, ch. 12. Eds. Madliger CL, Franklin CE, Love OP, Cooke SJ. Oxford University press: Oxford, UK.

Lavigne, D.M. 2003. Marine mammals and fisheries: the role of science in the culling debate. In: Gales N, Hindell M, and Kirkwood R (Eds). Marine mammals: fisheries, tourism, and management issues. Melbourne, Australia: CSIRO.

Morissette L, Christensen V, and Pauly D. 2012. Marine mammal impacts in exploited ecosystems: would large scale culling benefit fisheries? PLoS ONE 7: e43966.

Morissette L, Kaschner K, and Gerber LR. 2010. “Whales eat fish”? Demystifying the myth in the Caribbean marine ecosystem. Fish Fish 11: 388–404.

Pershing AJ, Christensen LB, Record NR, Sherwood GD, Stetson PB (2010) The impact of whaling on the ocean carbon cycle: Why bigger was better. PLoS ONE 5(8): e12444.

Reeves, R. and Smith, T. (2006). A taxonomy of world whaling. In DeMaster, D. P., Doak, D. F., Williams, T. M., and Brownell Jr., R. L., eds. Whales, Whaling, and Ocean Ecosystems. University of California Press, Berkeley, CA.

Roman, J. Altman I, Dunphy-Daly MM, et al. 2013. The Marine Mammal Protection Act at 40: status, recovery, and future of US marine mammals. Ann NY Acad Sci; doi:10.1111/nyas.12040.

Roman, J. and McCarthy, J.J. 2010. The whale pump: marine mammals enhance primary productivity in a coastal basin. PLoS ONE. 5(10): e13255.

Roman, J. Estes, J.A. Morissette, L. Smith, C. Costa, D. McCarthy, J. Nation, J.B. Nicol, S. Pershing, A.and Smetacek, V. 2014. Whales as marine ecosystem engineers. Frontiers in Ecology and the Environment. 12(7). 377-385.

Roman, J. Nevins, J. Altabet, M. Koopman, H. and McCarthy, J. 2016. Endangered right whales enhance primary productivity in the Bay of Fundy. PLoS ONE. 11(6): e0156553.

Schneider, V. Pearce, D. What saved the whales? An economic analysis of 20th century whaling. Biodiversity and Conservation 13, 543–562 (2004). https://doi org.libproxy.nau.edu/10.1023/B:BIOC.0000009489.08502.1

Smith LV, McMinn A, Martin A, et al. 2013. Preliminary investigation into the stimulation of phyto- plankton photophysiology and growth by whale faeces. J Exp Mar Biol Ecol 446: 1–9.

Smith, C.R. Glover, A.G. Treude, T. Higgs, N.D. and Amon, D.J. 2015. Whale-fall ecosystems: Recent insights into ecology, paleoecology, and evolution. Annu. Rev. Marine. Sci. 7:571-596.

Willis, J. 2007. Could whales have maintained a high abundance of krill? Evol Ecol Res 9: 651–662.

Uncommon baselines in social justice

Leigh Torres, Assistant Professor, PI of the GEMM Lab, Marine Mammal Institute, Department of Fisheries and Wildlife, Oregon Sea Grant, Oregon State University

Writing a blog post this week that focuses on marine mammals seems inappropriate amidst the larger social justice issues that our country – and our global community – are facing. However, I have been leaning on my scientific background recently to help me understand these events, how we got here, and where we can go.  But first I want to acknowledge and thank the people on the front lines around the world who are giving a voice to this fight for equality. Equality that is deserved, inherent, and just.

There is a concept in ecology, and in particular in fisheries management, termed shifting baselines, which was developed by the brilliant scientist Dr. Daniel Pauly in 1995 (who, by the way, is a person of color but that’s not the point here). Shifting baselines has to do with how humans judge change based on their own experiences and perceptions, and not necessarily on objective data collected over a longer period than a lifetime. Over one generation, knowledge is lost about ‘how the state of the natural world used to be’, so people don’t perceive the change that is actually taking place over time.

This article has a nice description of the shifting baseline theory: …due to short life-spans and faulty memories, humans have a poor conception of how much of the natural world has been degraded by our actions, because our ‘baseline’ shifts with every generation, and sometimes even in an individual. In essence, what we see as pristine nature would be seen by our ancestors as hopelessly degraded, and what we see as degraded our children will view as ‘natural’.

The concept of shifting baselines explains so much about why convincing policy makers to protect natural resources is challenging. People with short-term goals (political election cycles) and short-term memories don’t see the long-term trends of environmental degradation.

This week I have been thinking about how the concept of shifting baselines can also be applied to the social injustice we are grappling with today and for centuries. Yet, rather than shifting baselines, its more akin to uncommon baselines.

In school, we hopefully learn about the realities of slavery, the Civil War, Abraham Lincoln and the Emancipation Proclamation, Fredrick Douglas, Jim Crow laws, the Civil Rights Movement and Martin Luther King, the Civil Rights Act of 1964, the Voting Rights Act of 1965, and more. Often, this information comes to us in an incomplete, white-washed, biased fashion. So, if we are white and privileged in this country, we may pat ourselves on the back for what we’ve been taught is progress; for example, we might be proud of seeing integration in schools, and feel good about regularly using words like diversity and inclusion. But my baseline is very different from a black American’s baseline. Where I see progress relative to an old standard, black Americans continue to suffer from a legacy of slavery, poverty, and discrimination. My baseline cannot just be progress while people of color are still experiencing the same race inequality, police bias, economic injustice and an imbalanced power structure as their grandparents and great grandparents.

Our uncommon baselines are shaped by our previous experiences, which are culturally based, and create different perceptions of where we are in the trajectory of social and economic justice.  When scientists want to adjust for the influence of shifting baselines in ecology, we first need to recognize the influence of shifted baselines and then probe for ‘historical data’ (e.g., whaling records of the actual numbers of whales killed) or speak with those who know what it was like “before” (e.g., traditional ecological knowledge) to help us account for a broader scale of change. Thus, we can use a better baseline. Perhaps in this social justice context, to achieve more common baselines of race equality across cultures, we need more conversations with people of color to share past and present experiences and perceptions.

While these recent events have been heart wrenching to witness, I do feel this period is a critical reality check, forcing those of us who are privileged and powerful to acknowledge our uncommon baselines. I hope to learn by reading and talking honestly with others so we can all work toward a common baseline of equality and justice for all.

One last thought:

Vote.

Vote for the change you want to see.

Voting is powerful.

Vote.

References:

Pauly, Daniel. “Anecdotes and the shifting baseline syndrome of fisheries.” Trends in ecology & evolution 10, no. 10 (1995): 430. https://doi.org/10.1016/S0169-5347(00)89171-5