Making the call: deciphering whale calls in the 40 Hz soundscape off the Oregon Coast.

Imogen Lucciano, Graduate student, OSU Department of Fisheries, Wildlife, & Conservation Sciences, Geospatial Ecology of Marine Megafauna Lab. 

Fin whale dorsal fin. Photo credit: https://www.worldwildlife.org/photos/fin-whale–8

Work in the GEMM lab is booming in all different directions of whale research, and so taking turns writing for the GEMM lab blog gives all of its members an opportunity to highlight topics that are specific and current to us individually. I am two-thirds of the way done with my MSc thesis program, and I’ve recently begun speaking publicly about my work on the HALO project and fin whale acoustic detection off the Oregon coast. In this blog I’ll highlight a two-part question that I am often asked, “Can you see more than fin whales in the data, and how can you tell the species apart when you are looking at it?”. These questions provide great ponderance and are very significant to what I am trying to accomplish. The answer is that I absolutely can see other whales when I am looking through the acoustic data and in fact I have to be quite meticulous in my efforts to tease them apart at times. Let me explain:

The acoustic data set I am working with tells an important story of the waters off the Oregon coast and will illuminate researchers (and the public) on the presence of all detectable vocal whales and dolphins in the area over the past year, from October 2021 to January of 2023. The advanced technological recording systems, called Rockhoppers, that HALO deploys off the coast of Newport, provide us with continuous sound files for the entire time that they are deployed. (I previously wrote a short blog on Rockhoppers, for those interested in more information.) Then, we analysts (graduate students) on the project work to establish the acoustic presence of our target species within those files.

Based on what experts in the field of cetacean bioacoustics currently understand about fin whales, they produce sounds at a very low frequency for both socializing (presumably their 20 Hz pulse call) and for foraging (presumably their 40 Hz downsweep call) (Sirovic et al. 2013; Romagosa et al. 2021). During my efforts to determine the presence of fin whales, it is relatively easy to identify the 20 Hz pulse call, since this call has been well documented in the literature and is the only cetacean call described that occurs in its frequency range. I look for these calls in spectrogram representations of the acoustic data, which allow me to see the selected frequency range over our data collection period (time; Figure 1).

Figure 1. The two black vertical lines shown in this spectrogram are two 20 Hz fin whale pulse calls I identified in the HALO acoustic data using Raven Pro. Nearly all of the fin whale calls I’ve identified in the HALO data occur in pulses ranging from ~17 Hz to 27 Hz.   

Where this process becomes complicated for me is when I look for the 40 Hz fin whale downsweep call, which is known to occur between ~ 75 Hz – 30 Hz (Wiggins & Hildebrand 2020; Romagosa et al. 2021). This call can vary slightly within this frequency range. Interpretation of this call reaches even higher ambiguity when there are blue whales and sei whales acoustically detected in the same time frame in the same area. The acoustic repertoire of both blue and sei whale calls fall in the same frequency range: blue whales producing what is known as “D calls” and sei whales are known to make low-frequency downsweep calls (Figure 2; Sirovic et al. 2013; Romagosa et al. 2020).

Figure 2.  From left to right: Fin whale 40 Hz downsweep call (Sirovic et al. 2013); Blue whale D call, Sei whale downsweep call. (Romagosa et al. 2020)

At first glance, the vocalizations from these three whales can be easily confused, and so I am looking for finer details to help tease out the fin whale downsweeps. As shown in Figure 2, there is a difference in the behavior of these calls, with the sei whale call being a shorter call by a matter of 2-3 seconds. The sei whale downsweep calls have not been frequently described in the literature, however those few publications report these calls occurring over 1.4-1.6 seconds (Baumgartner et al. 2008; Espanol-Jimenez et al. 2019) and in each published spectrogram, I have observed this similar boomerang-type looking behavior in the call. Blue whale D calls, on the other hand, are calls produced as social calls while foraging (Szesciorka et al 2020) and known to occur over ~1.8 seconds (Oleson et al. 2007).  

Fin whale 40 Hz calls have a duration of about one second and are not known to be produced in a regular sequence (Sirovic et al. 2013), thus I am teasing them out carefully from what can sometimes appear like a diversly grouped choir of low frequency whale song among the HALO data (Figures 3 & 4).  

Figure 3. Left hand figure: Red vertical lines occurring from 39 Hz to 22 Hz in the spectrogram are Fin whale 40 Hz call I have identified in the HALO data. Figure 4. Right hand figure shows many vertical lines in the 80 Hz to 20 Hz range that could be interpreted at first glance as different whale species vocalizations, including fin, blue and sei whales.

Although there are some known seasonal patterns of each of these aforementioned whale calls (Sirovic et al. 2013; Szesciorka et al. 2020), many data gaps remain of the temporal patterns of the 40 Hz and 20 Hz calls (i.e., when the calls occur) off the Oregon coast. Therefore, I cannot assume that I will only see 40 Hz calls in any time period. I need to assess the behavior of the calls I detect and tease out the calls I know surely are fin whale 40 Hz downsweeps in each file of the entire acoustic dataset.

Afterthought: The HALO project is new and has only just collected its first year of acoustic data, however the project is intent to continue deploying and collecting Rockhoppers off the Oregon coast for years to come. As this acoustic data set continues to grow it will be used by other researchers, and I (among the first to process and analyze it) feel some pressure to get things done right. As I process these data I will work hard to make the best-informed call identifying fin whales in the 40 Hz range. This focus and feeling of responsibility reassure me that I am in the appropriate career field. I really care about how these data are processed, where the research will go from here, and how it influences human activities in this critical whale habitat.

Photo credit: https://nextlevelsailing.com/how-big-is-a-whale-list-of-whales-by-size/

Did you enjoy this blog? Want to learn more about marine life, research, and conservation? Subscribe to our blog and get a weekly message when we post a new blog. Just add your name and email into the subscribe box below.

Loading

References

Baumgartner, M., Van Parijs, S., Wenzel, F., et al. 2008. Low frequency vocalizations attributed to sei whales. Acoustical Society of America, 124 (2): 1339-1349. https://www.whoi.edu/cms/files/JAS001339_59390.pdf.

Espanol-Jimenez, S., Bahamonde, P., Chiang, G., Haussermann, V. 2019. Discovering sounds in

Oleson, E., Calambokidis, J., Burgess, W,. et al. 2007. Behavioral context of call production by eastern North Pacific blue whales. Marine Ecology Progress Series, 330 : 269-284. https://www.int-res.com/articles/meps_oa/m330p269.pdf.

Romagosa, M., Baumgartner, M., Cascao, I., et al. 2020. Baleen whale acoustic presence and behavior at a Mid-Atlantic migratory habitat, the Azores Archipelago. Scientific Reports, 10. https://www.researchgate.net/publication/339952595_Baleen_whale_acoustic_presence_and_behaviour_at_a_Mid-Atlantic_migratory_habitat_the_Azores_Archipelago.

Romagosa, M., Perez-Jorge, S., Cascao, I., et al. 2021. Food talk: 40-Hz fin whale calls are associate with prey biomass. Proceedings of the Royal Society B: Biological Sciences, 288 (1954): 20211156. https://pubmed.ncbi.nlm.nih.gov/34229495/.

Sirovic, A., Williams, L., Kerosky, S., Wiggins, S., Hildebrand, J. 2013. Temporal separation of two fin whale call types across the eastern North Pacific. Marine Biology, 160: 47-57.

Szesciorka, A., Ballance, L., Sirovic, A., et al. 2020. Timing is everything: drivers of interannual variability in blue whale migration. Scientific Reports, 10 (7710). https://www.nature.com/articles/s41598-020-64855-y. Wiggins, S. & Hildebrand, J. 2020. Fin whale 40 Hz behavior studied with an acoustic tracking array. Marine Mammal Science, 36 (3). https://www.researchgate.net/publication/339575220_Fin_whale_40-Hz_calling_behavior_studied_with_an_acoustic_tracking_array.
Spreadsheets, ArcGIS, and Programming! Oh My!

By Morgan O’Rourke-Liggett, Master’s Student, Oregon State University, Department of Fisheries, Wildlife, and Conservation Sciences, Geospatial Ecology of Marine Megafauna Lab

Avid readers of the GEMM Lab blog and other scientists are familiar with the incredible amounts of data collected in the field and the informative figures displayed in our publications and posters. Some of the more time-consuming and tedious work hardly gets talked about because it’s the in-between stage of science and other fields. For this blog, I am highlighting some of the behind-the-scenes work that is the subject of my capstone project within the GRANITE project.

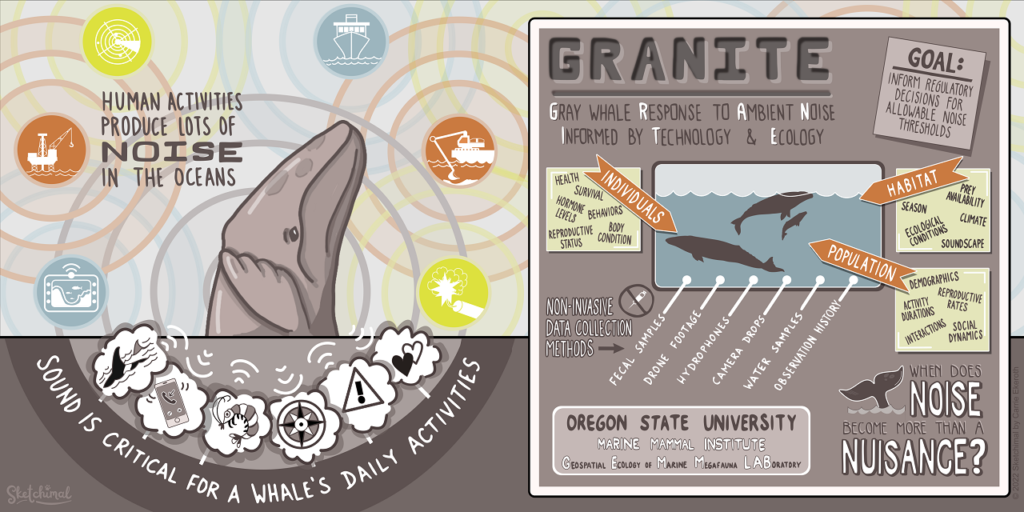
For those unfamiliar with the GRANITE project, this multifaceted and non-invasive research project evaluates how gray whales respond to chronic ambient and acute noise to inform regulatory decisions on noise thresholds (Figure 1). This project generates considerable data, often stored in separate Excel files. While this doesn’t immediately cause an issue, ongoing research projects like GRANITE and other long-term monitoring programs often need to refer to this data. Still, when scattered into separate long Excel files, it can make certain forms of analysis difficult and time-consuming. It requires considerable attention to detail, persistence, and acceptance of monotony. Today’s blog will dive into the not-so-glamorous side of science…data management and standardization!

Figure 1. Infographic for the GRANITE project. Credit: Carrie Ekeroth

Of the plethora of data collected from the GRANITE project, I work with the GPS trackline data from the R/V Ruby, environmental data recorded on the boat, gray whale sightings data, and survey summaries for each field day. These come to me as individual yearly spreadsheets, ranging from thirty entries to several thousand. The first goal with this data is to create a standardized survey effort conditions table. The second goal is to determine the survey distance from the trackline, using the visibility for each segment, and calculate the actual area surveyed for the segment and day. This blog doesn’t go into how the area is calculated. Still, all these steps are the foundation for finding that information so the survey area can be calculated.

The first step requires a quick run-through of the sighting data to ensure all dates are within the designated survey area by examining the sighting code. After the date is a three-letter code representing a different starting location for the survey, such as npo for Newport and dep for Depoe Bay. If any code doesn’t match the designated codes for the survey extent, those are hidden, so they are not used in the new table. From there, filling in the table begins (Figure 2).

Figure 2. A blank survey effort conditions table with each category listed at the top in bold.

Segments for each survey day were determined based on when the trackline data changed from transit to the sighting code (i.e., 190829_1 for August 29th, 2019, sighting 1). Transit indicated the research vessel was traveling along the coast, and crew members were surveying the area for whales. Each survey day’s GPS trackline and segment information were copied and saved into separate Excel workbook files. A specific R code would convert those files into NAD 1983 UTM Zone 10N northing and easting coordinates.

Those segments are uploaded into an ArcGIS database and mapped using the same UTM projection. The northing and easting points are imported into ArcGIS Pro as XY tables. Using various geoprocessing and editing tools, each segmented trackline for the day is created, and each line is split wherever there was trackline overlap or U shape in the trackline that causes the observation area to overlap. This splitting ensures the visibility buffer accounts for the overlap (Figure 3).

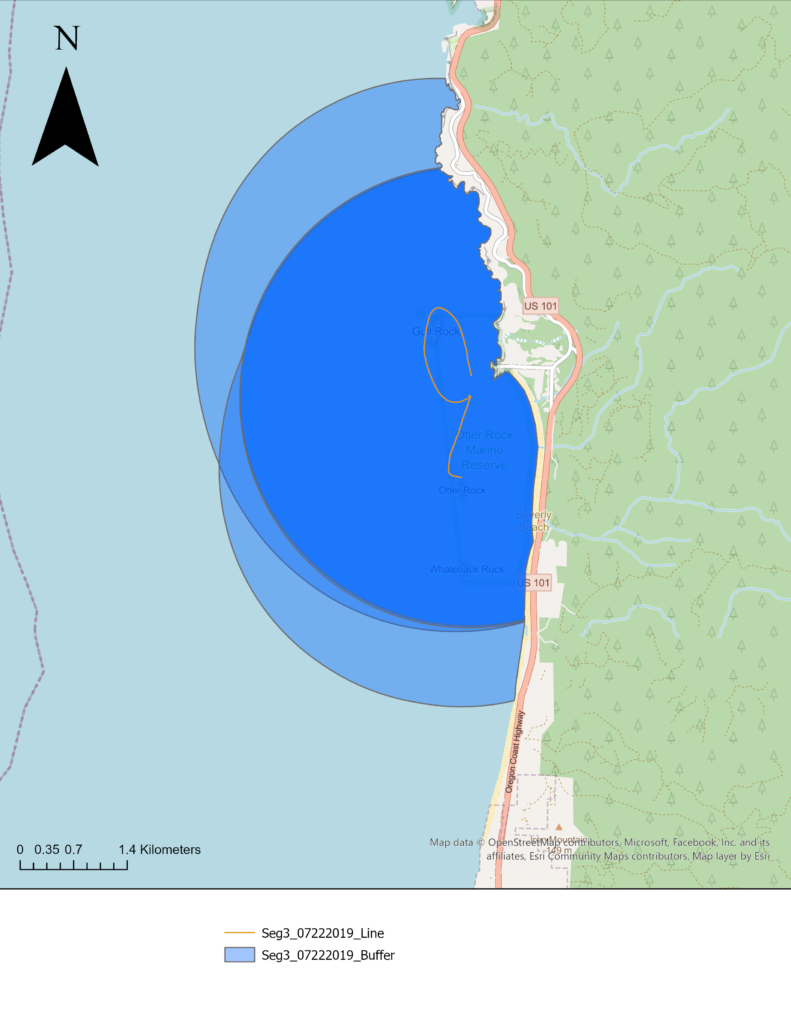
Figure 3. Segment 3 from 7/22/2019 with the visibility of 3 km portrayed as buffers. There are more than one because the trackline was split to account for the overlapping of the survey area. This approach accounts for the fact that this area where all three buffers overlap was surveyed 3 times.

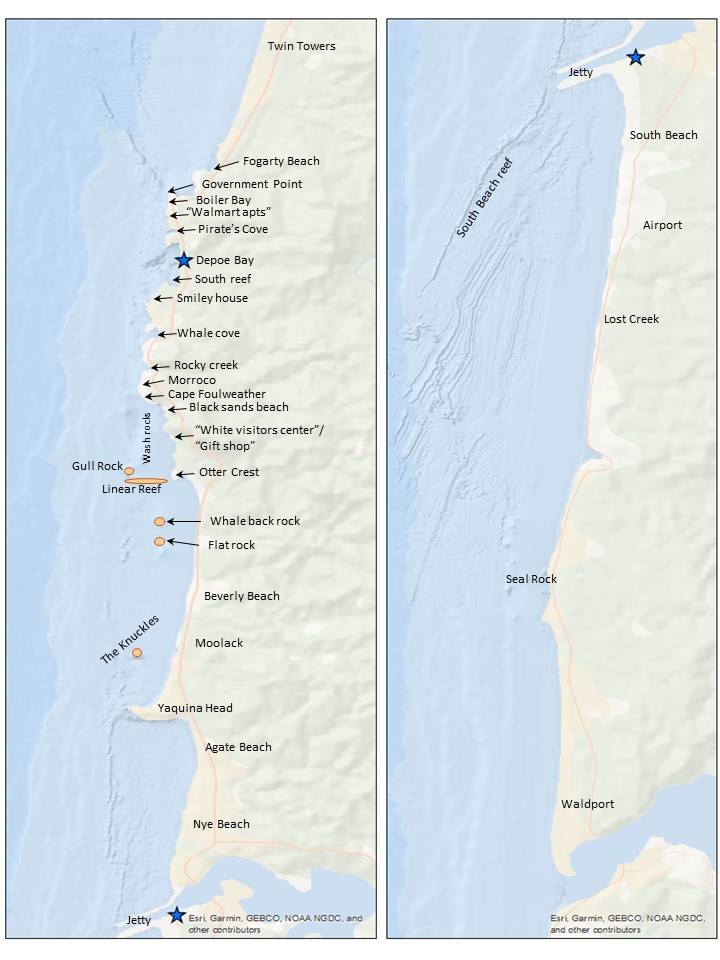
Once the segment lines are created in ArcGIS, the survey area map (Figure 4) is used alongside the ArcGIS display to determine the start and end locations. An essential part of the standardization process is using the annotated locations in Figure 4 instead of the names on the basemap for the location start and endpoints. This consistency with the survey area map is both for tracking the locations through time and for the crew on the research vessel to recognize the locations. The step assists with interpreting the survey notes for conditions at the different segments. The time starts and ends, and the latitude and longitude start and end are taken from the trackline data.

Figure 4. Map of the survey area with annotated locations (Created by L. Torres, GEMM Lab)

The sighting data includes the number of whales sighted, Beaufort Sea State, and swell height for the locations where whales were spotted. The environmental data from the sighting data is used as a guide when filling in the rest of the values along the trackline. When data, such as wind speed, swell height, or survey condition, is not explicitly given, matrices have been developed in collaboration with Dr. Leigh Torres to fill in the gaps in the data. These matrices and protocols for filling in the final conditions log are important tools for standardizing the environmental and condition data.

The final product for the survey conditions table is the output of all the code and matrices (Figure 5). The creation of this table will allow for accurate calculation of survey effort on each day, month, and year of the GRANITE project. This effort data is critical to evaluate trends in whale distribution, habitat use, and exposure to disturbances or threats.

Figure 5. A snippet of the completed 2019 season effort condition log.

The process of completing the table can be a very monotonous task, and there are several chances for the data to get misplaced or missed entirely. Attention to detail is a critical aspect of this project. Standardizing the GRANITE data is essential because it allows for consistency over the years and across platforms. In describing this aspect of my project, I mentioned three different computer programs using the same data. This behind-the-scenes work of creating and maintaining data standardization is critical for all projects, especially long-term research such as the GRANITE project.

Did you enjoy this blog? Want to learn more about marine life, research, and conservation? Subscribe to our blog and get a weekly message when we post a new blog. Just add your name and email into the subscribe box below.

Loading

So big, but so small: why the smallest of the largest whales are not smaller

Dr. KC Bierlich, Postdoctoral Scholar, OSU Department of Fisheries, Wildlife, & Conservation Sciences, Geospatial Ecology of Marine Megafauna (GEMM) Lab

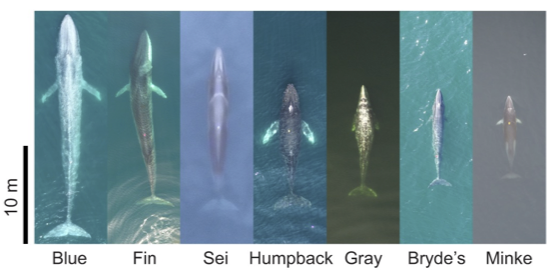
Baleen whales are known for their gigantism and encompass a wide range in body sizes extending from blue whales that are the largest animals to live on earth (max length ~30 m) to minke whales (max length ~10 m) that are the smallest of baleen whales (Fig. 1). While all baleen whales are filter feeders, a group called the rorquals use a feeding strategy known as lunge feeding (or intermittent engulfment filtration), which involves engulfing large volumes of prey-laden water at high speeds and then filtering the water out of their mouth using their baleen as a “sieve”. There is positive allometry associated with this feeding technique and body size, meaning that as whales are larger, this feeding strategy becomes more efficient due to increased engulfment of water volume per each lunge feeding event. In other words, a bigger body size equates to a much larger mouthful of food. For example, a minke whale (body length ~7-10 m) will engulf water volume equivalent to ~42% of its body mass, while a blue whale (~21-24 m) engulfs ~135%. Thus, filter feeding enables gigantism through efficient exploitation of large, dense patches of prey. An interesting question then arises: what is the minimum body size at which filter feeding is still efficient? Or in other words, why are the smallest of the baleen whales, minke whales, not smaller? For this blog, I will highlight a study published today in Nature Ecology and Evolution titled “Minke whale feeding rate limitations suggest constraints on the minimum body size for engulfment filtration feeding” led by friend and collaborator of the GEMM Lab Dr. Dave Cade and included myself and other collaborators as co-authors from Stanford University, UC Santa Cruz, Cascadia Research Collective, Duke University, and University of Queensland.

Figure 1. Aerial imagery collected using drones of several baleen whales of various sizes. Each species shown is considered a rorqual whale, except for gray whales. Figure from Segre et al. (2022)

The largest animals of today are marine filter feeders, such as whale sharks, manta rays, and baleen whales, which all share parallel evolutionary histories in which their large body sizes and filter-feeding morphologies are derived from smaller-bodied ancestors that targeted single prey items. Changes in ocean productivity increased the concentrations of smaller prey in the oceans around 5 million years ago, enabling filter feeding as an efficient feeding strategy through capture of abundant aggregations of prey by filtering large volumes of water. It is interesting to note, that within these filter feeding lineages of animals, there are groups of animals that are single-prey foragers with smaller body sizes. For example, the whale shark is the only filter feeder amongst the carpet sharks and the manta ray is much larger than other rays that feed on single prey items. Amongst cetaceans, the smallest single-prey foragers, dolphins (~2-3 m) and porpoises (~1.4-1.9 m), are much smaller than the smallest of the filter feeding cetaceans, minke whales (~7-10 m). These common differences in body sizes and feeding strategies within lineages suggest that there may be minimum body size requirements for this filter feeding strategy to be efficient.

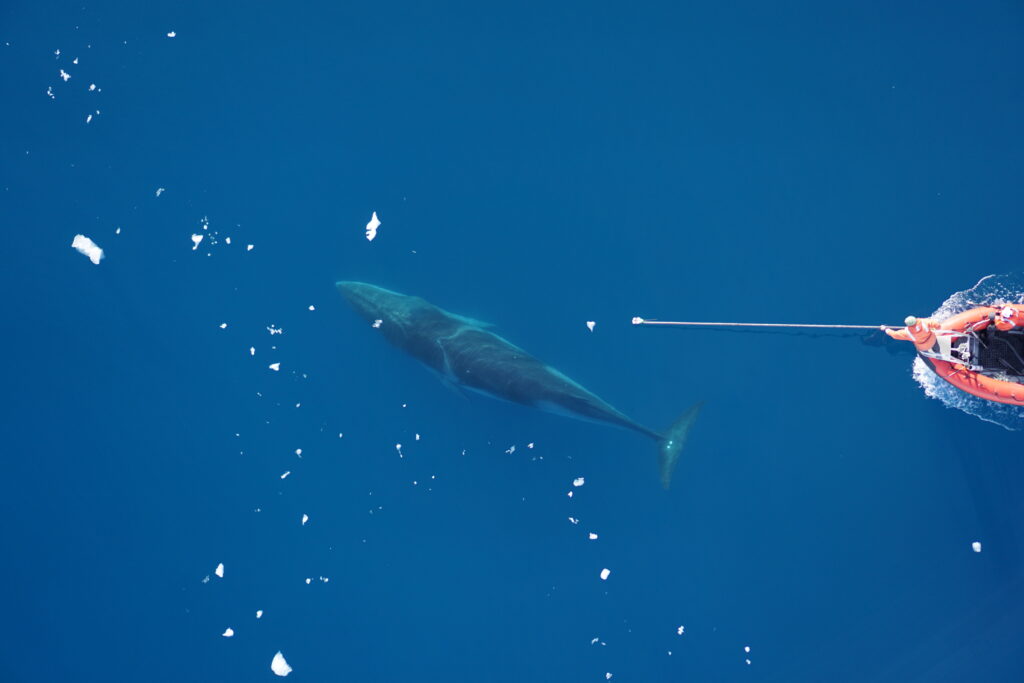
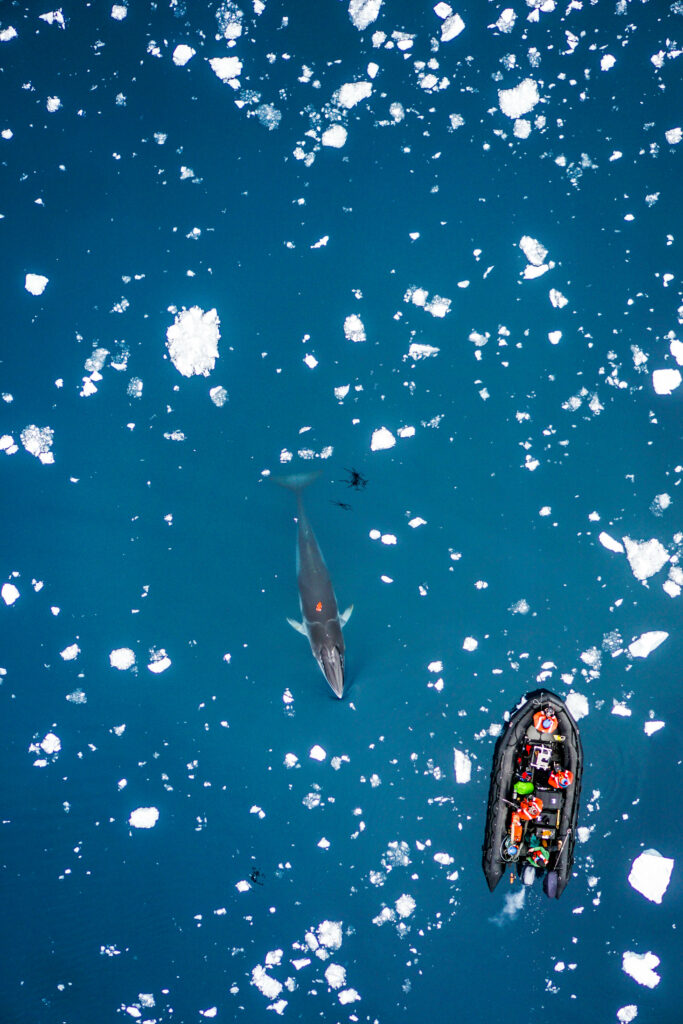
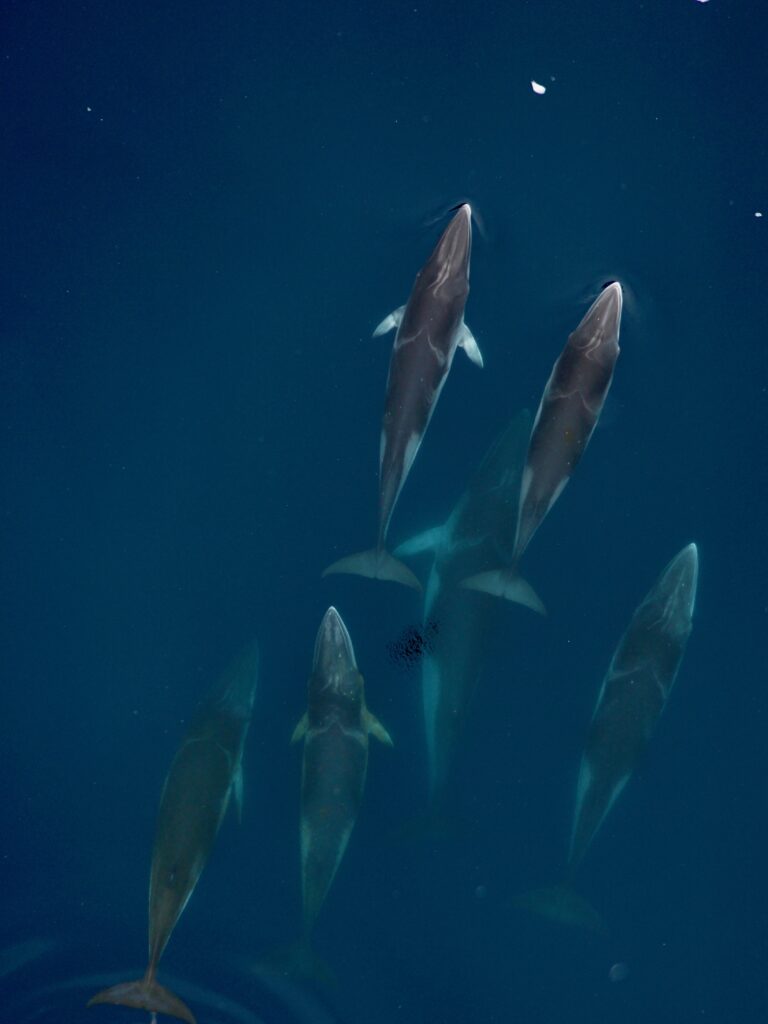
To investigate the limits on minimum body size for filter feeding, our study explored the foraging behavior of Antarctic minke whales, the smallest of the rorqual baleen whales, along the Western Antarctic Peninsula. Our team tagged a total of 23 individuals using non-invasive suction cup tags, like the ones we use for our tagging component in the GEMM Lab’s GRANITE project (see this blog for more details). One of my roles on the project was to obtain aerial imagery of the minke whales using drones to obtain body length measurements (sound familiar?) (Figs. 2-4). Flying drones in Antarctica over minke whales was an amazing experience. The minke whales were often found deep within the bays amongst ice floes and brash ice where they can be very tricky to spot, as they’ll often surface and then quickly disappear, hence their nickname “sneaky minkes”. They also appear “playful” and “athletic” as they are incredibly quick and maneuverable, doing barrel rolls and quick bank turns while they swim. Check out my past blog to read more on accounts of flying over these amazing whales.

Figure 2. Drone image of our team about to place a noninvasive suction cup biologging tag on an Antarctic minke whale. Photo credit: Duke University Marine Robotics and Remote Sensing Lab.
Figure 3. A drone image of a newly tagged and curious Antarctic minke whale approaching our research team. Photo credit: Duke University Marine Robotics and Remote Sensing Lab.
Figure 4. A drone image of a group of Antarctic minke whales swimming through the icy waters along the Antarctic Peninsula. Photo credit: Duke University Marine Robotics and Remote Sensing Lab.

In total, our team collected 437 hours of tag data consisting of day- and night-time foraging behaviors. While the proportion of time spent foraging and the number of lunges per dive (~3-4) was similar between day- and night-time foraging, daytime foraging was much deeper (~72 m) compared to nighttime foraging (~28 m) due to vertical migration of Antarctic krill, their main food source. Overall, nighttime foraging was much more intense than daytime foraging, with an average of 165 lunges per hour during the night compared to 53 lunges per hour during the day. These shallower nighttime dives enabled quicker surface sequences for replenishing oxygen reserves to then return to foraging, whereas the deeper dives during the day required longer surface recovery times before beginning another foraging dive. Thus, nighttime dives are a more efficient and critical component of minke whale foraging.

When it comes to body size, there was no relationship between dive depth and dive duration with body length, except for daytime deep dives, where longer minke whales dove for longer periods than smaller whales. These longer dive times also require longer surface times to replenish oxygen reserves. Longer minke whales can gulp larger amounts of food and thus need longer filtration times to process water from each engulfment. For example, a 9 m minke whale will take 50% longer to filter water through its baleen compared to a 5 m minke whale. In turn, smaller minke whales would need to feed more frequently than larger minke whales in order to maintain efficient foraging. This decreasing efficiency with smaller body size shines light on a broader trend for filter feeders that we refer to in our study as the minimum-size constraint (MSC) hypothesis: “while the maximum size of a filter-feeding body plan will be restricted by physical properties, the minimum size is restricted by the energetic efficiency of filter feeding and the time required to extract sufficient particles from the water” (Cade et al. 2023). When we examined the scaling of maximum feeding rates of minke whales, we found evidence of a minimum size constraint on efficiency at lengths around 5 m. Interestingly, the weaning length of minke whales is reported to be 4.5 – 5.5 m. Before weaning, newborn/yearling minke whales that are smaller than 4.5 ­– 5.5 m have a different foraging strategy where they are dependent on maternal milk. Thus, it is likely that the body size at weaning is influenced by the minimum size at which this specialized foraging technique of lunge feeding becomes efficient.

This study helps inform the evolutionary pathway for filter feeding whales and suggests that efficient filter feeding and gigantism likely co-evolved within the last 5 million years when ocean conditions changed to support larger prey patches suitable for lunge feeding. It is interesting to think about the MSC hypothesis for other baleen whale species that employ alternative filter feeding techniques, such as gray whales that generally use a form of filter feeding called suction feeding. Gray whales are estimated to have a birth length of ~4.6 m (Agbayani et al., 2020), and the body length of newly weaned calves that we have observed along the Oregon Coast from drone imagery seem to be ~8 – 9 m. Perhaps this is the minimum size of when suction feeding becomes efficient for a gray whale? This is something the GEMM Lab hopes to further explore as we continue to collect foraging data from suction cup tags and behavior and body size measurements from drone imagery.

References

Agbayani, S., Fortune, S. M., & Trites, A. W. (2020). Growth and development of North Pacific gray whales (Eschrichtius robustus). Journal of Mammalogy101(3), 742-754.

Cade, D.E., Kahane-Rapport, S.R., Gough, W.T., Bierlich, K.C., Linksy, J.M.J., Johnston, D.W., Goldbogen, J.A., Friedlaender, A.S. (2023). Ultra-high feeding rates of Antarctic minke whales imply a lower limit for body size in engulfment filtration feeders. Nature Ecology and Evolution. https://www.nature.com/articles/s41559-023-01993-2  

Paolo S. Segre, William T. Gough, Edward A. Roualdes, David E. Cade, Max F. Czapanskiy, James Fahlbusch, Shirel R. Kahane-Rapport, William K. Oestreich, Lars Bejder, K. C. Bierlich, Julia A. Burrows, John Calambokidis, Ellen M. Chenoweth, Jacopo di Clemente, John W. Durban, Holly Fearnbach, Frank E. Fish, Ari S. Friedlaender, Peter Hegelund, David W. Johnston, Douglas P. Nowacek, Machiel G. Oudejans, Gwenith S. Penry, Jean Potvin, Malene Simon, Andrew Stanworth, Janice M. Straley, Andrew Szabo, Simone K. A. Videsen, Fleur Visser, Caroline R. Weir, David N. Wiley, Jeremy A. Goldbogen; Scaling of maneuvering performance in baleen whales: larger whales outperform expectations. J Exp Biol 1 March 2022; 225 (5): jeb243224. doi: https://doi.org/10.1242/jeb.243224

Learning by teaching

By: Kate Colson, MSc Student, University of British Columbia, Institute for the Oceans and Fisheries, Marine Mammal Research Unit

One of the most frequent questions graduate students get asked (besides when you are going to graduate) is what their plans are after university. For me, the answer has always adamantly been continuing to do research, most likely as a government researcher because I don’t want teaching commitments to take away from my ability to conduct research.

However, one of the most fulfilling parts of my degree at University of British Columbia has actually been teaching four terms of a 100-level undergraduate science course focused on developing first-year students’ critical thinking, data interpretation, and science communication skills. My role in the course has been facilitating active learning activities that exercise these skills and reviewing material the students go over in their pre-class work. Through this course, I have experienced the teaching styles of six different professors and practiced my own teaching. As with any skill, there is always room for improvement, so when I had a chance to read a book titled How Learning Works: Seven Research-Based Principles for Smart Teaching (Ambrose et al. 2010), I took it as an opportunity to further refine my teaching and explore why some practices are more effective than others.

In the book, Ambrose et al. present principles of learning, the research surrounding these principles and examples for incorporating them into a university level course. Some of the principles gave me ideas for strategies to incorporate into my teaching to benefit my students. These described how prior knowledge impacts student learning and how to use goal-oriented practice and give feedback relative to target criteria that the students can apply to the next practice task. For example, I learned to be more conscious about how I explain and clarify course material to make connections with what the students have learned previously, so they can draw on that prior knowledge. Other principles presented by Ambrose et al. were more complex and offered a chance for greater reflection.

Beyond presenting strategies for improving teaching, the book also presented research that supported what I had learned firsthand through teaching. These principles related to the factors that motivate students to learn and why the course climate matters for learning. I have seen how student motivation is impacted by the classroom climate and culture put forth by the teaching team. Perhaps the most frustrating experiences I have had teaching were when one member of the teaching team does not see the importance of fostering a supportive course environment.

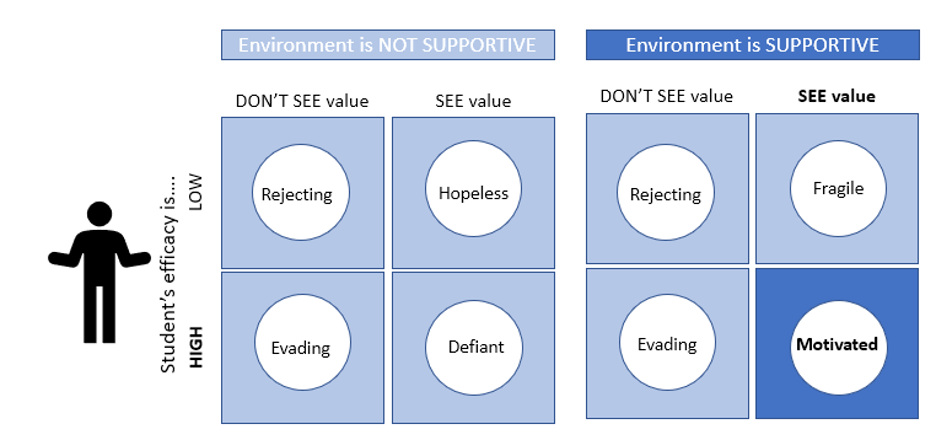
For this reason, my favorite assignments have been the Thrive Contract and the Group Contract. Each term, the Thrive Contract is the first major class activity, and the Group Contract is the first group assignment. These assignments serve as a means for everyone to co-create guidelines and expectations and establish a positive classroom culture for the rest of the term. After an exceptionally poor classroom experience my first time teaching, I have highlighted the importance of the Thrive Contract in all subsequent terms. Now, I realize the significance I lent this assignment is supported by the research on the importance for a supportive environment to maximize student motivation and encourage classroom engagement (Figure 1).

Another powerful lesson I have learned through teaching is the importance of clarifying the purpose of an activity to the students. Highlighting a task’s objective is also supported by research to ensure that students ascribe value to the assigned work, increasing their motivation (Figure 1).  In my teaching, I have noticed a trend of lower student participation and poorer performance on assignments when a professor does not emphasize the importance of the task. Reviewing the research that shows the value of a supportive course climate has further strengthened my belief in the importance of ensuring that students understand why their teaching team assigns each activity.

Figure 1. How environment, student efficacy, and value interact to impact motivation. The above figure shows that motivation is optimized when students see the value in a goal, believe they have the skills to achieve the goal, and are undertaking the goal in a supportive class environment (the bright blue box in the bottom right corner). If this situation were to occur in an unsupportive class environment, defiant behaviour (e.g. “I’ll prove you wrong” attitude) is likely to occur in response to the lack of support, as the student sees the value in the goal and believes in their ability to achieve the goal. Rejecting behaviour (e.g., disengagement) occurs when the student does not associate value to a task and does not believe in their ability to complete the goals regardless of the environment.  Evading behaviour (e.g., lack of attention or minimal effort) results when students are confident in their ability to complete a task, but do not see the goal as meaningful in both supportive and unsupportive environment. When a student sees the importance of the goal but are not confident in their ability to complete it, they become hopeless (e.g., have no expectation of success and act helpless) when in an unsupportive environment and fragile (e.g., feign understanding, deny difficulty, or make excuses for poor performance) in a supportive environment.  Diagram adapted from Ambrose et al. (2010) Figure 3.2 incorporating the works of Hansen (1989) & Ford (1992).

Potentially my favorite part about the structure of Ambrose’s book was that it offered me a chance to reflect not only on teaching, but also on my own learning and cognitive growth since I started my master’s degree. Graduate students are often in a unique position in which we are both students and teachers depending on the context of our surroundings. The ability to zoom out and realize how far I have come in not only teaching others, but also in teaching myself, has been humbling. My reflection on my own learning and growth has been driven by learning about how organizing knowledge affects learning, how mastery is developed and how students become self-directed learners.

One of the main differences between novices and experts in how they organize their knowledge is the depth of that knowledge and the connections made between different pieces of information. Research has shown that experts hold more connections between concepts, which allows for faster and easier retrieval of information that translates into ease in applying skills to different tasks (Bradshaw & Anderson, 1982; Reder & Anderson, 1980; Smith, Adams, & Schorr, 1978). Currently in my degree, I am experiencing this ease when it comes to coding my analysis and connecting my research to the broader implications for the field. By making these deeper connections across various contexts, I am building a more complex knowledge structure, thus progressing towards holding a more expert organization of knowledge.

In the stages of mastery concept proposed by Sprague and Stewart (2000), learners progress from unconscious incompetence where the student doesn’t know what they don’t know, to conscious incompetence where they have become aware of what they need to know (Figure 2). This was where I was when I started my master’s — I knew what objectives I wanted to achieve with my research, but I needed to learn the skills necessary for me to be able to collect the data and analyze it to answer my research questions. The next stage of mastery is conscious competence, in which the ability of the learner to function in their domain has greatly increased, but practicing the necessary skills still requires deliberate thinking and conscious actions (Figure 2). This is the level I feel I have progressed to — I am much more comfortable performing the necessary tasks related to my research and talking about how my work fills existing knowledge gaps in the field. However, it still helps to talk out my proposed plans with true masters in the field. The final stage of mastery, unconscious competence, is where the learner has reached a point where they can practice the skills of their field automatically and instinctively such that they are no longer aware of how they enact their knowledge (Figure 2).

Figure 2. Stages of mastery showing how the learner consciousness waxes and then wanes as competence is developed. Unconscious states refer to those where the learner is not aware of what they are doing or what they know, whereas conscious states have awareness of thoughts and actions. Competence refers to the ability of the learner to perform tasks specific to the field they are trying to master. Diagram adapted from Ambrose et al. (2010) Figure 4.2 incorporating the works of Sprague & Stewart (2000).

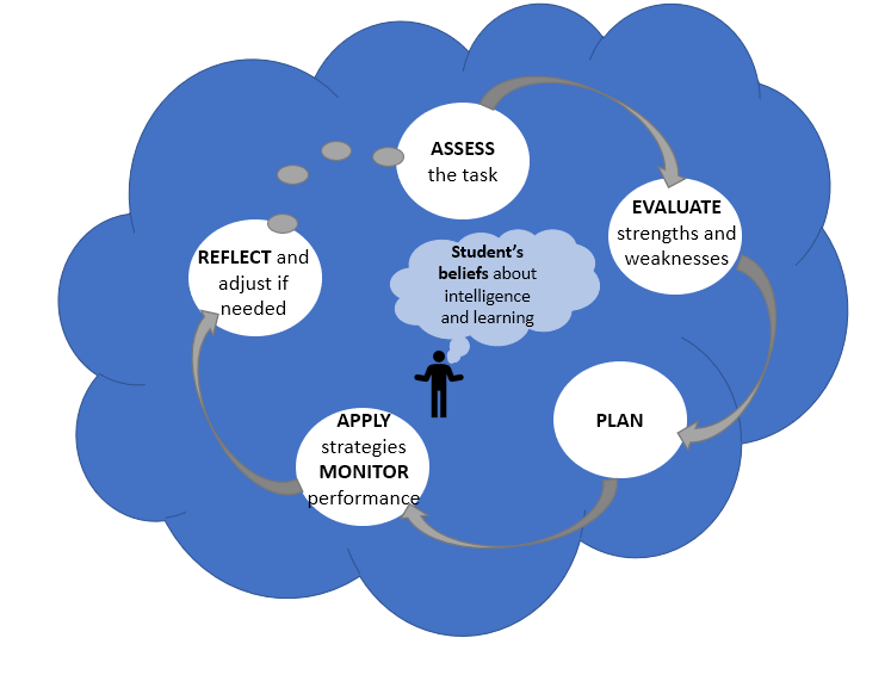
In line with my progression to higher levels of mastery has come the development of metacognitive skills that have helped me become a better self-directed learner. Metacognition is the process of learning how to learn, requiring the learner to monitor and control their learning through various processes (Figure 3). The most exciting part of my metacognitive growth I have noticed is the greater independence I have in my learning. I am much better at assessing what is needed to complete specific tasks and planning my particular approach to successfully achieve that goal (e.g., the construction of a Hidden Markov model from my last blog). By becoming more aware of my own strengths and weaknesses as a learner, I am better able to prepare and give myself the support needed for completing certain tasks (e.g., reaching out to experts to help with my model construction as I knew this was an area of weakness for me). By becoming more aware of how I am monitoring and controlling my learning, I know I am setting myself up for success as a lifelong learner.

Figure 3. Metacognition requires learner to monitor and control their learning through various processes. These processes involve the learner assessing the necessary skills needed for a task, evaluating their strengths and weaknesses with regards to the assigned task, and planning a way to approach the task. Once a plan has been made, the learner then must apply the strategies involved from the plan and monitor how those strategies are working to accomplish the assigned task. The learner must then be able to decide if the planned approach and applied strategies are effectively accomplishing the assigned task and adjust as needed with a re-assessment of the task that begins the processing cycle over again. Underlying each of these metacognitive processes are the learner’s belief in their own abilities and their perceptions of their intelligence. For example, students who believe their intelligence cannot be improved and do not have a strong sense of efficacy will be less likely to expend effort in metacognitive processes as they believe the extra effort will not influence the results. This contrasts with students who believe their intelligence will increase with skills development and have a strong belief in their abilities, as these learners will see the value in putting in the effort of trying multiple plans and adjusting strategies.  Diagram adapted from Ambrose et al. (2010) Figure 7.1 incorporating the cycle of adaptive learning proposed by Zimmerman (2001).
Loading

References:

Ambrose, S. A., Bridges, M. W., DiPietro, M., Lovett, M. C., & Norman, M. K. (2010). How learning works: Seven research-based principles for smart teaching (1st ed.). San Francisco, CA: Jossey-Bass. 

Bradshaw, G. L., & Anderson, J. R. (1982). Elaborative encoding as an explanation of levels of processing. Journal of Verbal Learning and Verbal behaviours, 21,165-174.

Ford, M. E. (1992). Motivating humans: Goals, emotions and personal agency beliefs. Newbury Park, CA: Sage Publications, Inc.

Hansen, D. (1989). Lesson evading and dissembling: Ego strategies in the classroom. American Journal of Education, 97, 184-208.

Reder, L. M., & Anderson, J. R. (1980). A partial resolution of the paradox of interference: The role of integrating knowledge.  Cognitive Psychology, 12,  447-472.

Smith, E. E., Adams, N., & Schorr, D. (1978). Fact retrieval and the paradox of interference. Cognitive Psychology, 10, 438-464.

Sprague, J., & Stewart, D. (2000). The speaker’s handbook. Fort Worth, TX: Harcourt College Publishers.

Zimmerman, B. J. (2001). Theories of self-regulated learning and academic achievement: An overview and analysis. In B. J. Zimmerman & D. H. Schunk (Eds.), Self-regulated learning and academic achievement (2nd ed., pp. 1-38). Hillsdale, NJ: Erlbaum.