By Rachel Kaplan, PhD student, Oregon State University College of Earth, Ocean, and Atmospheric Sciences and Department of Fisheries and Wildlife, Geospatial Ecology of Marine Megafauna Lab
What are the most unexpected things you’ve done on Zoom in the last year? Since the pandemic dramatically changed all our lives in 2020, I think we’ve all been surprised by the diversity of things we’ve done remotely. I’ve baked bagels with a friend in Finland, done oceanography labs from my kitchen, had dance parties with people across the country, and conducted an award ceremony for my family’s Thanksgiving scavenger hunt – all on Zoom. Over the last several months, I’ve also mentored an Undergraduate Research, Scholarship, & the Arts (URSA) Engage student, named Amanda. Although we haven’t met in person yet, we’ve been connecting over Zoom since October.
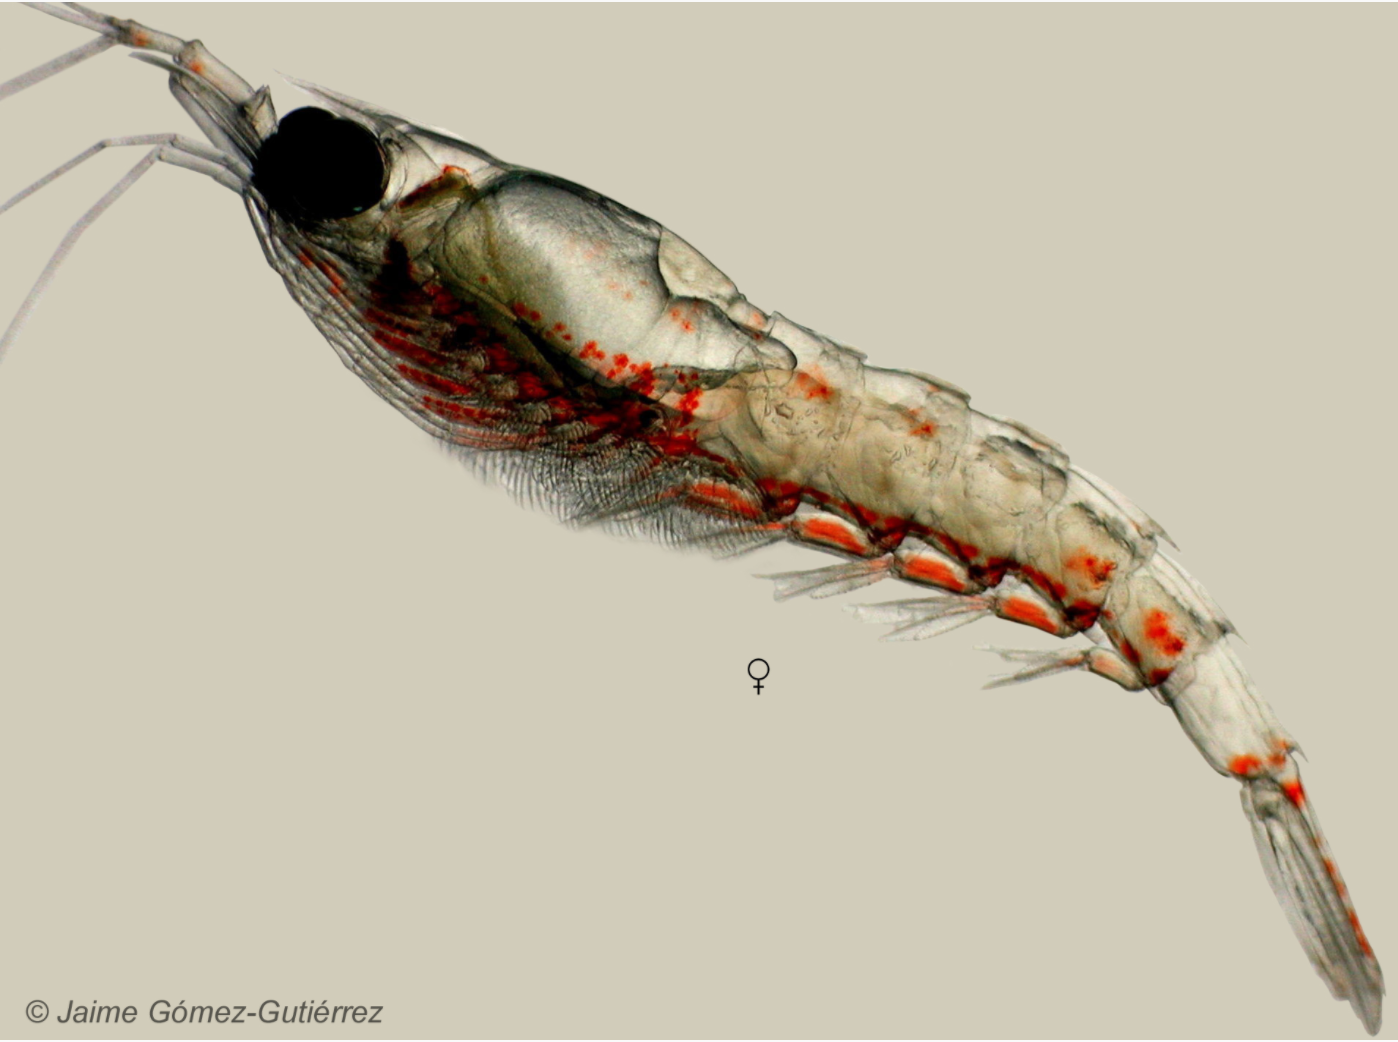
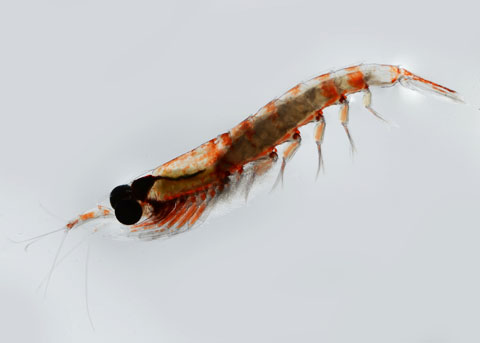
Amanda is an Ocean Sciences student working with me and Dr. Kim Bernard (CEOAS) to conduct a literature review about the two species of krill found off the coast of Oregon. Thysanoessa spinifera and Euphausia pacifica are an important food source for many of the animals that live off our coast — including blue, humpback, and fin whales. I am trying to learn how krill distributions shape those of humpback and blue whales as part of project OPAL, as well as which oceanographic factors drive krill abundances and distributions.
We’re also interested in T. spinifera and E. pacifica for the crucial roles they serve in ecosystems, beyond providing dinner for whales. Krill do many things that are beneficial to ecosystems and people, termed “ecosystem services.” These include facilitating carbon drawdown from the surface ocean to the deep, supporting lucrative fisheries species like salmon, flatfish, and rockfish, and feeding seabirds like auklets and shearwaters. We want to understand more fully the niche that T. spinifera and E. pacifica each fill off the coast of Oregon, which will help us anticipate how these important animals can be impacted by forces such as global climate change and marine management efforts.
Trying to understand the ecosystem services fulfilled by krill is inherently interdisciplinary, which means we have to learn a lot of new things, making this project a lot of fun. The questions Amanda and I have pursued together have ranged from intensely specific, to surprisingly broad. How many calories do blue whales need to eat in a day? How many krill do salmon need to eat? How big are krill fecal pellets, and how fast do they sink?
Trying to answer these questions has basically amounted to a heroic scouring of the internet’s krillscape by Amanda. She has hunted down papers dating back to the 1960s, pulled together findings from every corner of the world, and pursued what she refers to as “treasure troves” of data. In the process, she has also revealed the holes that exist in the literature, and given us new questions. This is the basis of the scientific process: understanding the current state of knowledge, identifying gaps in that knowledge, and developing the questions and methods needed to fill those gaps.
Euphausia pacifica (source: University of Irvine California, Peter J. Bryant).
Filling in knowledge gaps about T. spinifera and E. pacifica can help us better understand these animals, the ecosystems where they live, and the whales and other animals that depend on them for prey. It’s exciting to know that we will have the opportunity to help fill some of these gaps, as both Amanda and I continue this research over the course of our degrees.
Being able to engage in remote research and mentorship has been really rewarding, and it has shown me how far we’ve all come over the last year. Learning how to work together remotely has been crucial as we have adjusted to the funny new normal of the pandemic. As much as I miss working with people in person, I’ve learned that there’s a lot of great connection to be found even in remote collaboration – I’ve loved meeting Amanda’s pets on Zoom, learning about her career goals, and seeing her incredibly artistic representations of the carbon cycle held up to the camera.
Even though most of our conversations take place on Zoom from our homes, this research still feels plugged into a bigger community. Amanda and I also join Kim’s bigger Zooplankton Ecology Lab meetings, which include two other graduate students and eight undergraduate students, all of whom are working on zooplankton ecology questions that span from the Arctic to the Antarctic. Even though we’ve never met in person, a supportive and curious community has developed among all of us, which I know will persist when we can move back to in-person research and mentorship.
Clara Bird, PhD Student, OSU Department of Fisheries and Wildlife, Geospatial Ecology of Marine Megafauna Lab
In order to understand a species’ distribution, spatial ecologists assess which habitat characteristics are most often associated with a species’ presence. Incorporating behavior data can improve this analysis by revealing the functional use of each habitat type, which can help scientists and managers assign relative value to different habitat types. For example, habitat used for foraging is often more important than habitat that a species just travels through. Further complexity is added when we consider that some species, such as gray whales, employ a variety of foraging tactics on a variety of prey types that are associated with different habitats. If individual foraging tactic specialization is present, different foraging habitats could be valuable to specific subgroups that use each tactic. Consequently, for a population that uses a variety of foraging tactics, it’s important to study the associations between tactics and habitat characteristics.
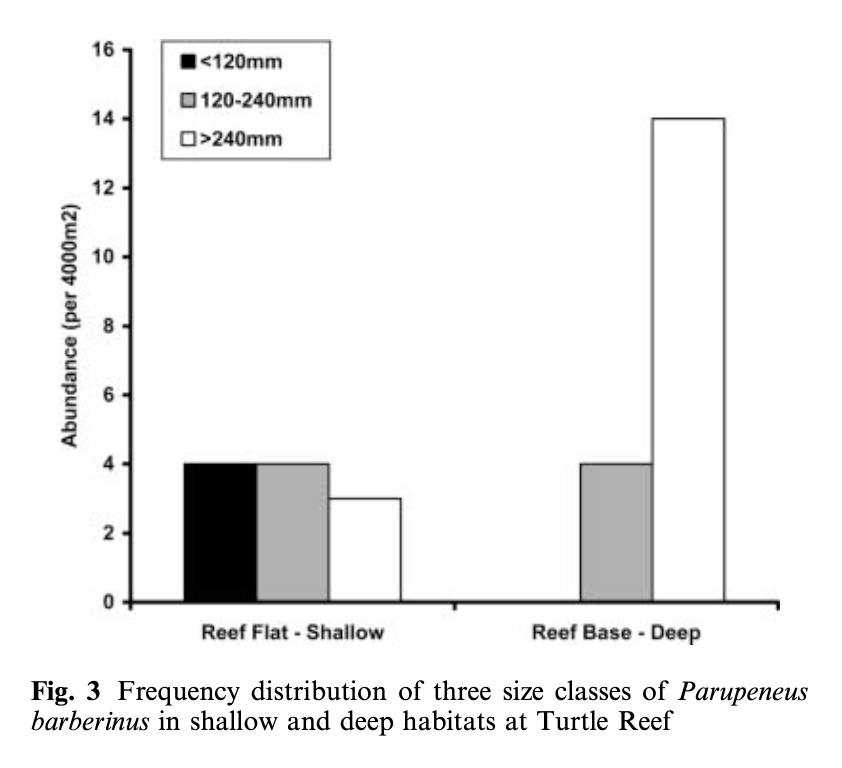
Lukoschek and McCormick’s (2001) study investigating the spatial distribution of a benthic fish species’ foraging behavior is a great example of combining data on behavior, habitat, and morphology. They collected data on the diet composition of individual fish categorized into different size classes (small, medium, and large) and what foraging tactics were used in which reef zones and habitat types. The foraging tactics ranged from feeding in the water column to digging (at a range of depths) in the benthic substrate. The results showed that an interesting combination of fish behavior and morphology explained the observed diet composition and spatial distribution patterns. Small fish foraged in shallower water, on smaller prey, and primarily employed the water column and shallow digging tactics. In contrast, large fish foraged in deep water, on larger prey, and primarily fed by digging deeper into the seafloor (Figure 1). This pattern is explained by both morphology and behavior. Morphologically, the size of the feeding apparatus (mouth gape size) affects the size of the prey that a fish can feed on. The gape of the small fish is not large enough to eat the larger prey that large fish are able to consume. Behaviorally, predation risk also affects habitat selection and tactic use. Small fish are at higher risk of being predated on, so they remain in shallow areas where they are more protected from predators and they don’t dig as deep to forage because they need to be able to keep an eye out for predators. Interestingly, while they found a relationship between the morphology of the fish and habitat use, they did not find an association between specific feeding tactics and habitat types.
Figure 1. Figure from Lukoschek and McCormick (2001) showing that small fish (black bar) were found in shallow habitat while large fish (white bar) were found in deep habitat.
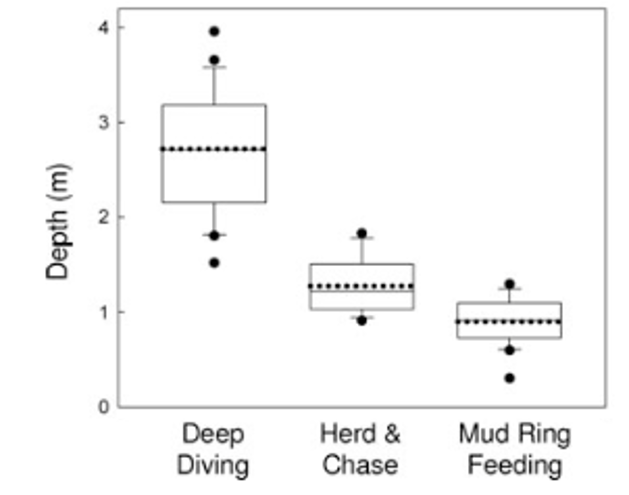
Conversely, Torres and Read (2009) did find associations between theforaging tactics of bottlenose dolphins in Florida Bay, FL and habitat type. Dolphins in this bay employ three foraging tactics: herd and chase, mud ring feeding, and deep diving. Observations of the foraging tactics were linked to habitat characteristics and individual dolphins. The study found that these tactics are spatially structured by depth (Figure 2), with deep diving occurring in deep water whereas mud ring feeding occurrs in shallower water. They also found evidence of individual specialization! Individuals that were observed deep diving were not observed mud ring feeding and vice-versa. Furthermore, they found that individuals were found in the habitat type associated with their preferred tactic regardless of whether they were foraging or not. This result indicates that individual dolphins in this bay have a foraging tactic they prefer and tend to stay in the corresponding habitat type. These findings are really intriguing and raise interesting questions regarding how these tactics and specializations are developed or learned. These are questions that I am also interested in asking as part of my thesis.
Figure 2. Figure from Torres and Read (2009) showing that deep diving is associated with deeper habitat while mud ring feeding is associated with shallow habitat.
Both of these studies are cool examples that, combined, exemplify questions I am interested in examining using our study population of Pacific Coast Feeding Group (PCFG) gray whales. Like both studies, I am interested in assessing how specific foraging tactics are associated with habitat types. Our hypothesis is that different prey types live in different habitat types, so each tactic corresponds to the best way to feed on that prey type in that habitat. While predation risk doesn’t have as much of an effect on foraging gray whales as it does on small benthic fish, I do wonder how disturbance from boats could similarly affect tactic preference and spatial distribution. I am also curious to see if depth has an effect on tactic choice by using the morphology data from our drone-based photogrammetry. Given that these whales forage in water that is sometimes as deep as they are long, it stands to reason that maneuverability would affect tactic use. As described in a previous blog, I’m also looking for evidence of individual specialization. It will be fascinating to see how foraging preference relates to space use, habitat preference, and morphology.
These studies demonstrate the complexity involved in studying a population’s relationship to its habitat. Such research involves considering the morphology and physiology of the animals, their social, individual, foraging, and predator-prey behaviors, and the relationship between their prey and the habitat. It’s a bit daunting but mostly really exciting because better understanding each puzzle piece improves our ability to estimate how these animals will react to changing environmental conditions.
While I don’t have any answers to these questions yet, I will be working with a National Science Foundation Research Experience for Undergraduates intern this summer to develop a habitat map of our study area that will be used in this analysis and potentially answer some preliminary questions about PCFG gray whale habitat use patterns. So, stay tuned to hear more about our work this summer!
References
Lukoschek, V., & McCormick, M. (2001). Ontogeny of diet changes in a tropical benthic carnivorous fish, Parupeneus barberinus (Mullidae): Relationship between foraging behaviour, habitat use, jaw size, and prey selection. Marine Biology, 138(6), 1099–1113. https://doi.org/10.1007/s002270000530
Torres, L. G., & Read, A. J. (2009). Where to catch a fish? The influence of foraging tactics on the ecology of bottlenose dolphins ( Tursiops truncatus ) in Florida Bay, Florida. Marine Mammal Science, 25(4), 797–815. https://doi.org/10.1111/j.1748-7692.2009.00297.x
Clara Bird, PhD Student, OSU Department of Fisheries and Wildlife, Geospatial Ecology of Marine Megafauna Lab
When I started working on my thesis, I anticipated many challenges related to studying the behavioral ecology of gray whales. From processing five-plus years of drone footage to data analysis, there has been no shortage of anticipated and unexpected issues. I recently hit an unexpected challenge when I started video processing that piqued my interest. As I’ve discussed in a previous blog, ethograms are lists of defined behaviors that help us properly and consistently collect data in a standardized approach. Ethograms form a crucial foundation of any behavior study as the behaviors defined ultimately affect what questions can be asked and what patterns are detected. Since I am working off of the thorough ethogram of Oregon gray whales from Torres et al. (2018), I had not given much thought to the process of adding behaviors to the ethogram. But, while processing the first chunk of drone videos, I noticed some behaviors that were not in the original ethogram and struggled to decide whether or not to add them. I learned that ethogram development can lead down several rabbit holes. The instinct to try and identify every movement is strong but dangerous. Every minute movement does not necessarily need to be included and it’s important to remember the ultimate goal of the analysis to avoid getting bogged down.
Fundamental behavior questions cannot be answered without ethograms. For example, Baker et al. (2017) developed an ethogram for bottlenose dolphins in Ireland in order to conduct an initial quantitative behavior analysis. They did so by reviewing published ethograms for bottlenose dolphins, consulting with multiple experts, and revising the ethogram throughout the study. They then used their data to test inter-observer variability, calculate activity budgets, and analyze how the activity budgets varied across space and time.
Howe et al. (2015) also developed an ethogram in order to conduct quantitative behavior analyses. Their goals were to use the ethogram and subsequent analyses to better understand the behavior of beluga whales in Cook Inlet, AK, USA and to inform conservation. They started by writing down all behaviors they observed in the field, then they consolidated their notes into a formal ethogram that they used and refined during subsequent field seasons. They used their data to analyze how the frequencies of different behaviors varied throughout the study area at different times. This study served as an initial analysis investigating the effect of anthropogenic disturbance and was refined in future studies.
My research is similarly geared towards understanding behavior patterns to ultimately inform conservation. The primary questions of my thesis involve individual specialization, patterns of behavior across space, the relationship between behavior and body condition, and social behavior (check out this blog to learn more). While deciding what behaviors to add to my ethogram I’ve had to remind myself of these main questions and the bigger picture. The drone footage lets us see so much detail that it’s tempting to try to define every movement we can observe. One rabbit hole I’ve had to avoid a few times is locomotion. From the footage, it is possible to document fluke beats and pectoral fin strokes. While it could be interesting to investigate how different whales move in different ways, it could easily become a complicated mess of classifying different movements and take me deep into the world of whale locomotion. Talking through what that work would look like reminded me that we cannot answer every question and trying to assess all exciting side projects can cause us to lose focus on the main questions.
While I avoided going down the locomotion rabbit hole, there were some new behaviors that I did add to my ethogram. I’ll illustrate the process with the examples of two new behaviors I recently added: fluke swish and pass under (Clips 1 and 2). Clip 1 shows a whale rapidly moving its fluke to the side. I chose to add fluke swish because it’s such a distinct movement and I’m curious to see if there’s a pattern across space, time, individual, or nearby human activity that might explain its function. Clip 2 shows a calf passing under its mom. It’s not nursing because the calf doesn’t spend time under its mom, it just crosses underneath her. The calf pass under behavior could be a type of mom-calf tactile interaction. Analyzing how the frequency of this behavior changes over time could show how a calf’s dependency on its mom changes over as it ages.
In defining these behaviors, I had to consider how many different variations of this behavior would be included in the definition. This process involves considering at what point a variation of that behavior could serve a different function, even without knowing the function of the original behavior. For fluke swish this process involved deciding to only count a behavior as a fluke swish if it was a big, fast movement. A small and slow movement of the fluke a little to the side could serve a different function, such as turning, or be a random movement.
Clip 1: Fluke swish behavior (Video filmed under NOAA/NMFS research permit #16111 by certified drone pilot Todd Chandler).
Clip 2: Pass under behavior (Video filmed under NOAA/NMFS research permit #16111 by certified drone pilot Todd Chandler).
The next step involved deciding if the behavior would be a ‘state’ or ‘point’ event. A state event is a behavior with a start and stop moment; a point event is instantaneous and assigned to just a point in time. I would categorize a behavior as a state event if I was interested in questions about its duration. For example, I could ask “what percentage of the total observation time was spent in a certain behavior state?” A point event would be a behavior where duration is not applicable, but I could ask a question like “Did whale 1 perform more point event A than whale 2?”. Both fluke swish and pass under are point events because they only happen for an instant. In a pass under the calf is passing under its mom for just a brief point in time, making it a point event. The final step was to name the behavior. As I discussed in this blog, the name of the behavior does not matter as much as the definition but it is important that the name is clear and descriptive. We chose the name fluke swish because the fluke rapidly moves from side to side and pass under because the calf crosses under its mom.
Frankly, in the beginning, I was a bit overwhelmed by the realization that the content of my ethogram would ultimately control the questions I could answer. I could not help but worry that after processing all the videos, I would end up regretting not defining more behaviors. However, after reading some of the literature, chatting with Leigh, and reviewing the initial chunk of videos several times, I am more confidence in my judgment and my ethogram. I have accepted the fact that I can’t anticipate everything, and I am confident that the behaviors I need to answer my research questions are included. The process of reviewing and updating my ethogram has been a rewarding challenge that resulted in a valuable lesson that I will take with me for the rest of my career.
References
Baker, I., O’Brien, J., McHugh, K., & Berrow, S. (2017). An ethogram for bottlenose dolphins (Tursiops truncatus) in the Shannon Estuary, Ireland. Aquatic Mammals, 43(6), 594–613. https://doi.org/10.1578/AM.43.6.2017.594
Howe, M., Castellote, M., Garner, C., McKee, P., Small, R. J., & Hobbs, R. (2015). Beluga, Delphinapterus leucas, ethogram: A tool for cook inlet beluga conservation? Marine Fisheries Review, 77(1), 32–40. https://doi.org/10.7755/MFR.77.1.3
Torres, L. G., Nieukirk, S. L., Lemos, L., & Chandler, T. E. (2018). Drone up! Quantifying whale behavior from a new perspective improves observational capacity. Frontiers in Marine Science, 5(SEP). https://doi.org/10.3389/fmars.2018.00319
As we all try to find ways to be together safely this winter, the GEMM Lab has started a fun series of virtual movie nights. Just before the holidays, we watched “Big Miracle,” which tells the story of the historic whale entrapment event in Utqiagvik, Alaska (formerly called “Barrow”) that captured the world’s attention.
The 2012 film stars Drew Barrymore, who plays a Greenpeace activist, and John Krasinski, a television reporter covering the story.
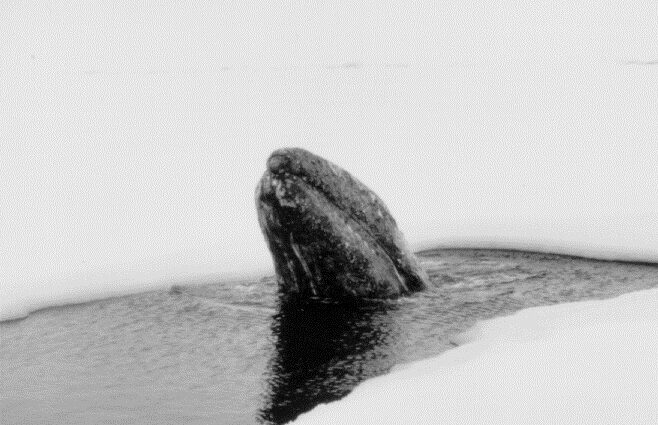
In late September 1988, three gray whales became trapped in the sea ice just off Point Barrow. Local attempts to free the whales quickly became national news that captured the attention of millions, including President Ronald Reagan, pop legend Michael Jackson – and elementary-schooler Leigh Torres.
After the movie, Leigh told us about how she had religiously followed television updates on the rescue as a child. Hearing her memories of the event and its part in inspiring her to pursue a career in whale research was one of the best parts of watching the movie together as a lab.
Tuning in from my parents’ house in Fairbanks, Alaska, the story felt surprisingly close to home for me too. I had never heard Inupiaq spoken in a feature film before, and I was stunned to recognize the landscape around Utqiaġvik and realize that some of the movie was filmed on location. It was also the first movie I’d seen represent the myriad of human dimensions that surround whale research and policy, including Indigenous rights, oil and fishing industry interests, and environmental perspectives.
Certain elements of the movie also made me uncomfortable, and thus made me wonder about the movie’s accuracy. Why were the main characters in the film people from outside Alaska? How did the rescue logistics and decision-making processes really play out in Utqiaġvik? Why did the whales become trapped in the first place?
I was curious to learn more about the whales, and how Utqiaġvik experienced both the massive rescue effort and the Hollywood-ized retelling of its story. During a great Zoom conversation, I learned more from Craig George, a whale biologist who has worked in Utqiaġvik since the 1970s and was involved during the entire 1988 rescue mission.
Like all Hollywood movies based on real events, “Big Miracle” mixes facts with a healthy dose of fiction and storytelling. The movie portrays the three entrapped whales as a family unit, given the names Wilma, Fred, and Bam Bam. Craig described them in more scientific terms – three subadult gray whales, all 25-30 feet in length. He and the other biologists onsite collected data throughout the three-week rescue effort, recording the whales’ behavior, dive times, and vocalizations. They calculated that the whales’ respiration rates were double that of typical rates, revealing the whales’ distress.
The rescue team named the whales Crossbeak, Bone, and Bonnet based on each individual’s notable morphological traits. Photo: Craig George
“The community effort to free the whales was amazing,” Craig said. “Low-tech approaches and local knowledge are typically most effective in the Arctic, and all the best ideas relied on the Inupiaq knowledge of the area.”
With the aim of leading the whales offshore to safer waters, a team of volunteers cut a series of breathing holes at regular intervals in the sea ice. The approach seemed to work well, and so the ice-breaking crew was puzzled when the whales stopped using the new holes – until they realized the area was underlain by shoals that the whales were unwilling to cross. They began cutting in a new direction, and the whales appeared in the new hole instantly, before the opening was even completed.
“The whales were trying to tell us the direction they wanted to go,” Craig said. “It was really astonishing, because there was definitely a dynamic between us. We tried to train them to work with us, and they also trained us.”
A team of volunteers cut holes in the sea ice, creating a path to open water, while journalists document the moment. Photo: Craig George
Over three weeks, the rescue effort grew from local to international. Companies donated chainsaws and fuel, and people following the news outside Alaska flew to Utqiaġvik to volunteer their help. Several attempts to break the ice, including an ice-based pontoon tractor and an ice-breaking helicopter, failed. Working around the clock, and in temperatures below -20F, volunteers continued cutting breathing holes in the ice for the whales.
Finally, one hurdle remained between the whales and open water – a massive pressure ridge of grounded sea ice, about 20 ft high and just as deep. It was impossible to cut through with chainsaws. Two Russian icebreakers, the Vladimir Arseniev and the Admiral Makarov were enlisted to come break the ridge and clear the way to open water – no small diplomatic feat during the Cold War.
Ultimately, Craig said, the real story’s ending isn’t quite as picture-perfect as the one in “Big Miracle” – no oneactually knows whether the whales made it out or not.
“We know that the whales swam out the icebreaker track, because their blood was found on ice shards,” he said. “They might have made it out, but we never saw them again and don’t know for sure.”
This map shows the path of holes cut through the sea ice, icebreaker track, and pressure ridge of ice. “Barrow” is the former name of Utqiaġvik. Source: Geoff Carroll and Craig George
Nearly 40 years later, Craig says the story still comes up often in Utqiaġvik, but in a different context – climate change. In 1988, the sea ice froze up in late September. In 2020, however, there was no shore-fast ice until early December. Craig remembers that, during the rescue, temperatures dropped to -24°F one night — colder than Utqiaġvik had experienced yet in January 2020, when we last spoke. Today’s dramatically different conditions have impacts for the entire Arctic ecosystem, as well as the people who rely on it to survive.
Watching “Big Miracle” sparked so many questions about the past, and talking with Craig gave me just as many questions about the future. How will changing ocean conditions impact gray whales, and other Arctic whales? How will the social and environmental dynamics that “Big Miracle” depicted – environmentalism, resource exploitation, and Indigenous rights – adapt and evolve in a changing Arctic? What will the Alaskan Arctic look like in another 40 years?
Clara Bird, PhD Student, OSU Department of Fisheries and Wildlife, Geospatial Ecology of Marine Megafauna Lab
As anyone who has ever been, or raised, a picky eater knows, humans have a wide range of food preferences. The diversity of available cuisines is a testament to the fact that we have individual food preferences. While taste is certainly a primary influence, nutritional benefits and accessibility are other major factors that affect our eating choices. But we are not the only species to have food preferences. In cetacean research, it is common to study the prey types consumed by a population as a whole. Narrowing these prey preferences down to the individual level is rare. While the individual component is challenging to study and to incorporate into population models, it is important to consider what the effects of individual foraging specialization might be.
To understand the role and drivers of individual specialization in population ecology, it is important to first understand the concepts of niche variation and partitioning. An animal’s ecological niche describes its role in the ecosystem it inhabits (Hutchinson, 1957). A niche is multidimensional, with dimensions for different environmental conditions and resources that a species requires. One focus of my research pertains to the dimensions of the niche related to foraging. As discussed in a previous blog, niche partitioning occurs when ecological space is shared between competitors through access to resources varies across different dimensions such as prey type, foraging location, and time of day when foraging takes place. Niche partitioning is usually discussed on the scale of different species coexisting in an ecosystem. Pianka’s theory stating that niche partitioning will increase as prey availability decreases uses competing lizard species as the example (Pianka, 1974). Typically, niche partitioning theory considers inter-specific competition (competition between species), but niche partitioning can take place within a species in response to intra-specific competition (competition between individuals of the same species) through individual niche variation.
A species that consumes a multitude of prey types is considered a generalist while one with a specific prey type is considered a specialist. Gray whales are considered generalists (Nerini, 1984). However, we do not know if each individual gray whale is a generalist or if the generalist population is actually composed of individual specialists with different preferences. One way to test for the presence of individual specialization is to compare the niche width of the population to the niche width of each individual (Figure 1, Bolnick et al., 2003). For example, if a population eats five different types of prey and each individual consumed those prey types, those individuals would be generalists. However, if each individual only consumed one of the prey types, then those individuals would be specialists within a generalist population.
Figure 1. Figure from Bolnick et al. 2003. The thick curve represents the total niche of the population and the thin curves represent individual niches. Note that in both panels the population has the same total niche. In panel A, the individual curves overlap and are all pretty wide. These curves represent individual generalists that make up a generalist population. In panel B, the thin curves are narrower and do not overlap as much as those in panel A. These curves represent individual specialists that make up a generalist population.
If individual specialization is present in a population the natural follow-up question is why? To answer this, we look for common characteristics between the individuals that are similarly specialized. What do all the individuals that feed on the same prey type have in common? Common characterizations that may be found include age, sex, or distinct morphology (such as different beak or body shapes) (Bolnick et al., 2003).
Woo et al. (2008) studied individual specialization in Brünnich’s guillemot, a generalist sea bird species, using diet and tagging data. They found individual specialization in both diet (prey type) and behavior (dive depth, shape, and flight time). Specialization occurred across multiple timescales but was higher over short-time scales. The authors found that it was more common for an individual to specialize in a prey-type/foraging tactic for a few days than for that specialization to continue across years, although a few individuals were specialists for the full 15-year period of the study. Based on reproductive success of the studies birds, the authors concluded that the generalist and specialist strategies were largely equivalent in terms of fitness and survival. The authors searched for common characteristics in the individuals with similar specialization and they found that the differences between sexes or age classes were so small that neither grouping explained the observed individual specialization. This is an interesting result because it suggests that there is some missing attribute, that of the authors did not examine, that might explain why individual specialists were present in the population.
Hoelzel et al. (1989) studied minke whale foraging specialization by observing the foraging behaviors of 23 minke whales over five years from a small boat. They identified two foraging tactics: lunge feeding and bird-associated feeding. Lunge feeding involved lunging up through the water with an open mouth to engulf a group of fish, while bird-associated feeding took advantage of a group of fish being preyed on by sea birds to attack the fish from below while they were already being attacked from above. They found that nine individuals used lunge feeding, and of those nine, six whales used this tactic exclusively. Five of those six whales were observed in at least two years. Seventeen whales were observed using bird-associated feeding, 14 exclusively. Of those 14, eight were observed in at least two years. Interestingly, like Woo et al. (2008), this study did not find any associations between foraging tactic use and sex, age, or size of whale. Through a comparison of dive durations and feeding rates, they hypothesized that lunge feeding was more energetically costly but resulted in more food, while bird-associated feeding was energetically cheaper but had a lower capture rate. This result means that these two strategies might have the similar energetic payoffs.
Both of these studies are examples of questions that I am excited to ask using our data on the PCFG gray whales feeding off the Oregon coast (especially after doing the research for this blog). We have excellent individual-specific data to address questions of specialization because the field teams for this project always carefully link observed behaviors with individual whale ID. Using these data, I am curious to find out if the whales in our study group are individual specialists or generalists (or some combination of the two). I am also interested in relating specific tactics to their energetic costs and benefits in order to assess the payoffs of each foraging tactic. I then hope to combine the results of both analyses to assess the payoffs of each individual whale’s strategy.
Figure 2. Example images of two foraging tactics, side swimming (left) and headstanding (right).Images captured under NOAA/NMFS permit #21678.
Studying individual specialization is important for conservation. Consider the earlier example of a generalist population that consumes five prey items but is composed of individual specialists. If the presence of individual specialization is not accounted for in management plans, then regulations may protect certain prey types or foraging tactics/areas of the whales and not others. Such a management plan could be a dangerous outcome for the whale population because only parts of the population would be protected, while other specialists are at risk, thus potentially losing genetic diversity, cultural behaviors, and ecological resilience in the population as a whole. A plan designed to maximize protection for all the specialists would be better for the population because populations with increased ecological resilience are more likely to persist through periods of rapid environmental change. Furthermore, understanding individual specialization could help us better predict how a population might be affected by environmental change. Environmental change does not affect all prey species in the same way. An individual specialization study could help identify which whales might be most affected by predicted environmental changes. Therefore, in addition to being a fascinating and exciting research question, it is important to test for individual specialization in order to improve management and our overall understanding of the PCFG gray whale population.
References
Bolnick, D. I., Svanbäck, R., Fordyce, J. A., Yang, L. H., Davis, J. M., Hulsey, C. D., & Forister, M. L. (2003). The ecology of individuals: Incidence and implications of individual specialization. American Naturalist, 161(1), 1–28. https://doi.org/10.1086/343878
Hoelzel, A. R., Dorsey, E. M., & Stern, S. J. (1989). The foraging specializations of individual minke whales. Animal Behaviour, 38(5), 786–794. https://doi.org/10.1016/S0003-3472(89)80111-3
Hutchinson, G. E. (1957). Concluding Remarks. Cold Spring Harbor Symposia on Quantitative Biology, 22(0), 415–427. https://doi.org/10.1101/sqb.1957.022.01.039
Nerini, M. (1984). A Review of Gray Whale Feeding Ecology. In The Gray Whale: Eschrichtius Robustus (pp. 423–450). Elsevier Inc. https://doi.org/10.1016/B978-0-08-092372-7.50024-8
Pianka, E. R. (1974). Niche Overlap and Diffuse Competition. 71(5), 2141–2145.
Woo, K. J., Elliott, K. H., Davidson, M., Gaston, A. J., & Davoren, G. K. (2008). Individual specialization in diet by a generalist marine predator reflects specialization in foraging behaviour. Journal of Animal Ecology, 77(6), 1082–1091. https://doi.org/10.1111/j.1365-2656.2008.01429.x
At this year’s virtual State of the Coast conference, I enjoyed tuning into a range of great talks, including one by Zach Penney from the Columbia River Inter-Tribal Fish Commission. In his presentation, “More Than a Tradition: Treaty rights and the Columbia River Inter-Tribal Fish Commission,” Penney described a tribal “covenant with resources,” and noted the success of this approach — “You don’t live in a place for 15,000 years by messing it up.”
Indigenous management of resources in the Pacific Northwest dates back thousands of years. From oak savannahs to fisheries to fires, local tribes managed diverse natural systems long before colonial settlement of the area that is now Oregon. We know comparatively little, however, about how Indigenous groups in Oregon interacted with whale populations before the changes brought by colonialism and commercial whaling.
I’m curious about how this missing knowledge could inform our understanding of the coastal Oregon ecosystems in which many GEMM Lab projects take place. My graduate research will be part of the effort to identify co-occurrence between whales and fishing in Oregon, with the goal of helping to reduce whale entanglement risk. Penney’s talk, ongoing conversations about decolonizing science, and my own concerns about becoming the scientist that I want to be, have all led me to ask a new set of questions: What did humans know in the past about whale distributions along the Oregon coast? What lost knowledge can be reclaimed from history?
As I started reading about historical Indigenous whale use in Oregon, I was struck by how little we know today, and how this learning process became a multidisciplinary treasure hunt. Clues as to how Indigenous groups interacted with whales along the Oregon coast lie in oral histories, myths, journals, and archaeological artifacts.
Much of what I read hinged on the question: did Indigenous tribes in Oregon historically hunt whales? Many signs point to yes, but it’s a surprisingly tricky question to answer conclusively. Marine systems and animals, including seals and whales, remain an important part of cultures in the Pacific Northwest today – but historically, documentation of hunting whales in Oregon has been limited. Whale bones have been found in coastal middens, and written accounts describe opportunistic harvests of beached whales. However, people have long believed that only a few North American tribes outside of the Arctic regularly hunted whales.
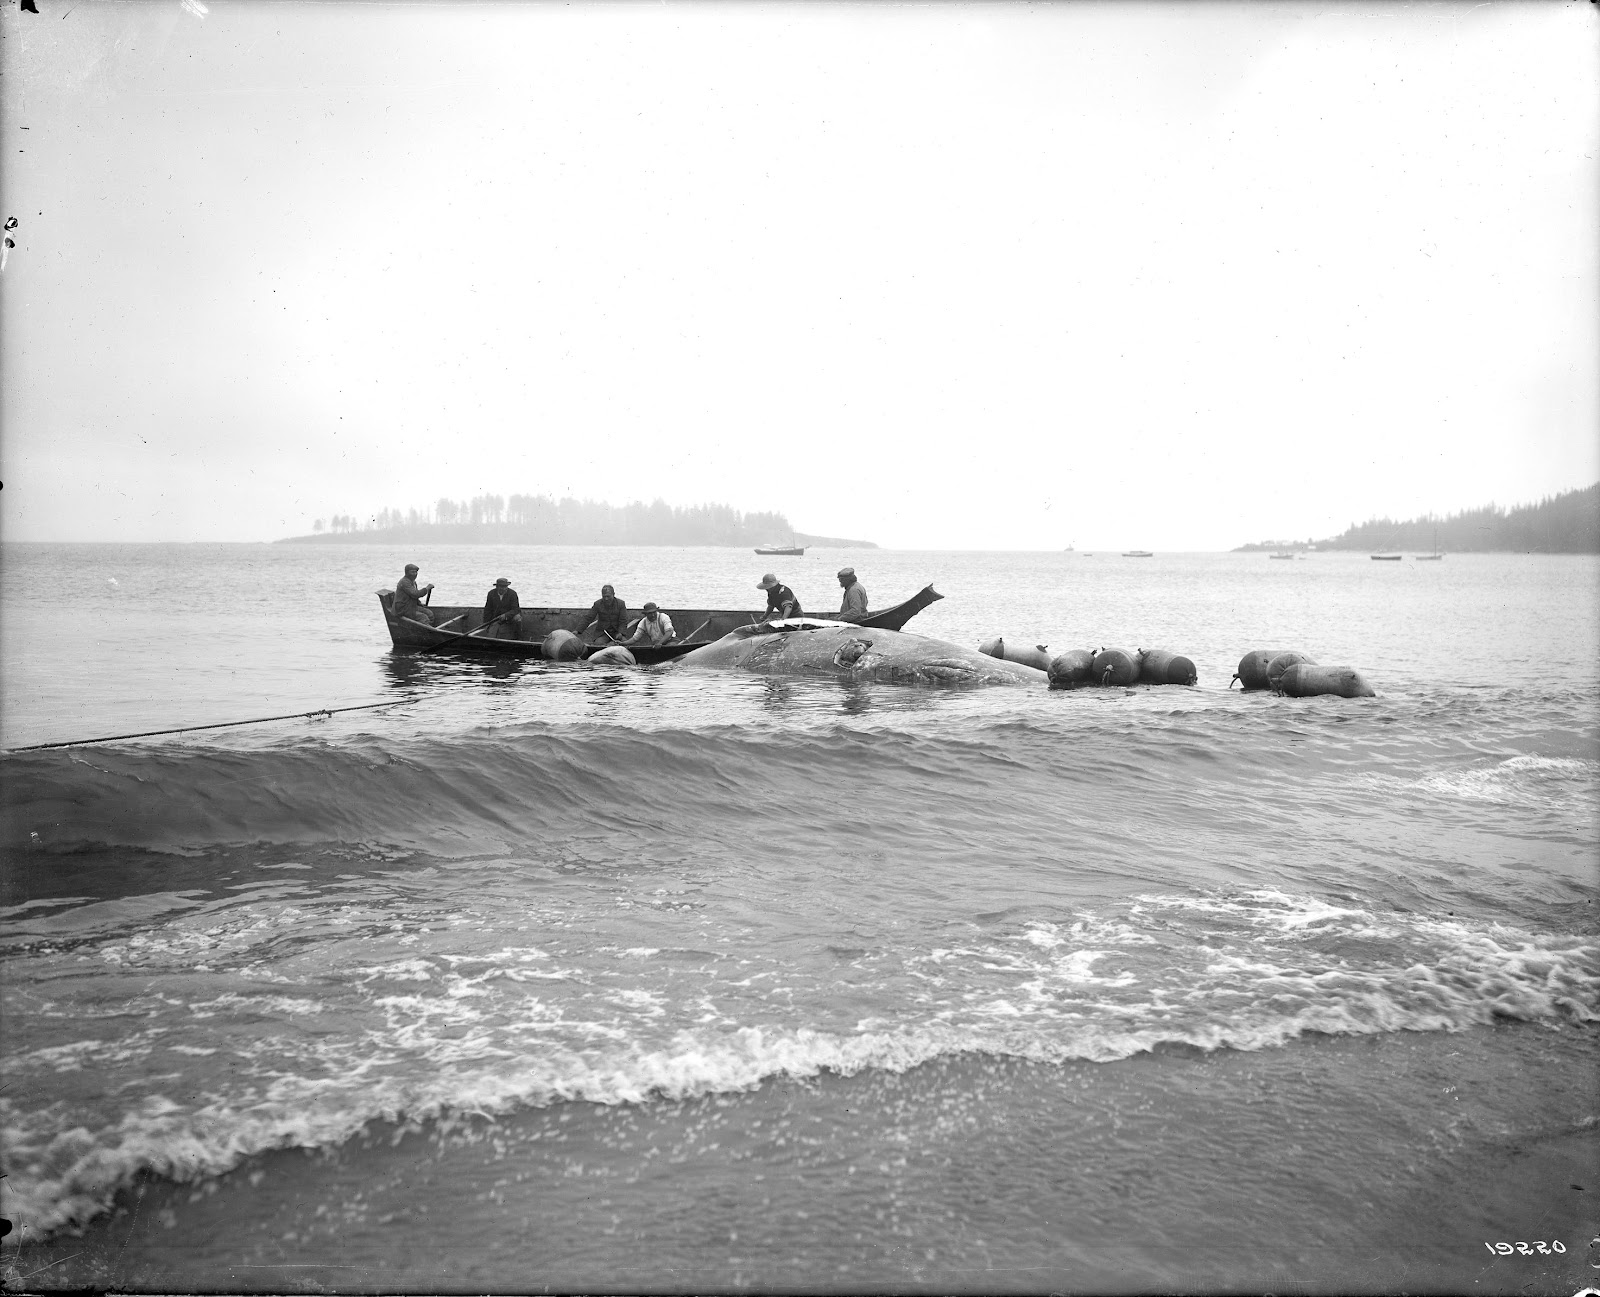
But in 2007, archaeologists Robert Losey and Dongya Yang found an artifact that started to shift this narrative. While studying a collection of tools housed at the Smithsonian Institution, they discovered the tip of a harpoon lodged in a whale flipper bone. This artifact came from the Partee site, which was inhabited around AD 300-1150 and is located near present-day Seaside, Oregon.
A gray whale ulna with cut marks found at the Partee site (Wellman, et al. 2017).
Through DNA testing, Losey and Yang determined that the harpoon was made of elk bone, and that the elk was not only harvested locally, but also used locally. This new piece of evidence suggested that whaling did in fact take place at the Partee site, likely by the Tillamook or Clatsop tribes that utilized this area.
Several years later, this discovery inspired Smithsonian Museum of Natural History archaeologist Torben Rick and University of Oregon PhD student Hannah Wellman to comb through the rest of the animal remains in the Smithsonian’s collection from northwest Oregon. Rick and Wellman scrutinized 187 whale bones for signs of hunting or processing, and found that about a quarter of the marks they inspected could have come from either hunting or the opportunistic harvest of stranded whales. They examined tools from the midden as well, and found that they were more suited to hunting animals, like seals and sea lions, or fishing.
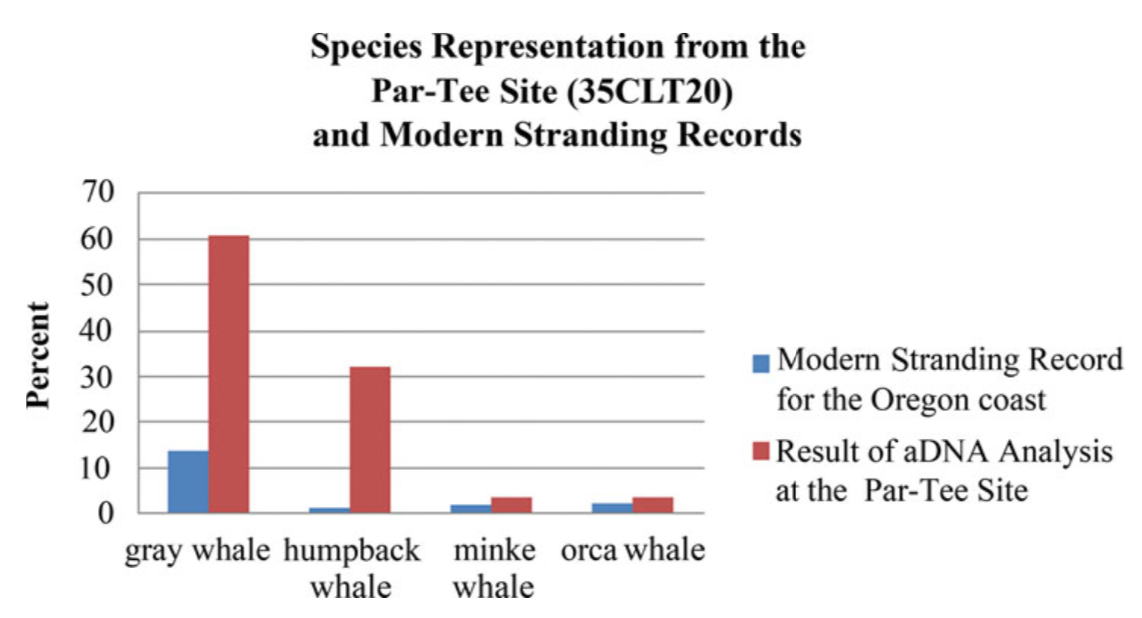
However, Wellman and Rick also used DNA testing to identify which whale species were represented in the midden – and the DNA analyses suggested a different story. Genetic results revealed that the majority of whale bones in the midden came from gray whales, a third from humpback whales, and a few from orca and minke. Modern gray whale stranding events are not uncommon, and so it follows logically that these bones could have simply come from people harvesting beached whales. However, humpback strandings are rare – suggesting that such a large proportion of humpback bones in the midden is likely evidence of people actively hunting humpback whales.
Percentage of whale species identified at the Partee site and percentage of species in the modern stranding record for the Oregon Coast (Wellman, et al. 2017).
These results shed new light on whale harvesting practices at the Partee Site, and, like so much research, they suggest a new set of questions. What does the fact that there were orca, minke, gray, and humpback whales off the Oregon coast 900 years ago tell us about the history of this ecosystem? Could artifacts that have not yet been found provide more conclusive evidence of hunting? What would it mean if these artifacts are found one day, or if they are never found?
As this fascinating research continues, I hope that new discoveries will continue to deepen our understanding of historic Indigenous whaling practices in Oregon – and that this information can find a place in contemporary conversations. Indigenous whaling rights are both a contemporary and contentious issue in the Pacific Northwest, and the way that humans learn about the past has much to do with how we shape the present.
What we learn about the past can also change how we understand this ecosystem today, and provide new context as we try to understand the impacts of climate change on whale populations in Oregon. I’m interested in how learning more about historical Indigenous whaling practices could provide more information about whale population baselines, ideas for management strategies, and a new lens on the importance of whales in the Pacific Northwest. Even if we can’t fully reclaim lost knowledge from history, maybe we can still read enough clues to help us see both the past and present more fully.
Sources:
Braun, Ashley. “New Research Offers a Wider View on Indigenous North American Whaling.” Hakai Magazine, November 2016, www.hakaimagazine.com/news/new-research-offers-wider-view-indigenous-north-american-whaling/.
Eligon, John. “A Native Tribe Wants to Resume Whaling. Whale Defenders Are Divided.” New York Times, November 2019.
Hannah P. Wellman, Torben C. Rick, Antonia T. Rodrigues & Dongya Y. Yang (2017) Evaluating Ancient Whale Exploitation on the Northern Oregon Coast Through Ancient DNA and Zooarchaeological Analysis, The Journal of Island and Coastal Archaeology, 12:2, 255-275, DOI: 10.1080/15564894.2016.1172382
Losey, R., & Yang, D. (2007). Opportunistic Whale Hunting on the Southern Northwest Coast: Ancient DNA, Artifact, and Ethnographic Evidence. American Antiquity, 72(4), 657-676. doi:10.2307/25470439
Sanchez, Gabriel (2014). Conference paper: Cetacean Hunting at the Par-Tee site (35CLT20)?: Ethnographic, Artifact and Blood Residue Analysis Investigation.
Fall has arrived in the Pacific Northwest. For humans, it means packing away the shorts and sandals, and getting the boots, raincoats and firewood ready. For gray whales, it means gulping down the last meal of zooplankton they will eat for several months and commencing the journey to warmer waters and sunnier skies in Mexico where they will spend the winter fasting, calving, and nursing. While the GEMM Lab may still squeeze in a day or two of field work this week, we are slowly wrapping up the 2020 field season as conditions get rougher and our beloved gray whales gradually depart our waters. This year marked the 6th year of data collection for both of our gray whale projects: the Newport project that investigates the impacts of multiple stressors on gray whale ecology and health, and the Port Orford project that explores fine-scale foraging ecology of gray whales and their zooplankton prey. Since it will be several months before the GEMM Lab heads back out onto the water again, I thought I would summarize our two field seasons, share some highlights, and muse about the drivers of our observations this summer.
Some snapshots of the field team hard at work this summer. Top left: Hunter Warwick operating the drone. Top right: PI Leigh Torres rocking the lab swag to protect against the sun. Bottom left: Lisa Hildebrand waiting for a whale to surface to get photos of it. Bottom right: Alejandro Fernandez Ajo transfers zooplankton from the light trap to sample jars.
Summaries
Our RHIB Ruby zipped around the central and southern Oregon coast on 33 different days. The summer started slow, with several days of field work where we encountered no whales despite surveying our entire study region. Our encounters picked up towards the end of June and by the end of the summer we totaled 107 sightings, encountering 46 unique individuals, 36 of which were resightings of known individuals we have identified in previous years. Our Newport star of the summer was Solé, a female gray whale we have seen every year since 2015, and we also saw many of our other regulars including Casper, Rafael, Spray, Bit, and Heart. None of these whales shone as bright as Solé though. We flew the drone over her 8 times and collected 7 fecal samples (one of which was the biggest whale fecal sample I have ever seen!). In total, we collected 30 fecal samples and flew the drone 88 times. These data will allow us to continue measuring body condition and hormone levels of Pacific Coast Feeding Group (PCFG) gray whales that use the Oregon coast.
Left: Our RHIB Ruby heading out for a day of field work in Port Orford, OR this summer. Right: Solé. Image captured under NOAA/NMFS permit #21678.
Our tandem research kayak Robustus may not be as zippy as Ruby (it is powered by human muscle rather than a powerful outboard engine after all), but it certainly continues to be a trusty vessel for the Port Orford team. The Port Orford research team, named the Theyodelers this year, collected 181 zooplankton samples and conducted 180 GoPro drops during the month of August from Robustus. Despite the many samples collected, the size of our prey samples remained relatively small throughout the whole season compared to previous years. The cliff team surveyed for a total of 117 hours, of which 15 were spent tracking whales with the theodolite and resulted in 40 different tracklines of whale movements. The whale situation in Port Orford was similar to the pattern of whale sightings in Newport, with low whale sightings at the start of the field season. Luckily, by the start of August (which marked the start of data collection for the Theyodelers), the number of whales using the Port Orford area, especially the two study sites, Mill Rocks & Tichenor Cove, had increased. Of the whales that came close enough to shore for us to identify using photo-id, we tracked 5 unique individuals, 3 of which we also saw in Newport this year. The Port Orford star of the summer was Smudge, with his tracklines making up a quarter of all of our tracklines collected. Smudge is also the whale we sighted most often last year in Port Orford.
Top: Theyodelers Mattea Holt Colberg and Liz Kelly sampling atop the kayak Robustus. Bottom: Smudge. Image captured under NOAA/NMFS permit #21678.
Highlights
Many of you may be familiar with the whale Scarlett (formally known as Scarback). Scarlett is a female, at least 24 years old (she was first documented in the PCFG range in 1996), who is well-known (and easily identified) by the large concave injury on her back that is covered in whale lice, or cyamids. No one knows for certain how Scarlett sustained this injury (though there are stories), however what we do know is that it has not prevented this female from reproducing and successfully raising several calves over her lifetime. The GEMM Lab last saw Scarlett with a calf (which we named Brown) in 2016. Since Scarlett is such a famous whale with a unique history, it shouldn’t be a surprise that one of our highlights this summer is the fact that Scarlett showed up with a new calf! In keeping with a “shades of red” theme, Leigh came up with the name Rose for the new calf. In July, the mom-calf pair put on quite a cute performance, with Rose rising up on Scarlett’s back, giving the team a glimpse of its face. The Scarlett-Rose highlight doesn’t end there though. Just last week, we had a very brief encounter in choppy, swelly waters with a small whale. The whale surfaced just twice allowing us to capture photo-id images, and as we were looking around to see where it would come up a third time, it suddenly breached approximately 20 m from the boat. Lo-and-behold, after comparing our photos of the whale to our catalogue, we realized that this elusive, breaching whale was Rose! I am excited to see whether Rose will return to the Oregon coast next summer and become a PCFG regular just like her mom.
Top: Scarlett, easily identified by the large concave injury on her back covered in cyamids. Bottom: Scarlett with her new calf Rose riding her back, giving us a glimpse of its face. Images captures under NOAA/NMFS permit #21678.
The highlight of the field season in Port Orford is the trial, failures and small successes of a new element to the project. There is still a lot that we do not know and understand about PCFG gray whales. One such thing is the way in which gray whales maneuver their large bodies in shallow rocky habitats, often riddled with kelp, and how exactly they capture their zooplankton prey in these environments. Using drones has certainly helped bring some light into this darkness and has led to the documentation of many novel foraging behaviors (Torres et al. 2018). However, the view from above is unable to provide the fine-scale interactions between whales, kelp, reefs, and zooplankton. Instead, we must somehow find a way to watch the whales underwater. Enter CamDo. CamDo is a technology company that designs specialty products to allow for GoPro cameras to be used for time-lapsed recordings over long periods of time in harsh environmental conditions. One of their products is a housing specifically designed for long-term filming underwater – exactly what we need! The journey was not as easy as simply purchasing the housing. We also needed to build a lander for the housing to sit on (thankfully our very own Todd Chandler designed and built something for us), and coordinate with divers and a vessel to deploy and retrieve the set-up, as well as undertake weekly battery and SD cards swaps (thankfully Dave Lacey of South Coast Tours and a very generous group of divers* donated their time and resources to make this happen). We unfortunately had some technological difficulties and bad visibility for the first 4 weeks (precisely why this CamDo effort was a pilot season this year), however we had some small success in the last 2 weeks of deployment that give us hope for the future. The camera recorded a lot of things: thick layers of mysids, countless rockfish and lingcod, several swimming and foraging murres, a handful of harbor seals, and two encounters of the species we were hoping to film – gray whales! While the footage is not the ‘money shot’ we are hoping to film (aka, a headstanding gray whale eating zooplankton right in front of the camera), the fact that we captured gray whales in the first place has showed us that this set-up is a promising investment of time, money and effort that will hopefully deliver next year.
Top left: CamDo atop its lander designed and built by Todd Chandler. Top right: Divers getting ready to get into the water for a battery and SD card swap. Bottom: Dave Lacey and two of our divers with the Black Pearl, South Coast Tour’s boat.
Musings
You may have picked up on the fact that we had slow starts to our field seasons in both Newport and Port Orford. Furthermore, while the number of whale sightings did increase in both locations throughout the field seasons, the number of sightings and whales per day were lower than they have been in previous years. For example, in 2018, we identified 15 different individuals in the month of August in Port Orford (compared to just 5 this year). In 2019, 63 unique whales were seen in Newport (compared to 46 this year). Interestingly, we had a greater diversity of encountered individuals at the start and end of the season in Newport, with a relatively small number of different individuals in July and August. While I cannot provide a definitive reason (or reasons) as to why patterns were observed (we will need to analyze several years of our data to try and understand why), I have some hypotheses I wish to share with you.
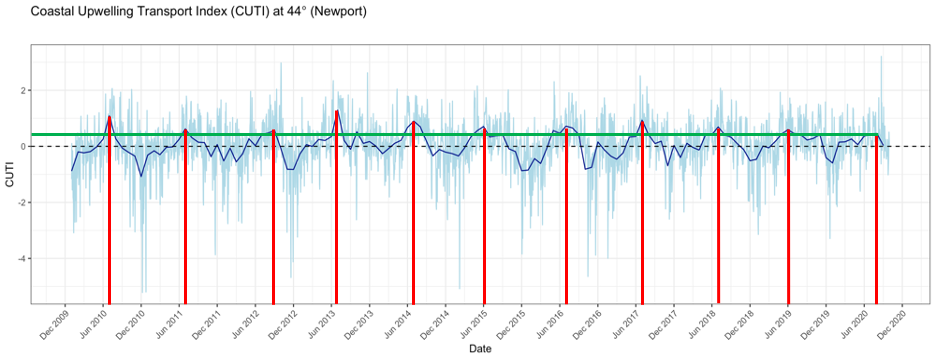
As I mentioned in a previous blog, this summer the coastal upwelling along the Oregon coast was delayed (Figure 1). Typically, peak upwelling occurs during the month of June or shortly thereafter, bringing nutrient-rich, deep waters to the surface and, when mixed with sunlight, a lot of productivity. This productivity sets off a chain of reactions — the input of nutrients leads to increased phytoplankton production, which in turn leads to increased zooplankton production, resulting in growth and development of larger organisms that consume zooplankton, such as rockfish and gray whales. If the timing of upwelling is delayed, then so too is this chain of reactions. As you can see from Figure 1, the red lines show that the peak upwelling this year occurred far later in the summer than any year in the last 10 years, with the exception of 2012. Gray whales may have cued into this delay and therefore also delayed their arrival to the PCFG feeding grounds, hence causing us to have low sighting rates at the start of our season. However, this is mostly speculative as we still do not understand the functional mechanisms by which cetaceans, such as gray whales, detect prey across different scales, and to what extent oceanographic conditions like upwelling may play a role in prey availability (Torres 2017).
Figure 1. 10 year time series of the Coastal Upwelling Transport Index (CUTI). CUTI represents the amount of upwelling (positive numbers) or downwelling (negative numbers). The light-colored lines representthe CUTI at that point in time while the dark, bold line represents the long-term average.The vertical red lines represent the point of peak upwelling in that summer and the horizontal green line shows the peak level of upwelling in 2020 relative to all previous years.
Furthermore, the green line in Figure 1shows that even after peak upwelling was reached this year, upwelling conditions were lower than all the other peaks in the previous 10 years. We know that weak upwelling is correlated to poor body condition of PCFG gray whales in subsequent years (Soledade Lemos et al. 2020). Upon arriving to the Oregon coast feeding grounds, gray whales may have noticed that it was shaping up to be a poor prey year (we certainly noticed it in Port Orford in the emptiness of our zooplankton net). Faced with this low resource availability, individuals had to make important decisions – risk staying in a currently prey-poor environment or continue the journey onward, searching for better prey conditions elsewhere. This conundrum is known as the marginal value theorem, whereby an individual must decide whether it should abandon the patch it is currently foraging on and move on to search for a new patch without knowing how far away the next patch may be or its value relative to the current patch (Charnov 1976). If we think of the Oregon coast as the ‘current patch’, then we can see how the marginal value theorem translates to the situation gray whales may have found themselves in at the start of the summer.
Yet, an individual gray whale does not make these decisions in a vacuum. Instead, all gray whales in the same area are faced with the same conundrum. Seminal work by Pianka (1974) showed that when resources, such as food, are abundant, then competition between predators is low because there is enough food to go around. However, when resources dwindle, competition increases and the niches of predators begin to overlap more and more. With Charnov and Pianka’s theories in mind, we can see two groups of gray whales emerge from our 2020 field work observations: those that stayed in the ‘current patch’ (Oregon) and those that decided to seek out a new patch in hopes that it would be a better one. Solé certainly belongs in the first group. We saw her consistently throughout the whole summer. In fact, she was oftentimes so predictable that we would find her foraging on the same reef complex every time we went out to survey. Smudge may also belong in this group, however it is hard to say definitively since we only survey in Port Orford in late July and August. In contrast, I would place whales such as Spray and Heart in the second group since we saw them early in the summer and then not again until mid-to-late September. Where did they go in the interim? Did they go somewhere else in the PCFG range? Or did they venture all the way up to Alaska to the primary Eastern North Pacific (ENP) gray whale feeding grounds? Did their choice to search for food elsewhere pay off?
As I said earlier, these are all just musings for now, but the GEMM Lab is already hard at work trying to answer these questions. Stay tuned to see what we find!
* Thanks to all the divers who assisted with the pilot CamDo season: Aaron Galloway, Ross Whippo, Svetlana Maslakova, Taylor Eaton, Cori Kane, Austin Williams, Justin Smith
References
Charnov, E.L. 1976. Optimal Foraging, the Marginal Value Theorem. Theoretical Population Biology 9(2):129-136.
Pianka, E.R. 1974. Niche Overlap and Diffuse Competition. PNAS 71(5):2141-2145.
Soledade Lemos, L., Burnett, J.D., Chandler, T.E., Sumich, J.L., and L.G. Torres. 2020. Intra- and inter-annual variation in gray whale body condition on a foraging ground. Ecosphere 11(4):e03094.
Torres, L.G. 2017. A sense of scale: Foraging cetaceans’ use of scale-dependent multimodal sensory systems. Marine Mammal Science 33(4):1170-1193.
Torres, L.G., Nieukirk, S.L., Lemos, L., and T.E. Chandler. 2018. Drone Up! Quantifying Whale Behavior From a New Perspective Improves Observational Capacity. Frontiers in Marine Science: https://doi.org/10.3389/fmars.2018.00319.
When humans count calories it is typically to regulate and limit calorie intake. What I am wondering about is whether gray whales are aware of caloric differences in the prey that is available to them and whether they make foraging decisions based on those differences. In last week’s post, Dawn discussed what makes a good meal for a hungry blue whale. She discussed that total prey biomass of a patch, as well as how densely aggregated that patch is, are the important factors when a blue whale is picking its next meal. If these factors are important for blue whales, is it same for gray whales? Why even consider the caloric value of their prey?
Gray and blue whales are different in many ways; one way is that blue whales are krill specialists whereas gray whales are more flexible foragers. The Pacific Coast Feeding Group (PCFG) of gray whales in particular are known to pursue a more varied menu. Previous studies along the PCFG range have documented gray whales feeding on mysid shrimp (Darling et al. 1998;Newell 2009), amphipods (Oliver et al. 1984; Darling et al. 1998), cumacean shrimp (Jenkinson 2001; Moore et al. 2007;Gosho et al. 2011), and porcelain crab larvae (Dunham and Duffus 2002), to name a few. Based on our observations in the field and from our drone footage, we have observed gray whales feeding on reefs (likely on mysid shrimp), benthically (likely on burrowing amphipods), and at the surface on crab larvae (Fig. 1). Therefore, while both blue and PCFG whales must make decisions about prey patch quality based on biomass and density of the prey, gray whales have an extra decision to make based on prey type since their prey menu items occupy different habitats that require different feeding tactics and amount of energy to acquire them. In light of these reasons, I hypothesize that prey caloric value factors into their decision of prey patch selection.
Figure 1. Gray whales use several feeding tactics to obtain a variety of coastal Oregon zooplankton prey including jaw snapping (0:12 of video), drooling mud (0:21), and head standing (0:32), to name a few.
This prey selection process is crucial since PCFG gray whales only have about 6 months to consume all the food they need to migrate and reproduce (even less for the Eastern North Pacific (ENP) gray whales since their journey to their Arctic feeding grounds is much longer). You may be asking, well if feeding is so important to gray whales, then why not eat everything they come across? Surely, if they ate every prey item they swam by, then they would be fine. The reason it isn’t quite this simple is because there are energetic costs to travel to, search for, and consume food. If an individual whale simply eats what is closest (a small, poor-quality prey patch) and uses up more energy than it gains, it may be missing out on a much more beneficial and rewarding prey patch that is a little further away (that patch may disperse or another whale may eat it by the time this whale gets there). Scientists have pondered this decision-making process in predators for a long time. These ponderances are best summed up by two central theories: the optimal foraging theory (MacArthur & Pianka 1966) and the marginal value theorem (Charnov 1976). If you are a frequent reader of the blog, you have probably heard these terms once or twice before as a lot of the questions we ask in the GEMM Lab can be traced back to these concepts.
Optimal foraging theory (OFT) states that a predator should pick the most beneficial resource for the lowest cost, thereby maximizing the net energy gained. So, a gray whale should pick a prey patch where it knows that it will gain more energy from consuming the prey in the patch than it will lose energy in the process of searching for and feeding on it. Marginal value theorem elaborates on this OFT concept by adding that the predator also needs to consider the cost of giving up a prey patch to search for a new one, which may or may not end up being more profitable or which may take a very long time to find (and therefore cost more energy).
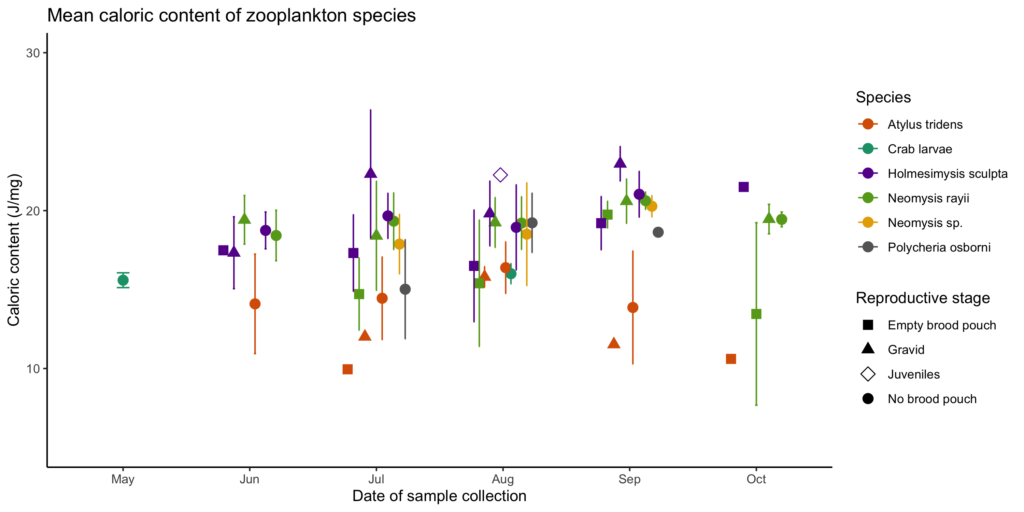
The second chapter of my thesis will investigate whether individual gray whales have foraging preferences by relating feeding location to prey quality (community composition) and quantity (relative density). However, in order to do that, I first must know about the quality of the individual prey species, which is why my first chapter explores the caloric content of common coastal zooplankton species in Oregon that may serve as gray whale prey. The lab work and analysis for that chapter are completed and I am in the process of writing it up for publication. Preliminary results (Fig. 2) show variation in caloric content between species (represented by different colors) and reproductive stages (represented by different shapes), with a potential increasing trend throughout the summer. These results suggest that some species and reproductive stages may be less profitable than others based solely on caloric content.
Figure 2. Mean caloric content (J/mg) of coastal Oregon zooplankton (error bars represent standard deviation) from May-October in 2017-2018. Colors represent species and shapes represent reproductive stage.
Now that we have established that there may be bigger benefits to feeding on some species over others, we have to consider the availability of these zooplankton species to PCFG whales. Availability can be thought of in two ways: 1) is the prey species present and at high enough densities to make searching and foraging profitable, and 2) is the prey species in a habitat or depth that is accessible to the whale at a reasonable energetic cost? Some prey species, such as crab larvae, are not available at all times of the summer. Their reproductive cycles are pulsed (Roegner et al. 2007) and therefore these prey species are less available than species, such as mysid shrimp, that have more continuous reproduction (Mauchline 1980). Mysid shrimp appear to seek refuge on reefs in rock crevices and among kelp, whereas amphipods often burrow in soft sediment. Both of these habitat types present different challenges and energetic costs to a foraging gray whale; it may take more time and energy to dislodge mysids from a reef, but the payout will be bigger in terms of caloric gain than if the whale decides to sift through soft sediment on the seafloor to feed on amphipods. This benthic feeding tactic may potentially be a less costly foraging tactic for PCFG whales, but the reward is a less profitable prey item.
My first chapter will extend our findings on the caloric content of Oregon coastal zooplankton to facilitate a comparison to the caloric values of the main ampeliscid amphipod prey of ENP gray whales feeding in the Arctic. Through this comparison I hope to assess the trade-offs of being a PCFG whale rather than an ENP whale that completes the full migration cycle to the primary summer feeding grounds in the Arctic.
References
Charnov, E. L. 1976. Optimal foraging: the marginal value theorem. Theoretical Population Biology 9:129-136.
Darling, J. D., Keogh, K. E. and T. E. Steeves. 1998. Gray whale (Eschrichtius robustus) habitat utilization and prey species off Vancouver Island, B.C. Marine Mammal Science 14(4):692-720.
Dunham, J. S. and D. A. Duffus. 2002. Diet of gray whales (Eschrichtius robustus) in Clayoquot Sound, British Columbia, Canada. Marine Mammal Science 18(2):419-437.
Gosho, M., Gearin, P. J., Jenkinson, R. S., Laake, J. L., Mazzuca, L., Kubiak, D., Calambokidis, J. C., Megill, W. M., Gisborne, B., Goley, D., Tombach, C., Darling, J. D. and V. Deecke. 2011. SC/M11/AWMP2 submitted to International Whaling Commission Scientific Committee.
Jenkinson, R. S. 2001. Gray whale (Eschrichtius robustus) prey availability and feeding ecology in Northern California, 1999-2000. Master’s thesis, Humboldt State University.
MacArthur, R. H., and E. R. Pianka. 1966. On optimal use of a patchy environment. American Naturalist 100:603-609.
Mauchline, J. 1980. The larvae and reproduction in Blaxter, J. H. S., Russell, F. S., and M. Yonge, eds. Advances in Marine Biology vol. 18. Academic Press, London.
Moore, S. E., Wynne, K. M., Kinney, J. C., and C. M. Grebmeier. 2007. Gray whale occurrence and forage southeast of Kodiak Island, Alaska. Marine Mammal Science 23(2)419-428.
Newell, C. L. 2009. Ecological interrelationships between summer resident gray whales (Eschrichtius robustus) and their prey, mysid shrimp (Holmesimysis sculpta and Neomysis rayii) along the central Oregon coast. Master’s thesis, Oregon State University.
Oliver, J. S., Slattery, P. N., Silberstein, M. A., and E. F. O’Connor. 1984. Gray whale feeding on dense ampeliscid amphipod communities near Bamfield, British Columbia. Canadian Journal of Zoology 62:41-49.
Roegner, G. C., Armstrong, D. A., and A. L. Shanks. 2007. Wind and tidal influences on larval crab recruitment to an Oregon estuary. Marine Ecology Progress Series 351:177-188.
There is something special about the Oregon Coast. It’s like nowhere else in the world. When Lisa told me that gray whales are understudied on our coastline, I secretly and selfishly thought to myself, “I hope it stays that way”. Then I would have a chance to be a pioneer one day too, studying something along this rugged coast full of life, death and everything in between, that no one has answered before. Of course, I only feel this way half of the time.
Yet, the more time I spend in Port Orford, the more I realize that our coastline truly is one of those last frontiers. A place where fundamental questions have yet to be explored, where the passing of seasons brings with it a violent change in conditions. From sunny summer days on the Port Orford beaches taking in the soft glistening of sunlight illuminating Redfish Rocks Marine Reserve, to cold, dark and stormy months with no end in sight and nothing but the sound of wind curving around the bends of your home and rain puttering against the windows.
Noah reading a book on the cliff site with a view of Mill Rocks in the background. Source: N. Dolinajec.
But no matter the season, no matter the conditions, the Oregon Coast harnesses something truly special, truly extraordinary. A cyclical diversity of life.
Since I was a kid, the Oregon Coast has inspired me. Not always to think about wildlife, in fact, mostly in other ways. To contemplate more primal philosophical questions. At 28 years old, it’s been a longer road than expected to get to this point, working with these amazing people, in this amazing place, on this amazing project. And the more time that passes, the more failures, missteps and dysfunctional experiences I absorb, the more that I learn about what really needs to change. In the world of course, but, mostly in science.
In the past few years, as I eek closer to 30, and I begin to look back on some of the adventures I have taken in my life, I take heavy note of where I am now, sitting on a kayak in Mill Rocks sampling for gray whale prey abundance and distribution, or atop the cliff, gazing out into the open ocean waiting patiently and graciously (at least trying to be) for a small poof of water spray from the beating surface of the sea. That little poof? It may not seem like much but it’s a sign of life. Of an age-old journey, one we know very little about. And here I am, a part of it, albeit a small one, but nevertheless, forever a part of that great journey.
A foggy view of Mill Rocks from the cliff (left) and a shot from the kayak (right). Source: N. Dolinajec.
And without losing sight of my job, sampling for zooplankton or tracking the whales as they move across the open water, I’ve found myself thinking about the depth of being involved in such an ancient process, and considering a very important question. One that doesn’t spend nearly enough time in the day-to-day conversation of an academic…
What exactly is a scientist? And how does one become a scientist?
The academic path to the sciences is exclusionary, beyond any reasonable level. It discriminates on gender, race, experience and age. Making the sciences, which are meant as a tool to better the world and make useful contributions to society and the future, feel inaccessible for so many people full of potential but without the right boxes ticked on a form.
How many beautiful ideas have been left to decay because of the ego that science has built for itself?
A sign that sits in the front window of the OSU Port Orford Field Station. Source: N. Dolinajec.
Don’t get me wrong, I love science, it has given me joy that other things in life cannot. It has shown me both the complexity of the world and the simplicity of how we view it. And I believe that science can still be the future. But in order for science to command our future, to guide us in the right direction, it cannot be a hierarchy of antiquated procedures any longer. We must open our arms, our minds and our resources to take chances on students, far and wide, that may lack traditional training but instead have other skills or experiences to offer science. Science needs an overhaul. Science needs diversity.
After all, change of perspective can be a profound driver of scientific results, can it not?
Here in Port Orford, in this bizarre year of 2020, we have the beginning, the makings if-you-will, of that very diversity that I am speaking of. The four of us, ‘The Theyodelers’ as we righteously call ourselves, each come from such drastically different places in life only to meet under the same roof for 6 weeks and miraculously not only survive together, but thrive together.
‘The Theyodelers’ after the 2020 (virtual) Port Orford Community Presentation, from left to right: Dr. Leigh Torres, Lisa Hildebrand, Liz Kelly, Mattea Holt Colberg, Noah Dolinajec, Tom Calvanese, Tom McCambridge (front). Source: L. Hildebrand.
And that, that essence of positivity that we have been able to build around one another this season, is exactly what I mean when I say that science needs an overhaul.
We do not all find our way to this moment, doing science in such an inspiring place, in the same way. Some of us are born with the innate ability to see the world through objective eyes, the kind of mind that makes great science happen from an early age. And others find our way to science after being enlightened by trials and travails, failures and mistakes, missed opportunities and missteps.
No matter the journey, we all ended up here. Watching these great gray giants on their journeys.
And it all comes full circle doesn’t it?
Each of our journeys, human or whale, can lead to the very same point despite beginning at very different places. And in that diversity of experience, of life, of age, of color, is where we find our brightest moments, our grandest ideas and our future, driven by science.
By Elizabeth Kelly, Pacific High School senior, GEMM Lab summer intern
Figure 1. Liz on the cliff. Source: E. Kelly.
The gray whale foraging ecology project with OSU’s GEMM Lab has been nothing short of a dream come true. Going into this internship, I was just a high schooler who had taken zoology my previous school year. With my lack of a formal education in marine biology, let alone gray whales, I was a little daunted at the thought of going to a university field station with college students and actual biologists. When I applied for this internship, I didn’t think I was even going to be accepted for the internship, but I applied with high hopes and a lot of excitement. When I was officially accepted, I wanted to start immediately.
Despite my concerns of the steep learning curves I knew I would have to overcome, I was ready to jump right into the internship. The other interns live at the field station since they do not live locally, but I drive to the field station every morning because I live about 20 minutes away. However, this situation has never made me feel like an outsider. I spend a lot of my time at the field station and it would be hard to not get comfortable there immediately. I don’t feel sad that somebody is cooking some sort of delicious meal every night because even though I don’t live at the station, I sometimes stay for dinners. When I’m there for whatever reason, whether it be while working or eating and hanging out after a day of working or during breaks, I never feel out of my depth socially or even academically even though I am clearly younger and less experienced. The environment and team here, which is made up of scholarly individuals with lots of personality and character, is never judgemental or patronizing; rather it is inviting and the graduate student intern, Noah, and my team leader, Lisa, give off a feeling of mentorship. This has made my internship fun and given me far more of an interest and intent towards pursuing Wildlife Sciences after high school.
Figure 2. A photo taken by Liz today on the cliff as a whale traveled from Tichenor Cove to Mill Rocks. Source: GEMM Lab.
While there have been tedious parts of the internship with a steep learning curve, including asking many questions about whales, and learning to use different programs, tools and methods, it all pays off and comes in handy when the whole focus of the work comes through town – the famous gray whales. During this field season we have been having low whale sightings for the first 4 weeks (but our sightings are slowly picking up over the last couple days), so the waiting for the grand appearance of a whale can feel eternal. Though, when the red curtains reveal a blow out in the distance headed our way, the feeling of boredom when staring at the ocean is completely forgotten. Suddenly, everyone jumps to action – the theodolite’s position needs to be adjusted as we try to pinpoint where the whale will surface next after its dive.
Figure 3. A zoomed-in photo from the kayak of a gray whale headstanding (a feeding behavior) in Tichenor Cove. Source: E. Kelly.
Recently we have been collecting larger samples of zooplankton when sampling from our research kayak, and the whales have been coming in larger numbers too. Every time I see a whale while I am out on the kayak I am crippled with excitement and adrenaline. There is absolutely nothing like seeing these majestic mammals out and about in their day-to-day lives. I love when I get to see them forage, blow, shark, and even do headstands in the water. When we see them forage in a spot that is not one of our regular zooplankton sampling stations we do some adaptive sampling (sampling at spots where we see whales actively feeding), and so far the whales haven’t lied to me about where the zooplankton is. I’m very curious as to how the whales know where the higher concentrations of zooplankton are, even in low visibility (we have had plenty of that this year too). Nevertheless, they know and aren’t shy about getting what they want.
The only downfall of this internship is that it ends soon. I have thoroughly enjoyed my time with my team and at the field station. This in-the-field experience is one of a kind. Even though I didn’t think I was going to receive this internship, I really wanted it and now that I have had it and am finishing up with it, I am so grateful for the knowledge and experiences I have gained from it and look forward to the opportunities it will further grant me.