Never a Straight Path

By Florence Sullivan, MSc, GEMM Lab Graduate

It’s rather amazing how, in a span of five years, the journey of your life can take twists and turns that you never expected. Long time blog readers may remember me as the graduate student who began this blog way back in February of 2015 with a recitation of our lab’s very first science outreach event. Since then, I completed my master’s thesis investigating gray whale foraging ecology (a project that just finished its 6th field season thanks to the excellent leadership of Lisa Hildebrand), fulfilled a dream of working as a marine mammal observer, and survived the existential crisis of graduation and job searching.

None of the species we study in this lab forage in straight lines.  If we consider a job (and salary) as the mechanism by which most of us put food on the table (i.e. foraging) why should our path be any less complex than theirs? By April 2018, I had moved back in with my parents in Seattle and was thoroughly heartsick about how long my job search was taking, so I jumped on the first field opportunity that came my way.  The project was billed as an attempt to pair discrete killer whale behaviors to specific call sequences, with collaborators from a variety of countries and backgrounds. In my enthusiasm, I ignored some red flags, and paid for it with a field season where I (1) experienced my first person-overboard situation, (2) witnessed steady verbal harassment, (3) was injured when our live-aboard trimaran was run aground on a clearly marked reef, and (4) ended up committing mutiny and leaving the project early.  There have been encouraging discussions in the marine science community recently about the barriers that women & early career scientists face while in the field, particularly with regard to accessibility, equity, and unpaid/underpaid internships. I will add some learned lessons to the list of things one should consider before embarking on a new research endeavor:

  • If someone says they are affiliated with a university, but will not give you a project or lab website because ‘the project is quite delicate, we don’t want other folks stealing our work’, check that they actually do have university affiliations and aren’t misrepresenting their connections. Do some homework.
  • Don’t cross a border without a contract, and when repeated attempts to secure a description of your responsibilities and payment are put off until later, consider that this might be a pattern of behavior.
  • If you were told that you would work under a senior bioacoustician, and you show up to find that your new colleague had been told the same thing, but neither of you has more than a MSc degree or much experience with acoustics, add this to your tally of red flags.
  • If basic safety standards (like wearing a life jacket on deck) are being ignored, hold yourself to a higher standard, and lead by example.
  • If sustained verbal and emotional abuse is occurring, you still have not been paid, and you’ve been asked to keep working after being injured in an accident caused by negligence, it is ok to break faith and leave a project.

Entering this project, I was very keen to learn new skills in acoustics, study a new species, and build partnerships with international researchers. Instead, I learned about interpersonal conflict and resolution strategies.  So, time for a new plan & another bend in my path. Thankfully, I have the immense privilege of a capable, employed husband who was able to support me while I recovered and began a new job search.

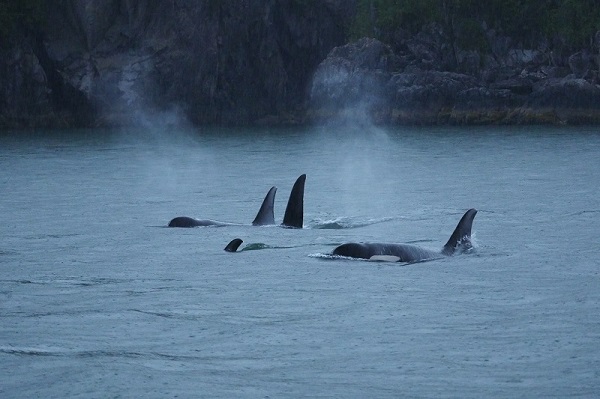
A pod of northern resident orcas resting during the rain, British Columbia. Photo credit: F. Sullivan
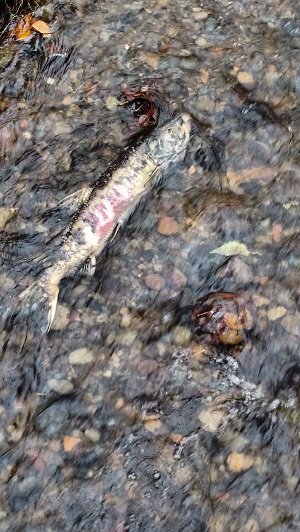
As salmon migrate upriver, their bodies undergo drastic changes in coloration, and once they spawn, they die. Their decomposing carcasses provide a critical influx of nutrients to the river and forest ecosystems of the Pacific Northwest. Photo credit: F. Sullivan

In the year that followed, I joined the team at the Environmental Science Center and taught 3rd -10th graders how to be “Salmon Heroes”. I explained salmon ecology, taking them on field experiences where we dissected salmon, measured oxygen and nitrogen levels in salmon streams, assessed habitat quality, observed migration and spawning behaviors (when fish cooperated), and brainstormed ways to protect these special (and delicious) fish. 

When salmon season came to an end, we transitioned to the “Beach Hero” program, targeted at K-3rd grade, where I became part of the classroom team, teaching intertidal ecology before bringing the kids to the beach where many of them experienced low tide for the first time.  In keeping with the education theme, I also worked with South Sound Nature School to provide kids with a forest-based after school program and was a summer camp counselor at Camp Long for several weeks. Still, I continued to try to find my way back to research and a data-driven career.

This is a sea star, it turns its stomach inside out to eat mussels! (we had awesome puppets for demonstration). Photo credit: Kharli Rose

Another bend in my ‘foraging’ job search happened when I stumbled across a short term data contract at my local election office while searching the state and county job boards. Washington State is a vote-by-mail state, and with a record turn-out in the 2018 mid-term elections they needed help updating everyone’s contact information & verifying signatures.  Let me tell you, staring at a computer screen, deciphering people’s handwriting to add emails and phone numbers to their voter registration for 8 hours a day for 6 weeks was not particularly fun. Yet, it gave me a little more experience in government databases, and gave me a lot of confidence in my election office for how transparent they are about every step of the voting process. I can’t speak for anywhere else, but in King County (Washington), you can go visit the election office & give yourself a self-guided walking tour of the whole ballot counting process from arrival to sorting to signature verification and opening to tallying. (There’s a hallway with massive windows surrounding the giant open concept floor space where everything happens, so you can observe without interfering). I’d never thought about what happens to my ballot after I mail it before, and its rather fascinating. Speaking of which, Please Vote!

Frustrated by a job search that failed to yield anything with health benefits or more than part-time hours, my Dad suggested that I apply to the University of Washington Continuing Education program, and enroll in a professional certificate to add another explicit skill to my resume. When enough pressure is applied to the system, something has to give eventually. The month where I was accepted to the UW Certificate in Statistical Analysis with R Programming was also the month I started interviewing for the Research Analyst Position at the Pacific Whale Foundation.  Partially because I could prove my data management experience, and that I was serious about continuing to hone my skiIls, I was offered, and accepted the position! Hilariously or stressfully, however you want to look at it, I moved to Maui, began my new position, and started my statistics with R programming coursework all in the same week – the learning curve was STEEP.

Amazingly, Leila (another GEMM Lab alumn) was visiting Maui the week I moved, and we were able to have dinner together my first night on-island! Photo credit: Leila Lemos

I completed my certificate in June, and hit my one-year work anniversary last month! I’m responsible for a good portion of our database management, and use R coding on a daily basis to pull data requests, tidy historical data, and add new information.  I’d never been to Maui before moving here, but now I’ve experienced the glory of Humpback whale breeding & calving season and heard whale song underwater. I’ve helped collect important life history data for false killer whales, spotted, spinner & bottlenose dolphins, and I’m looking forward to encountering more new-to-me odontocete species. It took months before I felt like I was past the ‘onboarding’ information stage, but now I’m collaborating with my colleagues on my first data analysis project (rather than simple data management) and loving my team despite the wrenches that the pandemic has thrown in our work. My job search = cetacean foraging analogy breaks down a little at this point, but my story still stands. I acknowledge my privilege of a good education and supportive husband, but I have this suggestion for job seekers: Don’t be afraid to get creative while you search for the right position, because you never know what you might stumble across and learn along the way. In the process, do your best to catch red flags, and keep yourself out of dangerous positions.  My job search hasn’t been a straight path, but that doesn’t mean it wasn’t full of small victories, and it did ultimately lead to a successful “prey patch”.

A pod of northern resident orcas traveling along the outer coast of British Columbia.

What makes a good meal for a hungry whale?

By Dawn Barlow, PhD student, OSU Department of Fisheries and Wildlife, Geospatial Ecology of Marine Megafauna Lab

In the vast and dynamic marine environment, food is notoriously patchy and ephemeral [1]. Predators such as marine mammals and seabirds must make a living in this dynamic environment by locating and capturing those prey patches. Baleen whales such as blue and humpback whales have a feeding strategy called “lunge feeding”, whereby they accelerate forward and open their massive jaws, engulf prey-laden water in their buccal pouch that expands like an accordion, and filter the water out through baleen plates so that they are left with a mouthful of food (Fig. 1) [2]. This approach is only efficient if whales can locate and target dense prey patches that compensate for the energetic costs of diving and lunging [3]. Therefore, not only do these large predators need to locate enough food to survive in the expansive and ever-changing ocean, they need to locate food that is dense enough to feed on, otherwise they actually lose more energy by lunging than they gain from the prey they engulf.

Figure 1. Schematic of a humpback whale lunge feeding on a school of fish. Illustration by Alex Boersma.

Why do baleen whales rely on such a costly feeding approach? Interestingly, this tactic emerged after the evolution of schooling behavior of prey such as zooplankton and forage fish (e.g., herring, anchovy, sand lance) [4]. Only because the prey aggregate in dense patches can these large predators take advantage of them by lunge feeding, and by engulfing a whole large patch they efficiently exploit these prey patches. Off the coast of California, where krill aggregations are denser in deeper water, blue whales regularly dive to depths of 100-300 m in order to access the densest krill patches and get the most bang for their buck with every lunge [5]. In New Zealand, we have found that blue whales exploit the dense krill patches near the surface to maximize their energetic gain [6], and have documented a blue whale bypassing smaller krill patches that presumably were not worth the effort to feed on.

By now hopefully I have convinced you of the importance of dense prey patches to large whales looking for a meal. It is not necessarily only a matter of total prey biomass in an area that is important to a whale, it is whether that prey biomass is densely aggregated. What makes for a dense prey patch? Recent work has shown that forage species, namely krill and anchovies, swarm in response to coastal upwelling [7]. While upwelling events do not necessarily change the total biomass of prey available to a whale over a spatial area, they may aggregate prey to a critical density to where feeding by predators becomes worthwhile. Forage species like zooplankton and small fish may school because of enhanced food resources, for predator avoidance, or reproductive grouping. While the exact behavioral reason for the aggregation of prey may still only be partially understood, the existence of these dense patches allows the largest animals on the planet to survive.

Another big question is, how do whales actually find their food? In the vast, seemingly featureless, and ever-changing ocean environment, how does a whale know where to find a meal, and how do they know it will be worthwhile before they take a lunge? In a review paper written by GEMM Lab PI Dr. Leigh Torres, she suggests it is all a matter of scale [8]. On a very large scale, baleen whales likely rely on oceanographic stimuli to home in on areas where prey are more likely to be found. Additionally, recent work has demonstrated that migrating blue whales return to areas where foraging conditions were best in previous years, indicating a reliance on memory [9,10]. On a very fine scale, visual cues may inform how a blue whale chooses to lunge [6,8,11].

What does it matter what a blue whale’s favorite type of meal is? Besides my interest in foundational research in ecology such as predator-prey dynamics, these questions are fundamental to developing effective management approaches for reducing impacts of human activities on whales. In the first chapter of my PhD, I examined how oceanographic features of the water column structure krill aggregations, and how blue whale distribution is influenced by oceanography and krill availability [12]. Currently, I am deep into my second chapter, analyzing the pathway from wind to upwelling to krill to blue whales in order to better understand the links and time lags between each step. Understanding the time lags will allow us to make more informed models to forecast blue whale distribution in my third chapter. Environmental managers in New Zealand plan to establish a protected area to conserve the population of blue whales that I study [13] on their foraging grounds. Understanding where blue whales will be distributed, and consequently how their distribution patterns might shift with environmental conditions or overlap with human activities, comes down the fundamental question I started this blog post with: What makes a good meal for a hungry whale?

References

1.        Hyrenbach KD, Forney KA, Dayton PK. 2000 Marine protected areas and ocean basin management. Aquat. Conserv. Mar. Freshw. Ecosyst. 10, 437–458. (doi:10.1002/1099-0755(200011/12)10:6<437::AID-AQC425>3.0.CO;2-Q)

2.        Goldbogen JA, Cade DE, Calambokidis J, Friedlaender AS, Potvin J, Segre PS, Werth AJ. 2017 How Baleen Whales Feed: The Biomechanics of Engulfment and Filtration. Ann. Rev. Mar. Sci. 9, 367–386. (doi:10.1146/annurev-marine-122414-033905)

3.        Goldbogen JA, Calambokidis J, Oleson E, Potvin J, Pyenson ND, Schorr G, Shadwick RE. 2011 Mechanics, hydrodynamics and energetics of blue whale lunge feeding: efficiency dependence on krill density. J. Exp. Biol. 214, 131–146. (doi:10.1242/jeb.048157)

4.        Cade DE, Carey N, Domenici P, Potvin J, Goldbogen JA. 2020 Predator-informed looming stimulus experiments reveal how large filter feeding whales capture highly maneuverable forage fish. Proc. Natl. Acad. Sci. U. S. A. (doi:10.1073/pnas.1911099116)

5.        Hazen EL, Friedlaender AS, Goldbogen JA. 2015 Blue whales (Balaenoptera musculus) optimize foraging efficiency by balancing oxygen use and energy gain as a function of prey density. Sci. Adv. 1, e1500469–e1500469. (doi:10.1126/sciadv.1500469)

6.        Torres LG, Barlow DR, Chandler TE, Burnett JD. 2020 Insight into the kinematics of blue whale surface foraging through drone observations and prey data. PeerJ (doi:10.7717/peerj.8906)

7.        Benoit-Bird KJ, Waluk CM, Ryan JP. 2019 Forage Species Swarm in Response to Coastal Upwelling. Geophys. Res. Lett. 46, 1537–1546. (doi:10.1029/2018GL081603)

8.        Torres LG. 2017 A sense of scale: Foraging cetaceans’ use of scale-dependent multimodal sensory systems. Mar. Mammal Sci. 33, 1170–1193. (doi:10.1111/mms.12426)

9.        Abrahms B et al. 2019 Memory and resource tracking drive blue whale migrations. Proc. Natl. Acad. Sci. U. S. A. (doi:10.1073/pnas.1819031116)

10.      Szesciorka AR, Ballance LT, Širovi A, Rice A, Ohman MD, Hildebrand JA, Franks PJS. 2020 Timing is everything: Drivers of interannual variability in blue whale migration. Sci. Rep. 10, 1–9. (doi:10.1038/s41598-020-64855-y)

11.      Friedlaender AS, Herbert-Read JE, Hazen EL, Cade DE, Calambokidis J, Southall BL, Stimpert AK, Goldbogen JA. 2017 Context-dependent lateralized feeding strategies in blue whales. Curr. Biol. (doi:10.1016/j.cub.2017.10.023)

12.      Barlow DR, Bernard KS, Escobar-Flores P, Palacios DM, Torres LG. 2020 Links in the trophic chain: Modeling functional relationships between in situ oceanography, krill, and blue whale distribution under different oceanographic regimes. Mar. Ecol. Prog. Ser. (doi:https://doi.org/10.3354/meps13339)

13.      Barlow DR et al. 2018 Documentation of a New Zealand blue whale population based on multiple lines of evidence. Endanger. Species Res. 36, 27–40. (doi:https://doi.org/10.3354/esr00891)

Connecting Research Questions

Clara Bird, Masters Student, OSU Department of Fisheries and Wildlife, Geospatial Ecology of Marine Megafauna Lab

The field season can be quite a hectic time of year. Between long days out on the water, trouble-shooting technology issues, organizing/processing the data as it comes in, and keeping up with our other projects/responsibilities, it can be quite overwhelming and exhausting.

But despite all of that, it’s an incredible and exciting time of year. Outside of the field season, we spend most of our time staring at our computers analyzing the data that we spend a relatively short amount of time collecting. When going through that process it can be easy to lose sight of why we do what we do, and to feel disconnected from the species we are studying. Oftentimes the analysis problems we encounter involve more hours of digging through coding discussion boards than learning about the animals themselves. So, as busy as it is, I find that the field season can be pretty inspiring. I have recently been looking through our most recent drone footage of gray whales and feeling renewed excitement for my thesis.

At the moment, my thesis has four central questions: (1) Are there associations between habitat type and gray whale foraging tactic? (2) Is there evidence of individualization? (3) What is the relationship between behavior and body condition? (4) Do we see evidence of learning in the behavior of mom and calf pairs? As I’ve been organizing my thoughts, what’s become quite clear is how interconnected these questions are. So, I thought I’d take this blog to describe the potential relationships.

Let’s start with the first question: are there associations between habitat types and gray whale foraging tactics? This question is central because it relates foraging behavior to habitat, which is ultimately associated with prey. This relationship is the foundation of all other questions involving foraging tactics because food is necessary for the whales to have the energy and nutrients they need to survive. It’s reasonable to think that the whales are flexible and use different foraging tactics to eat different prey that live in different habitats. But, if different prey types have different nutritional value (this is something that Lisa is studying right now; check out the COZI project to learn more), then not all whales may be getting the same nutrients.

The next question relates to the first question but is not necessarily dependent on it. It’s the question of individualization, a topic Lisa also explored in a past blog. Within our Oregon field sites we have documented a variety of gray whale foraging tactics (Torres et al. 2018; Video 1) but we do not know if all gray whales use all the tactics or if different individuals only use certain tactics. While I think it’s unlikely that one whale only uses one tactic all the time, I think we could see an individual use one tactic more often than the others. I reason that there could be two reasons for this pattern. First, it could be a response to resource availability; certain tactics are more efficient than others, this could be because the tactic involves capturing the more nutritious prey or because the behavior is less energetically demanding. Second, foraging tactics are socially learned as calves from their mothers, and hence individuals use those learned tactics more frequently. This pattern of maternally inherited foraging tactics has been documented in other marine mammals (Mann and Sargeant 2009; Estes et al. 2003). These questions between foraging tactic, habitat and individualization also tie into the remaining two questions.

My third question is about the relationship between behavior and body condition. As I’ve discussed in a previous blog, I am interested in assessing the relative energetic costs and benefits of the different foraging tactics. Is one foraging tactic more cost-effective than another (less energy out per energy in)? Ever since our lab’s cetacean behavioral ecology class, I’ve been thinking about how my work relates to niche partitioning theory (Pianka 1974).This theory states that when there is low prey availability, niche partitioning will increase. Niche partitioning can occur across several different dimensions: for instance, prey type, foraging location, and time of day when active. If gray whales partition across the prey type dimension, then different whales would feed on different kinds of prey. If whales partition resources across the foraging location dimension, individuals would feed in different areas. Lastly, if whales partition resources across the time axis, individuals would feed at different times of day. Using different foraging tactics to feed on different prey would be an example of partitioning across the prey type dimension. If there is a more preferable prey type, then maybe in years of high prey availability, we would see most of the gray whales using the same tactics to feed on the same prey type. However, in years of low prey availability we might expect to see a greater variety of foraging tactics being used. The question then becomes, does any whale end up using the less beneficial foraging tactic? If so, which whales use the less beneficial tactic? Do the same individuals always switch to the less beneficial tactic? Is there a common characteristic among the individuals that switched, like sex, age, size, or reproductive status? Lemos et al. (2020) hypothesized that the decline in body condition observed from 2016 to 2017 might be a carryover effect from low prey availability in 2016. Could it be that the whales that use the less beneficial tactic exhibit poor body condition the following year?

My fourth, and final, question asks if foraging tactics are passed down from moms to their calves. We have some footage of a mom foraging with her calf nearby, and occasionally it looks like the calf could be copying its mother. Reviewing this footage spiked my interest in seeing if there are similarities between the behavior tactics used by moms and those used by their calves after they have been weaned. While this question clearly relates to the question of individualization, it is also related to body condition: what if the foraging tactics used by the mom is influenced by her body condition at the time?

I hope to answer some of these fascinating questions using the data we have collected during our long field days over the past 6 years. In all likelihood, the story that comes together during my thesis research will be different from what I envision now and will likely lead to more questions. That being said, I’m excited to see how the story unfolds and I look forward to sharing the evolving ideas and plot lines with all of you.

References

Estes, J A, M L Riedman, M M Staedler, M T Tinker, and B E Lyon. 2003. “Individual Variation in Prey Selection by Sea Otters: Patterns, Causes and Implications.” Source: Journal of Animal Ecology. Vol. 72.

Mann, Janet, and Brooke Sargeant. 2009. “ Like Mother, like Calf: The Ontogeny of Foraging Traditions in Wild Indian Ocean Bottlenose Dolphins ( Tursiops Sp.) .” In The Biology of Traditions, 236–66. Cambridge University Press. https://doi.org/10.1017/cbo9780511584022.010.

Pianka, Eric R. 1974. “Niche Overlap and Diffuse Competition” 71 (5): 2141–45.

Soledade Lemos, Leila, Jonathan D Burnett, Todd E Chandler, James L Sumich, and Leigh G. Torres. 2020. “Intra‐ and Inter‐annual Variation in Gray Whale Body Condition on a Foraging Ground.” Ecosphere 11 (4). https://doi.org/10.1002/ecs2.3094.

Torres, Leigh G., Sharon L. Nieukirk, Leila Lemos, and Todd E. Chandler. 2018. “Drone up! Quantifying Whale Behavior from a New Perspective Improves Observational Capacity.” Frontiers in Marine Science 5 (SEP). https://doi.org/10.3389/fmars.2018.00319.

Dolphin Diets: Common bottlenose dolphin prey preferences off California

By: Alexa Kownacki, Ph.D. Student, OSU Department of Fisheries and Wildlife, Geospatial Ecology of Marine Megafauna Lab 

Humans are fascinated by food. We want to know its source, its nutrient content, when it was harvested and by whom, and so much more. Since childhood, I was the nagging child who interrogated wait staff about the seafood menu because I cared about the sustainability aspect as well as consuming ethically-sourced seafood. Decades later I still do the same: ask a myriad of questions from restaurants and stores in order to eat as sustainably as possible. But in addition to asking these questions about my food, I also question what my study species eats and why. My study populations, common bottlenose dolphins, are described as top opportunistic predators (Norris and Prescott 1961, Shane et al. 1986, Barros and Odell 1990). In my study area off of California, this species exists in two ecotypes. The coastal ecotype off of California, USA are generalist predators, feeding on many different species of fish using different foraging techniques (Ballance 1992, Shane 1990). The offshore ecotype, on the other hand, is less well-studied, but is frequently observed in association with sperm whales, although the reason is still unknown (Díaz-Gamboa et al. 2018). Stable isotope analysis from skin samples from the two ecotypes indicates that the ecotypes exhibit different foraging strategies based on different isotopic carbon and nitrogen levels (Díaz-Gamboa et al. 2018).

Growing up, I kept the Monterey Bay Aquarium’s Seafood Watch Guide with me to choose the most sustainably-sourced seafood at restaurants. Today there is an easy-to-use application for mobile phones that replaced the paper guide. (Image Source: https://www.seafoodwatch.org/)

Preliminary and historical data on common bottlenose dolphins (Tursiops truncatus) suggest that the coastal ecotype spend more time near estuary mouths than offshore dolphins (Ballance 1992, Kownacki et al. unpublished data). Estuaries contain large concentrations of nutrients from runoff, which support zooplankton and fishes. It is for this reason that these estuaries are thought to be hotspots for bottlenose dolphin foraging. Some scientists hypothesize that these dolphins are estuarine-based prey specialists (Barros and Odell 1990), or that the dolphins simply aggregate in estuaries due to higher prey abundance (Ballance 1992).

Coastal bottlenose dolphins traveling near an estuary mouth in San Diego, CA. (Photographed under NOAA NMFS Permit # 19091).

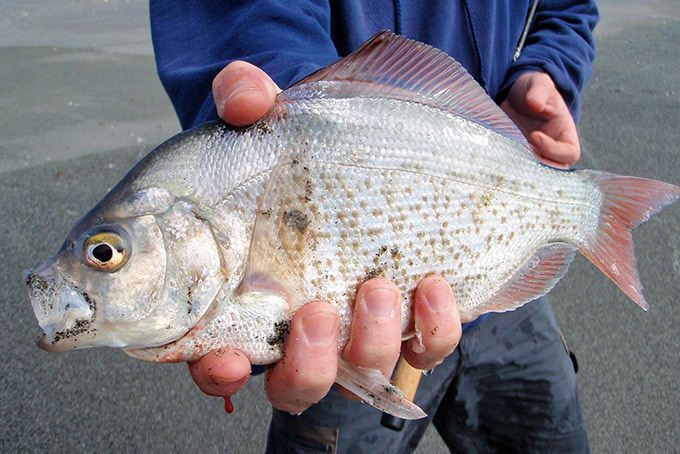
In an effort to understand diet compositions of bottlenose dolphins, during coastal surveys seabirds were recorded in association with feeding groups of dolphins. Therefore, it is reasonable to believe that dolphins were feeding on the same fishes as Brown pelicans, blue-footed and brown boobies, double-crested cormorants, and magnificent frigatebirds, seeing as they were the most common species associated with bottlenose dolphin feeding groups (Ballance 1992). A shore-based study by Hanson and Defran (1993) found that coastal dolphins fed more often in the early morning and late afternoon, as well as during periods of high tide current. These patterns may have to do with the temporal and spatial distribution of prey fish species. From the few diet studies conducted on these bottlenose dolphins in this area, 75% of the prey were species from the families Ebiotocidae (surf perches) and Sciaendae (croakers) (Norris and Prescott 1961, Walker 1981). These studies, in addition to optimal foraging models, suggest this coastal ecotype may not be as much of a generalist as originally suggested (Defran et al. 1999).

A redtail surfperch caught by a fisherman from a beach in San Diego, CA. These fish are thought to be common prey of coastal bottlenose dolphins. (Image Source: FishwithJD)

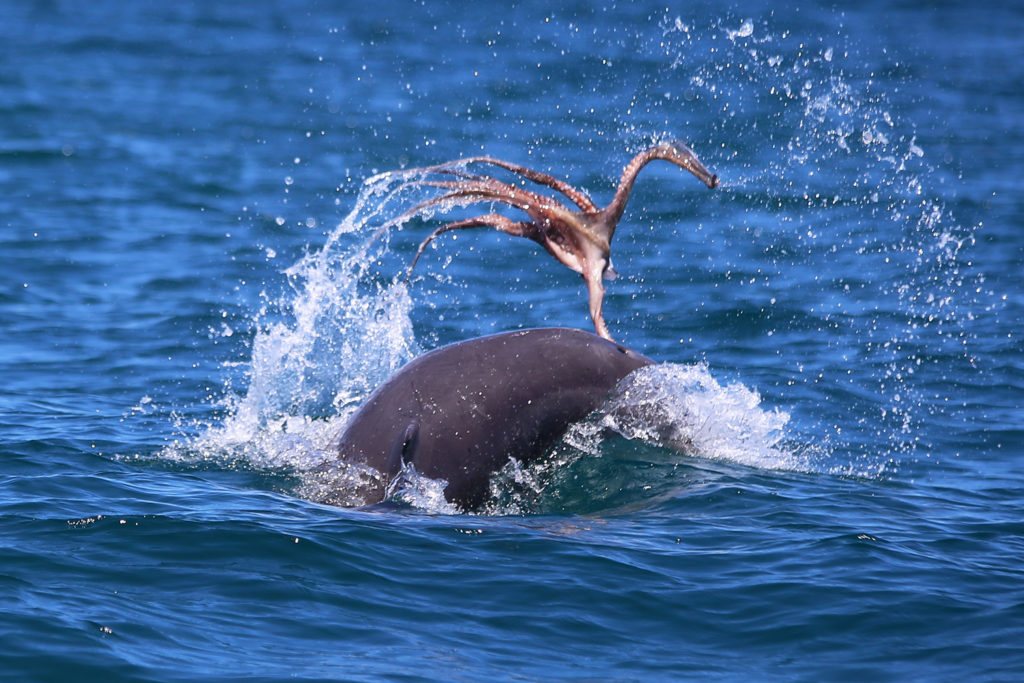
Diet studies on the offshore ecotype of bottlenose dolphins worldwide show a preference for cephalopods, similar to other toothed cetaceans who occupy similar regions, such as Risso’s dolphin, sperm whales, and pilot whales (Clarke 1986, Cockcroft and Ross 1990, Gonzalez et al. 1994, Barros et al. 2000, Walker et al. 1999). Because these animals seldom strand on accessible beaches, stomach contents analyses are limited to few studies and isotope analysis is more widely available from biopsies. We know these dolphins are sighted in deeper waters than the habitat of coastal dolphins where there are fewer nutrient plumes, so it is reasonable to hypothesize that the offshore ecotype consumes different species and may be more specialized than the coastal ecotype.

An bottlenose dolphin forages on an octopus. (Image source: Mandurah Cruises)

For a species that is so often observed from shore and boats, and is known for its charisma, it may be surprising that the diets of both the coastal and offshore bottlenose dolphins are still largely unknown. Such is the challenge of studying animals that live and feed underwater. I wish I could simply ask a dolphin, much like I would ask staff at restaurants: what is on the menu today? But, unfortunately, that is not possible. Instead, we must make educated hypotheses about the diets of both ecotypes based on necropsies and stable isotope studies, and behavioral and spatial surveys. And, I will continue to look to new technologies and creative thinking to provide the answers we are seeking.

Literature cited:

Ballance, L. T. (1992). Habitat use patterns and ranges of the bottlenose dolphin in the Gulf of California, Mexico. Marine Mammal Science8(3), 262-274.

Barros, N.B., and D. K. Odell. (1990). Food habits of bottlenose dolphins in the southeastern United States. Pages 309-328 in S. Leatherwood and R. R. Reeves, eds. The bottlenose dolphin. Academic Press, San Diego, CA.

Barros, N., E. Parsons and T. Jefferson. (2000). Prey of bottlenose dolphins from the South China Sea. Aquatic Mammals 26:2–6.

Clarke, M. 1986. Cephalopods in the diet of odontocetes. Pages 281–321 in M. Bryden and R. Harrison, eds. Research on dolphins. Clarendon Press, Oxford, NY.

Cockcroft, V., and G. Ross. (1990). Food and feeding of the Indian Ocean bottlenose dolphin off southern Natal, South Africa. Pages 295–308 in S. Leatherwood and R. R. Reeves, eds. The bottlenose dolphin. Academic Press, San Diego, CA.

Defran, R. H., Weller, D. W., Kelly, D. L., & Espinosa, M. A. (1999). Range characteristics of Pacific coast bottlenose dolphins (Tursiops truncatus) in the Southern California Bight. Marine Mammal Science15(2), 381-393.

Díaz‐Gamboa, R. E., Gendron, D., & Busquets‐Vass, G. (2018). Isotopic niche width differentiation between common bottlenose dolphin ecotypes and sperm whales in the Gulf of California. Marine Mammal Science34(2), 440-457.

Gonzalez, A., A. Lopez, A. Guerra and A. Barreiro. (1994). Diets of marine mammals stranded on the northwestern Spanish Atlantic coast with special reference to Cephalopoda. Fisheries Research 21:179–191.

Hanson, M. T., and Defran, R. H. (1993). The behavior and feeding ecology of the Pacific coast bottlenose dolphin, Tursiops truncatus. Aquatic Mammals19, 127-127.

Norris, K. S., and J. H. Prescott. (1961). Observations on Pacific cetaceans of Californian and Mexican waters. University of California Publications of Zoology 63:29, 1-402.

Shane, S. H. (1990). Comparison of bottlenose dolphin behavior in Texas and Florida, with a critique of methods for studying dolphin behavior. Pages 541-558 in S. Leatherwood and R. R. Reeves, eds. The bottlenose dolphin. Academic Press, San Diego, CA.

Shane, S., R. Wells and B. Wursig. (1986). Ecology, behavior and social organization of bottlenose dolphin: A review. Marine Mammal Science 2:34–63.

Walker, W.A. (1981). Geographical variation in morphology and biology of the bottlenose dolphins (Tursiops) in the eastern North Pacific. NMFS/SWFC Administrative Report. No, LJ-91-03C.

Walker, J., C. Potter and S. Macko. (1999). The diets of modern and historic bottlenose dolphin populations reflected through stable isotopes. Marine Mammal Science 15:335–350.

Snacks at the surface: New GEMM Lab publication reveals insights into blue whale surface foraging through drone observations and prey data

By Dawn Barlow, PhD student, OSU Department of Fisheries and Wildlife, Geospatial Ecology of Marine Megafauna Lab

As the largest animals on the planet, blue whales have massive prey requirements to meet energy demands. Despite their enormity, blue whales feed on a tiny but energy-rich prey source: krill. Furthermore, they are air-breathing mammals searching for aggregations of prey in the expansive and deep ocean, and must therefore budget breath-holding and oxygen consumption, the travel time it takes to reach prey patches at depth, the physiological constraints of diving, and the necessary recuperation time at the surface. Additionally, blue whales employ an energetically demanding foraging strategy known as lunge feeding, which is only efficient if they can locate and target dense prey aggregations that compensate for the energetic costs of diving and lunging. In our recent paper, published today in PeerJ, we examine how blue whales in New Zealand optimize their energy use through preferentially feeding on dense krill aggregations near the water’s surface.

Figure 1. A blue whale lunges on a dense aggregation of krill at the surface. Note the krill jumping away from the mouth of the onrushing whale. UAS piloted by Todd Chandler.
Figure 2. Survey tracklines in 2017 in the South Taranaki Bight (STB) with locations of blue whale sightings, and where surface lunge feeding was observed, denoted. Inset map shows location of the STB within New Zealand. Figure reprinted from Torres et al. 2020.

To understand how predators such as blue whales optimize foraging strategies, knowledge of predator behavior and prey distribution is needed. In 2017, we surveyed for blue whales in New Zealand’s South Taranaki Bight region (STB, Fig. 2) while simultaneously collecting prey distribution data using an echosounder, which allowed us to identify the location, depth, and density of krill aggregations throughout the region. When blue whales were located, we observed their behavior from the research vessel, recorded their dive times, and used an unmanned aerial system (UAS; “drone”) to assess their body condition and behavior.

Much of what is known about blue whale foraging behavior and energetics comes from extensive studies off the coast of California, USA using accelerometer tags to track fine-scale kinematics (i.e., body movements) of the whales. In the California Current, the krill species targeted by blue whales are denser at depth, and therefore blue whales regularly dive to depths of 300 meters to lunge on the most energy-rich prey aggregations. However, given the reduced energetic costs of feeding closer to the surface, optimal foraging theory predicts that blue whales should only forage at depth when the energetic gain outweighs the cost. In New Zealand, we found that blue whales foraged where krill aggregations were relatively shallow and dense compared to the availability of krill across the whole study area (Fig. 3). Their dive times were quite short (~2.5 minutes, compared to ~10 minutes in California), and became even shorter in locations where foraging behavior and surface lunge feeding were observed.

Figure 3. Density contours comparing the depth and density (Sv) of krill aggregations at blue whale foraging sightings (red shading) and in absence of blue whales (gray shading). Density contours: 25% = darkest shade, 755 = medium shade, 95% = light shade. Blue circles indicate krill aggregations detected within 2 km of the sighting of the UAS filmed surface foraging whale analyzed in this study. Figure reprinted from Torres et al. 2020.
Figure 4. Kinematics of a blue whale foraging dive derived from a suction cup tag. Upper panel shows the dive profile (yellow line), with lunges highlighted (green circles), superimposed on a prey field map showing qualitative changes in krill density (white, low; blue, medium; red, high). The lower panels show the detailed kinematics during lunges at depth. Here, the dive profile is shown by a black line. The orange line shows fluking strokes derived from the accelerometer data, the green line represents speed estimated from flow noise, and the grey circles indicate the speed calculated from the vertical velocity of the body divided by the sine of the body pitch angle, which is shown by the red line. Figure and caption reprinted from Goldbogen et al. 2011.

Describing whale foraging behavior and prey in the surface waters has been difficult due to logistical limitations of conventional data collection methods, such as challenges inferring surface behavior from tag data and quantifying echosounder backscatter data in surface waters. To compliment these existing methods and fill the knowledge gap surrounding surface behavior, we highlight the utility of a different technological tool: UAS. By analyzing video footage of a surface lunge feeding sequence, we obtained estimates of the whale’s speed, acceleration, roll angle, and head inclination, producing a figure comparable to what is typically obtained from accelerometer tag data (Fig. 4, Fig. 5). Furthermore, the aerial perspective provided by the UAS provides an unprecedented look at predator-prey interactions between blue whales and krill. As the whale approaches the krill patch, she first observes the patch with her right eye, then turns and lines up her attack angle to engulf almost the entire prey patch through her lunge. Furthermore, we can pinpoint the moment when the krill recognize the impending danger of the oncoming predator—at a distance of 2 meters, and 0.8 seconds before the whale strikes the patch, the krill show a flee response where they leap away from the whale’s mouth (see video, below).

Figure 5. Body kinematics during blue whale surface lunge feeding event derived from Unmanned Aerial Systems (UAS) image analysis. (A) Mean head inclination and roll (with CV in shaded areas), (B) relative speed and acceleration, and (C) distance from the tip of the whale’s rostrum to the nearest edge of krill patch. Blue line on plots indicate when krill first respond to the predation event, and the purple dashed lines indicate strike at time = 0. The orange lines indicate the time at which the whale’s gape is widest, head inclination is maximum, and deceleration is greatest. Figure reprinted from Torres et al. 2020

In this study, we demonstrate that surface waters provide important foraging opportunities and play a key role in the ecology of New Zealand blue whales. The use of UAS technology could be a valuable and complimentary tool to other technological approaches, such as tagging, to gain a comprehensive understanding of foraging behavior in whales.

To see the spectacle of a blue whale surface lunge feeding, we invite you to take a look at the video footage, below:

The publication is led by GEMM Lab Principal Investigator Dr. Leigh Torres. I led the prey data analysis portion of the study, and co-authors include our drone pilot extraordinaire Todd Chandler and UAS analysis guru Dr. Jonathan Burnett. We are grateful to all who assisted with fieldwork and data collection, including Kristin Hodge, Callum Lilley, Mike Ogle, and the crew of the R/V Star Keys (Western Workboats, Ltd.). Funding for this research was provided by The Aotearoa Foundation, The New Zealand Department of Conservation, The Marine Mammal Institute at Oregon State University, Greenpeace New Zealand, OceanCare, Kiwis Against Seabed Mining, The International Fund for Animal Welfare, and The Thorpe Foundation.

Read Oregon State University’s press release about the publication here.

Whale blow: good for more than spotting whales

Clara Bird, Masters Student, OSU Department of Fisheries and Wildlife, Geospatial Ecology of Marine Megafauna Lab

Whale blow, the puff of air mixed with moisture that a whale releases when it comes to the surface, is a famously thrilling indicator of the presence of a whale. From shore, spotting whale blow brings the excitement of knowing that there are whales nearby. During boat-based field work, seeing or hearing blow brings the rush of adrenaline meaning that it’s game time. Whale blow can also be used to identify different species of whales, for example gray whale blow is heart shaped (Figure 1). However, whale blow can be used for more than just spotting and identifying whales. We can use the time between blows to study energetics.

Figure 1. Gray whale blow is often heart shaped (when there is very little wind). Source: https://www.lajollalight.com/sdljl-natural-la-jolla-winter-wildlife-2015jan08-story.html

A blow interval is the time between consecutive blows when a whale is at the surface (Stelle, Megill, and Kinzel 2008). These are also known as short breath holds, whereas long breath holds are times between surfacings (Sumich 1983).  Sumich (1983) hypothesized that short breath holds lead to efficient rates of oxygen use. The body uses oxygen to create energy, so “efficient rate of oxygen use” means that longer breath holds do not use much more oxygen and subsequently do not produce more energy.  Surfacings, during which short blow intervals occur, are often thought of as recovery periods for whales. Think of it this way, when you sprint, immediately afterwards you typically need to take a break to just breathe and recover.

We hypothesize that we can use blow intervals as a measure of how strenuous an activity is; shorter blow intervals may indicate that an activity is more energetically demanding (Wursig, Wells, and Croll 1986). Let’s go back to the sprinting analogy and compare the energetic demands of walking and running. Imagine I asked you to walk for five minutes, stop and measure the time between each breath, and then run for five minutes and do the same; after running, you would likely breathe more heavily and take more breaths with less time between them. This result indicates that running is more demanding, which we already know because we can do other experiments with humans to study metabolic rate and related metrics. In the case of gray whales, we cannot do experiments in the same way, but we can use the same analogy. Several studies have examined how blow intervals differ between travelling and foraging.

Wursig, Wells, and Croll (1986) measured blow interval, surfacing time, and estimated dive depth and duration of gray whales in Alaska from a boat during the foraging season. They found that blow intervals were shorter during feeding. They also found that the number of blows per surfacing increased with increasing depth. Overall these findings suggest that during the foraging season, feeding is more strenuous than other behaviors and that deeper dives may be more physiologically stressful.

Stelle, Megill, and Kinzel (2008) studied gray whales foraging off of British Columbia, Canada. They found shorter blow intervals during foraging, intermediate blow intervals during searching, and longer blow intervals during travelling. Interestingly, within feeding behaviors, they found a difference between whales feeding on mysids (krill-like animals that swim in the water column) and whales feeding benthically on amphipods. They found that whales feeding on mysids made more frequent but shorter dives with short blow intervals at surface, while whales feeding benthically had longer dives with longer blow intervals. They hypothesized that this difference in surfacing pattern is because mysids might scatter when disturbed, so gray whales surface more often to allow the mysids swarm to reform. These studies inspired me to start investigating these same questions with my drone video data.

As I review the drone footage and code the behaviors I also mark the time of each blow. I’ve done some initial video coding and using this data I have started to look into differences in blow intervals. As it turns out, we see a similar difference in blow interval relative to behavior state in our data: whales that are foraging have shorter blow intervals than when traveling (Figure 2). It is encouraging to see that our data shows similar patterns.

Figure 2. Boxplot of mean blow interval per sighting of foraging whales and travelling whales.

Next, I would like to examine how blow intervals differ between foraging tactics. A significant part of my thesis is dedicated to studying specific foraging tactics. The perspective from the drone allows us to identify behaviors in greater detail than studies from shore or boat (Torres et al. 2018), allowing us to dig into the differences between the different foraging behaviors. The purpose of foraging is to gain energy. However, this gain is a net gain. To understand the different energetic “values” of each tactic we need to understand the cost of each behavior, i.e. how much energy is required to perform the behavior. Given previous studies, maybe blow intervals could help us measure this cost or at least compare the energetic demands of the behaviors relative to each other. Furthermore, because different behaviors are likely associated with different prey types (Dunham and Duffus 2001), we also need to understand the different energetic gains of each prey type (this is something that Lisa is studying right now, check out the COZI project to learn more). By understanding both of these components – the gains and costs – we can understand the energetic tradeoffs of the different foraging tactics.

Another interesting component to this energetic balance is a whale’s health and body condition. If a whale is in poor health, can it afford the energetic costs of certain behaviors? If whales in poor body condition engage in different behavior patterns than whales in good body condition, are these patterns explained by the energetic costs of the different foraging behaviors? All together this line of investigation is leading to an understanding of why a whale may choose to use different foraging behaviors in different situations. We may never get the full picture; however, I find it really exciting that something as simple and non-invasive as measuring the time between breaths can contribute such a valuable data stream to this project.

References

Dunham, Jason S., and David A. Duffus. 2001. “Foraging Patterns of Gray Whales in Central Clayoquot Sound, British Columbia, Canada.” Marine Ecology Progress Series 223 (November): 299–310. https://doi.org/10.3354/meps223299.

Stelle, Lei Lani, William M. Megill, and Michelle R. Kinzel. 2008. “Activity Budget and Diving Behavior of Gray Whales (Eschrichtius Robustus) in Feeding Grounds off Coastal British Columbia.” Marine Mammal Science 24 (3): 462–78. https://doi.org/10.1111/j.1748-7692.2008.00205.x.

Sumich, James L. 1983. “Swimming Velocities, Breathing Patterns, and Estimated Costs of Locomotion in Migrating Gray Whales, Eschrichtius Robustus.” Canadian Journal of Zoology 61 (3): 647–52. https://doi.org/10.1139/z83-086.

Torres, Leigh G., Sharon L. Nieukirk, Leila Lemos, and Todd E. Chandler. 2018. “Drone up! Quantifying Whale Behavior from a New Perspective Improves Observational Capacity.” Frontiers in Marine Science 5 (SEP). https://doi.org/10.3389/fmars.2018.00319.

Wursig, B., R. S. Wells, and D. A. Croll. 1986. “Behavior of Gray Whales Summering near St. Lawrence Island, Bering Sea.” Canadian Journal of Zoology 64 (3): 611–21. https://doi.org/10.1139/z86-091.

What are the ecological impacts of gray whale benthic feeding?

Clara Bird, Masters Student, OSU Department of Fisheries and Wildlife, Geospatial Ecology of Marine Megafauna Lab

Happy new year from the GEMM lab! Starting graduate school comes with a lot of learning. From skills, to learning about how much there is to learn, to learning about the system I will be studying in depth for the next few years. This last category has been the most exciting to me because digging into the literature on a system or a species always leads to the unearthing of some fascinating and surprising facts. So, for this blog I will write about one of the aspects of gray whale foraging that intrigues me most: benthic feeding and its impacts.

How do gray whales feed?

Gray whales are a unique species. Unlike other baleen whales, such as humpback and blue whales, gray whales regularly feed off the bottom of the ocean (Nerini, 1984). They roll to one side and swim along the bottom, they then suction up (by depressing their tongue) the sediment and prey, then the sediment and water is filtered out of the baleen. In fact, we use sediment streams, shown in Figure 1, as an indicator of benthic feeding behavior when analyzing drone footage (Torres et al. 2018).

Figure 1. Screenshot of drone video showing sediment streaming from mouth of a whale after benthic feeding. Video taken under NOAA/NMFS permit #21678

Locations of benthic feeding can be identified without directly observing a gray whale actively feeding because of the excavated pits that result from benthic feeding (Nerini 1984). These pits can be detected using side-scan sonar that is commonly used to map the seafloor. Oliver and Slattery (1985) found that the pits typically are from 2-20 m2. In some of the imagery, consecutive neighboring pits are visible, likely created by one whale in series during a feeding event. Figure 2 shows different arrangements of pits.

Figure 2. Different arrangements of pits created by feeding whales (Nerini 1984).

Aside from how fascinating the behavior is, benthic feeding is also interesting because it has a large impact on the environment. Coming from a background of studying baleen whales that primarily feed on krill, I had not really considered the potential impacts of whale foraging other than removing prey from the environment. However, when gray whales feed, they excavate large areas of the benthic substrate that disturb and impact the habitat.

The impacts of benthic feeding

Weitkamp et al. (1992) conducted a study on gray whale benthic foraging on ghost shrimp in Puget Sound, WA, USA. This study, conducted over two years, focused on measuring the impact of benthic foraging by its effect on prey abundance. They found that the standing stock of ghost shrimp within a recently excavated pit was two to five times less than that outside the pit, and that 3100 to 5700 grams of shrimp can be removed per pit. From aerial surveys they estimated that within one season feeding gray whales created between 2700 and 3200 pits. Using these values, they calculated that 55 to 79% of the standing stock of ghost shrimp was removed each season by foraging gray whales. Interestingly, they found that the shrimp biomass within an excavated pit recovered within about two months.

Oliver and Slattery (1985) also found a recovery period of about 2 months per pit in their study on the effect of gray whale benthic feeding on the prey community in the Bering Sea. They sampled prey within and outside feeding excavations, both actual whale pits and man-made, to test the response of the benthic community to the disturbance of a feeding event. They found that after the initial feeding disturbance, the excavated area was rapidly colonized by scavenging lysianassid amphipods, which are small (10 mm) crustaceans that typically eat dead organic material. These amphipods rushed in and attacked the organisms that were injured or dislodged by the whale feeding event, typically small crustaceans and polychaete worms. Within hours of the whale feeding event, these amphipods had dispersed and a different genre of scavenging lysianassid amphipods slowly invaded the excavated pit further and stayed much longer. After a few days or weeks these pits collected and trapped organic debris that attracted more colonists. Indeed, they found that the number of colonists remained elevated within the excavated areas for over two months.

Notably, these results on how the disturbance of gray whale benthic feeding changes sediment composition support the idea that this foraging behavior maintains the sand substrate and therefore helps to maintain balanced levels of benthic dwelling amphipods, their primary source of prey in this study area (Johnson and Nelson, 1984). Gray whales scour the sea floor when they feed and this process leads to the resuspension of lots of sediments and nutrients that would otherwise remain on the seafloor. Therefore, while this feeding may seem like a violent disturbance, it may in fact play a large role in benthic productivity (Johnson and Nelson, 1984; Oliver and Slattery, 1985).

These ecosystem impacts of gray whale benthic feeding I have described above demonstrate the various stages of invaders after a feeding disturbance, and the process of succession. Succession is the ecological process of how a community structure builds and grows. Primary succession is when the structure grows from truly nothing and secondary succession occurs after a disturbance, such as a fire. In secondary succession, there are typically pioneer species that first appear and then give way to other species and a more complex community eventually emerges. Succession is well documented in many terrestrial studies after disturbance events, and the processes of secondary succession is very important to community ecology and resilience.

Since gray whale benthic foraging does not impact an entire habitat all at once, the process is not perfectly comparable to secondary succession in terrestrial systems. Yet, when thinking about the smaller scale, another example of succession in the marine environment takes place at a whale fall. When a whale dies and sinks to the ocean floor, a small ecosystem emerges. Different organisms arrive at different stages to scavenge different parts of the carcass and a food web is created around it.

To me the impacts of gray whale benthic feeding are akin to both terrestrial disturbance events and whale falls. The excavation serves as a disturbance, and through secondary succession the habitat is refreshed via stages of different species colonization until the system eventually returns to the pre-disturbance levels. However, like a whale fall the feeding event leaves behind injured or displaced organisms that scavengers consume; in fact seabirds are known to take advantage of benthic invertebrates that are brought to the surface by a gray whale feeding event (Harrison, 1979). 

So much of our research is focused on questions about how the changing environment impacts our study species and not the other way around. This venture into the literature has provided me with an important reminder to think about flipping the question. I have enjoyed starting 2020 with a reminder of how cool gray whales are, and that while a disturbance can initially be thought of as negative, it may actually bring about important, and positive, change.

References

Nerini, Mary. 1984. “A Review of Gray Whale Feeding Ecology.” In The Gray Whale: Eschrichtius Robustus, 423–50. Elsevier Inc. https://doi.org/10.1016/B978-0-08-092372-7.50024-8.

Oliver, J. S., and P. N. Slattery. 1985. “Destruction and Opportunity on the Sea Floor: Effects of Gray Whale Feeding.” Ecology 66 (6): 1965–75. https://doi.org/10.2307/2937392.

Torres, Leigh G., Sharon L. Nieukirk, Leila Lemos, and Todd E. Chandler. 2018. “Drone up! Quantifying Whale Behavior from a New Perspective Improves Observational Capacity.” Frontiers in Marine Science 5 (SEP). https://doi.org/10.3389/fmars.2018.00319.

Weitkamp, Laurie A, Robert C Wissmar, Charles A Simenstad, Kurt L Fresh, and Jay G Odell. 1992. “Gray Whale Foraging on Ghost Shrimp (Callianassa Californiensis) in Littoral Sand Flats of Puget Sound, USA.” Canadian Journal of Zoology 70 (11): 2275–80. https://doi.org/10.1139/z92-304.

Johnson, Kirk R., and C. Hans Nelson. 1984. “Side-Scan Sonar Assessment of Gray Whale Feeding in the Bering Sea.” Science 225 (4667): 1150–52.

Harrison, Craig S. 1979. “The Association of Marine Birds and Feeding Gray Whales.” The Condor 81 (1): 93. https://doi.org/10.2307/1367866.

Classifying cetacean behavior

Clara Bird, Masters Student, OSU Department of Fisheries and Wildlife, Geospatial Ecology of Marine Megafauna Lab

The GEMM lab recently completed its fourth field season studying gray whales along the Oregon coast. The 2019 field season was an especially exciting one, we collected rare footage of several interesting gray whale behaviors including GoPro footage of a gray whale feeding on the seafloor, drone footage of a gray whale breaching, and drone footage of surface feeding (check out our recently released highlight video here). For my master’s thesis, I’ll use the drone footage to analyze gray whale behavior and how it varies across space, time, and individual. But before I ask how behavior is related to other variables, I need to understand how to best classify the behaviors.

How do we collect data on behavior?

One of the most important tools in behavioral ecology is an ‘ethogram’. An ethogram is a list of defined behaviors that the researcher expects to see based on prior knowledge. It is important because it provides a standardized list of behaviors so the data can be properly analyzed. For example, without an ethogram, someone observing human behavior could say that their subject was walking on one occasion, but then say strolling on a different occasion when they actually meant walking. It is important to pre-determine how behaviors will be recorded so that data classification is consistent throughout the study. Table 1 provides a sample from the ethogram I use to analyze gray whale behavior. The specificity of the behaviors depends on how the data is collected.

Table 1. Sample from gray whale ethogram. Based on ethogram from Torres et al. (2018).

In marine mammal ecology, it is challenging to define specific behaviors because from the traditional viewpoint of a boat, we can only see what the individuals are doing at the surface. The most common method of collecting behavioral data is called a ‘focal follow’. In focal follows an individual, or group, is followed for a set period of time and its behavioral state is recorded at set intervals.  For example, a researcher might decide to follow an animal for an hour and record its behavioral state at each minute (Mann 1999). In some studies, they also recorded the location of the whale at each time point. When we use drones our methods are a little different; we collect behavioral data in the form of continuous 15-minute videos of the whale. While we collect data for a shorter amount of time than a typical focal follow, we can analyze the whole video and record what the whale was doing at each second with the added benefit of being able to review the video to ensure accuracy. Additionally, from the drone’s perspective, we can see what the whales are doing below the surface, which can dramatically improve our ability to identify and describe behaviors (Torres et al. 2018).

Categorizing Behaviors

In our ethogram, the behaviors are already categorized into primary states. Primary states are the broadest behavioral states, and in my study, they are foraging, traveling, socializing, and resting. We categorize the specific behaviors we observe in the drone videos into these categories because they are associated with the function of a behavior. While our categorization is based on prior knowledge and critical evaluation, this process can still be somewhat subjective.  Quantitative methods provide an objective interpretation of the behaviors that can confirm our broad categorization and provide insight into relationships between categories.  These methods include path characterization, cluster analysis, and sequence analysis.

Path characterization classifies behaviors using characteristics of their track line, this method is similar to the RST method that fellow GEMM lab graduate student Lisa Hildebrand described in a recent blog. Mayo and Marx (1990) analyzed the paths of surface foraging North Atlantic Right Whales and were able to classify the paths into primary states; they found that the path of a traveling whale was more linear and then paths of foraging or socializing whales that were more convoluted (Fig 1). I plan to analyze the drone GPS track line as a proxy for the whale’s track line to help distinguish between traveling and foraging in the cases where the 15-minute snapshot does not provide enough context.

Figure 1. Figure from Mayo and Marx (1990) showing different track lines symbolized by behavior category.

Cluster analysis looks for natural groupings in behavior. For example, Hastie et al. (2004) used cluster analysis to find that there were four natural groupings of bottlenose dolphin surface behaviors (Fig. 2). I am considering using this method to see if there are natural groupings of behaviors within the foraging primary state that might relate to different prey types or habitat. This process is analogous to breaking human foraging down into sub-categories like fishing or farming by looking for different foraging behaviors that typically occur together.

Figure 2. Figure from Hastie et al. (2004) showing the results of a hierarchical cluster analysis.

Lastly, sequence analysis also looks for groupings of behaviors but, unlike cluster analysis, it also uses the order in which behaviors occur. Slooten (1994) used this method to classify Hector’s dolphin surface behaviors and found that there were five classes of behaviors and certain behaviors connected the different categories (Fig. 3). This method is interesting because if there are certain behaviors that are consistently in the same order then that indicates that the order of events is important. What function does a specific sequence of behaviors provide that the behaviors out of that order do not?

Figure 3. Figure from Slooten (1994) showing the results of sequence analysis.

Think about harvesting fruits and vegetables from a garden: the order of how things are done matters and you might use different methods to harvest different kinds of produce. Without knowing what food was being harvested, these methods could detect that there were different harvesting methods for different fruits or veggies. By then studying when and where the different methods were used and by whom, we could gain insight into the different functions and patterns associated with the different behaviors. We might be able to detect that some methods were always used in certain habitat types or that different methods were consistently used at different times of the year.

Behavior classification methods such as these described provide a more refined and detailed analysis of categories that can then be used to identify patterns of gray whale behaviors. While our ultimate goal is to understand how gray whales will be affected by a changing environment, a comprehensive understanding of their current behavior serves as a baseline for that future study.

References

Burnett, J. D., Lemos, L., Barlow, D., Wing, M. G., Chandler, T., & Torres, L. G. (2019). Estimating morphometric attributes of baleen whales with photogrammetry from small UASs: A case study with blue and gray whales. Marine Mammal Science, 35(1), 108–139. https://doi.org/10.1111/mms.12527

Darling, J. D., Keogh, K. E., & Steeves, T. E. (1998). Gray whale (Eschrichtius robustus) habitat utilization and prey species off Vancouver Island, B.C. Marine Mammal Science, 14(4), 692–720. https://doi.org/10.1111/j.1748-7692.1998.tb00757.x

Hastie, G. D., Wilson, B., Wilson, L. J., Parsons, K. M., & Thompson, P. M. (2004). Functional mechanisms underlying cetacean distribution patterns: Hotspots for bottlenose dolphins are linked to foraging. Marine Biology, 144(2), 397–403. https://doi.org/10.1007/s00227-003-1195-4

Mann, J. (1999). Behavioral sampling methods for cetaceans: A review and critique. Marine Mammal Science, 15(1), 102–122. https://doi.org/10.1111/j.1748-7692.1999.tb00784.x

Slooten, E. (1994). Behavior of Hector’s Dolphin: Classifying Behavior by Sequence Analysis. Journal of Mammalogy, 75(4), 956–964. https://doi.org/10.2307/1382477

Torres, L. G., Nieukirk, S. L., Lemos, L., & Chandler, T. E. (2018). Drone up! Quantifying whale behavior from a new perspective improves observational capacity. Frontiers in Marine Science, 5(SEP). https://doi.org/10.3389/fmars.2018.00319

Mayo, C. A., & Marx, M. K. (1990). Surface foraging behaviour of the North Atlantic right whale, Eubalaena glacialis, and associated zooplankton characteristics. Canadian Journal of Zoology, 68(10), 2214–2220. https://doi.org/10.1139/z90-308

What is that whale doing? Only residence in space and time will tell…

By Lisa Hildebrand, MSc student, OSU Department of Fisheries and Wildlife, Geospatial Ecology of Marine Megafauna Lab

For my research in Port Orford, my field team and I track individual gray whales continuously from a shore-based location: once we spot a whale we will track it for the entire time that it remains in our study site. The time spent tracking a whale can vary widely. In the 2018 field season, our shortest trackline was three minutes, and our longest track was over three hours in duration.

This variability in foraging time is partly what sparked my curiosity to investigate potential foraging differences between individuals of the Pacific Coast Feeding Group (PCFG) gray whales. I want to know why some individuals, like “Humpy” who was our longest tracked individual in 2018, stayed in an area for so long, while others, like “Smokey”, only stayed for three minutes (Figure 1). It is hard to pinpoint just one variable that drives these decisions (e.g., prey, habitat) made by individuals about where they forage and how long because the marine environment is so dynamic. Foraging decisions are likely dictated by several factors acting in concert with one another. As a result, I have many research questions, including (but certainly not limited to):

  1. Does prey density drive length of individual foraging bouts?
  2. Do individual whales have preferences for a particular prey species?
  3. Are prey patches containing gravid zooplankton targeted more by whales?
  4. Do whales prefer to feed closer to kelp patches?
  5. How does water depth factor into all of the above decisions and/or preferences? 

I hope to get to the bottom of these questions through the data analyses I will be undertaking for my second chapter of my Master’s thesis. However, before I can answer those questions, I need to do a little bit of tidying up of my whale tracklines. Now that the 2019 field season is over and I have all of the years of data that I will be analyzing for my thesis (2015-2019), I have spent the past 1-2 weeks diving into the trackline clean-up and analysis preparation.

The first step in this process is to run a speed filter over each trackline. The aim of the speed filter is to remove any erroneous points or outliers that must be wrong based on the known travel speeds of gray whales. Barb Lagerquist, a Marine Mammal Institute (MMI) colleague who has tracked gray whales for several field seasons, found that the fastest individual she ever encountered traveled at a speed of 17.3 km/h (personal communication). Therefore, based on this information,  my tracklines are run through a speed filter set to remove any points that suggest that the whale traveled at 17.3 km/h or faster (Figure 2). 

Fig 3. Trackline of “Humpy” after interpolation. The red points are interpolated.

Next, the speed-filtered tracklines are interpolated (Figure 3). Interpolation fills spatial and/or temporal gaps in a data set by evenly spacing points (by distance or time interval) between adjacent points. These gaps sometimes occur in my tracklines when the tracking teams misses one or several surfacings of a whale or because the whale is obscured by a large rock. 

After speed filtration and interpolation has occurred, the tracklines are ready to be analyzed using Residence in Space and Time (RST; Torres et al. 2017) to assign behavior state to each location. The questions I am hoping to answer for my thesis are based upon knowing the behavioral state of a whale at a given location and time. In order for me to draw conclusions over whether or not a whale prefers to forage by a reef with kelp rather than a reef without kelp, or whether it prefers Holmesimysis sculpta over Neomysis rayii, I need to know when a whale is actually foraging and when it is not. When we track whales from our cliff site, we assign a behavior to each marked location of an individual. It may sound simple to pick the behavior a whale is currently exhibiting, however it is much harder than it seems. Sometimes the behavioral state of a whale only becomes apparent after tracking it for several minutes. Yet, it’s difficult to change behaviors retroactively while tracking a whale and the qualitative assignment of behavior states is not an objective method. Here is where RST comes in.

Those of you who have been following the blog for a few years may recall a post written in early 2017 by Rachael Orben, a former post-doc in the GEMM Lab who currently leads the Seabird Oceanography Lab. The post discussed the paper “Classification of Animal Movement Behavior through Residence in Space Time” written by Leigh and Rachael with two other collaborators, which had just been published a few days prior. If you want to know the nitty gritty of what RST is and how it works, I suggest reading Rachael’s blog, the GEMM lab’s brief description of the project and/or the actual paper since it is an open-access publication. However, in a nut shell, RST allows a user to identify three primary behavioral states in a tracking dataset based on the time and distance the individual spent within a given radius. The three behavioral categories are as follows:

Fig 4. Visualization of the three RST behavioral categories. Taken from Torres et al. (2017).
  • Transit – characterized by short time and distance spent within an area (radius of given size), meaning the individual is traveling.
  • Time-intensive – characterized by a long time spent within an area, meaning the individual is spending relatively more time but not moving much distance (such as resting in one spot). 
  • Time & distance-intensive – characterized by relatively high time and distances spent within an area, meaning the individual is staying within and moving around a lot in an area, such as searching or foraging. 

What behavior these three categories represent depends on the resolution of the data analyzed. Is one point every day for two years? Then the data are unlikely to represent resting. Or is the data 1 point every second for 1 hour? In which case travel segments may cover short distances. On average, my gray whale tracklines are composed of a point every 4-5 minutes for 1-2 hours.  Bases on this scale of tracking data, I will interpret the categories as follows: Transit is still travel, time & distance-intensive points represent locations where the whale was searching because it was moving around one area for a while, and time-intensive points represent foraging behavior because the whale has ‘found what it is looking for’ and is spending lots of time there but not moving around much anymore. The great thing about RST is that it removes the bias that is introduced by my field team when assigning behavioral states to individual whales (Figure 5). RST looks at the tracklines in a very objective way and determines the behavioral categories quantitatively, which helps to remove the human subjectivity.

While it took quite a bit of troubleshooting in R and overcoming error messages to make the codes run on my data, I am proud to have results that are interesting and meaningful with which I can now start to answer some of my many research questions. My next steps are to create interpolated prey density and distance to kelp layers in ArcGIS. I will then be able to overlay my cleaned up tracklines to start teasing out potential patterns and relationships between individual whale foraging movements and their environment. 

Literature cited

Torres, L. G., R. A. Orben, I. Tolkova, and D. R. Thompson. 2017. Classification of animal movement behavior through residence in space and time. PLoS ONE: doi. org/10.1371/journal.pone.0168513.

Introducing Crew Cinco – the Port Orford Gray Whale Foraging Ecology Field Team of 2019

By Lisa Hildebrand, MSc student, OSU Department of Fisheries and Wildlife, Geospatial Ecology of Marine Megafauna Lab

It seems unfathomable to me that one year and two months ago I had never used a theodolite before, never been in an ocean kayak before, never identified zooplankton before, never seen a Time-Depth-Recorder (TDR) before. Now, one year later, it seems like all of those tools, techniques and things are just a couple of old friends with which I am being reunited with again. My second field season as the project team lead of the gray whale foraging ecology project in Port Orford (PO) is slowly getting underway and so many of the lessons I learned from my first field season last year have already helped me tremendously this year. I know how to interpret weather forecasts and determine whether it will be a kayak-appropriate day. I know how to figure out the quirks of Pythagoras, the program we use to interface with our theodolite which helps us track whales from our cliff site. I know how to keep track of a budget and feed a team of hungry researchers after a long day of work. Knowing all of these things ahead of this year’s field season have made me feel a little more prepared and at ease with the training of my team and the work to be done. Nevertheless, there are always new curveballs to be thrown my way and while they can often be frustrating, I enjoy the challenges that being a team leader has to offer as it allows me to continue to grow as a field research scientist. 

Figure 1. Crew Cinco tracks a whale in Tichenor Cove. Source: L Hildebrand.

2019 marks the fifth year that this project has been taking place in PO. Back in the summer of 2015, former GEMM Lab Master’s student Florence Sullivan started this project together with Leigh. That year the research focused more on investigating vessel disturbance to gray whales by comparing sites of heavy (Boiler Bay) to low boat traffic (Port Orford). The effort found that there were significant differences in gray whale activity budgets between the heavy and low boat traffic conditions (Sullivan & Torres 2018). The following year, the focus of the research switched to being more on the foraging ecology side of things and the project was based solely out of Port Orford, as it continues to be to this day. Being in our fifth year means that we are starting to build a humbly-sized database of sightings across multiple years allowing me to investigate potential individual specialization of the whales that we document. Similarly, multiple years of prey sampling is starting to reveal temporal and spatial trends of prey community assemblages.

Figure 2. Buttons (pictured above) is one of the stars of the Port Orford gray whale foraging ecology project as he has been seen every year since 2016. Crew Cinco has already seen him three times since the start of August. Source: L Hildebrand.

It has become a tradition to come up with a name for the field team that spends 6 weeks at the Oregon State University (OSU) Port Orford Field Station to collect the data for the project. It started with Team Ro“buff”stus in 2015, which I believe carried through until 2017. This is understandable since it’s such a clever name. It’s a play on the species name for gray whales, robustus, but the word “Buff” has been substituted in the center. Buffs are pieces of cloth sewn into a cylindrical shape, often with fun patterns or colors, that can be used as face masks, headbands, and scarves, which come in very handy when your face is exposed to the elements. Doing this project, we can be confronted by wind, sun, fog and sea water all in one day, so Buffs have definitely served the team members very well over the years. Last year, as the project’s torch was passed from Florence to myself, I felt a new team name was apt, and so last year’s team decided our name would be Team Whale Storm. I believe it was because we said we would take the whale world by storm with our insanely good theodolite tracking and kayak sampling skills. With a new year and new team upon us, a new team name was in order. As the title of this blog post indicates, this year the team is called Crew Cinco. The reason behind this name is that we are the fifth team to carry out this field work. Since the gray whales breed in the lagoons of Baja California, Mexico, I like to think that their native language is Spanish. Hence, we have decided that instead of being Crew Five, we are Crew Cinco, as cinco is the Spanish word for five (besides, alliteration makes for a much better team name).

Now that you are up to speed on the history of the PO gray whale project, let me tell you a little about who is part of Crew Cinco and what we have been up to already.

This year’s Marine Studies Initiative OSU undergraduate intern is Mia Arvizu. Mia has just finished her sophomore year at OSU and majors in Environmental Science. Besides being my co-captain this year in the field, Mia is also undertaking an independent research project which focuses on the relationship between sea urchin abundance, kelp health and gray whale foraging. She will tell you all about this project in a few weeks when she takes over the GEMM lab blog. Aside from her interest in ecology and the way science can be used to help local communities in a changing environment, Mia is a dancer, having performed in several dances in OSU’s annual luau this year, and she is currently teaching herself Spanish and Hawaiian.

Both of our high school interns this year are from Astoria. Anthony Howe has just graduated from Astoria High School and will be starting at Clatsop Community College in the fall. His plan is to transfer to OSU and to pursue his interest in marine biology. Anthony, like myself, was born in Germany and lived there until he was six, which means that he is able to speak fluent German. He also introduced the team to the wonders of the Instant Pot, which has made cooking for a team of four hungry scientists much simpler.

Donovan Burns is our other high school intern. He will be going into his junior year in the fall. Donovan never ceases to amaze us with the seemingly endless amounts of general knowledge he has, often sharing facts about Astoria’s history to Asimov’s Laws of Robotics to pickling vegetables, specifically carrots, with us during dinner or while scanning for whales on the cliff site. He also named the first whale we saw here this season – Speckles. 

Figure 3. Crew Cinco, from left to right: Anthony Howe, Donovan Burns, Lisa Hildebrand and Mia Arvizu. Source: L Torres.

Crew Cinco has already been in PO for two weeks now. After having a full team meeting with Leigh in Newport and a GEMM lab summer pizza party, we headed south to begin our 6-week field season. It’s hard to believe that the two training weeks are already over. The team worked hard to figure out the subtleties of the theodolite, observe different gray whales and start to understand their dive and foraging patterns, undertake a kayak paddle & safety course, as well as CPR and First Aid training, learn about data processing and management, and how to use a variety of gizmos to aid us in data collection. But it hasn’t all been work. We enjoyed a day in the Californian Redwoods on one of our day’s off and picked blueberries at the Twin Creek Ranch, stocking our freezer with several bags of juicy berries. We have played ‘Sorry!’ perhaps one too many times already (we are in desperate need of some more boardgames if anyone wants to send some our way to the field station!), and enjoyed many walks and runs on beautiful Battle Rock Beach. 

The next four weeks will not be easy – very early mornings, lots of paddling and squinting into the sun, followed by several hours in the lab processing samples and backing up data. But the next four weeks will also be extremely rewarding – learning lots of new skills that will be valuable beyond this 6-week period, revealing ecological trends and relationships, and ultimately (the true reason for why Mia, Anthony, Donovan and myself are more than happy to put in 6 weeks-worth of hard work), the chance to see whales every day up close and personal. Follow Crew Cinco’s journey over the next few weeks as my interns will be posting to the blog for the next three weeks!

References

Sullivan, F.A., & Torres L.G. Assessment of vessel disturbance to gray whales to inform sustainable ecotourism. Journal of Wildlife Management, 2018. 82: 896-905.