More data, more questions, more projects: There’s always more to learn

By Dawn Barlow, PhD student, OSU Department of Fisheries and Wildlife, Geospatial Ecology of Marine Megafauna Lab 

As you may have read in previous blog posts, my research focuses on the ecology of blue whales in New Zealand. Through my MS research and years of work by a dedicated team, we were able to document and describe a population of around 700 blue whales that are unique to New Zealand, present year-round, and genetically distinct from all other known populations [1]. While this is a very exciting discovery, documenting this population has also unlocked a myriad of further questions about these whales. Can we predict when and where the whales are most likely to be? How does their distribution change seasonally? How often do they overlap with anthropogenic activity? My PhD research will aim to answer these questions through models of blue whale distribution patterns relative to their environment at multiple spatial and temporal scales.

Because time at sea for vessel-based surveys is cost-limited and difficult to come by, it is in any scientist’s best interest to collect as many concurrent streams of data as possible while in the field. When Dr. Leigh Torres designed our blue whale surveys that were conducted in 2014, 2016, and 2017, she really did a miraculous job of maximizing time on the water. With more data, more questions can be asked. These complimentary datasets have led to the pursuit of many “side projects”. I am lucky enough to work on these questions in parallel with what will form the bulk of my PhD, and collaborate with a number of people in the process. In this blog post, I’ll give you some short teasers of these “side projects”!

Surface lunge feeding as a foraging strategy for New Zealand blue whales

Most of what we know about blue whale foraging behavior comes from studies conducted off the coast of Southern California[2,3] using suction cup accelerometer tags. While these studies in the California Current ecosystem have led to insights and breakthroughs in our understanding of these elusive marine predators and their prey, they have also led us to adopt the paradigm that krill patches are denser at depth, and blue whales are most likely to target these deep prey patches when they feed. We have combined our prey data with blue whale behavioral data observed via a drone to investigate blue whale foraging in New Zealand, with a particular emphasis on surface feeding as a strategy. In our recent analyses, we are finding that in New Zealand, lunge feeding at the surface may be more than just “snacking”. Rather, it may be an energetically efficient strategy that blue whales have evolved in the region with unique implications for conservation.

Figure 1. A blue whale lunges on an aggregation of krill. UAS piloted by Todd Chandler.

Combining multiple data streams for a comprehensive health assessment

In the field, we collected photographs, blubber biopsy samples, fecal samples, and conducted unmanned aerial system (UAS, a.k.a. “drone”) flights over blue whales. The blubber and fecal samples can be analyzed for stress and reproductive hormone levels; UAS imagery allows us to quantify a whale’s body condition[4]; and photographs can be used to evaluate skin condition for abnormalities. By pulling together these multiple data streams, this project aims to establish a baseline understanding of the variability in stress and reproductive hormone levels, body condition, and skin condition for the population. Because our study period spans multiple years, we also have the ability to look at temporal patterns and individual changes over time. From our preliminary results, we have evidence for multiple pregnant females from elevated pregnancy and stress hormones, as well as apparent pregnancy from the body condition analysis. Additionally, a large proportion of the population appear to be affected by blistering and cookie cutter shark bites.

Figure 2. An example aerial drone image of a blue whale that will be used to asses body condition, i.e. how healthy or malnourished the whale is. (Drone piloted by Todd Chandler).
Figure 3. Images of blue whale skin condition, affected by A) blistering and B) cookie cutter shark bites.

Comparing body shape and morphology between species

The GEMM Lab uses UAS to quantitatively study behavior[5] and health of large whales. From various projects in different parts of the world we have now assimilated UAS data on blue, gray, and humpback whales. We will measure these images to investigate differences in body shape and morphology among these species. We plan to explore how form follows function across baleen whales, based on their different  life histories, foraging strategies, and ecological roles.

Figure 4 . Aerial images of A) a blue whale in New Zealand’s South Taranaki Bight, B) a gray whale off the coast of Oregon, and C) a humpback whale off the coast of Washington. Drone piloted by Todd Chandler (A and B) and Jason Miranda (C). 

So it goes—my dissertation will contain a series of chapters that build on one another to explore blue whale distribution patterns at increasing scales, as well as a growing number of appendices for these “side projects”. Explorations and collaborations like I’ve described here allow me to broaden my perspectives and diversify my analytical skills, as well as work with many excellent teams of scientists. The more data we collect, the more questions we are able to ask. The more questions we ask, the more we seem to uncover that is yet to be understood. So stay tuned for some exciting forthcoming results from all of these analyses, as well as plenty of new questions, waiting to be posed.

References

  1. Barlow DR et al. 2018 Documentation of a New Zealand blue whale population based on multiple lines of evidence. Endanger. Species Res. 36, 27–40. (doi:https://doi.org/10.3354/esr00891)
  2. Hazen EL, Friedlaender AS, Goldbogen JA. 2015 Blue whales (Balaenoptera musculus) optimize foraging efficiency by balancing oxygen use and energy gain as a function of prey density. Sci. Adv. 1, e1500469–e1500469. (doi:10.1126/sciadv.1500469)
  3. Goldbogen JA, Calambokidis J, Oleson E, Potvin J, Pyenson ND, Schorr G, Shadwick RE. 2011 Mechanics, hydrodynamics and energetics of blue whale lunge feeding: efficiency dependence on krill density. J. Exp. Biol. 214, 131–146. (doi:10.1242/jeb.048157)
  4. Burnett JD, Lemos L, Barlow DR, Wing MG, Chandler TE, Torres LG. 2018 Estimating morphometric attributes on baleen whales using small UAS photogrammetry: A case study with blue and gray whales. Mar. Mammal Sci. (doi:10.1111/mms.12527)
  5. Torres LG, Nieukirk SL, Lemos L, Chandler TE. 2018 Drone Up! Quantifying Whale Behavior From a New Perspective Improves Observational Capacity. Front. Mar. Sci. 5. (doi:10.3389/fmars.2018.00319)

Midway Atoll: the next two weeks at the largest albatross colony in the world (two years later)

By Rachael Orben, Assistant Professor (Senior Research), Seabird Oceanography Lab

This February I had the opportunity to spend two weeks at Midway Atoll National Wildlife Refuge in the Papahānaumokuākea Marine National Monument. I was there to GPS track black-footed and Laysan albatross during their short chick-brooding foraging trips. Two weeks is just enough time since the albatross are taking short trips (3-5 days) to feed their rapidly growing chicks.

My first visit to Midway (2016 blog post) occurred right as the black-footed albatross chicks were hatching (quickly followed by the Laysan albatross chicks). This time, we arrived almost exactly when I had left off. The oldest chicks were just about two weeks old. This shift in phenology meant that, though subtle, each day offered new insights for me as I watched chicks transform into large aware and semi-mobile birds. By the time we left, unattended chicks were rapidly multiplying as the adults shifted to the chick-rearing stage. During chick rearing, both parents leave the chick unattended and take longer foraging trips.

Our research goal was to collect tracking data from both species that can be used to address a couple of research questions. First of all, winds can aid, or hinder albatross foraging and flight efficiency (particularly during the short brooding trips). In the North Pacific, the strength and direction of the winds are influenced by the ENSO (El Niño Southern Oscillation) cycles. The day after we left Midway, NOAA issued an El Niño advisory indicating weak El Nino conditions. We know from previous work at Tern Island (farther east and farther south at 23.87 N, -166.28 W) that El Niño improves foraging for Laysan albatrosses during chick brooding, while during La Niña reproductive success is lower (Thorne et al., 2016). However, since Midway is farther north, and farther west the scenario might be different there. Multiple years of GPS tracking data are needed to address this question and we hope to return to collect more data next year (especially if  La Niña follows the El Niño as is often the case).

We will also overlap the tracking data with fishing boat locations from the Global Fishing Watch database to assess the potential for birds from Midway to interact with high seas fisheries during this time of year (project description, associated blog post). Finally, many of the tags we deployed incorporated a barometric pressure sensor and the data can be used to estimate flight heights relative to environmental conditions such as wind strength. This type of data is key to assessing the impact of offshore wind energy (Kelsey et al., 2018).

How to track an albatross

To track an albatross we use small GPS tags that we tape to the back feathers. After the bird returns from a foraging trip, we remove the tape from the feathers and take the datalogger off. Then we recharge the battery and download the data!

This research is a collaboration between Lesley Thorne (Stony Brook University), Scott Shaffer (San Jose State University), myself (Oregon State University), and Melinda Conners (Washington State University). The field effort was generously supported by the Laurie Landeau Foundation via the Minghua Zhang Early Career Faculty Innovation Fund at Stoney Brook University to Lesley Thorne.

My previous visit to Midway occurred just after house mice were discovered attacking incubating adult albatrosses. Since then, a lot of thought and effort had gone into developing a plan to eradicate mice from Midway. You can find out more via Island Conservation’s Midway blogs and the USFWS.
References

Kelsey, E. C., Felis, J. J., Czapanskiy, M., Pereksta, D. M., & Adams, J. (2018). Collision and displacement vulnerability to offshore wind energy infrastructure among marine birds of the Pacific Outer Continental Shelf. Journal of Environmental Management, 227, 229–247. http://doi.org/10.1016/j.jenvman.2018.08.051

Thorne, L. H., Conners, M. G., Hazen, E. L., Bograd, S. J., Antolos, M., Costa, D. P., & Shaffer, S. A. (2016). Effects of El Niño-driven changes in wind patterns on North Pacific albatrosses. Journal of the Royal Society Interface, 13(119), 20160196. http://doi.org/10.1098/rsif.2016.0196

More than just whales: The importance of studying an ecosystem


By Dawn Barlow, PhD student, OSU Department of Fisheries and Wildlife, Geospatial Ecology of Marine Megafauna Lab

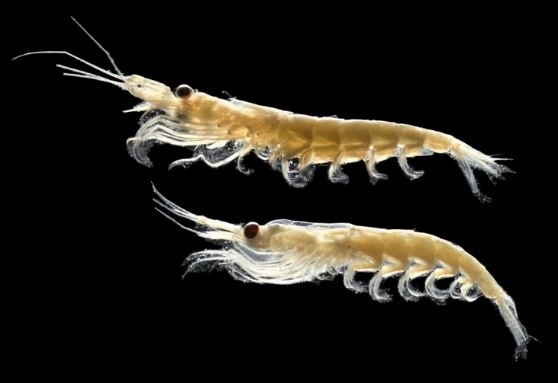
I have the privilege of studying the largest animals on the planet: blue whales (Balaenoptera musculus). However, in order to understand the ecology, distribution, and habitat use patterns of these ocean giants, I have dedicated the past several months to studying something much smaller: krill (Nyctiphanes australis). New Zealand’s South Taranaki Bight region (“STB”, Figure 1) is an important foraging ground for a unique population of blue whales [1,2]. A wind-driven upwelling system off of Kahurangi Point (the “X” in Figure 1) generates productivity in the region [3], leading to an abundance of krill [4], the desired blue whale prey [5].

Our blue whale research team collected a multitude of datastreams in three different years, including hydroacoustic data to map krill distribution throughout our study region. The summers of 2014 and 2017 were characterized by what could be considered “typical” conditions: A plume of cold, upwelled water curving its way around Cape Farewell (marked with the star in Figure 1) and entering the South Taranaki Bight, spurring a cascade of productivity in the region. The 2016 season, however, was different. The surface water temperatures were hot, and the whales were not where we expected to find them.

Figure 2. Sea surface temperature maps of the South Taranaki Bight region in each of our three study years. The white circles indicate where most blue whale sightings were made in each year. Note the very warm temperatures in 2016, and more westerly location of blue whale sightings.

What happened to the blue whales’ food source under these different conditions in 2016? Before I share some preliminary findings from my recent analyses, it is important to note that there are many possible ways to measure krill availability. For example, the number of krill aggregations, as well as how deep, thick, and dense those aggregations are in an area will all factor into how “desirable” krill patches are to a blue whale. While there may not be “more” or “less” krill from one year to the next, it may be more or less accessible to a blue whale due to energetic costs of capturing it. Here is a taste of what I’ve found so far:

In 2016, when surface waters were warm, the krill aggregations were significantly deeper than in the “typical” years (ANOVA, F=7.94, p <0.001):

Figute 3. Boxplots comparing the median krill aggregation depth in each of our three survey years.

The number of aggregations was not significantly different between years, but as you can see in the plot below (Figure 4) the krill were distributed differently in space:

Figure 4. Map of the South Taranaki Bight region with the number of aggregations per 4 km^2, standardized by vessel survey effort. The darker colors represent areas with a higher density of krill aggregations. 

While the bulk of the krill aggregations were located north of Cape Farewell under typical conditions (2014 and 2017), in the warm year (2016) the krill were not in this area. Rather, the area with the most aggregations was offshore, in the western portion of our study region. Now, take a look at the same figure, overlaid with our blue whale sighting locations:

Figure 5. Map of standardized number of krill aggregations, overlaid with blue whale sighting locations in red stars.

Where did we find the whales? In each year, most whale encounters were in the locations where the most krill aggregations were found! Not only that, but in 2016 the whales responded to the difference in krill distribution by shifting their distribution patterns so that they were virtually absent north of Cape Farewell, where most sightings were made in the typical years.

The above figures demonstrate the importance of studying an ecosystem. We could puzzle and speculate over why the blue whales were further west in the warm year, but the story that is emerging in the krill data may be a key link in our understanding of how the ecosystem responds to warm conditions. While the focus of my dissertation research is blue whales, they do not live in isolation. It is through understanding the ecosystem-scale story that we can better understand blue whale ecology in the STB. As I continue modeling the relationships between oceanography, krill, and blue whales in warm and typical years, we are beginning to scratch the surface of how blue whales may be responding to their environment.

  1. Torres LG. 2013 Evidence for an unrecognised blue whale foraging ground in New Zealand. New Zeal. J. Mar. Freshw. Res. 47, 235–248. (doi:10.1080/00288330.2013.773919)
  2. Barlow DR et al. 2018 Documentation of a New Zealand blue whale population based on multiple lines of evidence. Endanger. Species Res. 36, 27–40. (doi:https://doi.org/10.3354/esr00891)
  3. Shirtcliffe TGL, Moore MI, Cole AG, Viner AB, Baldwin R, Chapman B. 1990 Dynamics of the Cape Farewell upwelling plume, New Zealand. New Zeal. J. Mar. Freshw. Res. 24, 555–568. (doi:10.1080/00288330.1990.9516446)
  4. Bradford-Grieve JM, Murdoch RC, Chapman BE. 1993 Composition of macrozooplankton assemblages associated with the formation and decay of pulses within an upwelling plume in greater cook strait, New Zealand. New Zeal. J. Mar. Freshw. Res. 27, 1–22. (doi:10.1080/00288330.1993.9516541)
  5. Gill P. 2002 A blue whale (Balaenoptera musculus) feeding ground in a southern Australian coastal upwelling zone. J. Cetacean Res. Manag. 4, 179–184.

Understanding sea otter effects through complexity

By Dominique Kone, Masters Student in Marine Resource Management

Species reintroductions are a management strategy to augment the reestablishment or recovery of a locally-extinct or extirpated species into once native habitat. The potential for reestablishment success often depends on the species’ ecological characteristics, habitat requirements, and relationship and effects to other species in the environment[1]. While the science behind species reintroductions is continuously evolving and improving, reintroductions are still inherently risky and uncertain in nature. Therefore, every effort should be made to fully assess ecological factors before a reintroduction takes place. As Oregon considers a potential sea otter reintroduction, understanding these ecological factors is an important piece of my own graduate research.

Sea otters are oftentimes referred to as keystone species because they can have wide-reaching effects on the community structure and function of nearshore marine environments. Furthermore, relative to other marine mammals or top predators, several papers have documented these effects – partially due to the ease in observing their foraging and social behaviors, which typically take place close to shore. In many of these studies, a classic paradigm repeatedly appears: when sea otters are present, prey densities (e.g., sea urchins) are significantly reduced, while macroalgae (e.g., kelp, seagrass) densities are high.

Source: Belleza.

While this paradigm is widely-accepted amongst researchers, a few key studies have also demonstrated that the effects of sea otters may be more variable than we once thought. The paradigm does not necessarily hold true everywhere sea otters exist, or at least not to the same degree. For example, after observing benthic communities along islands with varying sea otter densities in the Aleutian archipelago, Alaska, researchers found that islands with abundant otter populations consistently supported low sea urchin densities and high, yet variable, kelp densities. In contrast, islands without otters consistently had low kelp densities and high, yet variable, urchin densities[2]. This study demonstrates that while the classic paradigm generally held true, the degree to which the ecosystem belonged to one of two dominant states (sea otters, low urchins, and high kelp or no sea otters, high urchins, and low kelp) was less obvious.

This example demonstrates the danger in applying this one-size-fits-all paradigm to sea otter effects. Hence, we want to achieve a better understanding of potential sea otter effects so that managers may anticipate how Oregon’s nearshore environments may be affected if sea otters were to be reintroduced. Yet, how can we accurately anticipate these effects given these potential variations and deviations from the paradigm? Interestingly, if we look to other fields outside ecology, we find a possible solution and tool for tackling these uncertainties: a systematic review of available literature.

Two ecosystem states as predicted by the classic paradigm (left: kelp-dominated; right: urchin-dominated). Source: SeaOtters.com.

For decades, medical researchers have been conducting systematic reviews to assess the efficacy of treatments and drugs by combining several studies to find common findings[3]. These findings can then be used to determine any potential variation between studies (i.e. instances where the results may conflict or differ from one another) and even test the influence and importance of key factors that may be driving that variation[4]. While systematic reviews are quite popular within the medical research field, they have not been applied regularly in ecology, but recognition of their application to ecological questions is growing[5]. In our case of achieving a better understanding of the drivers of ecological impacts of sea otter, a systematic literature review is an ideal tool to assess variable effects. This review will be the focus of my second thesis chapter.

In conducting my review, there will be three distinct phases: (1) review design and study collection, (2) meta-analysis, and (3) factor testing. In the first phase (review design and study collection), I will search the existing literature to collect studies that explicitly compare the availability of key ecosystem components (i.e. prey species, non-prey species, and macroalgae species) when sea otters are absent and present in the environment. By only including studies that make this comparison, I will define effects as the proportional change in each species’ or organism group’s availability (e.g. abundance, biomass, density, etc.) with and without sea otters. In determining these effects, it’s important to recognize that sea otters alter ecosystems via both direct and indirect pathways. Direct effects can be thought of as any change to prey availability via sea otter predation directly, while indirect effects can be thought of an any alteration to the broader ecosystem (i.e. non-prey species, macroalgae, habitat features) as an indirect result from sea otter predation on prey species. I will record both types of effects.

General schematic of a meta-analysis in a systematic review. A meta-analysis is the process of taking multiple datasets (i.e. Data 1, Data 2 etc.) from literature sources, calculating summary statistics or effects (i.e. Summary 1, Summary 2, etc.) for each dataset, running statistical procedures (e.g. SMA = sequential meta-analysis) to relate summary effects and investigate between study variation, and identifying important features driving variation. Source: MediCeption.

In phase two, I will use meta-analytical procedures (i.e. statistical analyses specific to systematic reviews) to calculate one standardized metric to represent sea otter effects. These effects will be calculated and averaged across all collected studies. As previously discussed, there may be key factors – such as sea otter density – that influence these effects. Therefore, in phase three (factor testing), effects will also be calculated separately for each a priori factor to test their influence on the effects. Such factors may include habitat type (i.e. hard or soft sediment), prey species (i.e. sea urchins, crabs, clams, etc.), otter density, depth, or time after otter recolonization.

In statistical terms, the goal of testing factors is to see if the variation between studies is impacted by calculating sea otter effects separately for each factor versus across all studies. In other words, if we find high variation in effects between studies, there may be important factors driving that variation. Therefore, in systematic reviews, we recalculate effects separately for each factor to try to explain that variation. If, however, after testing these factors, variation remains high, there may be other factors that we didn’t test that could be driving that remaining variation. Yet, without a priori knowledge on what those factors could be, such variation should be reported as a major source of uncertainty.

Source: Giancarlo Thomae.

Predicting or anticipating the effects of reintroduced species is no easy feat. In instances where the ecological role of a species is well known – and there is adequate data – researchers can develop and use ecosystem models to predict with some certainty what these effects may be. Yet, in other cases where the species’ role is less studied, has less data, or is more variable, researchers must look to other tools – such as systematic reviews – to gain a better understanding of these potential effects. In this case, a systematic review on sea otter effects may prove particularly useful in helping managers understand what types of ecological effects of sea otters in Oregon are most likely, what the important factors are, and, after such review, what we still don’t know about these effects.

References:

[1] Seddon, P. J., Armstrong, D. P., and R. F. Maloney. 2007. Developing the science of reintroduction biology. Conservation Biology. 21(2): 303-312.

[2] Estes, J. A., Tinker, M. T., and J. L. Bodkin. 2009. Using ecological function to develop recovery criteria for depleted species: sea otters and kelp forests in the Aleutian Archipelago. Conservation Biology. 24(3): 852-860.

[3] Sutton, A. J., and J. P. T. Higgins. 2008. Recent developments in meta-analysis. Statistics in Medicine. 27: 625-650.

[4] Arnqvist, G., and D. Wooster. 1995. Meta-analysis: synthesizing research findings in ecology and evolution. TREE. 10(6): 236-240.

[5] Vetter, D., Rucker, G., and I. Storch. 2013. Meta-analysis: a need for well-defined usage in ecology and conservation biology. Ecosphere. 4(6): 1-13.

Plastics truly are ubiquitous in the marine environment

By Lisa Hildebrand, MSc student, OSU Department of Fisheries and Wildlife, Geospatial Ecology of Marine Megafauna Lab

As I enter my second term at OSU as a Master’s student, the ideas and structure of my thesis are slowly coming together. As of right now, my plan is to have two data chapters: The first chapter will assess the quality of zooplankton prey gray whales have access to along the Oregon coast, by looking at energetic value and microplastic content. I will contemplate about how my results potentially affect gray whale health. The second chapter will investigate fine-scale foraging and space use of gray whales in the Port Orford area to determine whether individual specialisation exists.

Fig 1. What it feels like when you start a literature review. Source: Harvard Blogs.

When I first started digging into the scientific literature to prepare for writing my thesis proposal (which is still underway but I’m getting close to the end of a first draft…), one sentence that I seemed to stumble across more often than not was “Marine plastics are ubiquitous” or “Plastics have become ubiquitous in the marine environment” or some other, very similar, iteration of that statement (e.g. Machovsky-Capuska et al. 2019; Eriksen et al. 2014; Fendall & Sewell 2009).

Many of the papers I first read were review papers on microplastics that mostly discussed general concepts like dispersal mechanisms, trophic transfer, or how microplastics become degraded. While I often think of review papers as treasure chests, since they neatly and succinctly summarise an often complicated and busy area of research into just a few pages, sometimes the fine-scale detail can go missing. Therefore, when reading these review papers, I wasn’t learning the in depth details about specific studies where microplastics had been detected in a group of individuals, population or species. So I felt the statement “Plastics are ubiquitous” was just a good (and pretty dramatic) opening line for a paper. However, once I delved into the studies on single species, I was overwhelmed by the amount of results that GoogleScholar spit out at me. If you type “microplastics marine” into the search bar, you’ll get about 7,650 results. This amount might not sound like a lot, especially if you compare it to say “gray whale”, which generates 96,600 results. Yet, the microplastic extraction method typically used was only developed in 2004 (Thompson et al. 2004). Hence, in a span of just 15 years, over 7,000 studies have detected microplastics in over 660 marine organisms (Secretariat of the Convention on Biological Diversity 2012) – a fact I find extremely troubling.

Fig 2. Graphic explaining how plastics don’t go away. Source: Biotecnika.

Microplastics are most commonly viewed as particles <5 mm in size (though there is some contention on this size classification, e.g. Claessens et al. 2013). Microplastics arise from several sources, including fragmentation of larger plastics by UV photo-degradation, wave action and physical abrasion, loss of pre-production pellets (nurdles) and polystyrene beads from shipping vessels, waste water discharge containing microbeads used in cosmetics and microfibers released during the washing of textiles and run-off from land (Nelms et al. 2018). Their small size makes these persistent particles bioavailable to ingestion by a variety of marine taxa, ranging from small prey organisms such as zooplankton, to large megafauna such as whales.

Zooplankton are at the base of marine food webs and are therefore consumed in large quantities by a large number of consumers. The propensity of zooplankton to feed in surface waters makes them highly susceptible to encountering and ingesting microplastics as this is where these synthetic particles are highly abundant (Botterell et al. 2018). Microplastics have been detected in zooplankton from the Northeast Pacific Ocean (Desforges et al. 2015), northern South China Sea (Sun et al. 2017), and Portuguese coast (Frias et al. 2014). Additionally, there is documented overlap between microplastic and zooplankton occurrence at many more locations (e.g. North Western Mediterranean Sea, Collignon et al. 2012; Baltic Sea, Gorokhova 2015; Arctic Ocean, Lusher et al. 2015a). As microplastics research is still in its relative infancy, the extent to which microplastics are ingested by zooplankton and the consequences of this behaviour are uncertain. Nevertheless, exposure to microplastics could lead to entanglement of particles within feeding appendages and/or block internal organs, which may result in reduced feeding, poor overall health, injury and death (Desforges et al. 2015). Though a lab study has found that microplastics are expelled by zooplankton after ingestion, the gut-retention times varied between species, and there is the potential risk of exposure to toxins that leech off of particles while in the body (Cole et al. 2013; the below video is from the afore-mentioned study showing how plankton eat plastics, which are illuminated in fluorescent green).

The large knowledge gap regarding the health implications indicates a strong need for more laboratory studies that investigate the long-term effects of persistent exposure to microplastics on lower trophic organisms, as well as continued short-term experiments that examine whether different zooplankton species are affected differently, since morphologies and life-histories vary widely.

Let’s take a step back and re-focus our lens onto a marine taxa that is much, much bigger in size than a zooplankton: cetaceans. Plastic debris has been documented in the stomachs of stranded individuals of several cetacean species (See Baulch & Perry 2014 for a review), however findings of microplastics in cetaceans are less common. Since cetaceans consume large amounts of prey a day, up to several tons daily for some baleen whales, the likelihood that they are ingesting microplastics through their prey is relatively high (Nelms et al. 2018). Therefore the low number of reported cases is again likely due to the relative novelty of microplastic detection methods. Despite the paucity of studies, microplastics have been found in a True’s beaked whale (Mesoplodon mirus, Lusher et al. 2015b), a humpback whale (Megaptera novaeangliae, Besseling et al. 2015) and an Indo-Pacific humpback dolphin (Sousa chinensis, Zhu et al. 2018), showing that microplastic ingestion by cetaceans does occur. Whether these individuals actively (i.e. active feeding) or passively (i.e. uptake through prey consumption) consumed the microplastics, or inhaled them at the water-air interface, is unknown. As with zooplankton, the short- and long-term impacts of ingesting microplastics by marine mammals is also unknown, though impacts on survival, feeding and uptake of toxins are all possibilities.

Fig 3. Example of a light trap sample collected off the Newport coast. Source: L. Torres.

The data collection and analysis I am doing for my thesis will hopefully fill small pockets in these large knowledge gaps. I hope to be able to quantify the extent of microplastic pollution among zooplankton species in nearshore Oregon waters. By comparing samples from several years, months and locations, I will determine whether microplastic loads vary spatially and temporally. Since their abundance and presence have been described as being patchy due to the influence of oceanographic and weather conditions (GESAMP 2016), it would seem reasonable to assume that there will be variation. But, results are a ways away as we have not even started our microplastic extraction techniques, which involves digesting samples in potassium hydroxide solution, incubating them at 50ºC for 48-72 hours, sorting through the dissolved material to identify potential plastics and sending them away for analysis. We first have to work our way through jars upon jars of unopened zooplankton light trap samplesthat need to be sorted by species. I am thankfully joined by undergraduate Robyn Norman who has already assisted this project immensely over the last two years with her zooplankton sorting prowess. So in case anyone wants to come looking for us over the next few weeks, you’ll find both Robyn and me sitting in front of a laminar flow hood in the lab of ecotoxicologist Dr. Susanne Brander, with whom we are collaborating on the microplastics portion of my thesis.


References

Baulch, S., & Perry, C., Evaluating the impacts of marine debris on cetaceans. Marine Pollution Bulletin, 2014. 80(1-2): 210-221.

Besseling, E., et al., Microplastic in a macro filter feeder: humpback whale Megaptera novaeangliae. Marine Pollution Bulletin, 2015. 95: 248-252.

Botterell, Z.L.R., et al., Bioavailability and effects of microplastics on marine zooplankton: a review. Environmental Pollution, 2018. 245: 98-110.

Claessens, M., et al., New techniques for the detection of microplastics in sediments and field collected organisms. Marine Pollution Bulletin, 2013. 70(1-2): 227-233.

Cole, M., et al., Microplastic ingestion by zooplankton. Environmental Science & Technology, 2013. 47(12): 6646-6655.

Collignon, A., et al., Neustonic microplastic and zooplankton in the North Western Mediterranean Sea. Marine Pollution Bulletin, 2012. 64(4): 861-864.

Desforges, JP.W., et al., Ingestion of microplastics by zooplankton in the Northeast Pacific Ocean. Archives of Environmental Contamination and Toxicology, 2015. 69(3): 320-330.

Eriksen, M., et al., Plastic pollution in the world’s oceans: more than 5 trillion plastic pieces weighing over 250,000 tons afloat at sea. PLoS ONE, 2014. doi.org/10.1371/journal.pone.0111913.

Fendall, L.S., & Sewell, M.A., Contributing to marine pollution by washing your face: microplastics in facial cleansers. Marine Pollution Bulletin, 2009. 58(8): 1225-1228.

Frias, J.P.G.L., et al., Evidence of microplastics in samples of zooplankton from Portuguese coastal waters. Marine Environmental Research, 2014. 95: 89-95.

GESAMP, Sources, fates and effects of microplastics in the marine environment: part 2 of a global assessment. Second United Nations Environment Assembly, 2016. http://www.gesamp.org/site/assets/files/1720/rs93e.pdf

Gorokhova, E., Screening for microplastic particles in plankton samples: how to integrate marine litter assessment into existing monitoring programs? Marine Pollution Bulletin, 2015. 99(1-2): 271-275.

Lusher, A.L., et al., Microplastics in Arctic polar waters: the first reported values of particles in surface and sub-surface samples. Scientific Reports, 2015a. 5: 14947.

Lusher, A.L., et al., Microplastic and macroplastic ingestion by a deep diving, oceanic cetacean: the True’s beaked whales Mesoplodon mirus. Environmental Pollution, 2015b. 199: 185-191.

Machovsky-Capuska, G.E., et al., A nutritional perspective on plastic ingestion in wildlife. Science of the Total Environment, 2019. 656: 789-796.

Nelms, S.E., et al., Investigating microplastic trophic transfer in marine top predators. Environmental Pollution, 2018. 238: 999-1007.

Secretariat of the Convention on Biological Diversity and the Scientific and Technical Advisory Panel – GEF (2012), Impacts of marine debris on biodiversity: current status and potential solutions. Montreal, Technical Series. 67: 1-61.

Sun, X., et al., Ingestion of microplastics by natural zooplankton groups in the northern South China Sea. Marine Pollution Bulletin, 2017. 115(1-2): 217-224.

Thompson, R.C., et al., Lost at sea: where is all the plastic? Science, 2004. 304(5672): 838.

Zhu, J., et al., Cetaceans and microplastics: First report of microplastic ingestion by a coastal delphinid, Sousa chinensis. Science of the Total Environment, 2018. 659: 649-654.

Science (or the lack thereof) in the Midst of a Government Shutdown

By Alexa Kownacki, Ph.D. Student, OSU Department of Fisheries and Wildlife, Geospatial Ecology of Marine Megafauna Lab

In what is the longest government shutdown in the history of the United States, many people are impacted. Speaking from a scientist’s point of view, I acknowledge the scientific community is one of many groups that is being majorly obstructed. Here at the GEMM Laboratory, all of us are feeling the frustrations of the federal government grinding to a halt in different ways. Although our research spans great distances—from Dawn’s work on New Zealand blue whales that utilizes environmental data managed by our federal government, to new projects that cannot get federal permit approvals to state data collection, to many of Leigh’s projects on the Oregon coast of the USA that are funded and collaborate with federal agencies—we all recognize that our science is affected by the shutdown. My research on common bottlenose dolphins is no exception; my academic funding is through the US Department of Defense, my collaborators are NOAA employees who contribute NOAA data; I use publicly-available data for additional variables that are government-maintained; and I am part of a federally-funded public university. Ironically, my previous blog post about the intersection of science and politics seems to have become even more relevant in the past few weeks.

Many graduate students like me are feeling the crunch as federal agencies close their doors and operations. Most people have seen the headlines that allude to such funding-related issues. However, it’s important to understand what the funding in question is actually doing. Whether we see it or not, the daily operations of the United States Federal government helps science progress on a multitude of levels.

Federal research in the United States is critical. Most governmental branches support research with the most well-known agencies for doing so being the National Science Foundation (NSF), the US Department of Agriculture (USDA), the National Oceanic and Atmospheric Administration (NOAA), and the National Aeronautics and Space Administration. There are 137 executive agencies in the USA (cei.org). On a finer scale, NSF alone receives approximately 40,000 scientific proposals each year (nsf.gov).

If I play a word association game and I am given the word “science”, my response would be “data”. Data—even absence data—informs science. The largest aggregate of metadata with open resources lives in the centralized website, data.gov, which is maintained by the federal government and is no longer accessible and directs you to this message:Here are a few more examples of science that has stopped in its track from lesser-known research entities operated by the federal government:

Currently, the National Weather Service (NWS) is unable to maintain or improve its advanced weather models. Therefore, in addition to those of us who include weather or climate aspects into our research, forecasters are having less and less information on which to base their weather predictions. Prior to the shutdown, scientists were changing the data format of the Global Forecast System (GFS)—the most advanced mathematical, computer-based weather modeling prediction system in the USA. Unfortunately, the GFS currently does not recognize much of the input data it is receiving. A model is only as good as its input data (as I am sure Dawn can tell you), and currently that means the GFS is very limited. Many NWS models are upgraded January-June to prepare for storm season later in the year. Therefore, there are long-term ramifications for the lack of weather research advancement in terms of global health and safety. (https://www.washingtonpost.com/weather/2019/01/07/national-weather-service-is-open-your-forecast-is-worse-because-shutdown/?noredirect=on&utm_term=.5d4c4c3c1f59)

An example of one output from the GFS model. (Source: weather.gov)

The Food and Drug Administration (FDA)—a federal agency of the Department of Health and Human Services—that is responsible for food safety, has reduced inspections. Because domestic meat and poultry are at the highest risk of contamination, their inspections continue, but by staff who are going without pay, according to the agency’s commissioner, Dr. Scott Gottlieb. Produce, dry foods, and other lower-risk consumables are being minimally-inspected, if at all.  Active research projects investigating food-borne illness that receive federal funding are at a standstill.  Is your stomach doing flips yet? (https://www.nytimes.com/2019/01/09/health/shutdown-fda-food-inspections.html?rref=collection%2Ftimestopic%2FFood%20and%20Drug%20Administration&action=click&contentCollection=timestopics&region=stream&module=stream_unit&version=latest&contentPlacement=2&pgtype=collection)

An FDA field inspector examines imported gingko nuts–a process that is likely not happening during the shutdown. (Source: FDA.gov)

The National Parks Service (NPS) recently made headlines with the post-shutdown acts of vandalism in the iconic Joshua Tree National Park. What you might not know is that the shutdown has also stopped a 40-year study that monitors how streams are recovering from acid rain. Scientists are barred from entering the park and conducting sampling efforts in remote streams of Shenandoah National Park, Virginia. (http://www.sciencemag.org/news/2019/01/us-government-shutdown-starts-take-bite-out-science)

A map of the sampling sites that have been monitored since the 1980s for the Shenandoah Watershed Study and Virginia Trout Stream Sensitivity Study that cannot be accessed because of the shutdown. (Source: swas.evsc.virginia.edu)

NASA’s Stratospheric Observatory for Infrared Astronomy (SOFIA), better known as the “flying telescope” has halted operations, which will require over a week to bring back online upon funding restoration. SOFIA usually soars into the stratosphere as a tool to study the solar system and collect data that ground-based telescopes cannot. (http://theconversation.com/science-gets-shut-down-right-along-with-the-federal-government-109690)

NASA’s Stratospheric Observatory for Infrared Astronomy (SOFIA) flies over the snowy Sierra Nevada mountains while the telescope gathers information. (Source: NASA/ Jim Ross).

It is important to remember that science happens outside of laboratories and field sites; it happens at meetings and conferences where collaborations with other great minds brainstorm and discover the best solutions to challenging questions. The shutdown has stopped most federal travel. The annual American Meteorological Society Meeting and American Astronomical Society meeting were two of the scientific conferences in the USA that attract federal employees and took place during the shutdown. Conferences like these are crucial opportunities with lasting impacts on science. Think of all the impressive science that could have sparked at those meetings. Instead, many sessions were cancelled, and most major agencies had zero representation (https://spacenews.com/ams-2019-overview/). Topics like lidar data applications—which are used in geospatial research, such as what the GEMM Laboratory uses in some its projects, could not be discussed. The cascade effects of the shutdown prove that science is interconnected and without advancement, everyone’s research suffers.

It should be noted, that early-career scientists are thought to be the most negatively impacted by this shutdown because of financial instability and job security—as well as casting a dark cloud on their futures in science: largely unknown if they can support themselves, their families, and their research. (https://eos.org/articles/federal-government-shutdown-stings-scientists-and-science). Graduate students, young professors, and new professionals are all in feeling the pressure. Our lives are based on our research. When the funds that cover our basic research requirements and human needs do not come through as promised, we naturally become stressed.

An adult and a juvenile common bottlenose dolphin, forage along the San Diego coastline in November 2018. (Source: Alexa Kownacki)

So, yes, funding—or the lack thereof—is hurting many of us. Federally-funded individuals are selling possessions to pay for rent, research projects are at a standstill, and people are at greater health and safety risks. But, also, science, with the hope for bettering the world and answering questions and using higher thinking, is going backwards. Every day without progress puts us two days behind. At first glance, you may not think that my research on bottlenose dolphins is imperative to you or that the implications of the shutdown on this project are important. But, consider this: my study aims to quantify contaminants in common bottlenose dolphins that either live in nearshore or offshore waters. Furthermore, I study the short-term and long-term impacts of contaminants and other health markers on dolphin hormone levels. The nearshore common bottlenose dolphin stocks inhabit the highly-populated coastlines that many of us utilize for fishing and recreation. Dolphins are mammals, that respond to stress and environmental hazards, in similar ways to humans. So, those blubber hormone levels and contamination results, might be more connected to your health and livelihood than at first glance. The fact that I cannot download data from ERDDAP, reach my collaborators, or even access my data (that starts in the early 1980s), does impact you. Nearly everyone’s research is connected to each other’s at some level, and that, in turn has lasting impacts on all people—scientists or not. As the shutdown persists, I continue to question how to work through these research hurdles. If anything, it has been a learning experience that I hope will end soon for many reasons—one being: for science.

Who Am I? Exploring the theory of individualisation among marine mammals

By Lisa Hildebrand, MSc student, OSU Department of Fisheries and Wildlife, Geospatial Ecology of Marine Megafauna Lab

“Just be yourself!” is a phrase that everyone has probably heard at least once in their lives. The idea of being an individual who is distinctly different from other individuals is a concept that is focal to the society we live in today. While historically it may have been frowned upon to be the “black sheep in the crowd”, nowadays that seems to be the goal.

Source: Go Comics.

This quest for uniqueness has resulted in different styles of fashion, speech, profession, interest in art, music, literature, automobile types – the list is endless. The American Psychological Association defines personality as the “individual differences in characteristic patterns of thinking, feeling and behaving”1. So, all of the choices we make on a daily basis shape our behaviour, and our behaviour in turn shapes our personality.

Since personality is something that is so engrained within human society, it isn’t surprising that ecologists have explored this concept among non-humans. Decades of research have resulted in an abundance of literature detailing personality in many different taxa and species, ranging from chimpanzees to mice to ants2. Naturally, the definition of personality for animals differs from that for humans since the assessment of animal thoughts and feelings is still somewhat of a locked box to us. Nevertheless, the behavioural aspect of the two definitions remains consistent whereby animal personality is broadly defined as “consistent variation in behavioural traits between individuals”3.

Although I am an early career marine mammal ecologist finding my footing in this rapidly expanding field, I have a keen interest in teasing apart possible cases of individual specialisation within marine mammal populations. So, before getting straight into the nitty gritty of individual specialisation, it is important for me to take a small step back and consider the concept of specialisation as applied to small subgroups or populations of marine mammals.

Specialisations are mostly related to foraging or feeding behaviour whereby a subgroup of individuals will develop a novel method to locate and capture prey. These behaviours have been reported for several marine mammal species, and are strongly coupled to intra and inter-specific competition with other predators for prey and habitat characteristics. Furthermore, it is posited that factors such as resource benefits (e.g. energy content of prey), prey escape rates, and handling times can be minimised if specialisation for a particular prey type or habitat occurs4.

In Florida Bay, Torres & Readdocumented two distinct foraging strategies employed by two bottlenose dolphin ecotypes. One dolphin ecotype was found to forage using deep diving with erratic surfacings, whereas the second ecotype chose to forage through mud ring feeding and were mostly seen in shallow habitats. The latter ecotype is in fact so adapted to shallow depths that dolphins were typically observed foraging in waters <2 m deep. In this example, the foraging tactics of the two ecotypes are strongly driven by habitat conditions, specifically depth. The video below is aerial footage of bottlenose dolphins performing mud ring feeding.

Such group specialisations have been identified not only in several other bottlenose dolphin populations around the world6,7, but also in other cetacean species, including killer whales (distinct differences in target prey between transients and residents8), Guiana dolphins (mud-plume feeding9), humpback dolphins (strand feeding10), and several others. Noticeable here is that these records concern Odontocete species, which is not surprising since these toothed whales are vastly different to baleen whales in that they often live in structured groups with bonds between individuals sometimes lasting for decades11. Long-term relationships are conducive to developing specialised group hunting strategies as individuals will spend considerable time with one another and the success of obtaining prey depends on the cooperation and coordination of the group.

For baleen whales and other marine mammals, such as pinnipeds, where life history and social organisation is more geared toward a solitary life, examples of group specialisations are relatively rare (with the exception of the well-documented bubble-net feeding exhibited by humpback whales12). While group specialisation may not be as prevalent in Mysticetes, the same problems of inter and intra-specific competition persists among these more solitary species too, which would suggest that individuals should develop their own unique foraging tactics and preferences. Evidence for individualisation is hard to obtain since it requires repeated observations of the same individuals over time with good knowledge of the prey type being consumed and/or the habitat being used to forage in.

Nevertheless, examples do exist. Perhaps the most well-documented case of individualisation within a population for marine mammals is of the sea otter. Estes et al. (2003) describe 10 female sea otters in Monterey Bay that had high inter-individual variation in diet, which they investigated over a scale of 8 years13. Most females specialised on 1-4 types of prey, with marked differences between the diets chosen by each female, despite habitat overlap. This individualisation of diet was not attributable to variation in prey availability; hence, authors concluded that this extreme specialisation occurred to reduce intra-population competition for prey.

Ecologists have historically (and probably still to this day) disagreed on whether individualisation actually matters in the grand scheme of things. There are generally three schools of thought on the matter: (1) individual specialisation is rare and/or weakly influences population dynamics and so is not very important; (2) while individual specialisation does occur and may in fact be commonplace, it does not affect ecological processes at the large population scale; and (3) individual specialisation is widespread and can significantly impact population dynamics and/or ecosystem function.

As you might have guessed by this point, I find myself in the third school of thought. There are many arguments supporting this theory, and what I believe to be very good arguments against statements 1 and 2. While I have only provided one specific named example for individual specialisation in a marine mammal, there are several documented cases of such occurrences among other marine taxa (e.g., pinnipeds14, sharks15, fish16) and a much larger number of studies for terrestrial species4. Thus, the claim that it is rare or weak, seems implausible to me.

Statement 2 is a little more complicated to tackle as it involves understanding how actions on a relatively small scale affect a whole population or even an ecosystem. For instance, consider two female sea otters living in a small coastal area where one sea otter prefers to eat turban snails and the other exclusively feeds on abalone. The sudden decline in abundance of either of these prey could lead to serious health and reproductive issues for those females. Should the low prey abundance persist, then poor health and reproduction of several females in a population that specialise on that prey item can rapidly lead to genetic loss and an overall population decline. Particularly if an individual’s or species’ home range is rather restricted or small. In the case of the sea otter, which are often touted as a keystone species due to its presence preventing sea urchin barren formation that is known to wreak havoc on kelp forests, knock-on effects of such a population decline could result in poor overall ecosystem health.

It may be easy to assume that one individual dolphin, otter, seal or whale cannot possibly make a difference to a whole population or ecosystem. This assumption strikes me as a little odd since humans are always told to ‘be the change they wish to see in the world’ and that ‘every person can make a difference’. Why then should these sentiments not be applicable to non-humans? While a gray whale may not hold a sign at a protest or run for president (actions commonly considered to cause change in the human world), perhaps the choice that a gray whale makes every day to only consume one species of zooplankton, can influence other gray whales in the area, predators from other taxa, habitat structure, other prey availability, and/or cause trophic cascades.

Through my research, I aim to elucidate whether the gray whales display some level of foraging individualisation while feeding in Port Orford, Oregon. I will use data from four years to compare tracks of individual whales with zooplankton samples collected in the area to correlate each individual’s movement patterns with prey availability. I will assess the quality of prey through bomb calorimetry and microplastic analysis of the zooplankton samples to determine energetic content and pollutant levels, respectively. This prey assessment will describe the potential effects of prey specialization on whales, which is fundamental to assessing overall population health. Individualisation can strongly affect fitness of individuals, either positively or negatively depending on several factors, which will undoubtedly have an impact at the population level.

(The videos below are examples of two different tactics we see the gray whales display while foraging along the Oregon coast in the summer months. The first video shows a whale foraging among kelp with some very acrobatic moves, while the second is of a whale employing the ‘sharking’ method where the whale is feeding benthically in such shallow depths that both the pectoral fin and the fluke stick out of the water, making the whale look like a ‘shark’.)

References

  1. American Psychological Association, Personality. Retrieved from: https://www.apa.org/topics/personality/.
  2. Carere C., & Locurto, C., Interaction between animal personality and animal cognition. Current Zoology, 2015. 57(4): 491-498.
  3. Gosling, S.D., From mice to men: what can we learn about personality from animal research?Psychological Bulletin, 2001. 127(1): 45-86.
  4. Bolnick, D.I., et al., The ecology of individuals: incidence and implications of individual specialisation. The American Naturalist, 2003. 161(1): 1-28.
  5. Torres, L.G., & Read, A. J., Where to catch a fish? The influence of foraging tactics on the ecology of bottlenose dolphins (Tursiops truncatus) in Florida Bay, Florida. Marine Mammal Science, 2009. 25(4): 797-815.
  6. Gisburne, T.J., & Connor, R.C., Group size and feeding success in strand-feeding bottlenose dolphins (Tursiops truncatus) in Bull Creek, South Carolina. Marine Mammal Science, 2015. 31(3): 1252-1257.
  7. Gazda, S.K., et al., A division of labour with role specialization in group-hunting bottlenose dolphins (Tursiops truncatus) off Cedar Keys, Florida.Proceedings of the Royal Society: Biological Sciences, 2005. 272(1559): 135-140.
  8. Ford, J.K.B., et al., Dietary specialization in two sympatric populations of killer whales (Orcinus orca) in coastal British Columbia and adjacent waters. Canadian Journal of Zoology, 1998. 76(8): 1456-1471.
  9. Rossi-Santos, M.R., & Wedekin, L.L., Evidence of bottom contact behaviour by estuarine dolphins (Sotalia guianensis) on the Eastern Coast of Brazil.Aquatic Mammals, 2006. 32(2): 140-144.
  10. Peddemors, V.M., & Thompson, G., Beaching behaviour during shallow water feeding by humpback dolphins (Sousa plumbea). Aquatic Mammals, 1994. 20(2): 65-67.
  11. Tyack, P., Population biology, social behavior and communication in whales and dolphins. Trends in Ecology & Evolution, 1986. 1(6): 144-150.
  12. Wiley, D., et al., Underwater components of humpback whale bubble-net feeding behaviour.Behaviour, 2011. 148(5/6): 575-602.
  13. Estes, J.A., et al., Individual variation in prey selection by sea otters: patterns, causes and implications. Journal of Animal Ecology, 2003. 72(1): 144-155.
  14. Cherel, Y., et al., Stable isotopes document seasonal changes in trophic niches and winter foraging individual specialization in diving predators from the Southern Ocean. Journal of Animal Ecology, 2007. 76(4): 826-836.
  15. Matich, P., et al., Contrasting patterns of individual specialization and trophic coupling in two marine apex predators. Journal of Animal Ecology, 2010. 80(1): 294-305.
  16. Svanbäck, R., & Persson, L., Individual diet specialization, niche width and population dynamics: implications for trophic polymorphisms. Journal of Animal Ecology, 2004. 73(5): 973-982.

Hundreds and hundreds and hundreds of models: An ecologist’s love for programming

By Dawn Barlow, PhD student, Department of Fisheries & Wildlife, Geospatial Ecology of Marine Megafauna Lab

When people hear that I study blue whales, they often ask me questions about what it’s like to be close to the largest animal on the planet, where we do fieldwork, and what data we are interested in collecting. While I love time at sea, my view on a daily basis is rarely like this:

Our small research vessel at sunset in New Zealand’s South Taranaki Bight at the end of a day of blue whale survey. Photo by D. Barlow.

More often than not, it looks something like this:

In my application letter to Dr. Leigh Torres, I wrote something along the lines of “while I relish remote fieldwork, I also find great satisfaction in the analysis process.” This statement is increasingly true for me as I grow more proficient in statistical modeling and computer programming. When excitedly telling my family about how I am trying to model relationships between oceanography, krill, whales, and satellite imagery, I was asked what I meant by “model”. Put simply, a model is a formula or equation that we can use to describe a pattern. I have been told, “all models are wrong, but some models work.” What does this mean? While we may never know exactly every pattern of whale feeding behavior, we can use the data we have to describe some of the important relationships. If our model performance is very good, then we have likely described most of what drives the patterns we see. If model performance is poor, then there is more to the pattern that we have not yet captured in either our data collection or in our analytical methods. Another common saying about models is, “A model is only ever as good as the data you put into it.” While we worked hard during field seasons to collect a myriad of data about what could be influencing blue whale distribution patterns, we inevitably could not capture everything, nor do we know everything that should be measured.

So, how do you go about finding the ‘best’ model? This question is what I’ve been grappling with over the last several weeks. My goal is to describe the patterns in the krill that drive patterns in whale distribution, the patterns in oceanography that drive patterns in the krill, and the patterns in the oceanography that drive patterns in whale distribution. The thing is, we have many metrics to describe oceanographic patterns (surface temperature, mixed layer depth, strength of the thermocline, integral of fluorescence, to name just a few), as well as several metrics to describe the krill (number of aggregations, aggregation density, depth, and thickness). When I multiplied out how many possible combinations of predictor variables and parameters we’re interested in modeling, I realized this meant running nearly 300 models in order to settle on the best ten. This is where programming comes in, I told myself, and caught my breath.

I’ve always loved languages. When I was much younger, I thought I might want to study linguistics. As a graduate student in wildlife science, the language I’ve spent the most time learning, and come to love, is the statistical programming language R. Just like any other language, R has syntax and structure. Like any other language, there are many ways in which to articulate something, to make a particular point or reach a particular end goal. Well-written code is sometimes described as “elegant”, much like a well-articulated piece of writing. While I certainly do not consider myself “fluent” in R, it is a language I love learning. I like to think that the R scripts I write are an attempt to eloquently uncover and describe ecological patterns.

Rather than running 300 models one by one, I wrote an R script to run many models at a time, and then sort the outputs by model performance. I may look at the five best models of 32 options in order to select one. But this is where Leigh reminds me to step back from the programming for a minute and put my ecologist hat back on. Insight on the part of the modeler is needed in order to discern between what are real ecological relationships and what are spurious correlations in the data. It may not be quite as simple as choosing the model with the highest explanatory power when my goal is to make ecological inferences.

So, where does this leave me? Hundreds of models later, I am still not entirely sure which ones are best, although I’ve narrowed it down considerably. My programming proficiency and confidence continue to grow, but that only goes so far in ecology. Knowledge of my study system is equally important. So my workflow lately goes something like this: write code, try to interpret model outputs, consider what I know about the oceanography of my study region, re-write code, re-interpret the revised results, and so on. Hopefully this iterative process is bringing us gradually closer to an understanding of the ecology of blue whales on a foraging ground… stay tuned.

A blue whale lunges on an aggregation of krill in New Zealand’s South Taranaki Bight. Drone piloted by Todd Chandler.

Oregon Sea Otter Status of Knowledge Symposium

By Dominique Kone, Masters Student in Marine Resource Management

Over the past year, the GEMM Lab has been investigating the ecological factors associated with a potential sea otter reintroduction to Oregon. A potential reintroduction is not only of great interest to our lab, but also to several other researchers, managers, tribes, and organizations in the state. With growing interest, this idea is really starting to gain momentum. However, the best path forward to making this idea a reality is somewhat unknown, and will no doubt take a lot of time and effort from multiple groups.

In an effort to catalyze this process, the Elakha Alliance – led by Bob Bailey – organized the Oregon Sea Otter Status of Knowledge Symposium earlier this month in Newport, OR. The purpose of this symposium was to share information, research, and lessons learned about sea otters in other regions. Speakers – primarily scientists, managers, and graduate students – flew in from all over the U.S. and the Canadian west coast to share their expertise and discuss various factors that must be considered before any reintroduction efforts begin. Here, I review some of the key takeaways from those discussions.

Source: The Elakha Alliance

To start the meeting, Dr. Anne Salomon – an associate professor from Simon Fraser University – and Kii’iljuus Barbara Wilson – a Haida Elder – gave an overview of the role of sea otters in nearshore ecosystems and their significance to First Nations in British Columbia. Hearing these perspectives not only demonstrated the various ecological effects – both direct and indirect – of sea otters, but it also illustrated their cultural connection to indigenous people and the role tribes can play (and currently do play in British Columbia) in co-managing sea otters. In Oregon, we need to be aware of all the possible effects sea otters may have on our ecosystems and acknowledge the opportunity we have to restore these cultural connections to Oregon’s indigenous people, such as the Confederated Tribes of Siletz Indians.

Source: The Elakha Alliance and the Confederated Tribes of Siletz Indians.

The symposium also involved several talks on the recovery of sea otter populations in other regions, as well as current limitations to their population growth. Dr. Lilian Carswell and Dr. Deanna Lynch – sea otter and marine conservation coordinators with the U.S. Fish & Wildlife Service – and Dr. Jim Bodkin – a sea otter ecologist – provided these perspectives. Interestingly, not all stocks are recovering at the same rate and each population faces slightly different threats. In California, otter recovery is slowed by lack of available food and mortality due to investigative shark bites, which prevents range expansion. In other regions, such as Washington, the population appears to be growing rapidly and lack of prey and shark bite-related mortality appear to be less important. However, this population does suffer from parasitic-related mortality. The major takeaway from these recovery talks is that threats can be localized and site-specific. In considering a reintroduction to Oregon, it may be prudent to investigate if any of these threats and population growth limitations exist along our coastline as they could decrease the potential for sea otters to reestablish.

Source: The Seattle Aquarium and U.S. Fish & Wildlife Service.

Dr. Shawn Larson – a geneticist and ecologist from the Seattle Aquarium – gave a great overview of the genetic research that has been conducted for historical (pre-fur trade) Oregon sea otter populations. She explained that historical Oregon populations were genetically-similar to both southern and northern populations, but there appeared to be a “genetic gradient” where sea otters near the northern Oregon coast were more similar to northern populations – ranging to Alaska – and otters from the southern Oregon coast were more similar to southern populations – ranging to California. Given this historic genetic gradient, reintroducing a mixture of sea otters – subsets from contemporary northern and southern stocks – should be considered in a future Oregon reintroduction effort. Source-mixing could increase genetic diversity and may more-closely resemble genetic diversity levels found in the original Oregon population.

At the end of the meeting, an expert panel – including Dr. Larson, Dr. Bodkins, Dr. Lynch, and Dr. Carswell – provided their recommendations on ways to better inform this process. To keep this brief, I’ll discuss the top three recommendations I found most intriguing and important.

  1. Gain a better understanding of sea otter social behavior. Sea otters have strong social bonds, and previous reintroductions have failed because relocated individuals returned to their capture sites to rejoin their source populations. While this site fidelity behavior is relatively understood, we know less about the driving mechanisms – such as age or sex – of those behaviors. Having a sound understanding of these behaviors and their mechanisms could help to identify those which may hinder reestablishment following a reintroduction.
  2. When anticipating the impacts of sea otters on ecosystems, investigate the benefits too. When we think of impacts, we typically think of costs. However, there are documented benefits of sea otters, such as increasing species diversity (Estes & Duggins 1995, Lee et al. 2016). Identifying these benefits – as well as to people – would more completely demonstrate their importance.
  3. Investigate the human social factors and culture in Oregon relative to sea otters, such as perceptions of marine predators. Having a clear understanding of people’s attitudes toward marine predators – particularly marine mammals – could help managers better anticipate and mitigate potential conflicts and foster co-existence between otters and people.
Source: Paul Malcolm

While much of the symposium was focused on learning from experts in other regions, I would be remiss if I didn’t recognize the great talks given by a few researchers in Oregon – including Sara Hamilton (OSU doctoral student), Dr. Roberta Hall (OSU emeritus professor), Hannah Wellman (University of Oregon doctoral student), and myself. Individually, we spoke about the work that has already been done and is currently being done on this issue – including understanding bull kelp ecology, studying sea otter archaeological artifacts, and a synthesis of the first Oregon translocation attempt. Collectively, our talks provided some important context for everyone else in the room and demonstrated that we are working to make this process as informed as possible for managers. Oregon has yet to determine if they will move forward with a sea otter reintroduction and what that path forward will look like. However, given this early interest – as demonstrated by the symposium – we, as researchers, have a great opportunity to help guide this process and provide informative science.

References:

Estes, J. A. and D. O. Duggins. 1995. Sea otters and kelp forests in Alaska: generality and variation in a community ecological paradigm. Ecological Monographs. 65: 75-100.

Lee, L. C., Watson, J. C., Trebilco, R., and A. K. Salomon. 2016. Indirect effects and prey behavior mediate interactions between an endangered prey and recovering predator. Ecosphere. 7(12).

The Beauty of Scientific Conferences

By Lisa Hildebrand, MSc student, OSU Department of Fisheries and Wildlife, Geospatial Ecology of Marine Megafauna Lab

Science is truly meaningful because it is shared amongst colleagues and propagated to the wider public. There are many mediums through which information dissemination can occur. A common and most rigorous form is the peer-review scientific publication of papers. The paper approval process is vigorous, can last a long time – sometimes on the scale of several years – and is therefore an excellent way of vetting science that is occurring all over the world in many different disciplines. New studies build upon the results and downfalls of others, and therefore the process of research and communication of knowledge is continuous.

However, scientific journals and the publications within them can be quite exclusive; they are often only accessible to certain members of the scientific community or of an educational institution. For a budding scientist who is not affiliated with an institution, it can be very hard to get your hands on current research. Having said that, this issue is slowly becoming inconsequential since open access and free journals, such as PeerJ, are becoming more prevalent.

How some students feel after reading scientific publications. Source: Know Your Meme.

Something that is perhaps more restrictive is the amount of topic-specific jargon used in publications. While a certain degree of jargon is to be expected, it can sometimes overwhelm a reader to the point where the main findings of the research become lost. This typically tends to be the case for those just at the beginning of their scientific journeys, however I have also known professors to comment on confusing sections of publications due to the heavy use of specific jargon.

Conferences on the other hand offer an opportunity to disseminate meaningful science in a more open and (sometimes) more laid-back setting (this may not always be true depending on the field of science and the calibre of the conference). Researchers of a particular field congregate for a few days to learn about current research efforts, ponder potential collaborations, peruse posters of new studies, and argue over which soccer team is going to win the next World Cup. That is the beauty of conferences – it is very possible to get to know each other on a personal level. These face-to-face opportunities are especially beneficial to students as this relaxed atmosphere lends itself to asking questions and engaging with scientists that are leaders in their fields.

Logo for the Marine Technology Summit. Source: MTS.

Just over a week ago, the GEMM Lab had the opportunity to do all of the above-mentioned things. PI Dr Leigh Torres and I participated in the Marine Technology Summit (MTS) in Newport, OR, a “mini-conference” at which shiny, new technologies for use in marine applications were introduced by leading, and many local, tech companies. While Leigh and I are not technologists, we are ecologists that have greatly benefitted from recent, rapid advances in technology. Both of our gray whale (Eschrichtius robustus) research projects use different technologies to unveil hitherto unknown ecological aspects of these marine mammals.

Leigh presented her research that involves flying drones over gray whales that grace the Oregon coastal waters in the spring and summer. Through these flights, many previously undocumented gray whale behaviours have been captured and quantified1, such as headstands, nursing and jaw snapping (check out the video below). Furthermore, still images from the videos have been used to perform photogrammetry to assess health and body condition of the whales2. These drone flights have added a wealth of valuable data to the life histories of individual whales that previously were assessed mainly through photo-identification and genetics. This still fairly new approach to assess health by using drones can be relatively cost-effective, which has always been one of Leigh’s key aims throughout her research so that methods are accessible to many scientists. These productive drones used by the GEMM Lab are commercially available (yup, just like the ones you see on the shelves at your local Best Buy!).

The use of cost-effective technologies is a common theme in the GEMM Lab and is also central to my research. The estimation of zooplankton density is vital to my project to determine whether gray whales in Port Orford select areas of high prey density over areas with less dense prey. However, the traditional technology used to quantify prey densities in the water column are often bulky or expensive. Instead, we developed a relatively cheap method of measuring relative zooplankton density using a GoPro camera that we reel down through the water column from a downrigger attached to our research kayak. While we are unable to exactly quantify the mass of zooplankton in the water column, we have been successful in assessing changes in relative prey density by scoring screenshots of the footage.

Screenshot of a GoPro video from this summer’s field season in Port Orford, OR revealing a thick layer of zooplankton. Source: GEMM Lab.

While our drones and GoPro technology is not without error, technology rarely is. In truth, we lost our GoPro for several days after it became stuck in a rock crevice and Leigh’s team regrettably lost a drone to the depths of the ocean this summer. This technology reality was part of the reason I presented at the MTS as I wanted to involve technologists to find solutions to some of the problems I have experienced. Needless to say, I got a lot of excellent input from many different people, for which I am very grateful. In addition to developing new opportunities to collaborate, I was very content to sit in the audience and hear about the ground-breaking new marine technologies that are in development. Below are short descriptions of two new technologies I learned about that are revolutionising the marine world.

ASV Unmanned Marine Systems develop autonomous surface vehicles that are powered by renewable energies (solar panels and wind turbines). These vessels are particularly useful for oceanographic monitoring as they are more capable than weather buoys and much more cost effective than manned weather ships or research vessels. Additionally, they can be used for a lot of different marine science applications including active acoustic fisheries monitoring, water quality monitoring, and cetacean tracking. Some models even have integrated drones that are launched and retrieved autonomously.

The Ocean Cleanup is a company that develops technologies to clean garbage out of our oceans. There is presently a large mission underway by The Ocean Cleanup to combat the Great Pacific Garbage Patch (GPGP). The GPGP is essentially a large island in the middle of the North Pacific Ocean comprised of diverse plastic particles – wrappers, polystyrene, fishing line, plastic bags, the list is endless3. A recent study estimates the amount of plastic in the GPGP to be at least 79 thousand tonnes of ocean plastic4. Unfortunately, the GPGP is not the only one of its kind. The Ocean Cleanup hopes to reduce this massive plastic accumulation with the development of a system made up of a 600-m long floater that sits on the ocean’s surface with a 3-m deep skirt attached below it. The skirt will collect debris while the float will prevent plastic from flowing over it, as well as keep the whole system afloat. The system arrived at the GPGP last Wednesday and the team of over 80 engineers, researchers, scientists and computational modellers have successfully installed the system. The team posts frequent updates on their Twitter and I would highly recommend you follow this possibly revolutionary technology.

While attending the MTS, it felt like there are no bounds for the types of marine technology that will be developed in the future. I am excited to see what ecologists working with technicians can develop to keep applying technology to address challenging questions and conservation issues.


References

  1. Torres, L., et al., Drone up! Quantifying whale behaviour from a new perspective improves observational capacity.Frontiers in Marine Science, 2018. 5, DOI:10.3389/fmars.2018.00319.
  2. Burnett, J.D., et al., Estimating morphometric attributes on baleen whales using small UAS photogrammetry: A case study with blue and gray whales, 2018.Marine Mammal Science. DOI:10.1111/mms.12527.
  3. Kaiser, J., The dirt on the ocean garbage patches. Science, 2018. 328(5985): p. 1506.
  4. Lebreton, L., et al., Evidence that the Great Pacific Garbage Patch is rapidly accumulating plastic. Scientific Reports, 2018. 8(4666).